U.S. Water Demand, Supply and Allocation: Trends …. Water Demand, Supply and Allocation: Trends...
90
U.S. Water Demand, Supply and Allocation: Trends and Outlook 2007-R-3 22 December 2006
Transcript of U.S. Water Demand, Supply and Allocation: Trends …. Water Demand, Supply and Allocation: Trends...
U.S. Water Demand, Supply and Allocation: Trends and Outlook 2007-R-3
22 December 2006
Water is an essential resource in the U.S. economy. It plays a crucial role in supporting many economic activities and ensuring the quality of human life and the health of ecological systems. Despite this, the value of water may not be widely appreciated because only some water resources and water uses are easily visible or noticed while others are not.
Among the Institute for Water Resources (IWR) Future Directions program activities are the identification of emerging water challenges and opportunities and the tactical engagement of U.S. Army Corps of Engineers (USACE) senior leaders on these issues. Such critical thinking is an essential prerequisite to strategy development and planning.
IWR has developed this series of Water Resources Outlook papers, commissioned utilizing outside experts, to identify emerging issues and implications for the Nation. These issues and implications will be presented in the form of “provocation sessions” with external and internal subject matter experts and stakeholders and will inform the USACE strategic planning process.
U.S. Water Demand, Supply and Allocation: Trends and Outlook
Given the overall importance of water, the long-term adequacy of water supply is a major national concern. This first in a series of Water Resources Outlook papers reviews future trends and uncertainties affecting water resources in the United States over the next 30 years. It discusses their impacts and implications for water demand, supply and allocation in specific geographic regions of the country. The implications include considerations on how the U.S. Federal government, states and localities might address the impacts of those trends.
The review described in this paper, while not being a part of a congressional inquiry, has been initiated by IWR to support iterative strategic planning activities of the USACE Civil Works, including the development of strategic goals, objectives and strategies.

U.S. Water Demand, Supply and Allocation: Trends and Outlook 2007-R-3
22 December 2008
Benedykt Dziegielewski, Ph.D. Southern Illinois University-Carbondale Jack C. Kiefer, Ph.D. CDM

2007-R-3 iii Institute for Water Resources
Contents
Figures..................................................................................................................................v
Tables................................................................................................................................ vii
Executive Summary ........................................................................................................... ix ES.1 Purpose............................................................................................................................................ ix ES.2 Available Water Resources ............................................................................................................. ix ES.3 Major Trends and Uncertainties ...................................................................................................... ix ES.4 Implications for Water Management.................................................................................................x ES.5 Roles of Governments ..................................................................................................................... xi ES.6 Conclusion...................................................................................................................................... xii
Section 1 Introduction..........................................................................................................1
Section 2 Background..........................................................................................................3 2.1 Water Availability and Use ...............................................................................................................3 2.2 Water Infrastructure ..........................................................................................................................6 2.3 Water Management ...........................................................................................................................7 2.4 Water Supply Hot Spots ....................................................................................................................8
2.4.1 Southern Nevada Water Authority.............................................................................................10 2.4.2 Tampa Bay Water ......................................................................................................................11
2.5 Summary of Baseline Conditions....................................................................................................12 Section 3 Trends and Uncertainties ...................................................................................13
3.1 Major Trends and Uncertainties ......................................................................................................13 3.1.1 Population and Economic Growth .............................................................................................13 3.1.2 Recognition and Demand for Ecosystem Services.....................................................................18 3.1.3 Global Climate Change..............................................................................................................19 3.1.4 Water for Energy Production .....................................................................................................21 3.1.5 Aging Water Supply Infrastructure............................................................................................23 3.1.6 Summary of Major Trends.........................................................................................................24
3.2 Other Trends and Uncertainties.......................................................................................................25 3.2.1 Technological Advancements and Breakthroughs .....................................................................25 3.2.2 Unquantified Indian Water Rights .............................................................................................26 3.2.3 Development and Funding for New Water Storage and Transmission ......................................26 3.2.4 International Trade and Demands for Virtual Water..................................................................26
3.3 Summary of Trends and Uncertainties ............................................................................................27 Section 4 Ongoing Responses and Implications................................................................29
4.1 New Water Supply Options.............................................................................................................29 4.1.1 Water Desalination.....................................................................................................................29 4.1.2 Desalination of Brackish Groundwater ......................................................................................30 4.1.3 Groundwater Recharge and Recovery .......................................................................................31 4.1.4 Water Reclamation.....................................................................................................................32
4.2 Impacts on Water Management Techniques ...................................................................................33 4.2.1 Shift From Structural to Nonstructural Solutions ......................................................................33 4.2.2 Improvements in Water Efficiency and Reallocation ................................................................34 4.2.3 Evolving Western Water Markets and Water Banks..................................................................34 4.2.4 New Approaches to Water Governance .....................................................................................35
4.3 Implications for Future Approaches................................................................................................36 4.3.1 Slow vs. Dramatic Changes .......................................................................................................36 4.3.2 Robust and Flexible Water Management Approach ..................................................................37

Contents
Institute for Water Resources iv 2007-R-3
Section 5 Future Roles and Responsibilities......................................................................39 5.1 Current Roles...................................................................................................................................39 5.2 State and Local Roles ......................................................................................................................39
5.2.1 Local Roles in Water Supply .....................................................................................................39 5.2.2 State Roles .................................................................................................................................40 5.2.3 The Role of Federal-State Partnerships......................................................................................41
5.3 Federal Involvement in Water Management ...................................................................................41 5.4 Implications for U.S. Army Corps of Engineers Civil Works.........................................................42
5.4.1 Existing Authorities and Policy .................................................................................................42 5.4.2 Evolving and Future Possibilities ..............................................................................................43
5.4.2.1 Provide Guidance on Water Supply to Those Requesting Permits Under Section 404 ....43 5.4.2.2 Examine Water Reallocation at Corps Reservoirs Holistically and Regionally................44 5.4.2.3 Refine Guidance to Restore Wetlands Environments to Increase Both Water Supply
and Water Quality .............................................................................................................44 5.4.2.4 Focus on Planning Assistance to States for Complex Regional Water Resources Issues
and Use Shared Vision Planning.......................................................................................45 5.4.3 Future Roles for the Corps .........................................................................................................45
Section 6 Conclusions........................................................................................................47
Bibliography ......................................................................................................................49
Appendix A Future Scenarios......................................................................................... A-1 A.1 Scenario A: Muddling Through and Survival .............................................................................. A-1 A.2 Scenario B: Resignation and Avoidance ...................................................................................... A-2 A.3 Scenario C: Steady-State With Fortunate Outcomes.................................................................... A-3 A.4 Scenario D: Reformed Water Management.................................................................................. A-3
Appendix B Annotated Bibliography ..............................................................................B-1 Reference 1..............................................................................................................................................B-2 Reference 2..............................................................................................................................................B-3 Reference 3..............................................................................................................................................B-4 Reference 4..............................................................................................................................................B-5 Reference 5..............................................................................................................................................B-6 Reference 6..............................................................................................................................................B-7 Reference 7..............................................................................................................................................B-8 Reference 8..............................................................................................................................................B-9
2007-R-3 v Institute for Water Resources
Figures Figure 1 Renewable Water Supply and Consumptive Use in the U.S............................................ 6
Figure 2 Water Hotspots in Western U.S............................................................................................ 9
Figure 3 Significant Water Supply Issues in the Lower 48 States ................................................. 10
Figure 4 Clark County, Nevada, Population Growth 1990-2004................................................... 11
Figure 5 U.S. Census Population Projections and Shifts – 2000-2030 ........................................... 15
Figure 6 Historical and Projected Withdrawals: 1950 – 2040......................................................... 17
Figure 7 Percentage Change From the 1961-90 Baseline in the April 1 Snowpack in Four Areas of the Western U.S. as simulated for the 21st Century by the Canadian and Hadley Models...................................................................................................................... 20
Figure 8 Recent Prices for Crude Oil per Barrel .............................................................................. 23
Figure 9 Desalination Capacity in the U.S........................................................................................ 30
Figure 10 General Location and Extent of Saline Groundwater Resources in the U.S. ............... 31
Figure 11 Artificial Aquifer Storage and Recovery by State ............................................................ 32
Figure 12 Reclaimed Water Use in the U.S......................................................................................... 33

Figures
Institute for Water Resources vi 2007-R-3
2007-R-3 vii Institute for Water Resources
Tables Table 1 Major Fluxes and Stores of Water in the U.S. ..................................................................... 3
Table 2 Example of Water Budgets for the U.S. ............................................................................... 4
Table 3 Regional Differences in Water Availability and Uses in the U.S. .................................... 5
Table 4 Large Reservoirs in the U.S. .................................................................................................. 7
Table 5 Trends and Uncertainties to Affect Water Supply and Demand................................... 13
Table 6 Updated Population Projections and Distribution .......................................................... 16
Table 7 Comparison of 1995 Withdrawals and 2040 Predictions ................................................ 16
Table 8 Regional Population Projections and Distribution in the U.S. ....................................... 17
Table 9 Factors Expected to Affect Future Water Supply............................................................. 27
Table 10 Water Banking Activity in the Western U.S. .................................................................... 35

Tables
Institute for Water Resources viii 2007-R-3

2007-R-3 ix Institute for Water Resources
Executive Summary ES.1 Purpose The intent of the paper is to review and analyze information about future trends and uncertainties affecting water resources in the United States and to discuss their impacts and implications for water demand, supply and allocation in specific geographic regions of the country. The implications include considerations on how the U.S. Federal government, states and localities might address the impacts of those trends. The paper also discusses implications for the mission and/or roles of the U.S. Army Corps of Engineers (Corps).
ES.2 Available Water Resources The country has abundant water resources which include approximately 68,000 [maf] million acre feet (or 20,000 cubic miles) of freshwater in storage and about 4,800 maf (or 400 cubic miles) of annually renewable streamflow. About 380 maf (113 cubic miles) of water is withdrawn annually to support industrial, agricultural and domestic uses. However, water resources and water uses are not distributed evenly across the country and their availability also varies by season. There are more than a dozen “hot spot” areas in the U.S. where a combination of water scarcity, competition among water users and population growth are likely to lead to problems in balancing demand and supply.
The uneven availability of water is partially mitigated by some 860 maf (255 cubic miles) of water stored behind more than 8,000 major dams, which provide supply of water for regions with water deficits and during periods when natural flow would be insufficient to satisfy demands. The process of managing water resources in the U.S. is complex and operates without a coordinated and guiding national water policy. Water management decisions are carried out by Federal, state, regional and local organizations with the help of various policies and laws that are not well coordinated. While this arrangement appears to work, its ability to deal effectively with future challenges is uncertain.
ES.3 Major Trends and Uncertainties There are five major trends that will affect the water supply and demand situation during the next 30 years. They include: (1) population growth and geographical redistribution and concomitant economic growth, (2) increasing demand for ecosystem services, (3) global warming and climate change, (4) water for energy production and (5) aging water supply infrastructure. Two of the five trends, namely climate change and water allocation for ecosystems, are likely to have significant impact on future water availability. Some decline in future water supplies or the reliability of water service provision may result because of insufficient public (and/or private) funding of rehabilitation and enhancements of the existing water storage and conveyance infrastructure. Two of the remaining trends, namely population and economic growth and shifts in energy sources, do not appear likely to result in large demand increases that would greatly change the future balance of supply and demand. More specifically the expected outcomes of the trends are:

Executive Summary
Institute for Water Resources x 2007-R-3
1. Future growth in water demands for off-stream purposes by municipal, industrial and agricultural uses will be significantly slower than growth in U.S. population. Large increases in water withdrawals nationwide are still possible in case of unexpected demands for irrigation or energy production.
2. Future energy policy choices between the continuing use of fossil fuels and a shift toward domestic production of biofuels are not likely to have a large effect on future water withdrawals. Large scale production of biofuels could be planned with efficient use of land and water resources and new capacity for coal-electric generation could have modest water requirements if closed-loop cooling technology is used.
3. Impacts of global warming and expected change in climate during the next 30 years depend on the occurrence of climatic extremes, especially severe droughts; these trends would have the greatest impact on water demand, supply and resource competition.
There are also some uncertainties which have the potential for affecting the future water supply and demand situation. These uncertainties are related to: (1) technological advancements and breakthroughs, (2) unquantified Indian water right claims, (3) development of new water supply and transmission infrastructure and (4) international trade and demands for “virtual” water.
These trends and uncertainties represent the main future drivers of change and provide some insights into how the future situation may unfold. Some of the ongoing developments in water management approaches represent early manifestations of the expected future changes in the water supply situation. These developments include new options for additional water supplies such as (1) increasing investment in water desalination capacity, including desalination of brackish groundwater in the U.S. interior, (2) groundwater recharge and recovery and (3) reclamation of wastewater and impaired water. These ongoing developments also include changes in water management approaches such as (1) a shift in emphasis from structural to nonstructural solutions, (2) improvements in water efficiency and conservation, (3) evolving western water markets and water banks and (4) emerging new approaches in water governance.
ES.4 Implications for Water Management Future challenges in balancing water demands and supplies could be more manageable with a robust and flexible water management system. Such a system should have resiliency to withstand the impacts of climate change and increased competition for water supplies and would also be able to balance future demands with available supplies in a way that minimizes the total social costs of the necessary adjustments or interventions. Some examples of things that could be done in order to enhance the nation’s ability to withstand future problems in water demand, supply and allocation include:

Executive Summary
2007-R-3 xi Institute for Water Resources
1. Facilitating voluntary reallocation of significant amounts of water from agriculture to urban, industrial and in-stream uses through enabling Federal and state legislation, which would permit both temporary transfers (or leases) of water and sales of water rights in all regions of the country.
2. Streamlining processes for reallocation of water storage in the existing surface water reservoirs from flood control and other purposes to water supply while providing alternative means for flood management.
3. Collaborative planning for regional water supply solutions (including options for water demand management) by Federal and state agencies in intrastate and interstate regions that experience imbalances of water demand and supply.
4. Development of surface water storage and groundwater reserves (through artificial groundwater recharge) in mountainous regions of the country to capture winter precipitation and early spring snowmelt in order to increase the current water storage reserves for multi-year droughts.
5. Significant investment in the rehabilitation and some new development of water supply and conveyance infrastructure, especially in regions which are most vulnerable to adverse impacts of climate change.
6. Development of supplemental desalination capacity of brackish groundwater to provide additional water supply for municipal, industrial and irrigation purposes in both eastern and western regions of the country.
These potential enhancements to the nation’s current system of water management do not exhaust all the possibilities. Other options are available and yet others could emerge in the future. In addition to the implementation of these solutions there is also a need to redefine the roles of Federal, state and local governments.
ES.5 Roles of Governments The provision of water supplies is primarily a local responsibility. Regional water agencies and state governments also play important roles in ensuring that localities have adequate water supplies. There are also Federal-state partnerships which are formed to address difficult problems in water supply at the state level. At the national level, the Federal government has had a prominent role in water resources development, management and protection.
At the local level, water utilities (both municipally- and privately-owned) play a key role in supporting public health and economic activity by providing water delivery infrastructure, securing water supplies, and treating and distributing water to end users. No change in this fundamental mission is foreseen in the future and local water providers will continue to be “first responders” in dealing with water supply and demand imbalances. Nongovernmental organizations (NGOs) also play an important role in the provision of local water supplies in the rural areas of the U.S. and in protection of water quality through environmental protection initiatives.
Executive Summary
Institute for Water Resources xii 2007-R-3
The Federal role in water supply has evolved from one of a direct investor in reclaiming western lands and developing sources of water supply to a manager and maintainer of existing facilities and, finally, regulator of the broader environmental landscape. Almost any new water storage facility or conveyance structure developed by a local government will require a Clean Water Act permit from the Corps. The Corps is allowed to permit only the “least environmentally damaging practicable alternative,” a designation that can be challenged by environmental groups and citizens during the Corps public interest review process. This makes the Corps a pivotal player in many, if not most, water supply expansion projects in the United States. The review of the trends and uncertainties seem to imply that Federal involvement in water management is not going to diminish during the next three decades. It is possible that Federal involvement will increase if the anticipated water resources challenges gradually overwhelm the capacity of most local regions and state governments to deal with them.
The Corps, because of its regulatory function and the amount of water that is currently stored in its reservoirs, will likely remain an important Federal institution in the provision and management of U.S. water resources. The question, or key uncertainty, is the degree or intensity of involvement in the area of water supply. The future role of the Corps in water supply will necessarily depend on making full use of current policies, becoming more nimble in responding to regional water supply issues and reevaluating its interest and role in water supply development. It is likely that changes to existing policies and authorities will require significant legislative action.
To be proactive, the Corps should contemplate developing legislation to determine for which regions and under which conditions it could be the lead agency or Federal partner for:
1. Building single-purpose regional water supply reservoirs with full cost recovery to preemptively obviate the need for more costly, environmentally damaging local projects to support urban development or energy-related crop irrigation projects.
2. Building intra- and interstate conveyance systems to provide the capacity to reallocate water over greater distances or improve system operations among existing reservoirs that are in relatively close proximity.
3. Designing or managing regional water marketing systems that permit efficient and ecologically sensitive transactions (i.e., water flows) between buyers and sellers, across watersheds or basins or over multiple economic and environmental purposes.
Recent technological and management adaptations and innovations present a strong conceptual case for Federal-level perspectives and preparedness along these lines and the Corps should not be limited in its future ability to prepare appropriate response because of its current activities.
ES.6 Conclusion Presently, there are no major national-scale problems caused by local or regional imbalances of water demand and supply. However, such imbalances exist in a number of water “hot spots” in both the western and eastern U.S. These hotspots arise through convergence of difficult hydrologic conditions, weather patterns, endangered species locations and population growth.

Executive Summary
2007-R-3 xiii Institute for Water Resources
Gradual worsening of these conditions may cause the scope of the problems to enlarge and include the consideration of regional, state and Federal entities and stakeholders.
From a national perspective, the overall conclusion of this review is that the cumulative impact of the major trends affecting water demand, supply and allocation is not likely to result in a catastrophic situation during the next 30 years. However, the uncertainties about the trends and other developments could shift the expected outcomes into the realm of serious crises, such as a prolonged and severe drought of large geographical extent combined with unwise buildup of water demands. The assessment of the existing capacities in water supply and options for increasing these capacities in the future indicates that the country can handle even the “worst case” water shortage scenario, but the impacts and the cost of coping mechanisms would be reduced significantly with proactive Federal involvement and a reformed system of water management.

Executive Summary
Institute for Water Resources xiv 2007-R-3
2007-R-3 1 Institute for Water Resources
Section 1 Introduction Water is an essential resource in the U.S. economy. It plays a crucial role in supporting many economic activities and ensuring the quality of human life and the health of ecological systems. Despite this, the value of water may not be widely appreciated because only some water resources and water uses are easily visible or noticed while others are not. Surface water resources such as rivers and lakes are highly visible and well-recognized for their cultural and amenity values as well as for their important functions in outdoor recreation and transportation. Less recognized by the general public is that portion of water resources—groundwater—which actually represents three-fourths of freshwater storage in the lower 48 states. Similarly, some human uses of water are more easily noticed while others are not. Use of water for hydropower production or for irrigation can be seen easily, while large water flows to urban and industrial uses are usually hidden in underground pipes.1
Given the overall importance of water, the long-term adequacy of water supply is a major national concern. At the Federal level, significant financial resources are spent on measuring flows and related hydrologic monitoring. Also, questions about nationwide water availability and water demand are periodically raised by the committees of the U.S. Congress and subsequently assessed by the Federal agencies with water management responsibilities. The review described in this paper, while not being a part of a congressional inquiry, has been initiated by the Institute for Water Resources (IWR) of the Corps to support iterative strategic planning activities of the Civil Works of the Corps including the development of strategic goals, objectives and strategies.
This paper represents an attempt to characterize the present water supply situation in the country and examine the trends and uncertainties that will affect water resources and their management during the next 30 years. The main purpose is to summarize reliable information as well as experts’ insights about the social, technological, economic, environmental and security trends affecting water demand, supply and allocation both nationwide and in specific geographical regions of the country. The paper also reviews the implications of the trends and uncertainties for the Federal government, states and localities, NGOs and the private sector, as well as implications for the mission and roles of the Corps.
This paper is organized into six sections. The next section (Section 2) characterizes the U.S. water resources and their management. Section 3 describes the major trends and uncertainties that are expected to impact future water demands, supply and allocation. Section 4 discusses the responses to trends and uncertainties and their implications for securing future water supplies and water management, both nationally and in specific geographic regions. Section 5 focuses on the roles and responsibilities of the Federal, state and local governments, NGOs and the private sector in reacting to the future trends and uncertainties with a more detailed discussion of the implications for the mission and roles of the Corps Civil Works. Finally, Section 6 provides a summary and conclusions. Appendix A presents four different scenarios to 1 For example, the network of public water supply pipes in the U.S. carries an average flow of 67,000 cubic feet per
second (cfs)–this represents more than the average discharge of the Arkansas River. The flow of piped water for thermoelectric cooling is even greater; in the year 2000 it reached 302,000 cfs–more than the average annual discharge of the Ohio River.

Section 1 Introduction
Institute for Water Resources 2 2007-R-3
capture a set of plausible futures in U.S. water management. Appendix B provides an annotated bibliography of selected references to highlight relevant research.
2007-R-3 3 Institute for Water Resources
Section 2 Background Before considering the trends and uncertainties which are expected to affect water resources, it is helpful to assess the state of water supply, demand and allocation in the U.S. today. This section provides a brief review of water availability and its use, the current level of water resources development and summarizes the approach to water management at Federal, state and local levels. The section concludes with identifying a number of “hot spots” in both eastern and western parts of the country where water supply problems have begun to appear and describes two case examples.
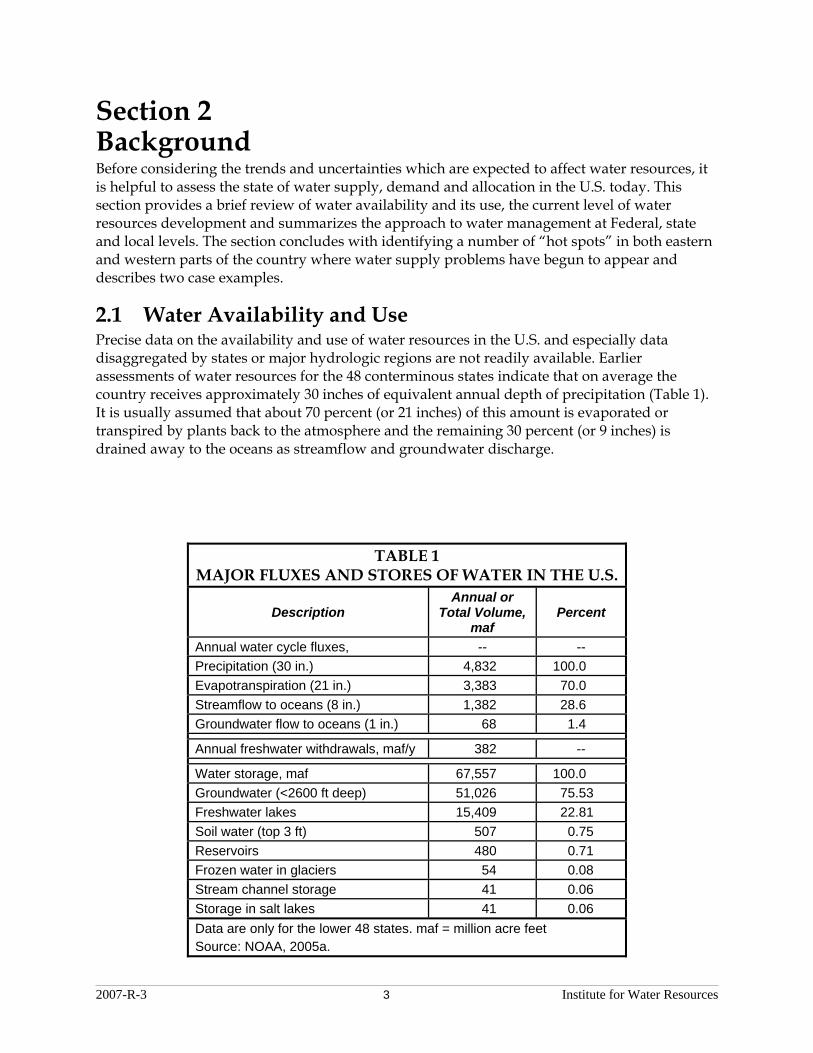
2.1 Water Availability and Use Precise data on the availability and use of water resources in the U.S. and especially data disaggregated by states or major hydrologic regions are not readily available. Earlier assessments of water resources for the 48 conterminous states indicate that on average the country receives approximately 30 inches of equivalent annual depth of precipitation (Table 1). It is usually assumed that about 70 percent (or 21 inches) of this amount is evaporated or transpired by plants back to the atmosphere and the remaining 30 percent (or 9 inches) is drained away to the oceans as streamflow and groundwater discharge.
TABLE 1 MAJOR FLUXES AND STORES OF WATER IN THE U.S.
Description Annual or
Total Volume, maf
Percent
Annual water cycle fluxes, -- -- Precipitation (30 in.) 4,832 100.0 Evapotranspiration (21 in.) 3,383 70.0 Streamflow to oceans (8 in.) 1,382 28.6 Groundwater flow to oceans (1 in.) 68 1.4
Annual freshwater withdrawals, maf/y 382 --
Water storage, maf 67,557 100.0 Groundwater (<2600 ft deep) 51,026 75.53 Freshwater lakes 15,409 22.81 Soil water (top 3 ft) 507 0.75 Reservoirs 480 0.71 Frozen water in glaciers 54 0.08 Stream channel storage 41 0.06 Storage in salt lakes 41 0.06 Data are only for the lower 48 states. maf = million acre feet Source: NOAA, 2005a.

Section 2 Background
Institute for Water Resources 4 2007-R-3
In addition to this annually renewable water, large quantities of water are stored in the ground or on the land surface. The approximate volume of water stored in lakes and groundwater aquifers is nearly 68,000 [maf] million acre feet and represents an equivalent water depth over the land area of the 48 states of nearly 420 inches (or 35 feet). In terms of water use, for the year 2000, total freshwater withdrawals in the lower 48 states were 340 million gallons per day (mgd) or 382 million acre feet (maf) per year. This is equivalent to 2.4 inches of water depth or approximately one-fourth of the 9 inches of total run-off.
Average values for the contiguous 48 states conceal the regional variability of water resources and their uses. An example of differences among two states, Kansas and Illinois, is shown in Table 2. It shows much higher precipitation and run-off in Illinois as compared to the western state of Kansas. In the 17 western states, starting with the states which are crossed by the 100th meridian (i.e., Texas, Oklahoma, Kansas, Nebraska and the Dakotas), average annual precipitation declines and approaches annual evapotranspiration. Also most of the precipitation in the western states occurs as snow and there is limited precipitation during the summer growing season. This means that agricultural crops in the West have to be irrigated.
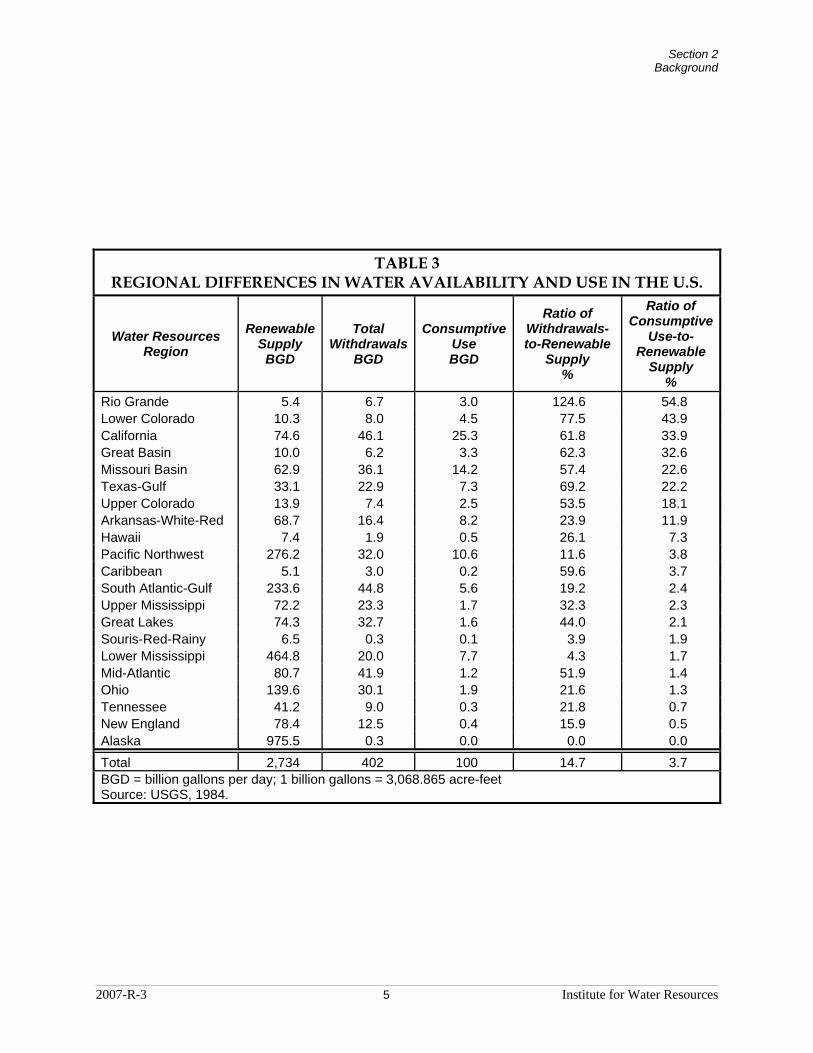
A more detailed comparison of the availability and use of water resources for the 21 water-resources regions of the U.S., Puerto Rico and U.S. Virgin Islands are shown in Table 3 and on Figure 1. The renewable supply in each region is calculated as the sum of precipitation and water imports minus natural evapotranspiration and water exports (USGS, 1984). When comparing the estimated values, it is important to note that the amount of renewable supply available for use is further limited by water requirements for fish, navigation, hydropower and other in-stream uses. The renewable supply compared to total withdrawals and especially consumptive use can be used as an index of the current level of resource utilization. The crucial measure of water availability is the ratio of renewable supply to consumptive use. Table 3 shows that in two water resources regions, the Rio Grande and Lower Colorado, the consumptive use has reached approximately one-half of total renewable supply. In four other regions, namely, California, the Great Basin, the Missouri Basin and the Texas Gulf, consumptive use is between 20 and 40 percent of the renewable supply. These regions of the country are the most likely to face future water supply problems. Some localities within these regions are already facing water shortages. These local and regional hotspots are discussed in Section 2.4 below.
TABLE 2 EXAMPLE OF WATER
BUDGETS FOR THE U.S. (inches per year)
Component Kansas Illinois Precipitation 27.00 37.71Evapotranspiration 23.23 26.47Run-off 2.58 11.24Water use (2000) 1.90 5.58
Streamflow in 0.38 52.03Streamflow out* 2.96 127.27* Illinois outflow includes out of state
inflows by Missouri, Cumberland and Tennessee Rivers.
Section 2 Background
2007-R-3 5 Institute for Water Resources
TABLE 3 REGIONAL DIFFERENCES IN WATER AVAILABILITY AND USE IN THE U.S.
Water Resources Region
Renewable Supply
BGD
Total Withdrawals
BGD
Consumptive Use BGD
Ratio of Withdrawals-to-Renewable
Supply %
Ratio of Consumptive
Use-to-Renewable
Supply %
Rio Grande 5.4 6.7 3.0 124.6 54.8 Lower Colorado 10.3 8.0 4.5 77.5 43.9 California 74.6 46.1 25.3 61.8 33.9 Great Basin 10.0 6.2 3.3 62.3 32.6 Missouri Basin 62.9 36.1 14.2 57.4 22.6 Texas-Gulf 33.1 22.9 7.3 69.2 22.2 Upper Colorado 13.9 7.4 2.5 53.5 18.1 Arkansas-White-Red 68.7 16.4 8.2 23.9 11.9 Hawaii 7.4 1.9 0.5 26.1 7.3 Pacific Northwest 276.2 32.0 10.6 11.6 3.8 Caribbean 5.1 3.0 0.2 59.6 3.7 South Atlantic-Gulf 233.6 44.8 5.6 19.2 2.4 Upper Mississippi 72.2 23.3 1.7 32.3 2.3 Great Lakes 74.3 32.7 1.6 44.0 2.1 Souris-Red-Rainy 6.5 0.3 0.1 3.9 1.9 Lower Mississippi 464.8 20.0 7.7 4.3 1.7 Mid-Atlantic 80.7 41.9 1.2 51.9 1.4 Ohio 139.6 30.1 1.9 21.6 1.3 Tennessee 41.2 9.0 0.3 21.8 0.7 New England 78.4 12.5 0.4 15.9 0.5 Alaska 975.5 0.3 0.0 0.0 0.0
Total 2,734 402 100 14.7 3.7 BGD = billion gallons per day; 1 billion gallons = 3,068.865 acre-feet Source: USGS, 1984.

Section 2 Background
Institute for Water Resources 6 2007-R-3
2.2 Water Infrastructure There are approximately 79,000 dams and reservoirs in the U.S. and millions of miles of canals, tunnels and water pipes. There are more than 8,100 major dams that are 50 feet or more in height and which have a normal storage capacity of 5,000 acre-feet (af) or more. These reservoirs, with their combined storage capacity of close to 860 million acre-feet (maf) provide supply of water during periods when natural flow would be insufficient to satisfy demands. Most of the major reservoirs are publicly owned; they were built and are operated by Federal agencies. The largest dams are managed by the Corps, the U.S. Bureau of Reclamation (USBR) and the Tennessee Valley Authority (TVA). The Corps has built and operates nearly 600 dams and reservoirs (see Table 4).
Historically, public expenditures on water storage and transmission infrastructure have been substantial. Most of the existing dams and the associated transmission facilities were built with Federal funds to be later repaid or with partial cost sharing by local interests. The public expenditures on water storage and transmission infrastructure have declined substantially during the last three decades; only drinking water treatment and distribution systems and
FIGURE 1 RENEWABLE WATER SUPPLY AND CONSUMPTIVE USE IN THE U.S. Source: USGS, 1984: National Water Summary 1983-Hydrologic Events and Issues; U.S.
Geological Survey Water-Supply Paper 2250.

Section 2 Background
2007-R-3 7 Institute for Water Resources
wastewater collection and disposal facilities have continued to receive significant Federal and non-Federal funding.2
Despite the recent outlays on public water supply and wastewater infrastructure, a recent study prepared by Water Infrastructure Network (2001) indicates that during a 20-year period ending in 2019, the average annual local expenditures of $61 billion will fall short of an estimated $95 billion that are needed to meet both capital and operating costs.3 The report also noted that current Federal assistance accounts for only 10 percent of total capital outlays for water and wastewater infrastructure and that Federal support has declined by 75 percent in real terms since 1980.
The decline of Federal expenditures on water storage and transmission infrastructure has been even greater. The American Society of Civil Engineers (ASCE, 2003; ASCE, 2005) assessments do not consider the needs for water supply and transmission infrastructure; they focused only on funding for rehabilitating or removing unsafe dams.
2.3 Water Management The process of managing water resources in the U.S. is complex and operates without a coordinated and guiding national water policy. The primary responsibility for water allocation is vested in state governments, but the Federal government plays a major role in water resources planning, development and regulation. Many agencies and large numbers of personnel are involved.4 This high level of involvement is an indication of the national importance of water resources and the complexity of water management decisions and operations.
2 According to the General Accounting Office (GAO, 2001), during fiscal years 1991 through 2000, 9 Federal
agencies made available about $44 billion for drinking water and wastewater capital improvements (with the Environmental Protection Agency [EPA], the Department of Agriculture [USDA], the Department of Housing and Urban Development [HUD], and the Department of Commerce accounting for about 98 percent of the total). During the same period states cumulatively made about $25 billion in state funds available to local communities and water or wastewater utilities.
3 A report by the American Society of Civil Engineers (ASCE, 2003) confirms these estimates stating that there is an annual shortfall of $11 billion needed to replace or rehabilitate drinking water facilities and a $12 billion annual shortfall in funding for infrastructure needs in wastewater collection treatment and disposal. The report recommended an increased funding of $25 billion per year for a 5-year period to address the need for water infrastructure and the same amount for wastewater.
4 Rogers (1993) estimated that at the time of his writing the Federal government had more than 90,000 employees working on water problems in 10 cabinet departments, 2 major independent agencies and 34 smaller agencies. He also estimated that state and local governments probably had up to three times that number and that at least 50,000 private sector employees also working on water management activities.
TABLE 4 LARGE RESERVOIRS IN THE U.S.
Federal Agency Approximate Number of Reservoirs
Bureau of Land Management 750 U.S. Army Corps of Engineers 600 Bureau of Reclamation 300 Tennessee Valley Authority 50 U.S. Forest Service 400 National Park Service 260 Bureau of Indian Affairs 300 U.S. Fish and Wildlife Service 175 Department of Energy 30 Source: NOAA, 2005b.
Section 2 Background
Institute for Water Resources 8 2007-R-3
Several Federal agencies are responsible for water management and related functions. The Civil Works directorate of the Corps has several primary responsibilities which include ecosystem restoration, flood control, navigation, as well as hydropower, water supply, recreation and regulation. The Corps has constructed and currently operates 383 major lake and reservoir projects including 136 multipurpose reservoirs. Also, the Corps is the largest operator of hydroelectric power plants in the U.S.; it operates 75 large hydropower plants. The multipurpose reservoirs contain 9.8 maf of storage capable of providing more than 4 billion gallons per day (bgd) of water for use (U.S. Army Corps of Engineers [USACE], 2006).
The USBR is responsible for developing water supply storage in the 17 western states. The combined storage in the 300 reservoirs is 245 maf. The agency also operates 58 power plants. In the East, the TVA operates a system of 49 dams and reservoirs on the Tennessee River and its tributaries including 29 hydroelectric power plants. The TVA is also responsible for flood control, navigation, recreation and water quality in the watershed.
State, regional and local water management agencies also fulfill many water management responsibilities. State water agencies usually administer statewide programs related to water quality, water allocation, drought planning and flood protection. Regional agencies include irrigation districts, groundwater management districts or water management districts. Finally, at the local level, there are municipal water departments, water and sewer districts and flood control districts.
Overall, the U.S. water resources are managed by a combination of Federal, state, regional and local organizations and various policies and laws which are not well coordinated. While this arrangement appears to work, its ability to deal effectively with future challenges is uncertain. Future challenges in water management, especially those related to climate change, could potentially disrupt the existing institutional arrangements thus impacting their effectiveness.
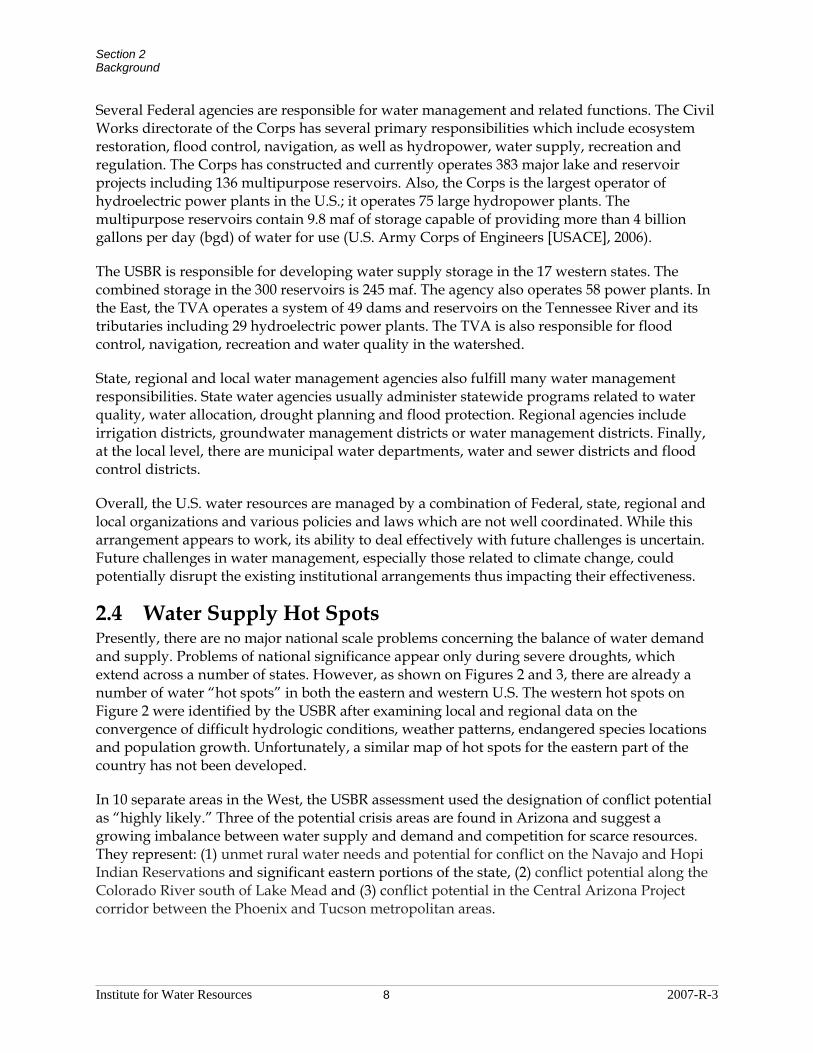
2.4 Water Supply Hot Spots Presently, there are no major national scale problems concerning the balance of water demand and supply. Problems of national significance appear only during severe droughts, which extend across a number of states. However, as shown on Figures 2 and 3, there are already a number of water “hot spots” in both the eastern and western U.S. The western hot spots on Figure 2 were identified by the USBR after examining local and regional data on the convergence of difficult hydrologic conditions, weather patterns, endangered species locations and population growth. Unfortunately, a similar map of hot spots for the eastern part of the country has not been developed.
In 10 separate areas in the West, the USBR assessment used the designation of conflict potential as “highly likely.” Three of the potential crisis areas are found in Arizona and suggest a growing imbalance between water supply and demand and competition for scarce resources. They represent: (1) unmet rural water needs and potential for conflict on the Navajo and Hopi Indian Reservations and significant eastern portions of the state, (2) conflict potential along the Colorado River south of Lake Mead and (3) conflict potential in the Central Arizona Project corridor between the Phoenix and Tucson metropolitan areas.
Section 2 Background
2007-R-3 9 Institute for Water Resources
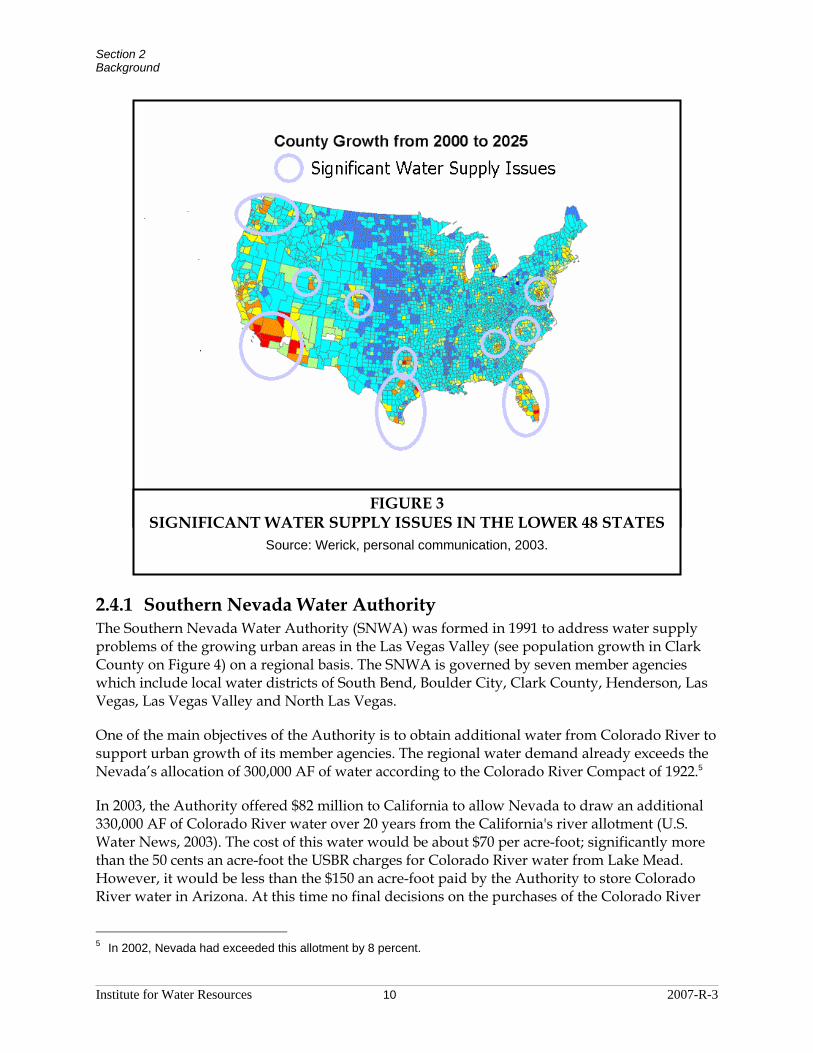
In the eastern part of the U.S. (as shown on Figure 3), areas of significant water supply issues have been identified as: the Washington, D.C. area; Charlotte, North Carolina; Atlanta, Georgia and a major portion of the Florida Peninsula. These areas are expected to have a very high rate of population growth and limitations on water availability. In the West, the problem areas coincide with the designations made by the USBR on Figure 2 and include Dallas, Texas; Lower Texas; Denver, Colorado; the Salt Lake City, Utah area; Lower Southwest and the Seattle, Washington area.
The water demand/supply balance and allocation conditions in those hot spots and potentially several other areas will pose significant challenges to the present institutional system of water management. As the water supply situations worsens at the local level, the scope of the problems is likely to enlarge and include the consideration of regional, state and Federal entities and stakeholders. Two examples of new approaches to addressing local water supply/demand problems associated with the trend of increasing water scarcity relative to demands, one in the West and another in the East, are briefly summarized below.
FIGURE 2 WATER HOTSPOTS IN WESTERN U.S.
Section 2 Background
Institute for Water Resources 10 2007-R-3
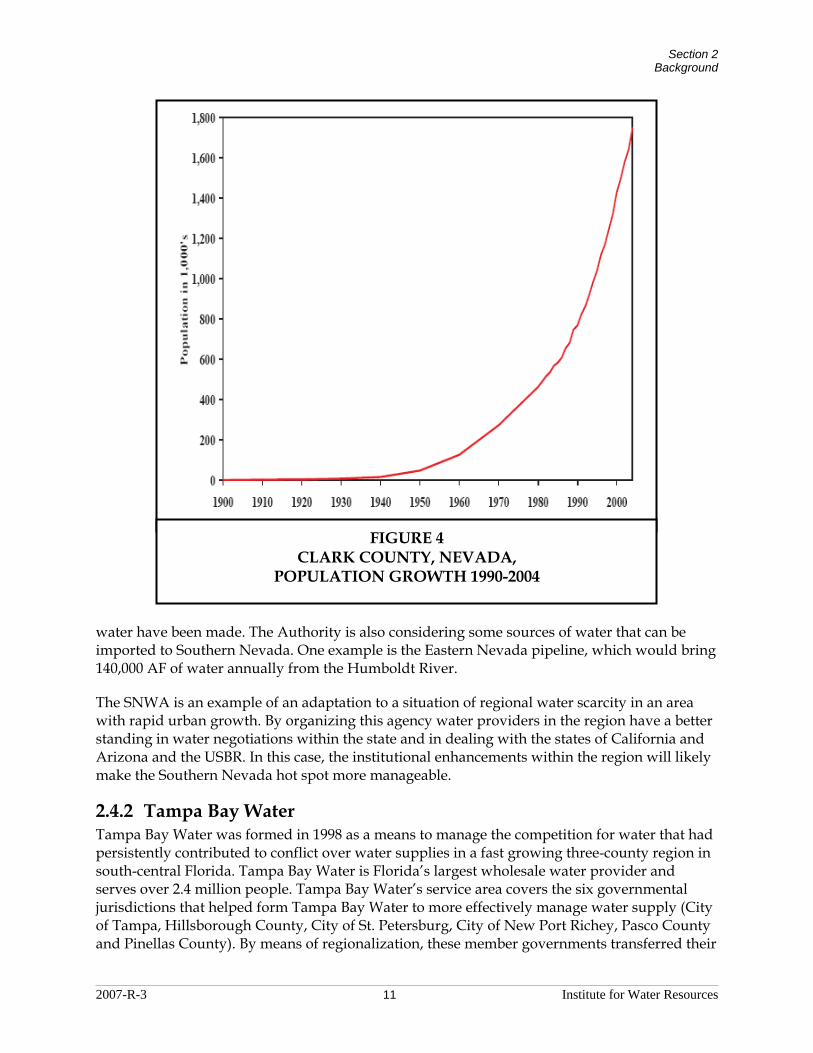
2.4.1 Southern Nevada Water Authority The Southern Nevada Water Authority (SNWA) was formed in 1991 to address water supply problems of the growing urban areas in the Las Vegas Valley (see population growth in Clark County on Figure 4) on a regional basis. The SNWA is governed by seven member agencies which include local water districts of South Bend, Boulder City, Clark County, Henderson, Las Vegas, Las Vegas Valley and North Las Vegas.
One of the main objectives of the Authority is to obtain additional water from Colorado River to support urban growth of its member agencies. The regional water demand already exceeds the Nevada’s allocation of 300,000 AF of water according to the Colorado River Compact of 1922.5
In 2003, the Authority offered $82 million to California to allow Nevada to draw an additional 330,000 AF of Colorado River water over 20 years from the California's river allotment (U.S. Water News, 2003). The cost of this water would be about $70 per acre-foot; significantly more than the 50 cents an acre-foot the USBR charges for Colorado River water from Lake Mead. However, it would be less than the $150 an acre-foot paid by the Authority to store Colorado River water in Arizona. At this time no final decisions on the purchases of the Colorado River
5 In 2002, Nevada had exceeded this allotment by 8 percent.
FIGURE 3 SIGNIFICANT WATER SUPPLY ISSUES IN THE LOWER 48 STATES
Source: Werick, personal communication, 2003.
Section 2 Background
2007-R-3 11 Institute for Water Resources
water have been made. The Authority is also considering some sources of water that can be imported to Southern Nevada. One example is the Eastern Nevada pipeline, which would bring 140,000 AF of water annually from the Humboldt River.
The SNWA is an example of an adaptation to a situation of regional water scarcity in an area with rapid urban growth. By organizing this agency water providers in the region have a better standing in water negotiations within the state and in dealing with the states of California and Arizona and the USBR. In this case, the institutional enhancements within the region will likely make the Southern Nevada hot spot more manageable.
2.4.2 Tampa Bay Water Tampa Bay Water was formed in 1998 as a means to manage the competition for water that had persistently contributed to conflict over water supplies in a fast growing three-county region in south-central Florida. Tampa Bay Water is Florida’s largest wholesale water provider and serves over 2.4 million people. Tampa Bay Water’s service area covers the six governmental jurisdictions that helped form Tampa Bay Water to more effectively manage water supply (City of Tampa, Hillsborough County, City of St. Petersburg, City of New Port Richey, Pasco County and Pinellas County). By means of regionalization, these member governments transferred their
FIGURE 4 CLARK COUNTY, NEVADA,
POPULATION GROWTH 1990-2004

Section 2 Background
Institute for Water Resources 12 2007-R-3
water supply facilities to Tampa Bay Water and waived their rights to develop additional supplies. Under the umbrella of Tampa Bay Water, the member governments now share in the cost of developing new regional water supplies and in meeting environmental goals and regulations.
Tampa Bay Water is faced with growing water demands and binding restrictions on its future ability to utilize groundwater resources. As part of an agreement with the Southwest Florida Water Management District, Tampa Bay Water must reduce its groundwater system supply capacity from its original capacity of 192 mgd to 90 mgd by 2008. This reduction will likely result in decommissioning of some existing wells or their conversion to aquifer storage and recovery (ACR) wells. This situation has led Tampa Bay Water to aggressively plan for and balance its portfolio of water sources, including the development of a 25 mgd desalination facility at a cost of $110 million and the operational integration and optimization of its system of surface water reservoirs and wellfields. Furthermore, Tampa Bay Water has adopted a risk-based planning approach for evaluating future water needs that provides a framework for analyzing future system reliability and the benefits and costs of water supply alternatives, including water conservation and reclaimed water systems. This strategy has permitted Tampa Bay Water to plan for additional water sources in a way that recognizes the amount of time it takes to make new sources operational and which keeps pace with growth and balances infrastructure investment with water resource management.
The case of Tampa Bay Water demonstrates how a regional approach to water management can bring benefits and operational flexibility, particularly when faced with demand growth and regulatory constraints. It also represents a progressive case where a water management innovation has occurred at a local level without the assistance, partnership or intervention of Federal water management agencies.
2.5 Summary of Baseline Conditions In aggregate, the present situation with water demand, supply and allocation in the U.S. appears to be manageable. However, there are several local/regional hot spots where a combination of water scarcity, competition among users and population growth is likely to lead to problems in balancing demand and supply. In some of these areas all levels of government are already involved in helping local water entities to find solutions. Examples include assistance to hot spots in Florida by the Water Management Districts and in Texas by Texas Water Resources Development Board. Regional and statewide entities are involved in most of the hot spots with “highly likely” conflict potential.
In the future, the number of local hot spots is likely to increase in response to several trends and uncertainties which will affect both local and regional balances of supply and demand. In some cases these imbalances will extend to larger regions including areas that will cross state boundaries. In those cases the regional and state capabilities to deal with water shortages may be overwhelmed and there will be a need for Federal assistance. These trends and uncertainties which could bring this about are discussed in the next section.

2007-R-3 13 Institute for Water Resources
Section 3 Trends and Uncertainties 3.1 Major Trends and Uncertainties When considering the forces that will affect future water demand and supply, it is helpful to differentiate between trends and uncertainties. As used in this paper, “trends” are external forces with known direction (i.e., increasing or decreasing) that will impact water resources. “Uncertainties” are those future changes for which the direction cannot be determined.
Two major external trends which will affect future water demand include population growth (and related industrial and agricultural production) and production of energy. Three other important trends which will primarily affect water availability are global climate change, environmental protection and aging water supply infrastructure. Some of these external trends, especially climate change and U.S. energy policy, are subject to a great deal of uncertainty. Other trends such as population and economic growth or ecological objectives in water management have less uncertainty (although significant uncertainty is still present). These major trends and their associated uncertainties are listed in Table 5.
TABLE 5 TRENDS AND UNCERTAINTIES TO AFFECT
WATER SUPPLY AND DEMAND Major Trend Associated Uncertainty
1. Population growth and geographical redistribution and economic growth
Uncertainty about population growth rates Potential for large shifts of water demand
2. Demand for ecosystem services Public resolve on environmental values 3. Global warming and climate change Pace of change and impact on water
resources 4. Water for energy production Selection of fuel alternatives 5. Aging water supply infrastructure Budget priorities in funding for rehabilitation
The five trends and their associated uncertainties from Table 5 are discussed in the following sections.
3.1.1 Population and Economic Growth Increasing population and economic growth in the U.S. are expected to bring increases in water demands. However, the effects of these two drivers are not clear-cut; water use also depends on other factors and may not follow the same rate of growth as population or employment. The other determinants of water use include per capita income, price of water, weather conditions (i.e., rainfall and temperature), structure of industrial activity, capacity utilization and other factors. Also, water demands are measured both in terms of water withdrawals and consumptive use, with each having different effects on available water resources.
Water withdrawals and consumptive use are different for different economic sectors and vary geographically. During the 50-year period from 1950 to 2000, estimated total water withdrawals in the U.S. have increased more than two fold—from 180 bgd to 408 bgd. During the 1950 to 1980 period, the growth in water withdrawals corresponded well to the growth in population
Section 3 Trends and Uncertainties
Institute for Water Resources 14 2007-R-3
and gross domestic product (GDP). However, since 1980, total withdrawals have slightly declined and leveled off despite a continuing growth in population and an accelerated growth in GDP. The main reasons for the leveling off were the declining rates of water withdrawals per unit of economic activity (i.e., water use per employee, per irrigated acre and per kilowatt-hour of electricity generation), which represent gains in the technical efficiency of water use (Dziegielewski, et al., 2002).
Consumptive water use, which now represents approximately one-fourth of total withdrawals, also increased during the 1950 to 2000 period but at a slightly slower pace because the relative share of irrigation withdrawals with high consumptive use has decreased.
Another important aspect of water demands is their geographical distribution. A usual concern of water planners is that water demands tend to be concentrated in the semi-arid areas of the west. Actually, only two western states, California and Texas are among the top five states in terms of water withdrawals. The other three states are Illinois, Florida and New York. This ranking is a function of thermoelectric, irrigation and public-supply withdrawals.6
A recent update of the state population projections by the U.S. Bureau of Census shows an increase in the population of the lower 48 states of 81.8 million (or 29 percent) between 2000 and 2030. Within this increase there is a shift of 14.9 million people (18 percent of the increase) to the 17 western states (Table 6). Florida, California and Texas are projected to gain more the 12 million people each, representing significant shifts above their year 2000 shares of total population of the contiguous U.S. (Figure 5).
6 In 2000, the 17 western states had 33 percent of population of the lower 48 states and accounted for 44 percent of
total water withdrawals because of high irrigation withdrawals (86 percent of the total in the lower 48 states) (Hutson et al., 2004).

Section 3 Trends and Uncertainties
2007-R-3 15 Institute for Water Resources
-6.000 -4.000 -2.000 0.000 2.000 4.000 6.000 8.000 10.000 12.000 14.000
.Florida
.California
.Texas
.Arizona
.North Carolina
.Georgia
.Virginia
.Washington
.Nevada
.Maryland
.Tennessee
.Colorado
.Oregon
.New Jersey
.Minnesota
.Utah
.South Carolina
.Illinois
.Missouri
.Wisconsin
.Michigan
.Indiana
.Idaho
.Massachusetts
.Arkansas
.Kentucky
.New York
.Pennsylvania
.Oklahoma
.Alabama
.New Hampshire
.Louisiana
.Connecticut
.New Mexico
.Kansas
.Mississippi
.Delaware
.Ohio
.Montana
.Maine
.Nebraska
.Rhode Island
.Vermont
.South Dakota
.Wyoming
.Iowa
.North Dakota
.West Virginia
2030 Population Changes, Millions
Population increase
Population shift
FIGURE 5 U.S. CENSUS POPULATION
PROJECTIONS AND SHIFTS - 2000-2030 Source: Author’s Construct Based on U.S. Census, 2005

Section 3 Trends and Uncertainties
Institute for Water Resources 16 2007-R-3
TABLE 6 UPDATED POPULATION PROJECTIONS AND DISTRIBUTION
(in millions)
Region 2000 Census Population
Projected 2030 Population Change
Western States 91.5 133.2 41.8 Eastern States 187.6 227.6 40.1 Total Lower 48 279.0 360.8 81.8 Source: U.S. Census, 2005 Total regional shift of population is 14.9 million
Recent forecasts of future demands (Dziegielewski et al., 2003 and Brown, 2000), which are based on historical trends, indicate only a modest growth in total water withdrawals in the coming decades (Table 7, Figure 6). Between 1995 and 2040, total withdrawals are predicted to increase only by 7 to 9 percent despite a projected 41 percent increase in population. Also the projected shift in population from the humid East to the arid and semi-arid West is relatively modest, representing about 12 percent of the total population increase (see Table 8).7 Future growth and geographical shifts in population will increase domestic water demands in local areas with large population increases. However, these local increases are not likely to be accompanied by proportional increases in local industrial, agricultural and thermoelectric water demands. Domestic demands currently represent only 12 percent of total withdrawals and by 2040, are expected to represent 15 to 18 percent of total water withdrawals (Table 7).
TABLE 7 COMPARISON OF 1995 WITHDRAWALS AND 2040 PREDICTIONS
1995-2040 Change, bgd Water Use Category
Estimated 1995 Withdrawals (bgd) Dziegielewski
et al. (2003) Brown, (2000)
Thermoelectric 190 26 11 Irrigation 134 -24 -4 Industrial 29 6 2 Domestic 49 30 13 Total 402 38 24 Source: Dziegielewski, Yang and Bik, 2003; Brown, 2000.
7 In the Southwest region (which comprises four water resource regions [WRR, as defined by the USGS]: the Rio
Grande, Upper Colorado, Lower Colorado and the Great Basin) the 2040 population is projected to increase by 7 million; 2.5 million above its share of U.S. population in 1995. The greatest shifts of population above the 1995 shares are expected for the Southeast (5 million) and Pacific Coast region (4.8 million).

Section 3 Trends and Uncertainties
2007-R-3 17 Institute for Water Resources
There are also some uncertainties surrounding projections of future demand. The first source of uncertainty relates to population projections. The estimates mentioned above reflect the U.S. Bureau of Census middle series projections. For high series population projections, Brown (2000) predicted a 24 percent increase in total withdrawals by 2040. Also, the estimates of water demand would be higher if expected future improvements in efficiency of water use do not materialize.
TABLE 8 REGIONAL POPULATION PROJECTIONS AND DISTRIBUTION
IN THE U.S. (in millions)
Aggregates of Water Resources Regions
1995 Population
2040 Population
Population Increase
Total Shift in Regional Distribution
Northeast 54.8 71.8 17 -5.3 Southeast 49.0 74.0 25 5.0 Northcentral 66.7 86.7 20 -7.1 Great Plains & Central Gulf 34.1 48.1 14 0.1 Southwest 10.9 17.9 7 2.5 Pacific Coast 42.3 64.3 22 4.8
Contiguous 48 states 257.9 362.9 105.0 ± 12.4 Source: Brown, 2000.
0
50
100
150
200
250
300
350
400
450
1945 1955 1965 1975 1985 1995 2005 2015 2025 2035 2045
With
draw
als,
bgd
0.0
50.0
100.0
150.0
200.0
250.0
300.0
350.0
400.0
450.0
U.S
. Pop
ulat
ion,
Mill
ions
Total Withdrawals Domestic withdrawals Industrial WithdrawalsIrrigation Withdrawals Thermoelectric Withdrawals U.S. Population
FIGURE 6 HISTORICAL AND PROJECTED WITHDRAWALS: 1950 – 2040
Source: Dziegielewski, Yang and Bik, 2003.
Section 3 Trends and Uncertainties
Institute for Water Resources 18 2007-R-3
Another source of uncertainty pertains to the unexpected and possibly abrupt shifts in demand caused by climate change and/or water demand for irrigation of crops. Approximately 20 percent of the U.S. land area or 440 million acres is in cropland. Of these, 60 million acres or 14 percent of total cropland are irrigated. There is no specific information on the likely impacts of climate change on agricultural water demand; however, it is possible that some acreage that is now rain-fed will have to be irrigated and also some acreage now irrigated would not need to be irrigated. Also, climate change is expected to increase the frequency, intensity and duration of droughts. Future droughts which are induced by climate change can also create demands for irrigation water in areas of rain-fed agriculture, especially in the Great Plains region. Heat waves that often accompany droughts can also increase urban water demands.
3.1.2 Recognition and Demand for Ecosystem Services Ecosystem water needs include water required by vegetation in a watershed, as well as in-stream and riparian uses where the streamflow supports a wide range of ecological functions of rivers. Increasing societal recognition of ecosystem services implies that in addition to future demand increases to provide for new population and economic growth, there will be increasing demand for in-stream uses of water to support aquatic ecosystems, provide for assimilative capacity to maintain water quality and also for recreational values.
The demand for ecosystem uses will likely impact future allocations of water for off-stream uses and it may also curtail the current allocations of natural flow or water stored behind dams. Throughout the country, in-stream flow requirements are being established for specific reaches or gauge locations and for specific time periods (months and shorter periods) for an increasing number of streams and rivers.
In terms of water allocation, in-stream uses of water are often considered to hold junior water rights.8 However, in some situations the minimum flow requirements could receive the highest priority and would be met through releases of water from reservoir storage or reductions in water withdrawals.9
The effect of in-stream flow requirements and other ecosystem needs on the availability of water supply for off-stream uses is difficult to quantify. A rule of thumb is that approximately 10 percent of average annual flow is required as a minimum instantaneous flow for fish survival and 30 percent of average flow for good survival of fish populations and for recreation (Tennant, 1975). However, the actual values, which are being established for various locations, can be different because these values now take into consideration a number of hydrological and ecological factors. The reductions in water availability for off-stream uses will significantly
8 Currently prior appropriation law does not recognize in-stream uses of water and the process of reallocating water
to in-stream uses can be a major challenge. 9 For example, the State of Minnesota developed provisions for suspending surface prior appropriation water rights
during a drought at locations where streamflow falls below Q90, i.e., a low flow value exceeded 90 percent of the time (Minnesota Department of Natural Resources [DNR], 2005). Also, in the Northwest, approximately 300 junior water rights are subject to minimum flow requirements and to interruption during low flows on the Columbia River (National Academy of Sciences [NAS], 2004a). Finally, in California, the Central Valley Project (CVP) Improvement Act of 1992 requires the USBR to dedicate 800,000 AF of CVP water to in-stream fish and wildlife uses in normal years or 600,000 AF in dry years (Congressional Budget Office [CBO], 1997).
Section 3 Trends and Uncertainties
2007-R-3 19 Institute for Water Resources
contribute to the already difficult water supply situation in many of the hot spots in the western U.S.
One uncertainty about this trend is the continuation of the public resolve to protect environmental values in the future. This resolve could change in response to potential environmental impacts of climate change, general and protracted economic downturns and political priorities, such as terrorism. However, during the last four decades there has been an increasing public interest and growing effort to protect environmental resources and restore ecosystems. It is not likely that this interest will diminish during the next 30 years. Our expectation is that the importance of ecosystem protection will remain unchanged; therefore this is not a significant future uncertainty. The pressure to increase water allocation for in-stream and environmental uses is likely to have a considerable effect on water availability in the water supply hot spots.
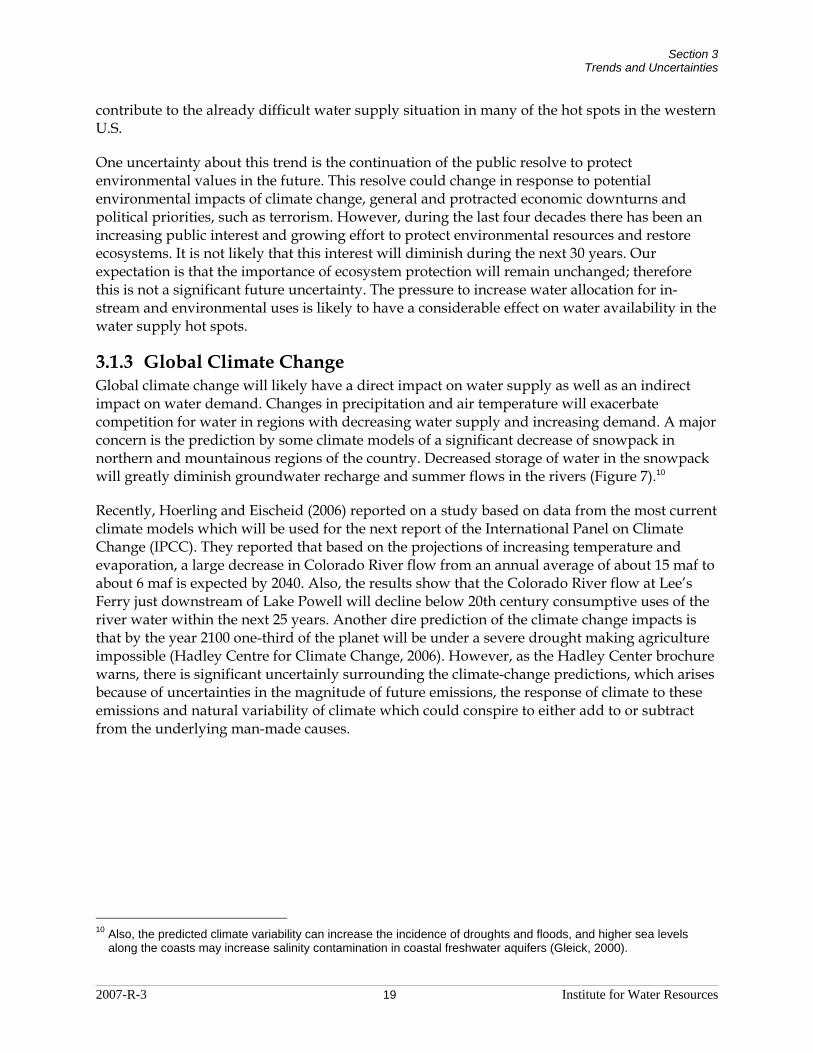
3.1.3 Global Climate Change Global climate change will likely have a direct impact on water supply as well as an indirect impact on water demand. Changes in precipitation and air temperature will exacerbate competition for water in regions with decreasing water supply and increasing demand. A major concern is the prediction by some climate models of a significant decrease of snowpack in northern and mountainous regions of the country. Decreased storage of water in the snowpack will greatly diminish groundwater recharge and summer flows in the rivers (Figure 7).10
Recently, Hoerling and Eischeid (2006) reported on a study based on data from the most current climate models which will be used for the next report of the International Panel on Climate Change (IPCC). They reported that based on the projections of increasing temperature and evaporation, a large decrease in Colorado River flow from an annual average of about 15 maf to about 6 maf is expected by 2040. Also, the results show that the Colorado River flow at Lee’s Ferry just downstream of Lake Powell will decline below 20th century consumptive uses of the river water within the next 25 years. Another dire prediction of the climate change impacts is that by the year 2100 one-third of the planet will be under a severe drought making agriculture impossible (Hadley Centre for Climate Change, 2006). However, as the Hadley Center brochure warns, there is significant uncertainly surrounding the climate-change predictions, which arises because of uncertainties in the magnitude of future emissions, the response of climate to these emissions and natural variability of climate which could conspire to either add to or subtract from the underlying man-made causes.
10 Also, the predicted climate variability can increase the incidence of droughts and floods, and higher sea levels
along the coasts may increase salinity contamination in coastal freshwater aquifers (Gleick, 2000).

Section 3 Trends and Uncertainties
Institute for Water Resources 20 2007-R-3
FIGURE 7
PERCENTAGE CHANGE FROM THE 1961-90 BASELINE IN THE APRIL 1 SNOWPACK IN FOUR AREAS OF THE
WESTERN U.S. AS SIMULATED FOR THE 21ST CENTURY BY THE CANADIAN AND HADLEY MODELS

Section 3 Trends and Uncertainties
2007-R-3 21 Institute for Water Resources
One uncertainty that is particularly relevant for assessing impacts on water resources is the speed of onset of climate change and type of climatologic effects. The effects of climate change on the availability and use of water in the U.S. during the next 30 years could be gradual or abrupt depending on whether there will be climate change induced droughts of increased severity, duration and geographical extent. The gradual changes in temperature and precipitation would solicit a different societal response than if there is a change in extreme weather events such as flood and droughts or heat waves.11 At this time no information is available to assess which of the two outcomes is more likely, which makes this factor an uncertainty.
3.1.4 Water for Energy Production The water and energy nexus, which pertains to the relationship between water resources and energy production, represents another force to impact water supply resources. The first linkage is that in order to limit CO2 emissions to combat global warming more water could be allocated to hydropower production. The next connection is that increased generation of electricity through thermal processes with conventional steam turbines will require large quantities of cooling water (either for non-consumptive once-through cooling or consumptive use in closed-loop systems). Finally, the potentially increasing production of biofuels may increase the need for converting marginal lands and forests into cropland and increasing irrigated acreage in the arid and semi-arid regions of the country.
The Department of Energy (DOE) projections of future power generation indicate that, because of the lack of premier sites for large-scale hydro and serious environmental concerns, no new large hydro plants will be built and the future share of total hydroelectric generation will fall from 6.8 percent in 2004 to 5.1 percent in 2030 (Energy Information Agency [EIA], 2006).12 This means that the future incremental impacts of hydroelectric generation on water resources are likely to be minimal. For thermoelectric generation, it is predicted that coal and natural gas plants will meet most of the new energy needs by 2030. However, the cooling water requirements for new generation will not be very high because the EPA is not likely to issue many new National Pollutant Discharge Elimination System (NPDES) permits for once-through cooling plants. Therefore, new power plants are likely to rely on closed-loop cooling systems with cooling towers, which withdraw only 2 to 3 percent of the volume of water typically used by once-through systems. Given the projected increase in generation of 1,774 billion kilowatt-hours by 2030, the new withdrawals for cooling purposes would be only about 5 bgd as compared to 194 bgd if all new generation depended on once-through cooling.
Both the greatest impact and the highest uncertainty of the water-energy nexus relate to the use of biofuels both for transportation and electricity generation. Currently petroleum-based fuels supply nearly all transportation energy needs in the U.S. Grumet (2006) states that “to 11 The greatest concern of water planners is the likelihood of the increase in the severity, duration, frequency and
geographical extent of drought episodes. The analysis of paleoclimatic data in the central U.S. for the period of 2000 years indicates that under natural variability large droughts like the 1930s drought occur once or twice a century and that multi-decadal mega-droughts with large geographical extent occur every few hundred years (Woodhouse and Overpeck, 1998). It is possible that under the conditions of changing climate, the frequency of large droughts will increase.
12 In 2003, hydroelectric generation capacity (including pumped storage) was 99,219 MW or 10.5 percent of U.S. total. Total hydroelectric generation was 275,806 thousand MWh or 32 percent of the capacity. (The pumped storage generation was negative 8,535 MWh).

Section 3 Trends and Uncertainties
Institute for Water Resources 22 2007-R-3
meaningfully improve our nation’s energy security, alternative transportation fuels must be capable of being economically and reliably produced on a truly massive scale.” Currently, corn is grown on about 77 million acres, 12 percent of which is dedicated to ethanol production (USDA, 2004). However, it takes roughly 4 percent of total national corn supply to displace 1 percent of the current gasoline supply.13
Therefore, the expansion of the production of corn and sugar cane for fuel is not really feasible because of the limitation of land and water. However, there is a possibility of using cellulosic alternatives, which can be grown on marginal land without extra water requirements.14 One important qualification is that the use of switchgrass and other cellulosic alternatives is dependent on the development of an inexpensive enzyme to convert cellulose to wood sugar.15 This dependence on a technological breakthrough makes the large scale use of cellulosic inputs an uncertainty.
The main uncertainties surrounding this trend pertain to the selection of fuel alternatives. While the choices for the production of electric energy from coal and natural gas in the coming decades seem to be relatively certain, there is uncertainty about the production of liquid fuels which are used primarily for transportation. As mentioned earlier, the production of biofuels on a massive scale is not likely and the substitution of cellulosic stock for corn and sugar cane requires some technological breakthroughs. Therefore, the more likely outcome in production of biofuels is that the scale of production will be limited and biofuels will be only a part of the solution. With limited agricultural output dedicated to biofuels, the demands for additional irrigation water will also be limited.
Another uncertainty relates to the conversion of coal into liquid fuels. A recent DOE study reported the water requirements for a typically sized 50,000 barrels-per-steam day liquefaction plant to range from 10.5 mgd to 30 mgd (Chan et al., 2006). This indicates that while water demands of such plants can have significant local impacts on water resources, the unit requirement of about 5 to 7.3 gallons of water per gallon of Fischer-Tropsch (F-T) liquid could be satisfied with the available water resources in coal-producing areas of the U.S. except for some areas in the West, especially in the Rocky Mountain region containing western coal fields. Furthermore, coal liquefaction is an expensive process; the cost to produce syncrude is about $50 to $60 per barrel (i.e., per 42 gallons). This makes a large scale liquefaction of coal unlikely unless the price of crude oil stays above the level of $60 per barrel, which is a real possibility given recent “reduced” prices (see Figure 8) and political instabilities in the Middle East, Africa and South America. Construction of synfuel plants in the western states could contribute to the creation of additional water supply hot spots in those regions.
13 The annual consumption of gasoline in the U.S. is about 140 billion gallons. 14 Cellulosic biomass includes all structural or those parts of the plant which perform photosynthesis (i.e., the parts
above the ground except for the fruit and seeds). Examples of cellulosic biomass include grass, wood and residues from agriculture or forest products (Greene, 2004).
15 According to the estimates prepared by the Oak Ridge National Laboratory, it would take 180 million acres or roughly 40 percent of the land already in cultivation in the U.S. to fuel half of the current vehicle fleet with cellulosic ethanol (Grumet, 2006). This land requirement would shrink to only 30 million acres (the current enrolled acreage in the Conservation Reserve Program), if we could double per-acre yields of switchgrass, increase its conversion efficiency to ethanol by one-third and double the fuel economy of our vehicle fleet. Also, there are 578 million acres of permanent pasture lands, which could produce switchgrass (Sexton et al., 2006).
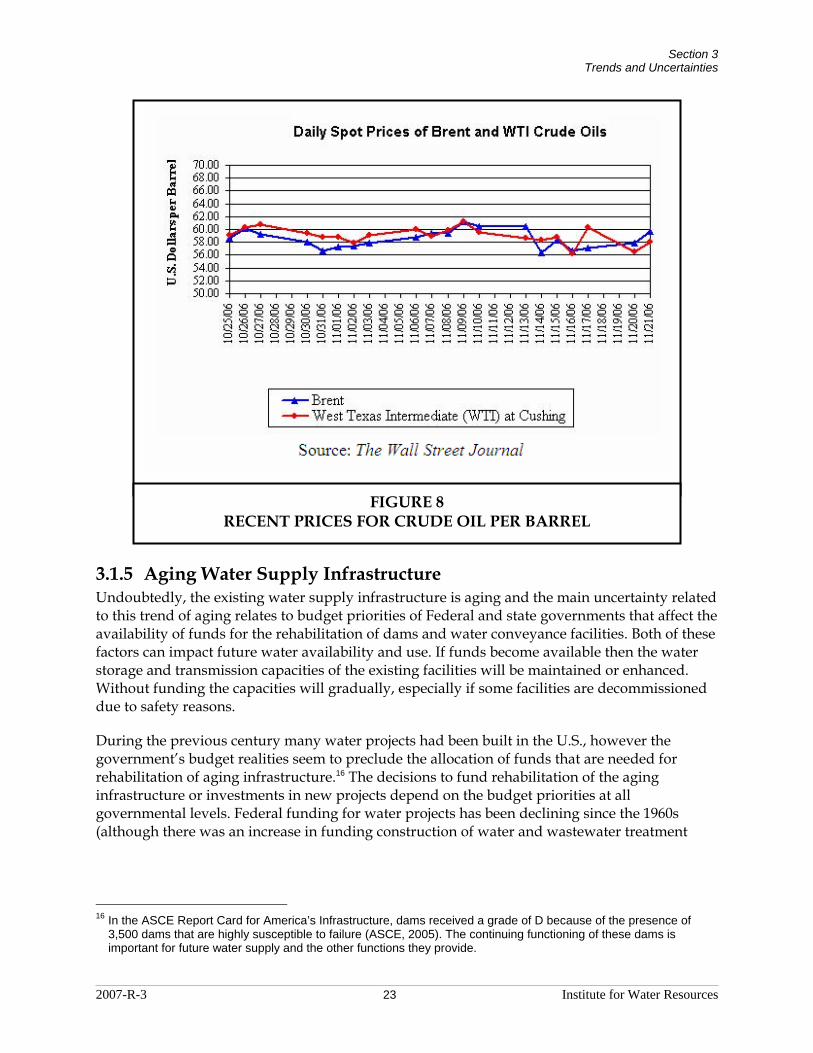
Section 3 Trends and Uncertainties
2007-R-3 23 Institute for Water Resources
3.1.5 Aging Water Supply Infrastructure Undoubtedly, the existing water supply infrastructure is aging and the main uncertainty related to this trend of aging relates to budget priorities of Federal and state governments that affect the availability of funds for the rehabilitation of dams and water conveyance facilities. Both of these factors can impact future water availability and use. If funds become available then the water storage and transmission capacities of the existing facilities will be maintained or enhanced. Without funding the capacities will gradually, especially if some facilities are decommissioned due to safety reasons.
During the previous century many water projects had been built in the U.S., however the government’s budget realities seem to preclude the allocation of funds that are needed for rehabilitation of aging infrastructure.16 The decisions to fund rehabilitation of the aging infrastructure or investments in new projects depend on the budget priorities at all governmental levels. Federal funding for water projects has been declining since the 1960s (although there was an increase in funding construction of water and wastewater treatment
16 In the ASCE Report Card for America’s Infrastructure, dams received a grade of D because of the presence of
3,500 dams that are highly susceptible to failure (ASCE, 2005). The continuing functioning of these dams is important for future water supply and the other functions they provide.
FIGURE 8 RECENT PRICES FOR CRUDE OIL PER BARREL

Section 3 Trends and Uncertainties
Institute for Water Resources 24 2007-R-3
facilities during the 1970s and 1980s). The current trend is downward in large part because there are higher priorities for the use of public funds.17
During the coming decades, the continuing availability of public funds (including both Federal and state funds as well as money raised by water utilities through higher water use rates) for both water storage and transmission and water supply and wastewater disposal infrastructure will be critical to the ability of the U.S. to deal with the impacts of global warming and other trends on future water supply and use. However, the availability of funding in the future is highly uncertain; and so is the proper and effective use of these funds. Unless there is a new recognition of the need for funding water infrastructure, this situation is likely to continue during the next three decades.
3.1.6 Summary of Major Trends The external trends discussed above appear to have a varied impact on the future water demand/supply balance. Two of the five trends, namely climate change and water allocation for ecosystems, are likely to have significant impact on water availability. Climate change can decrease the annually renewable water supply in some areas and also increase demand for irrigation water. Allocation of water for ecosystems can decrease the availability of water for off-stream uses. Two of the remaining trends, namely population and economic growth and shifts in energy sources, do not appear likely to result in demand increases that would greatly change the future balance of supply and demand. Also, there is a possibility of some decline in future water supplies, or the ability to effectively use existing supplies, because of insufficient public (and/or private) funding of water storage and conveyance infrastructure.
In terms of future water needs, there seems to be a consensus that growth in water demands for off-stream uses will be significantly slower than growth in U.S. population. Therefore, in aggregate, large increases in nationwide water demands during the next 30 years are not likely to happen but they are still possible in case of unexpected demands for irrigation or energy production. As has been the case historically, problems associated with the rate of population and economic growth will likely be concentrated in specific urban or urbanizing regions of the country. Based on projected population growth alone, Figure 3 identifies potential and/or persistent problem regions that will struggle with meeting future water needs. At this point these problem areas represent local hot spots with local or possibly regional but not national impacts.
The effects of global warming and expected change in climate depend on the occurrence of climatic extremes, especially severe droughts during the next 30 years. In terms of possible adaptations, changes to water management may come about either through a response to drought episodes or through a proactive adoption of robust long term strategies for water management and development of appropriate water supply infrastructure. Judging from past experience, the adoption of a strong proactive stance by the Federal and state governments and regional and local actors is not likely. However, an exceptional drought with large agricultural
17 Barry B. Anderson, Acting Director of the Congressional Budget Office (CBO) in his letter of January 31, 2003 to
the House of Representatives Committee on Transportation and Infrastructure stated that "current funding from all levels of government and current revenues generated from ratepayers will not be sufficient to meet the nation's future demand for water infrastructure."

Section 3 Trends and Uncertainties
2007-R-3 25 Institute for Water Resources
and hydrologic impacts could bring the issue of preparedness for climate change to the national agenda.
Finally, the uncertainty surrounding the future energy policy is not likely to have a large effect on future water withdrawals. Each of the policy choices can be accommodated with moderate increases in water withdrawals and consumptive use. Large-scale production of biofuels could be planned with efficient use of land and water resources and new capacity for electric generation could have modest water requirements if closed-loop cooling technology is used.
3.2 Other Trends and Uncertainties In addition to the major trends and uncertainties discussed above there are other factors which also deserve special consideration because they have the potential for affecting the future water supply and demand situation. These factors are related to: (1) technological advancements and breakthroughs, (2) unquantified Indian water right claims, (3) development of new water supply and transmission infrastructure and (4) international trade and demands for “virtual” water. Each of these factors is briefly discussed below.
3.2.1 Technological Advancements and Breakthroughs There are two components of technological uncertainty: development and application of information technology and breakthroughs in essential technologies.
Recent developments in information technology could be treated as a trend because they can be expected to continue into the future and their positive impacts on water management will likely be very significant. The use of Geospatial Information Systems (GIS), remote sensing (RS) technologies, global positioning system (GPS) and telemetry can provide data and information, which could greatly enhance the management of water resources in the future. Examples include the development of spatial decision support systems (SDSS) for restoration of aquatic ecosystems. These technologies can also be helpful in assessing environmental impacts and in planning and construction of water infrastructure. However, the degree to which these developments will be adopted and the way in which they will impact water management remain uncertain.
The second component, technological breakthroughs is highly uncertain. For example, a recent evaluation of desalination technologies indicated that a long-term objective for desalination is to reduce its costs by 50 to 80 percent by 2020 but this would require a major technological breakthrough.18 Also, there are needs for other technological developments, which would greatly enhance production of liquid fuels or other processes that would indirectly affect water resources. These technological uncertainties will continue into the future and no plausible assumptions can be made about the nature and timing of technological breakthroughs.
18 However, the NAS Committee found that the 50 to 80 percent cost reduction cannot be achieved through
incremental improvements in existing technologies because “...such dramatic cost reductions will require novel technologies, perhaps based on entirely different desalination processes or powered by entirely new energy sources” (NAS, 2004b).

Section 3 Trends and Uncertainties
Institute for Water Resources 26 2007-R-3
3.2.2 Unquantified Indian Water Rights Unquantified Indian water right claims represent potential future demands on the available water supplies throughout the West. It is hoped that this uncertainty could be reduced if the Federal courts define the scope of the Indian reserved water rights.
Many western states are involved in general stream adjudications which are complex and lengthy lawsuits representing the largest civil, proceedings ever to be litigated in state and federal courts (Dividing the Waters, 2006).19 The state adjudications are complicated by Federal reserved water rights for Indian tribes. These rights reserve an unknown quantity of water to fulfill the purpose for which the Federal land reservation was made. In 2006, the Western States Water Council (WSWC) passed a resolution to support of negotiated quantification of Indian water rights claims (WSWC, 2006). Adjudications in many states now use negotiated settlements to resolve the Indian water right claims.
3.2.3 Development and Funding for New Water Storage and Transmission
Changes in national water policy during the early 1980s and the persistent negative public opinion regarding the impacts of large-scale water projects will make a significant increase of Federal appropriations for building large infrastructure somewhat unlikely. Investments in new infrastructure and revitalization of old but still productive infrastructure may have to be phased in over a period of a few decades and new funding mechanisms may be required. Also, the nature of infrastructure development may be changing by adopting innovative engineering methods to store and move water while minimizing their environmental impacts.
One significant uncertainty that remains relates to the unknown geographical changes in the hydrologic cycle which may produce different water surplus and water deficit areas than those under the current climate. This makes it difficult to plan and build appropriate water infrastructure to capture and redistribute water supplies.
3.2.4 International Trade and Demands for Virtual Water Global concerns over future water scarcity have brought the attention of researchers and politicians to the concept of “virtual” water. Virtual water represents the quantity of water that is imbedded in a ton of corn or other agricultural or industrial products.
The international trade in such commodities as grains allows countries which suffer water scarcity to import virtual water by importing grains. While at the present time there is no deliberate trade in virtual water, future climatic changes may result in significant regional shifts in global food production. One possible outcome may be increasing demands for grains and other crops which are produced in the U.S. by countries with increasing water scarcity (due to global climate change or increasing population). This could result in increased demands for irrigation water in the Great Plains and other regions of the country. 19 According to the Dividing the Waters project (develpoed by a network of judges, special masters and referees who
preside over western water adjudications), some 27,000 persons have filed more than 77,000 claims to water rights in the Arizona general stream adjudication. In Idaho, more than 110,000 persons have filed 150,000 claims for water rights in the Snake River system and in Montana, approximately 80,000 persons have filed more than 200,000 water rights claims in the statewide adjudication.
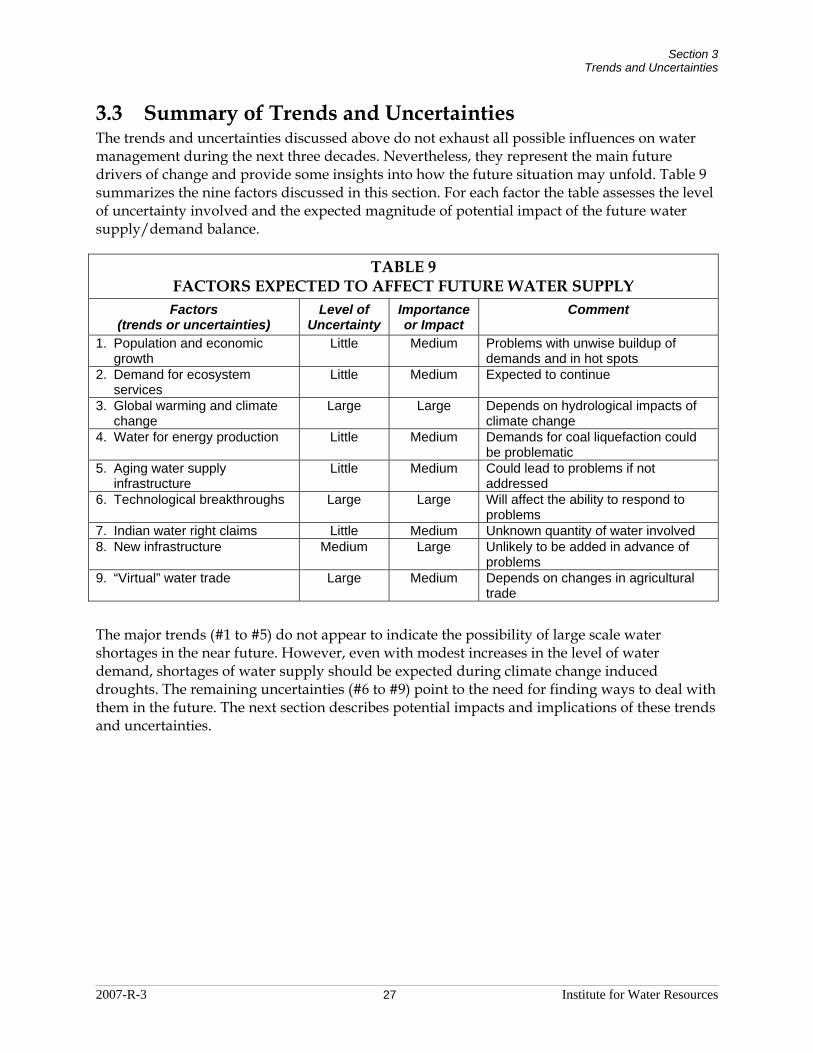
Section 3 Trends and Uncertainties
2007-R-3 27 Institute for Water Resources
3.3 Summary of Trends and Uncertainties The trends and uncertainties discussed above do not exhaust all possible influences on water management during the next three decades. Nevertheless, they represent the main future drivers of change and provide some insights into how the future situation may unfold. Table 9 summarizes the nine factors discussed in this section. For each factor the table assesses the level of uncertainty involved and the expected magnitude of potential impact of the future water supply/demand balance.
TABLE 9 FACTORS EXPECTED TO AFFECT FUTURE WATER SUPPLY Factors
(trends or uncertainties) Level of
Uncertainty Importance or Impact
Comment
1. Population and economic growth
Little Medium Problems with unwise buildup of demands and in hot spots
2. Demand for ecosystem services
Little Medium Expected to continue
3. Global warming and climate change
Large Large Depends on hydrological impacts of climate change
4. Water for energy production Little Medium Demands for coal liquefaction could be problematic
5. Aging water supply infrastructure
Little Medium Could lead to problems if not addressed
6. Technological breakthroughs Large Large Will affect the ability to respond to problems
7. Indian water right claims Little Medium Unknown quantity of water involved 8. New infrastructure Medium Large Unlikely to be added in advance of
problems 9. “Virtual” water trade Large Medium Depends on changes in agricultural
trade
The major trends (#1 to #5) do not appear to indicate the possibility of large scale water shortages in the near future. However, even with modest increases in the level of water demand, shortages of water supply should be expected during climate change induced droughts. The remaining uncertainties (#6 to #9) point to the need for finding ways to deal with them in the future. The next section describes potential impacts and implications of these trends and uncertainties.

Section 3 Trends and Uncertainties
Institute for Water Resources 28 2007-R-3
2007-R-3 29 Institute for Water Resources
Section 4 Ongoing Responses and Implications The key trends and uncertainties have already caused some responses in water management. There are a number of recent developments in water supply provisions and water management approaches which to a greater or lesser extent, represents responses of the water industry and water management institutions to the current or expected future changes in the water supply situation. These responses cannot be linked to specific trends and uncertainties; they tend to be driven by the sum of all trends and uncertainties which contributes to the overall supply/demand situation. Many of the various responses can be found in the water hot spots. The individual responses are discussed below in terms of new options for additional water supplies and changes in water management approaches.
Another important consideration concerns the implications of the trends and uncertainties for the future in terms of possible changes or reforms in water management that could evolve into a robust system capable of meeting future challenges. These water management implications are discussed in the last subsection.
4.1 New Water Supply Options This section examines some of the ongoing adaptations to both the current and expected future water resources conditions. These adaptations either aim at or already contribute to the development of a portfolio of innovative water supply options for meeting future water needs of the country. These new supply options include: (1) increasing investment in water desalination capacity of brackish and sea water, (2) desalination of brackish groundwater in the U.S. interior, (3) groundwater recharge and recovery and (4) reclamation of wastewater and impaired water.
4.1.1 Water Desalination While desalinated water makes only a very small contribution to the total water supply in the U.S (about 0.4 percent), there has been an increasing interest in desalination and in the last 20 years there has been an eight-fold increase in the total installed desalination capacity (see Figure 9).20 Presently, the location of planned or newly constructed plants can be viewed as an indicator of difficult local water supply situation in terms of water needs and available alternatives. The recently built large desalination plants in Long Beach, California and Tampa, Florida are two examples of areas facing potential future water shortage situations. In the Tampa region, the prospect of shortages is further related to regulatory constraints on groundwater resources.
The trend toward increasing water shortages in hot spots such as Long Beach, California and Tampa, Florida implies the continuation of construction of supplemental desalination plants to help meet needs for high value industrial and municipal uses of water in localities where conventional water supply options are not available. However, the high economic and energy costs of desalination will limit its application to situations where other less expensive options
20 However, in a recent report on desalination, Cooley, Gleick and Wolff (2006) concluded that desalination is not
likely to be the ultimate solution to our water problems but it will be a part of future water management.
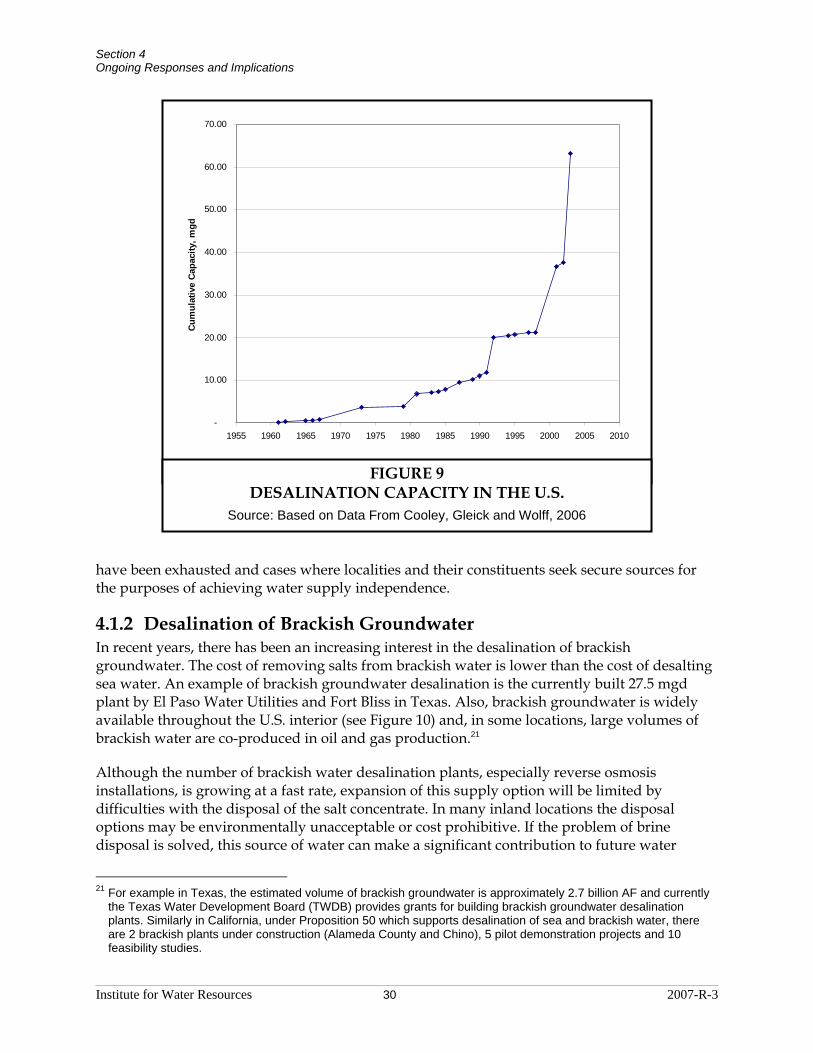
Section 4 Ongoing Responses and Implications
Institute for Water Resources 30 2007-R-3
have been exhausted and cases where localities and their constituents seek secure sources for the purposes of achieving water supply independence.
4.1.2 Desalination of Brackish Groundwater In recent years, there has been an increasing interest in the desalination of brackish groundwater. The cost of removing salts from brackish water is lower than the cost of desalting sea water. An example of brackish groundwater desalination is the currently built 27.5 mgd plant by El Paso Water Utilities and Fort Bliss in Texas. Also, brackish groundwater is widely available throughout the U.S. interior (see Figure 10) and, in some locations, large volumes of brackish water are co-produced in oil and gas production.21
Although the number of brackish water desalination plants, especially reverse osmosis installations, is growing at a fast rate, expansion of this supply option will be limited by difficulties with the disposal of the salt concentrate. In many inland locations the disposal options may be environmentally unacceptable or cost prohibitive. If the problem of brine disposal is solved, this source of water can make a significant contribution to future water
21 For example in Texas, the estimated volume of brackish groundwater is approximately 2.7 billion AF and currently
the Texas Water Development Board (TWDB) provides grants for building brackish groundwater desalination plants. Similarly in California, under Proposition 50 which supports desalination of sea and brackish water, there are 2 brackish plants under construction (Alameda County and Chino), 5 pilot demonstration projects and 10 feasibility studies.
-
10.00
20.00
30.00
40.00
50.00
60.00
70.00
1955 1960 1965 1970 1975 1980 1985 1990 1995 2000 2005 2010
Cum
ulat
ive
Capa
city
, mgd
FIGURE 9 DESALINATION CAPACITY IN THE U.S.
Source: Based on Data From Cooley, Gleick and Wolff, 2006
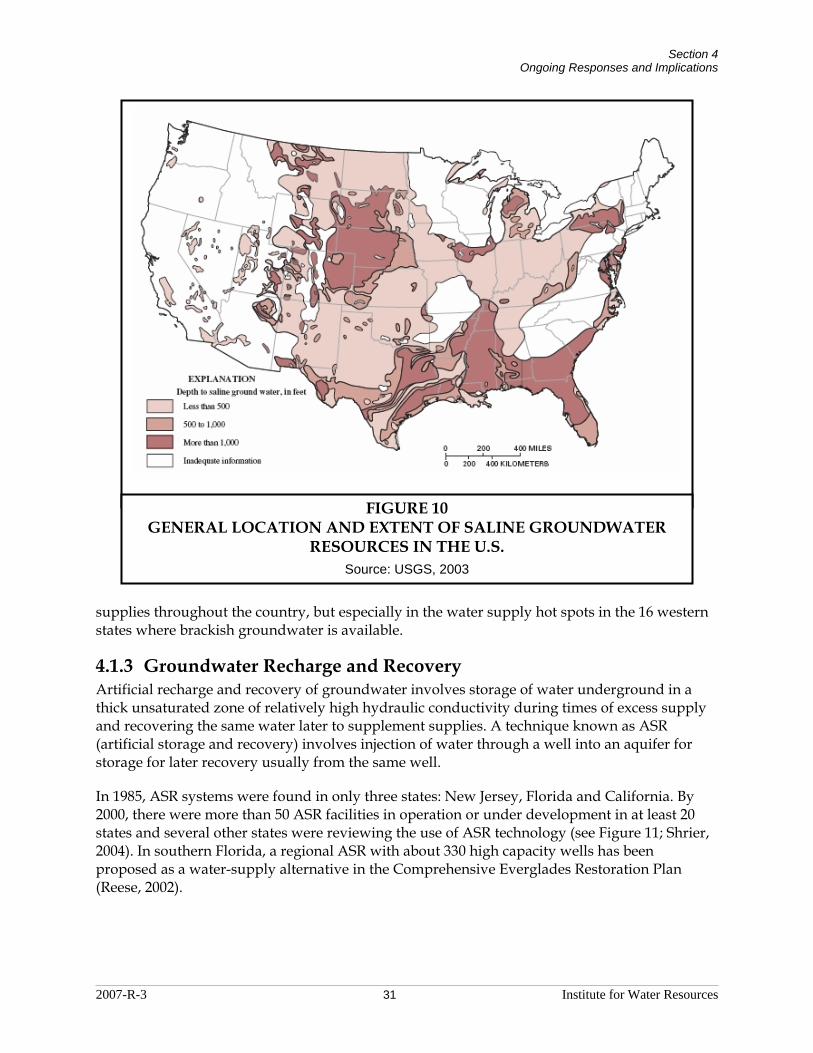
Section 4 Ongoing Responses and Implications
2007-R-3 31 Institute for Water Resources
supplies throughout the country, but especially in the water supply hot spots in the 16 western states where brackish groundwater is available.
4.1.3 Groundwater Recharge and Recovery Artificial recharge and recovery of groundwater involves storage of water underground in a thick unsaturated zone of relatively high hydraulic conductivity during times of excess supply and recovering the same water later to supplement supplies. A technique known as ASR (artificial storage and recovery) involves injection of water through a well into an aquifer for storage for later recovery usually from the same well.
In 1985, ASR systems were found in only three states: New Jersey, Florida and California. By 2000, there were more than 50 ASR facilities in operation or under development in at least 20 states and several other states were reviewing the use of ASR technology (see Figure 11; Shrier, 2004). In southern Florida, a regional ASR with about 330 high capacity wells has been proposed as a water-supply alternative in the Comprehensive Everglades Restoration Plan (Reese, 2002).
FIGURE 10 GENERAL LOCATION AND EXTENT OF SALINE GROUNDWATER
RESOURCES IN THE U.S. Source: USGS, 2003

Section 4 Ongoing Responses and Implications
Institute for Water Resources 32 2007-R-3
4.1.4 Water Reclamation Some U.S. municipalities have begun to reuse treated wastewater for non-potable uses such as irrigation of parks and golf courses. Also, there is a growing interest in augmenting the municipal water supply with highly treated municipal wastewater. According to the USGS data, the nationwide use of reclaimed wastewater has increased from about 0.5 bgd during the 1970s to 1.02 bgd in 1995 (Solley et al., 1998). This trend (depicted on Figure 12) will likely continue especially in the water short areas of the country especially in the water supply hot spots in California, Arizona, Texas and Florida.22
22 In some parts of the Tampa Bay area, upwards of 10 percent of single-family residential customers have reclaimed
water accounts.
FIGURE 11 ARTIFICIAL AQUIFER STORAGE AND RECOVERY BY STATE
Source: Shrier, 2004

Section 4 Ongoing Responses and Implications
2007-R-3 33 Institute for Water Resources
4.2 Impacts on Water Management Techniques While some of the water supply options mentioned above have been known for a number of years, more recent changes include some innovative developments in the arena of water management. These include: (1) shifting emphasis from structural to nonstructural solutions, (2) improvements in water-use efficiency and conservation, (3) evolving western water markets and water banks and (4) emerging new approaches in water governance.
4.2.1 Shift From Structural to Nonstructural Solutions The emerging emphasis on nonstructural solutions is often considered to be an important paradigm shift in water management (Gleick, 2000). Alternative terms are “soft path” solutions replacing the traditional “hard path” solutions.23
The main component of the nonstructural approaches to water supply management is the inclusion of water demand management, which focuses on improvements in technical efficiency of water use and the economically efficient allocation of available water among competing uses. 23 Amory Lovins is credited with devising the term "soft path" to describe a process of gradually replacing centralized
energy systems based on fossil and nuclear fuels with efficiency improvements and renewable energy sources. (Rocky Mountain Institute, 2004).
0.00
0.20
0.40
0.60
0.80
1.00
1.20
1950 1960 1970 1980 1990 2000
Rec
laim
ed W
ater
Use
- bg
d
FIGURE 12
RECLAIMED WATER USE IN THE U.S. Source: Solley et al., 1998
Section 4 Ongoing Responses and Implications
Institute for Water Resources 34 2007-R-3
On the supply side, the soft path approaches include various distributed and decentralized approaches to both the development and protection of the existing water resources systems. These may include micro-dams, low-head hydro, small satellite water supplies and other “green” solutions.
The implication is that traditional engineering objectives of developing and protecting water supplies are likely to be achieved more incrementally, with the objective of deferring large-scale and environmentally damaging investments in water infrastructure. This certainly is a new paradigm that will create new challenges for water engineers and water resources managers. However, the engineering community may use climate change to rationalize the need for large scale structural solutions; although it does not seem likely that such a solution would be readily adopted under the current environmental policy or until there is sudden and devastating climate change toward extreme conditions.
4.2.2 Improvements in Water Efficiency and Reallocation Today, many water professionals share the view that improvements in water use efficiency are critical to our ability to support the needs of a growing population and economic development without degrading the natural environments and ecosystems that sustain water supply systems. Such improvements are usually undertaken by water providers and water users within urban, industrial and agricultural sectors where increased efficiency can free up significant quantities of water by meeting the existing needs of individual users and uses with less water.24 It is likely that the water efficiency improvements will continue during the next three decades.
Any water that is saved through increased efficiency in water use can be kept in reserve or applied toward the expansion of the same purpose of use (by the same user or other users) or it can be reallocated to other sectors. However, when the potential for saving water through efficient use has been fully exploited and all available water is appropriated, new uses can only be accommodated at the expense of existing uses. Because irrigated agriculture is responsible for the major portion of freshwater withdrawals, irrigation water is an obvious target for reallocation to industrial, domestic and environmental purposes.
4.2.3 Evolving Western Water Markets and Water Banks Limited water supplies in the western states can be allocated among competing uses through the market mechanism by trading water volumes and/or water rights.25 However, Howitt and Hansen (2005) concluded that the water markets in the western states are evolving slowly because there are many institutional impediments to water transfers, especially environmental and economic externalities and third party impacts in exporting regions. Some of these difficulties are mitigated by organizing water banks which are created to facilitate water transfers during periods of low water supplies (Clifford et al., 2004). Water banks are growing
24 During the last 25 years, there were significant reductions in water withdrawals per employee and per kilowatt-hour
of thermoelectric generation (Dziegielewski et al., 2002). 25 Adams et al. (2004) reported 1,933 leases or sales of water rights in the 14 (out of 17) western states during the
period from 1990 to 2003. During the 1999 to 2002 period, the volume of the reported water transactions was 8,140 thousand AF (Howitt and Hansen, 2005). This is an average annual amount equivalent to about one-eighth of the average annual flow of the Colorado River. Typically farmers were the sellers of water rights and municipal water providers were the buyers.
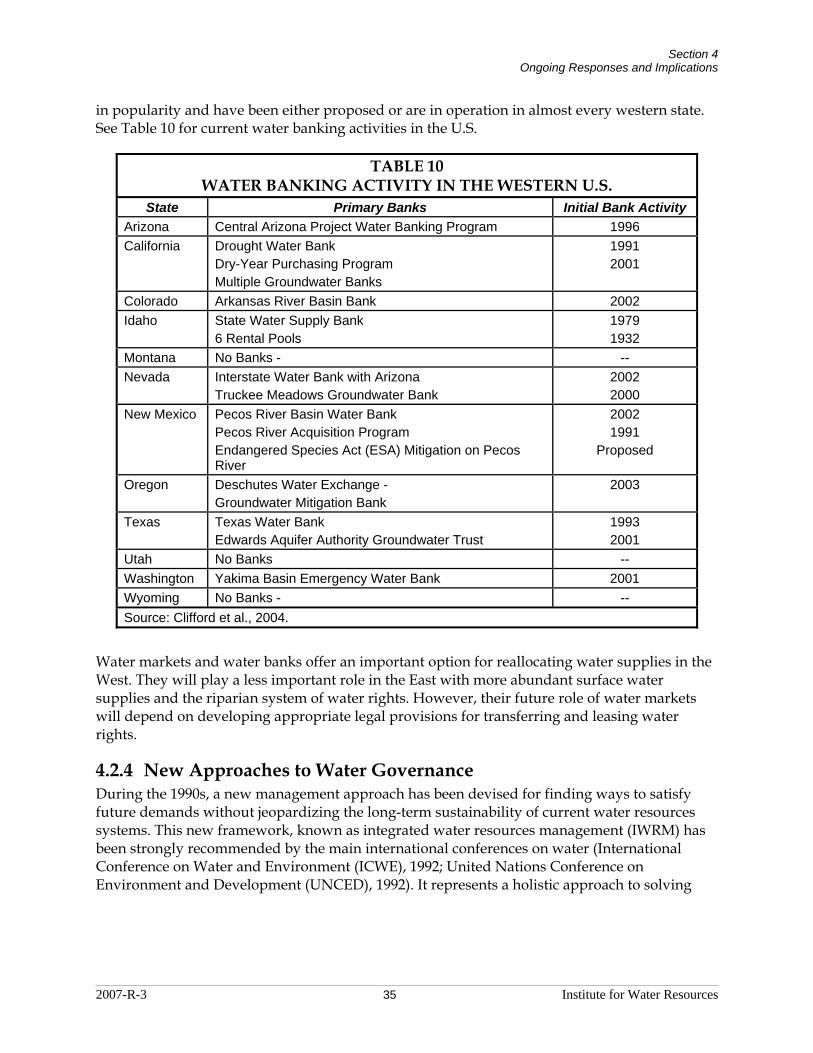
Section 4 Ongoing Responses and Implications
2007-R-3 35 Institute for Water Resources
in popularity and have been either proposed or are in operation in almost every western state. See Table 10 for current water banking activities in the U.S.
TABLE 10 WATER BANKING ACTIVITY IN THE WESTERN U.S.
State Primary Banks Initial Bank Activity Arizona Central Arizona Project Water Banking Program 1996 California Drought Water Bank
Dry-Year Purchasing Program Multiple Groundwater Banks
1991 2001
Colorado Arkansas River Basin Bank 2002 Idaho State Water Supply Bank
6 Rental Pools 1979 1932
Montana No Banks - -- Nevada Interstate Water Bank with Arizona
Truckee Meadows Groundwater Bank 2002 2000
New Mexico Pecos River Basin Water Bank Pecos River Acquisition Program Endangered Species Act (ESA) Mitigation on Pecos River
2002 1991
Proposed
Oregon Deschutes Water Exchange - Groundwater Mitigation Bank
2003
Texas Texas Water Bank Edwards Aquifer Authority Groundwater Trust
1993 2001
Utah No Banks -- Washington Yakima Basin Emergency Water Bank 2001 Wyoming No Banks - -- Source: Clifford et al., 2004.
Water markets and water banks offer an important option for reallocating water supplies in the West. They will play a less important role in the East with more abundant surface water supplies and the riparian system of water rights. However, their future role of water markets will depend on developing appropriate legal provisions for transferring and leasing water rights.
4.2.4 New Approaches to Water Governance During the 1990s, a new management approach has been devised for finding ways to satisfy future demands without jeopardizing the long-term sustainability of current water resources systems. This new framework, known as integrated water resources management (IWRM) has been strongly recommended by the main international conferences on water (International Conference on Water and Environment (ICWE), 1992; United Nations Conference on Environment and Development (UNCED), 1992). It represents a holistic approach to solving
Section 4 Ongoing Responses and Implications
Institute for Water Resources 36 2007-R-3
water problems in which plans for the utilization and protection of water resources are coordinated among many stakeholders.26
In the U.S., the IWRM framework is beginning to gain some recognition (USACE, 2005a). However, G.E. Galloway points out that the proponents of IWRM may not understand that its implementation in this country could dramatically alter the lead role of the Federal government in water planning and management (USACE, 2005b). The IWRM could move the current Federally-driven approach to water resources planning to one driven by bottom-up initiatives with full stakeholder participation in decision making (although the more feasible alternative is a regional approach with Federal funding and full stakeholder participation).
4.3 Implications for Future Approaches The trends and uncertainties discussed earlier indicate that the future situation in balancing water demand with available supply will gradually become more difficult even without the dramatic impacts that could accompany global climate change. But there is also the possible scenario of prolonged climate change-induced drought with large geographical extent, under which the existing water supply and allocation systems would come under even more severe tests. This section considers the likely approaches to handling these two scenarios and outlines the elements of an ideal water management system.
4.3.1 Slow vs. Dramatic Changes The scenario of a gradual “squeeze” upon water availability brought about by increasing demands and increasing competition for available supplies could be handled by the present system of water management by finding and implementing the best solutions to emerging imbalances in water supply and demand. Because this process will most likely start in the water supply hot spots, the solutions would likely be local and would not require intervention by the state or Federal governments. Similarly to the case of Tampa Bay Water, local entities would pool their financial resources and consolidate political influence to ensure adequate water supplies.27 A concern of this “bottom-up” mode of response to worsening conditions is that the cost of feasible solutions could be higher and the lead times for finding and implementing these solutions much longer than if the localities received some forms of assistance from states and/or the Federal government. The assistance could be in the form of streamlining the process for obtaining environmental permits, state statutes to enable anticipatory actions or even state/Federal involvement in developing larger scale regional water supply systems. The assistance would become critical if the hot spot areas would expand to encompass large intrastate regions or would cross state boundaries.
The situation and responses in the hot spot areas described earlier or even in entire states of California, Arizona, Nevada, Florida and Texas can serve as examples of how the gradually increasing pressure on available water resources will impact water management in other states
26 The IWRM framework provides for an explicit consideration of water demand management along with water policy
and strategy, water legislation and standards, institutional framework, participatory planning and management, allocation across (sub)sectors and conflict resolution, functions and values of water resources, and transboundary issues (GWP, 2000).
27 It is interesting to note that in 2001 local government expenditure on public water supply was more than seven times the budget of USACE (USACE, 2005b).

Section 4 Ongoing Responses and Implications
2007-R-3 37 Institute for Water Resources
in the coming decades. By 2035, today’s conditions in Florida will likely be found in Georgia and Alabama. The situation in the southwestern states of California, Nevada, Arizona and New Mexico, will likely expand to the neighboring states to the north and east. Water supply hot spots are already present in all of these states.
The scenario of the dramatic change in water availability due to a prolonged drought would be much more difficult to manage then the gradual “squeeze” because of abrupt decrease in supplies over a large portion of the country. The economic and environmental impacts of water shortages would certainly mobilize Federal and state resources for drought relief and may also lead to more substantial and steady investments in water supply infrastructure. Depending on the severity of impacts and whether or not the cause of drought was attributed to climate change, an extraordinary response by all levels of governments and private sector organizations could be mobilized. However, our past experience with droughts indicates that the effectiveness of such a response would be limited. The best approach to coping with droughts must include mitigation and preparedness.
4.3.2 Robust and Flexible Water Management Approach The costs of coping with future difficulties in balancing water demands and supplies could be reduced with improvements to the nation’s system of water management. A robust and flexible management system would have resiliency to withstand the impacts of climate change and increased competition for water supplies and would also be able to balance future demands with available supplies in a way that minimizes the total social costs of the necessary adjustments or interventions.
The development of new water management systems will not be easy and will require input from many stakeholders at all levels of government. The discussion of the desirable features and approaches to a nationwide reform of water management would exceed the scope of this paper. However, one can identify some of the important elements of such a reform, which are presented below in the form of things that could be done in order to enhance the nation’s ability to withstand future problems in water demand, supply and allocation. These may include:
1. Facilitating voluntary reallocation of significant amounts of water from agriculture to urban, industrial and in-stream uses through enabling Federal and state legislation, which would permit both temporary transfers (or leases) of water and sales of water rights in all regions of the country.
2. A streamlined process across the country for reallocation of water storage in the existing surface water reservoirs from flood control and other purposes to water supply while providing alternative means for flood management and while addressing the willingness-to-pay for water supply by the interested cities and urban centers.
3. Collaborative planning for regional water supply solutions (including options for water demand management) by Federal and state agencies in intrastate and interstate regions that experience imbalances of water demand and supply.
4. Development of surface water storage and groundwater reserves (through artificial groundwater recharge) in mountainous regions of the country to capture winter

Section 4 Ongoing Responses and Implications
Institute for Water Resources 38 2007-R-3
precipitation and early spring snowmelt in order to increase the current water storage reserves for multi-year droughts.
5. Significant investment of Federal funds in the rehabilitation and some new development of water supply and conveyance infrastructure, especially in regions which are most vulnerable to adverse impacts of climate change.
6. Development of supplemental desalination capacity of brackish groundwater to provide additional water supply for municipal, industrial and irrigation in both Eastern and Western regions of the country.
These suggested enhancements to the current system do not exhaust all the possibilities. Other options are available and yet others could emerge in the future. In addition to the implementation of these solutions there is also a need to redefine the roles of Federal, state and local governments. Implications for government roles are discussed in the next section.

2007-R-3 39 Institute for Water Resources
Section 5 Future Roles and Responsibilities 5.1 Current Roles As mentioned earlier, the Federal government continues to have a lead role in the development and management of water resources in the nation. However, Federal water governance is not exclusive and state and local users of water play important roles in making water allocation and use decisions. The role of states and local communities was increased in the 1980s under the Reagan administration’s “new federalism” which resulted in increased cost sharing with states. The 1986 Water Resources Development Act introduced cost-sharing requirements for Corps and USBR projects. According to Gerlak (2005), the current Federal role can be described as a “pragmatic federalism” that emphasizes collaborative partnerships with more shared power and decision making.
Given the current level of involvement in water resources by several Federal agencies, it is not likely that the Federal role in water supply will diminish during the next three decades. It is difficult to imagine how the water challenges related to the global climate change could be met without Federal involvement. Also, the Federal role will be important because of the geographical scale of climate change and the ability of Federal institutions to provide high quality data and analysis that regional and local entities could use.28 However, the uncertainty about the future roles relates primarily to the role of the Federal government and specifically the nature of its involvement in water supply and whether its role will be largely the same as it is today.
5.2 State and Local Roles The provision of water supplies is primarily a local responsibility. Regional agencies and state governments also play important roles in ensuring that localities have adequate water supplies. There are also Federal-state partnerships which are formed to address difficult problems in water supply at the state and regional levels. This section provides a brief summary of the roles at these governmental levels.
5.2.1 Local Roles in Water Supply As a provider of municipal services and water delivery infrastructure, water utilities have a key position in supporting public health and economic activity. It will continue to be the responsibility of water utilities and local governments to secure water supplies, treat and distribute water to end users and, in essence, act as conduits through which water is allocated among different primarily off-stream human uses. All cities and municipalities regard an adequate supply of water as an essential service to ensure public health and safety, economic growth and community well-being. The water supply industry accommodates this need through “on demand” delivery of high quality water in sufficient quantities and at suitable pressure for consumption and fire protection. No change in this fundamental mission is foreseen in the future and local water providers will continue to be “first responders” in dealing with water supply and demand imbalances. 28 The recent emphasis on homeland security and the Hurricane Katrina fiasco could be taken as the indication of the
likely greater role of Federal agencies in response to water-related disasters in the future.
Section 5 Future Roles and Responsibilities
Institute for Water Resources 40 2007-R-3
As local hot spots broaden, more local governments will compete for supplies at broader regional and societal levels to serve urban water customers. Even now, the “ecological footprints” of many water utilities extend a long distance depending on demand and the location of available supplies (Dziegielewski, 2000).
The ability to meet the demand for water will continue to be stressed sporadically and simultaneously by economic growth, land development pressures and environmental considerations. At any particular point in time in the future, several communities within a region will be expressing a desire to augment existing water supplies to accommodate expected growth, attract growth that will enhance economic prosperity and reduce the risks associated with drought.
In a status quo future with regard to institutional arrangements, several barriers will continue to prevent or delay actions for securing additional municipal water supplies, particularly if additional surface water is the only feasible supply alternative. Multiple demands on streams from other competing purveyors, in-stream users and natural habitat will continue to present conditions where selection among alternatives and project justification will come under intense regulatory scrutiny. Future increases in surface reservoir capacity will be modest, as remaining opportunities for adding storage capacity will be restricted due to environmental concerns and the societal value placed on water left in the stream (Frederick, 1995). Meanwhile, contamination and drawdown of groundwater sources will constrain the long-term sustainability of substituting groundwater for surface extraction (Frederick, 1998).
The real cost of supplying water to urban consumers will continue to rise because of these factors, as well as a result of higher water treatment costs and costs associated with rehabilitation of aging infrastructure.29 More emphasis will be placed on improving water use efficiency, although the effective supply from such efforts will not be enough to accommodate growth in demand. Thus, over the long run, municipal water may not always be supplied wherever and whenever it is demanded or at least not without significant costs and planning difficulties.
5.2.2 State Roles States could play important roles in ensuring adequate water supplies for both urban and other uses of water. Many states develop “water plans” which examine the water supply and demand situation and make provisions for helping local entities to cope with water shortages and plan for additional water supplies.
Using Texas as an example, Mullican (2003) suggested that the most appropriate and effective role for the state has been “…establishing planning guidelines, providing technical support, resolving interregional conflicts regarding utilization of existing supplies and providing funding necessary for the planning effort.” He also stated that by 2050, almost 900 Texan cities, representing 38 percent of the projected population will have to reduce demand or develop additional supplies to achieve water supply/demand balance during droughts.
29 It is anticipated that nearly $1 trillion will be required over the next 20 years to keep up with the nation’s water and
sewer needs. Veritably, adequate water supply for cities is cited as one of the top five national water challenges for the 21st century (Planning and Management Consultants, Ltd., 2001).
Section 5 Future Roles and Responsibilities
2007-R-3 41 Institute for Water Resources
Grigg and Vlachos (1993) concluded that state governments have logical roles in managing for water supply during times of shortage that fall into five categories: planning; coordination, mainly through task forces; data and technical assistance; emergency aid to local governments and agriculture; and regulatory actions, mainly in restricting water use.
5.2.3 The Role of Federal-State Partnerships Federal-state partnerships can be used in resolving difficult water allocation problems in water short areas of the country. Representing a collaboration of 25 state and Federal agencies, the CALFED Bay-Delta Program is one example of cooperative efforts to allocate scarce surface water supplies on regional and intrastate basis. The overall goal of CALFED is to reduce water shortages in California by rehabilitating water infrastructure in the Bay Delta system while restoring and protecting Delta’s ecosystems.
The CALFED Bay-Delta Program could serve as a model in terms of a formal attempt to overcome the fragmented Federal, state and local missions, responsibilities and interests with respect to water supply and related water resources needs (Planning and Management Consultants, Ltd., 2000). Federal-state partnerships like CALFED could “streamline regulatory requirements for developing water supply through interregional transfers, additional storage and new conveyance infrastructure and could be a means of securing steady Federal obligations.”
5.3 Federal Involvement in Water Management Historically, the Federal government has had a prominent role in water resources development, management and protection.30 However, the role of the Federal government, and more specifically the accepted and permitted nature of Federal involvement in water supply, can be a source of both political and philosophical debate. There is a Federal interest in certain aspects of water resources and that interest has been defined and redefined over time. One analysis (USACE and Planning and Management Consultants, Ltd., 2003) reviewed the historical issues and arguments that had changed the recognized Federal interest over the last 200 years and concluded that three things were required:
1. Federal involvement had to be constitutional. 2. Benefits had to spill over state or local political boundaries. 3. Benefits were unlikely to be realized without Federal intervention.
On this basis there will not be a Federal interest in developing local water supply projects, but there could be an interest in regional or special case projects (such as the small water supply projects USDA provides to tribes and other isolated populations, especially those who have lost local supplies due to water quality issues).
In the context of water supply, the Federal role has indeed evolved from one of a direct investor in reclaiming western lands and source supplies to a manager and maintainer of existing facilities and regulator of the broader environmental landscape. The historical course of the
30 Many water professionals and scholars of U.S. water management confirm the importance of the Federal
involvement; however, almost invariably they are critical of the lack of coordination and collaboration among Federal water agencies (Rogers, 1993; AWRA, 2002, 2005; USACE, 2005; UCOWR, 2000).

Section 5 Future Roles and Responsibilities
Institute for Water Resources 42 2007-R-3
Federal role in water supply (quantity) has been strongly correlated both with the emergence of environmental values and constraints on and competition for Federal funds. These factors will continue to influence, if not drive, the nature of Federal involvement in water supply in the future.
The ongoing adaptations discussed in this paper tend to be local initiatives but almost all of the options discussed face serious limitations when considered at broad regional, interstate and national scales. The review of the trends and uncertainties seem to imply that Federal involvement in water management is not going to diminish during the next three decades. It is possible that Federal involvement will increase if the anticipated water resources challenges gradually overwhelm the capacity of most states and regions to deal with them. A key unknown is the nature of future Federal involvement and whether it will be largely passive, for example, limited to regulatory oversight, technical support and coordination assistance or more active, for example providing substantial monetary investments in existing and new water storage and delivery infrastructure.
5.4 Implications for U.S. Army Corps of Engineers Civil Works
Because of its regulatory function and the amount of water that is currently stored in its reservoirs, it is plausible to assume that in the future the Corps will remain as an important institution to provide and manage U.S. water resources. The question, or key uncertainty, is the degree to which the Corps will be involved in the area of water supply and how the future Corps’ role might contrast with current water supply authorities, policy and policy interpretation.
5.4.1 Existing Authorities and Policy Consistent with Federal law, Corps policy views the provision of water supply as primarily a state and local issue and legislative authorities in the context of water supply are limited in scope. Under existing authorities the Corps can:
Contract for the sale of surplus water (normally small amounts and limited in term).
Include storage for water supply in new multipurpose projects and modify and reallocate water supply storage, modify and reallocate storage in existing Corps water supply reservoirs.
Manage reservoir storage and release to enhance water supplies managed by others.
Provide technical planning assistance.
Exercise regulatory review under Section 404 of the Clean Water Act.
Current Corps policy for reservoir construction and storage prohibits development of single-purpose water supply projects, although storage for water supply can be permitted as one of multiple purposes in a multipurpose project. Current policy permits reassignment of the use of storage space in a reservoir project to a higher and better use, including water supply.
Section 5 Future Roles and Responsibilities
2007-R-3 43 Institute for Water Resources
However, cost sharing requirements for water supply storage and reallocation are restrictive, as costs are borne 100 percent by the users of the storage. Most importantly, the Corps has not started a new reservoir for decades and it is unlikely that it will start building traditional on-stream reservoirs in the near term future because the impacts to fisheries would prohibit construction.
Existing authorities for reservoir storage reallocation depend on the amount of water that is to be reallocated and the possibility of deleterious effects on other purposes. Up to 499 AF can be reallocated with approval at the Corps Division level. Corps Headquarters can approve reallocations for quantities not exceeding 15 percent of total storage capacity or 50,000 AF (whichever is less). Larger reallocations that exceed the 15 percent/50,000 AF threshold are referred to the Secretary of the Army. Meanwhile, reallocations that present serious effects on other purposes or major structural/operational changes require Congressional approval.
The restrictive nature of existing Federal laws, policies and fundings has left the Corps in a classic catch-22 situation. States and localities are taking the initiative for seeking out water supply alternatives, which is consistent with Corps policy. However, in doing so, because of the previously noted restrictions, these entities more often than not perceive Corps involvement as a barrier and are more likely to encounter the Corps in regulatory proceedings than engage the Corps as a partner. This “problem” presents the Corps with its single best opportunity to help, which is to lead regional water supply planning studies that would facilitate the design of the most cost-effective and environmentally friendly water supply options, thus reducing the cost and length of the permitting process.
5.4.2 Evolving and Future Possibilities The future role of the Corps in water supply will necessarily depend on making full use of current policies, becoming more nimble in responding to regional water supply issues and reevaluating its interest and role in water supply development. Some changes to existing policies and authorities will require significant legislative action, but the most important change—regional water supply studies to support regulatory decisions—could begin without new authorization if General Expenses (GE) funding for watershed studies established in fiscal year 2006 were continued.
5.4.2.1 Provide Guidance on Water Supply to Those Requesting Permits Under Section 404
The regional planning studies would complement the Corps pivotal role in water supply as a regulator. It is important to note, however, that no new multiple purpose reservoir projects have been constructed by the Corps in the past 20-years (i.e., since the enactment of the 1986 Water Resource Development Act) so all new supplies must come from reallocations and/or project modifications. The Corps’ role in the dredge and fill permit program under Section 404 of the Clean Water Act effectively places it in a position to manage much of the nation’s water supply, as almost two-thirds of public water supplies are tied to surface sources (Planning and Management Consultants, Ltd., 2000). Rather than being viewed as an adversary, the Corps may take this unique opportunity to provide guidance to water systems seeking to augment supplies in order to ensure that all relevant alternatives have been properly investigated and that documentation on the demonstration of need has sufficient information and analytical

Section 5 Future Roles and Responsibilities
Institute for Water Resources 44 2007-R-3
merit to support permitting decisions. All new capital costs assigned to water supply must be repaid during the period of construction, costs assigned to the water supply user of reallocated storage (normally the updated cost of storage) may be repaid over a 30-year period and all the yearly operation, maintenance and replacement costs assigned to water supply must be repaid yearly.
5.4.2.2 Examine Water Reallocation at Corps Reservoirs Holistically and Regionally Another practical short-run course of action might be to actively seek out opportunities to increase the value of existing reservoir storage for water supply, but it is not clear that there are any reallocations with real promise that have not been pursued. In shortage-prone and high-growth areas reallocation of storage to water supply purposes, either through project modification or change in system operations is likely to yield higher and more immediate project benefits. The Corps should study reallocation benefits holistically across its reservoirs in order first to prioritize and next to market this potential.31 Water hot spots in Texas and the southeastern U.S. would seem to be the geographic areas for which reallocation would provide the most urban water supply benefits, but climate change could make the Northwest more important, as both the water supply storage and the flood threat provided by snowpack is eliminated. Although the USBR does not manage its reservoirs using allocation of storage (most of its releases are based on water rights and contracts), the same concept applies. Even without, but especially with climate change, we have an obligation to ask whether Federal storage now used for agriculture will be needed for instream and urban use in the future. The Corps planning skills could be useful in such assessments, which would need to be done so that license renewals for USBR water could proceed in a timely fashion when they come due.
5.4.2.3 Refine Guidance to Restore Wetlands Environments to Increase Both Water Supply and Water Quality
Another promising short-run innovation is directly related to the Corps critical mission area of ecosystem restoration. Specifically, the restoration of wetlands and riparian areas has the potential to increase both the quantity and quality of water available for water supply. The Corps has the engineering expertise to effectively design wastewater reuse projects by means of constructed wetlands. Furthermore, restoring wetland environments can naturally enhance groundwater recharge processes and, if carefully planned, reverse the current rate of degradation and drawdown of critical water supply aquifers. Furthermore, the planting of switchgrass may be a management measure that is consistent with restorative processes, which may provide an indirect link between restoration and supply of raw material for biofuel production. It is possible that such use of the ecosystem restoration authority will become a strategic advantage for the Corps, especially if groundwater becomes viewed as a renewable and recoverable national asset and the increased demand for biofuel is realized. However, the implications for cost sharing of large scale groundwater and related restoration projects are not clear. Unbundling projects of this nature into multiple purposes (such as restoration, water supply and energy/agricultural production) would serve to undermine the innovative use and interpretation of existing policies, particularly if water supply continues to be funded at 100 percent non-Federal cost.
31 Note that funding is included in the President’s fiscal year 2007 budget for a new $300,000 initiative to develop a
comprehensive and objective screening on a national basis using uniform metrics to select the best candidates for site-specific reallocation studies.
Section 5 Future Roles and Responsibilities
2007-R-3 45 Institute for Water Resources
5.4.2.4 Focus on Planning Assistance to States for Complex Regional Water Resources Issues and Use Shared Vision Planning
The outlook of increasing stress on water supplies and demands for in-stream uses suggests that planning and management innovations will be required at larger geographical scales in the future. Because of its geographical management structure, the Corps is in a uniquely advantageous position to play a key role in cross-jurisdictional watershed issues. Under its current planning and assistance authority to states, the Corps will likely be asked to focus its attention on complex regional water supply issues that affect multiple stakeholders and impact multiple economic and environmental resources. The Corps has pioneered a collaborative process called “Shared Vision Planning” that has been used to integrate human preferences and scientific data to gain consensus and take action on issues involving water supply. The Corps is capable of setting the example in water supply planning by being a principal intermediary and decision-support outlet for water supply projects that require an integrated economic-environmental-engineering perspective to be successful. Federal-state partnerships for dealing with complex water supply and environmental issues, such as CALFED, would seem to be an ideal means of sharing Corps expertise.
5.4.3 Future Roles for the Corps While looking outward and taking full advantage of its existing authorities, the Corps should be introspective about its long-term interest in water supply development. Though the Corps cannot meaningfully affect the exogenous trends outlined in this paper, it can take full stock of its opportunities in affecting and promulgating those adaptations that seek to provide flexibility in confronting an uncertain future. Independent of existing constraints, the Corps has the human capital and know-how to develop physical infrastructure, model complex systems and referee water disputes. This type of toolset will be increasingly needed to support flexible movement of water to the most highly valued uses both over time and distance. The Corps does not hold a monopoly on these skills, but, as a Federal water management agency operating across all 50 states, has a comparative advantage and perhaps an obligation in applying such expertise to large problems.
In the future, traditional engineering objectives in water supply infrastructure will have to be met through the use of creative approaches to reduce environmental impacts. Therefore, it is not out of the question that the Federal government will reassess its fundamental interests in water supply. Similar to the historic experience with flood control, there may become increasingly severe national consequences from local water supply imbalances or persistent misallocations. Given that the prevailing engineering practices of the future will likely embody smart designs that balance economics and the environment, this could lead to changes in legislative authorities, cost sharing policies and the emphasis of Federal involvement.
To be proactive, the Corps should contemplate developing legislation to determine for which regions and under which conditions it could be the lead agency or Federal partner for:
1. Building single-purpose regional water supply reservoirs with full cost recovery to preemptively obviate the need for more costly, environmentally damaging local projects to support urban development or energy-related crop irrigation projects.

Section 5 Future Roles and Responsibilities
Institute for Water Resources 46 2007-R-3
2. Building intra- and interstate conveyance systems to provide the capacity to reallocate water over greater distances or improve system operations among existing reservoirs that are in relatively close proximity.
3. Designing or managing regional water marketing systems that permit efficient and ecologically sensitive transactions (i.e., water flows) between buyers and sellers, across watersheds or basins or over multiple economic and environmental purposes.
Recent technological and management adaptations and innovations present a strong conceptual case for Federal-level perspectives and preparedness along these lines and the Corps should not be limited in its future ability to prepare appropriate response because of its current activities.

2007-R-3 47 Institute for Water Resources
Section 6 Conclusions The assessment of trends and uncertainties described in this paper provides information on how the availability and use of water across the U.S. could change during the next 30 years. The expected changes have some implications for future water management and the roles of Federal, state and local water management institutions. The review of the existing water supply and demand situation and water management responsibilities and the examination of the expected impacts and implications for future changes lend support to the following conclusions.
1. Information on the availability and allocation of water resources at the national, state and regional levels is not readily available or does not exist. There is information on water withdrawals by counties and states developed under the National Water Use Information Program (NWUIP) of the U.S. Geological Survey (USGS) but there is no geographically matching data to compare the observed water use with water supply availability. A national assessment of the availability and allocation of water resources combined with an expanded scope of the NWUIP would be necessary in order to more precisely identify areas in all states and territories where the water supply situation is difficult and likely to worsen in the future.
2. Within the present system of water management, there are numerous impediments to achieving optimal allocation of water resources. Most of the obstacles are of institutional nature and involve the conflicting responsibilities of Federal, state or local institutions as well as laws and regulations. Future challenges in water management, especially those related to climate change, will likely create greater demand on the effectiveness of the institutions and existing legal arrangements for water allocation.
3. The major trends which are expected to affect water resources during the next 30 years are not difficult to identify and can be substantiated by the available data and information. There is good agreement between trends identified here and trends which were identified independently by other analysts. Among the five major trends identified here, global climate change is the most external and largely beyond our control. The other four trends, including population and economic growth, increasing water demands for production of energy, ecological and in-stream water needs and decline in water infrastructure, remain to some extent under planning and management controls and could be influenced to prevent crisis situations in different geographical regions of the country.
4. The uncertainties about future developments can also affect the water supply/demand situation by either mitigating or worsening the expected outcomes of the major trends. The uncertainties surrounding the impacts of climate change have the greatest potential for worsening the future balance of supply and demand, particularly if climate change is abrupt. Meanwhile uncertainties associated with technological breakthroughs, funding for infrastructure and Federal involvement could work to the nation’s advantage and contribute to substantial improvement in our ability to deal with future problems.

Section 6 Conclusions
Institute for Water Resources 48 2007-R-3
5. The Federal government historically played a broad, but not a dominant, role in the provision of water supply for municipal, industrial and agricultural water supply. About one-third of all storage of surface water is under Federal control. The key Federal role in water supply today is the Corps’ role as a regulator. Almost any local surface water supply project will require a Corps permit and the permit process imposes decision criteria and public interest review that can significantly change the development of these projects. The need for Federal subsidy for water supply will remain, but will be limited to assistance to areas where the local capacities to deal with water scarcity and allocation are overwhelmed.
The overall conclusion of this review is that the cumulative impact of the five major trends is not likely to result in a catastrophic situation during the next 30 years unless the uncertainties about the trends and other developments shift the expected outcomes into the realm of serious crises, such as a prolonged and severe drought of large geographical extent combined with unwise build-up of water demands, especially in the current water supply hot spots. The assessment of the existing capacities in water supply and options for increasing these capacities in the future indicates that the country can handle even the “worst case” water shortage scenario, but the impacts and the cost of coping mechanisms would be reduced with proactive Federal involvement and a reformed system of water management.

2007-R-3 49 Institute for Water Resources
Bibliography Adams, J., D. Crews and R. Cummings, 2004. The Sale and Leasing of Water Rights in Western
States: An Update to Mid-2003. Water Policy Working Paper #2004-004. Prepared by North Georgia Water Planning and Policy Center Georgia State University, Andrew Young School of Policy Studies.
American Society of Civil Engineers (ASCE), 2003. 2003 Report Card for America's Infrastructure, Progress Report. Reston, VA.
—, 2005. 2005 Report Card for America's Infrastructure. Reston, VA.
American Water Resources Association (AWRA), 2002. The 2002 AWRA National Water Policy Dialogue. Washington. D.C. http://www.awra.org/news/policy-dialogue.html
—, 2005. The Second AWRA National Water Policy Dialogue. Tucson, AZ. http://www.awra.org/meetings/Tucson2005/
Anderson, B.B. Acting Director of the Congressional Budget Office. January 31, 2003. Letter to House of Representatives Committee on Transportation and Infrastructure.
Brown, T. C., 2000. Projecting U.S. Freshwater Withdrawals. Journal of Water Resources Research. 36 (3): 769-80.
Chan, M., J. Duda, S. Forbes, T. Rodosta and R. Vagnetti, 2006. Emerging Issues for Fossil Energy and Water, DOE/NETL-2006/1233 , U.S. Department of Energy, National Energy Technology Laboratory, June 2006. www.netl.doe.gov
Clifford, Peggy, Clay Landry and Andrea Larsen-Hayden, 2004. Analysis of Water Banks in the Western States. Washington State Department of Ecology & WestWater Research LLC. July 2004, Publication No. 04-11-011. http://www.ecy.wa.gov/ pubs/0411011.pdf
Congressional Budget Office (CBO), 1997. Water Use Conflicts in the West: Implications of Reforming the Bureau of Reclamation’s Water Supply Policies. August 1997. Washington D.C. http://www.cbo.gov/ftpdocs/0xx/doc46/wateruse.pdf
Cooley, H., P. Gleick and G. Wolff. 2006. Desalination, With a Grain of Salt: A California Perspective. Pacific Institute, Oakland, CA.
Dividing the Waters. 2006. http://www.dividingthewaters.org/about/index.php
Dziegielewski, B., 2000. Efficient and Inefficient Uses of Water in North American Households. Proceedings of IWRA's Xth World Water Congress, Melbourne, Australia, March 12-16, 2000.
Dziegielewski, B., S. Sharma, T. Bik, X. Yang and H. Margono, 2002 (February). Analysis of Water Use in the United States. Research Project Completion Report. U.S. Geological Survey. Reston, VA.

Bibliography
Institute for Water Resources 50 2007-R-3
Dziegielewski, B., X. Yanhg and T. Bik, 2003. Long-Term Trends in Off-Stream Water Use in the United States. CD-ROM Proceedings of the XIth World Congress on Water Resources. October 5-9, 2003, Madrid, Spain.
Energy Information Agency (EIA), 2006. Annual Energy Outlook 2006 with Projections to 2030. Report #:DOE/EIA-0383 (2006). http://www.eia.doe.gov/oiaf/aeo/ electricity.html
Frederick, K., 1995. America’s Water Supply: Status and Prospects for the Future. Consequences, Volume 1, Number 1.
—, 1998. Marketing Water: The Obstacles and the Impetus. Resources (132): 7-10.
Gerlak, A.K., 2005. Federalism and U.S. Water Policy: Lessons for the Twenty-First Century. Publius: The Journal of Federalism 36(2), pp. 231–257 Advance Access publication December 14, 2005.
General Accounting Office (GAO), 2001. Water Infrastructure - Information on Federal and State Financial Assistance November 2001. Washington, D.C.
Gleick, P., 2000. Water: The Potential Consequences of Climate Variability and Change for the Water Resources of the United States. The Report of the Water Sector Assessment Team of the National Assessment of the Potential Consequences of Climate Variability and Change. Pacific Institute. Oakland, CA.
Greene, N., 2004. Growing Energy: How Biofuels Can Help End America’s Oil Dependence. December 2004. http://www.bio.org/ind/GrowingEnergy.pdf
Grigg, N.S. and C. Evan Vlachos, 1993. Drought and Water-Supply Management: Roles and Responsibilities. Journal of Water Resources Planning and Management, Vol. 119, No. 5, September/October 1993.
Grumet, J.S., 2006. Executive Director National Commission on Energy Policy. Testimony before the U.S. Senate Committee on Foreign Relations, May 16, 2006, http://www.senate.gov/~foreign/testimony/2006
Global Water Partnership (GWP), 2000. Towards Water Security: A Framework for Action. Stockholm, Sweden.
Hadley Centre for Climate Change, 2006. Climate change projections. http://www.metoffice.com /index.html
Hightower, M. and T.J. Jennings, 2003. Desalination Trends and Issues, New Mexico Water Planning 2003, New Mexico Water Resources Research Institute, November 2003.
Hoerling, M. and J. Eischeid, 2006. “Future Droughts in the Context of Climate Change,” presented at Managing Drought and Water Scarcity in Vulnerable Environments, 18-20 September 2006, Longmont, CO.
Bibliography
2007-R-3 51 Institute for Water Resources
Howitt, R. and K. Hansen, 2005. The Evolving Western Water Markets. Choices. 1st Quarter 2005, 20(1): 59-64.
Hutson, S.S., N.L. Barber, J.F. Kenny, K.S. Linsey, D.S. Lumia and M.A. Maupin, 2004. Estimated Use of Water in the United States in 2000, U.S. Geological Survey (USGS) Circular 1268 (released March 2004, revised April 2004, May 2004, February 2005). Available online at: http://pubs.usgs.gov/circ/2004/circ1268/
International Conference on Water and the Environment (ICWE), 1992. The Dublin Statement on Water and Sustainable Development. http://www.wmo.ch/web/homs/icwedece.html.
Minnesota Department of Natural Resources (DNR), 2005. Guidelines for Suspension of Surface Water Appropriation Permits. Revised: July 18, 2005. http://files.dnr.state.mn.us/natural_resources/ climate/drought
Mullican W., 2003. U.S. House Committee on Transportation and Infrastructure. Testimony by William Mullican III of the Texas Water Development Board. June 4, 2003.
National Academy of Sciences (NAS), 2004b. Review of the Desalination and Water Purification Technology Roadmap. Water Science and Technology Board. National Academies Press.
—, 2004a. Managing the Columbia River: Instream Flows, Water Withdrawals, and Salmon Survival (2004), Water Science and Technology Board, Board on Environmental Studies and Toxicology, Washington, D.C.
National Oceanic and Atmospheric Administration (NOAA), 2005a. http://www.nwrfc.noaa.gov/info/water_cycle/hydrology.cgi
—, 2005b. Hydrologic Cycle. U.S. Department of Commerece, National Weather Service, Northwest River Forecast Center Portland, OR, December 8, 2005. http://www.nwrfc.noaa.gov/info/water_cycle /hydrology.cgi
Planning and Management Consultants, Ltd. (PMCL), 2000. Legal and Institutional Analysis of Texas Water Supply Development and Management. Carbondale, IL.
—, 2001. America’s Water Resources Challenges for the 21st Century: Summary Report on Identified Water Resources Challenges and Water Challenge Areas. Report prepared for the U.S. Army Corps of Engineers Institute for Water Resources, Fort Belvoir, VA.
Reese, R.S., 2002. Inventory and Review of Aquifer Storage and Recovery in Southern Florida. U.S. Geological Survey Water-Resources Investigations Report 02-4036, Tallahassee, FL.
Rocky Mountain Institute (RMI), 2004. A "Soft Path" for Water. http://www.rmi.org/ sitepages/pid278.php
Rogers, P., (1993) America's Water: Federal Roles and Responsibilities, A Twentieth Century Fund Book. The MIT Press.
Bibliography
Institute for Water Resources 52 2007-R-3
Sexton, S.E., L.A. Martin and D. Zilberman, 2006. Biofuel and Biotech: A Sustainable Energy Solution. Agricultural and Resource Economics Update, Vol. 9 no. 3.
Shrier, C., 2004. Aquifer Storage and Recovery Regulations and Challenges for the EPA’s Underground Injection Control Program. Proceedings of Ground Water Protection Council. September 18 - 22, 2004 - Charleston, SC.
Solley, W.B., R.R. Pierce and H.A. Perlman, 1998. Estimated Water Use in the United States in 1995. USGS Circular 11200. Reston, VA.
Tennant, D., 1975. Instream Flow Regimes for Fish, Wildlife, Recreation, and Related Environmental Resources (Billings, Mont.: U.S. Fish and Wildlife Service, 1975).
U.S. Census, 2005. Interim Population Projections by States.
United Stages Global Change Research Program (USGCRP). 2003. US National Assessment of the Potential Consequences of Climate Variability and Change Sector: Water Resources, National Climate Assessment Team. http://www.usgcrp.gov/usgcrp/nacc/water/default.htm
U.S. Army Corps of Engineers (USACE) and Planning and Management Consultants, Ltd., 2003. Texas Water Allocation Assessment – Review of Corps Water Supply Authorities, Policies and Related Land Resources Issues. January 31, 2003
U.S. Army Corps of Engineers (USACE) – Institute for Water Resources (IWR). 2005a. Report of the Secretary of the Army on Civil Works Activities for FY 05. Chapter 43. http://www.iwr.usace.army.mil/docs/CH43-05%20Annual%20Report-IWR.pdf
—, 2005b, Water Resources Development: Recent Trends in the Decision-Making Process. IWR Contact Report #DACW72-00-D0001. Carbondale, IL.
—, 2006. Water Supply – Value to the Nation. Revised 9/13/06. http://www.iwr.usace.army.mil/waterresources/water_sup/watersupply.cfm
U.S. Department of Agriculture (USDA), 2004. Major Uses of Land in the United States, 2002/EIB-14, Economic Research Service/USDA
U.S. Geological Survey (USGS), 1984, National Water Summary 1983-Hydrologic events and issues: U.S. Geological Survey Water-Supply Paper 2250.
—,2003. Desalination of Ground Water: Earth Science Perspectives, Fact Sheet 07503 October 2003, http://pubs.usgs.gov/fs/fs075-03/pdf/AlleyFS.pdf
U.S. Water News, 2003. Nevada water authority offers $82 million to end water fight.
United Nations Conference on Environment and Development (UNCED), 1992. Agenda 21, Chapter 18. Protection of the Quality and Supply of Freshwater Resources: Application of Integrated Approaches to the Development, Management and Use of Water
Bibliography
2007-R-3 53 Institute for Water Resources
Resources. Rio de Janeiro, Brazil. http://www.igc.aps.org/habitat/agenda21/ch-18.html.
Universities Council on Water Resources (UCOWR), 2000. Reflections On a Century of Water Science and Policy. Dedicated issue to overview water resources in the U.S. Update 116 March 2000.
September 2003. http://www.uswaternews.com/archives/arcpolicy/3nevwat9.html.
Water Infrastructure Network, 2001. Clean and Safe Water fro the 21st Century: A Renewed National Commitment to Water and Wastewater Infrastructure.
Werick, W., 2003. Personal Communication.
Western States Water Council (WSWC). 2006. Resolution of the WSWC in support of Indian Water Rights Settlements Washington, D.C. March 29, 2006, http://www.westgov.org/wswc/06%20settlmnt%20ind%20wat%20rts.pdf
Woodhouse, C. and J. Overpeck, 1998: 2000 Years of Drought Variability in the Central United States, Bull. Amer. Meteor. Soc., 79, 2693-2714.

Bibliography
Institute for Water Resources 54 2007-R-3

Appendix A
Future Scenarios

2007-R-3 A-1 Institute for Water Resources
Appendix A Future Scenarios A useful way to integrate the assumptions and expectations about the current and future trends is by constructing possible scenarios for the future. An important purpose of formulating the scenarios is to identify things that would have to occur between now and 2035 in order to increase the plausibility of a scenario. Unfavorable scenarios are formulated to illustrate what could occur if the positive trends fade away, important changes in water management are not undertaken or policies are implemented that have unintended and disastrous consequences. Both positive and negative scenarios are formulated to help us explicate the importance of various trends on the future outcomes.
We constructed four different scenarios to capture a set of plausible futures in U.S. water management. We limited the scenarios to represent interactions of two situations (or states) on two variables: one exogenous and one endogenous. The exogenous variable is the speed and type of climate change during the intervening period 2005 to 2035. The endogenous variable specifies the nature of the country’s response to water resources challenges. The relationships between these variables and the associated scenarios are shown on the diagram below.
Response/Climate Impact Reactive/uncoordinated mostly local Response
Proactive/coordinated national Response
Gradual climate impacts Scenario A Scenario C
Abrupt impacts - droughts Scenario B Scenario D
We named these scenarios as:
Scenario A—Muddling Through and Survival Scenario B—Resignation and Avoidance Scenario C—Steady-State With Fortunate Outcomes Scenario D—Reformed Water Management
For two scenarios we also assume a hydrologic condition for the year 2035 as the fifth year of a multiyear drought extending over approximately two-thirds of the U.S. interior including both eastern and western states. Other conditions were also introduced into each scenario. A brief description of each scenario is given below.
A.1 Scenario A: Muddling Through and Survival During the two decades prior to 2035 there has been unexpected growth in agricultural irrigation water use because of increased world demands for grains and increased production of biofuel from corn and sugar cane. Also there were some significant weather anomalies causing early spring floods in some regions of the country and decreased annual precipitation in others. This has resulted in decreased availability of surface water supplies for crop irrigation during the last 10 years.
Appendix A Future Scenarios
Institute for Water Resources A-2 2007-R-3
As a result, the Great Plains Aquifer and Sparta Aquifer as well as other smaller aquifers have been severely depleted and a large number of costly plants for desalination of brackish groundwater have been built to provide replacement water for irrigation. These plants impose significant loads on the electric power grid during the summer season and electric utilities are forced to burn expensive fuels to meet the demand. Greater agricultural water demands also caused some western cities to lose a significant percentage of supply they previously leased from farmers and many of them had to invest in very expensive and often unreliable schemes to obtain additional water. In many cases the cities have to resort to increasingly severe water rationing plans.
Throughout the U.S. and especially in areas where decreased annual precipitation has been reported, many businesses and small communities started looking for alternative or additional water supplies. The number of wells being drilled annually during the last five years has increased tenfold but a significant percentage of wells failed to produce water. The press is critical of the performance of Federal, state and local governments for taking a reactive approach to dealing only with water shortage hot-spots and not having a plan for dealing with the national scale challenges.
A.2 Scenario B: Resignation and Avoidance This scenario represents an outcome of a business-as-usual approach to managing the water resources of the U.S., which is further combined with avoidance or resignation toward the problem of increasing adverse effects of climate changes on water availability and use.
The year 2035 is the fifth year of a multiyear drought (induced by global warming) which covers both western and central portions of the country. In the western states, the carry-over storage in the water supply reservoirs operated by USBR is down to 15 percent and deliveries of water to irrigation districts are suspended (although nearly full deliveries were provided during the initial drought years). Also, major western cities are already under water rationing and are trying to obtain water supplies from the remaining sources.
The Corps still has significant amounts of water stored in a number of reservoirs it operates but it cannot make water deliveries to the impacted cities and irrigation districts without appropriate water transmission infrastructure. As a result the nation’s agricultural production has declined by more than 50 percent and the urban economies are beginning to suffer due to production cutbacks and layoffs. Also, the eastern areas of the country suffer electric brownouts due to increased demand for electricity caused by heat waves and decreased production from cooling plants with once-through cooling systems and from hydropower plants.
Congress and state legislatures have passed several emergency bills at the beginning of the year to address the problem but not much can be done. Federal funds are provided for drought relief for farmers who lost income because of crop failure.
As a consequence of these adaptations the cost of electricity has increased by 50 percent or more in almost two-thirds of the country and the prices of urban water in some regions have increased threefold. There is also a significant increase in the prices of agricultural products.
Appendix A Future Scenarios
2007-R-3 A-3 Institute for Water Resources
The ongoing crisis is blamed on the inaction of water management institutions at all levels of government during the past three decades despite frequent warnings by scientist about the consequences of climate change. The lack of coordinated Federal policy on water and almost complete absence of Federal funding for water infrastructure is considered to be the main cause of the crisis. One additional reason for the crisis is that the existing water storage and transmission infrastructure has deteriorated and new infrastructure has not been built due to various reasons.
A.3 Scenario C: Steady-State With Fortunate Outcomes Under this scenario, the water supply and demand situation in 2035 is not very different than it was 30 years earlier. In anticipation of climate change impacts on water resources a number of significant changes were made in the national approach to water management. These changes allowed for implementation of some flexible solutions to water problems.
Water withdrawals by irrigation and thermoelectric sectors have remained relatively unchanged since 2005 and there was only a modest increase in public-supply water withdrawals. Thanks to new water statutes and Federal laws and policies, the increased urban demands were met by water transfers from agriculture through water leasing arrangements with irrigation districts, which generated water savings by adopting various efficiency measures.
The effects of climate change on water availability have been minor and included only slight increases in precipitation in the northern regions of the country. Also, the expected increases in the frequency and intensity of droughts have not happened yet and many initiatives to prepare water supply systems for the effects of climate change have been fine-tuned to address drought preparedness as well as some year-to-year issues in water management and allocation of water supplies.
Finally, water allocation for in-stream uses have become less of a problem because in areas where flows were depleted by excessive agricultural withdrawals of surface water or groundwater pumping, water withdrawals were significantly reduced because of increasing pumping costs due to higher costs of electricity and diesel fuel. Also, the new system of incentives for improving on-farm efficiency of water use allowed for more water to be left for in-stream flows.
A.4 Scenario D: Reformed Water Management Although the year 2035 is the fifth year of a multiyear drought in the western and central portions of the country, the impacts of the drought on the U.S. economy are very minor although the drought caused some reduction in agricultural production. Urban water supplies are somewhat stretched but no significant rationing has been implemented. Several large urban utilities in the West had to bring on-line their stand-by desalination plants to make up for the drought related reduction in surface water supplies. The ability of all major sectors of the U.S. economy to deal with the drought is credited to the country-wide reform of water management which included:

Appendix A Future Scenarios
Institute for Water Resources A-4 2007-R-3
Voluntary reallocation of significant amounts of water from agriculture to urban, industrial and in-stream uses through enabling Federal and state legislation, which enabled transfers of water rights.
Construction of water storage reservoirs (as well as artificial groundwater recharge) in mountainous regions of the country to capture winter precipitation and early spring snowmelt and to provide storage reserve for multi-year droughts.
Construction of additional water storage and transmission in the Northeast and Southeast to adjust to changes in precipitation patterns especially the increase in the frequency and intensity of extreme rainfall events including those associated with hurricanes.
Development of supplemental desalination capacity of brackish groundwater to provide additional water supply for irrigation in both eastern and western regions of the country.
Significant investment of Federal funds in the rehabilitation and new development of water infrastructure, especially in regions which were most vulnerable to adverse impacts of climate change.
Nevertheless, there is a concern that the ongoing drought could continue for several more years and water planners are looking for ways to balance water demands with the available supplies by examining the availability of water stored in water banks (aquifers) and also by reviewing water rights and allocations in the hardest hit water basins.

Appendix B
Annotated Bibliography

2007-R-3 B-1 Institute for Water Resources
Appendix B Annotated Bibliography This short annotated bibliography is prepared in support of the preparation of the Outlook Paper for the Institute for Water Resources of the U.S. Army Corps of Engineers. It contains short annotations of the following eight references:
1. American Water Resources Association (AWRA). 2005. The Second AWRA National Water Policy Dialogue. Dialogue Summary. Tucson, AZ, http://www.awra.org/meetings/Tucson2005/dialogue_summary.pdf
2. Brown, T.C. 2000. Projecting U.S. Freshwater Withdrawals. Journal of Water Resources Research. 36 (3): 769-80.
3. Dziegielewski, B., X. Yang and T. Bik. 2003. Long-Term Trends in Off-Stream Water Use in the United States. Proceedings of the XIth World Congress on Water Resources. IWRA. October 5-9, 2003, Madrid, Spain.
4. Frederick, K.D. 1995. America’s Water Supply: Status and Prospects for the Future. Consequences. Vol.1, No. 1, 1995.
5. Howitt, R. and K. Hansen. 2005. The Evolving Western Water Markets. American Agricultural Economics Association. Choices. 1st Quarter 2005, 20(1): 59-64.
6. Gerlak, A.K. 2005. Federalism and U.S. Water Policy: Lessons for the Twenty-First Century. Publius: The Journal of Federalism 36(2), pp. 231–257.
7. Grumet, J.S. 2006. Executive Director National Commission on Energy Policy, Testimony before the U.S. Senate Committee on Foreign Relations, May 16, 2006. http://lugar.senate.gov/energy/hearings/pdf/060516/Grumet_Testimony.pdf
8. Jacobs, K., D.B. Adams and P. Gleick. 2001. Chapter 14. Potential Consequences of Climate Variability and Change for the Water Resources of the United States, Final Synthesis Team Reports & Newsletter US Global Change Research Program Published in 2000/2001.
Each annotation states the type and contents of the publication, and summarizes the observations, findings or recommendations that are relevant to the discussion presented in the Outlook Paper.
Appendix B Annotated Bibliography
Institute for Water Resources B-2 2007-R-3
Reference 1 American Water Resources Association (AWRA). 2005. The Second AWRA National Water Policy Dialogue. Dialogue Summary. Tucson, AZ, http://www.awra.org/meetings/Tucson2005/dialogue_summary.pdf
The Second Water Policy Dialogue (WPD II) was held in Tucson, Arizona on February 14-15, 2005. It was organized by AWRA under the sponsorship of nine federal agencies (within the Departments of Agriculture, Defense, Interior, and Commerce, and the Environmental Protection Agency) and 40 state, local, business, and non-governmental organizations, and attended by over 250 of the Nation’s water resources experts. The First Dialogue was held on September 17-18, 2002 in Washington, D. C. and was attended by 267 experts from ten federal water resources agencies, 24 non-governmental organization as well as representatives of state and local organizations, academics, and private citizens.
The participants in WPD II identified four key water resources challenges facing the nations and two cross-cutting issues. The four challenges are:
1. Promoting more integrated approaches to water issues and focusing on programs that present water-shed level solutions.
2. Reconciling the current disjointed ad-hoc national water policy represented by the myriad laws, executive orders and Congressional guidance.
3. Developing collaborative partnerships to coordinate water management actions of Federal, state, tribal and local governments.
4. Providing information for making sound decisions based on good science and complete information.
The two cross-cutting issues that run through all four challenges are:
1. Financing improvements in water resources infrastructure through innovative cost recovery, pricing and financing mechanisms.
2. Educating the public and public officials about the water resources challenges and the corresponding risk to the prosperity, quality of life and security of the Nation.
The participants issued a call to Congress and the Administration to take a lead role in (1) developing a national water vision, (2) formulating policy principles which focus on shared responsibilities of governments and private sector, (3) providing appropriate coordination and cooperation among Federal agencies and all other levels of government, and (4) assessing water resources information and policy needs and propose solutions. The participants urged the President to support the formation of a bipartisan National Water Commission to carry out a national assessment of water availability and use and to propose strategies for dealing with water issues and associated conflicts.
Appendix B Annotated Bibliography
2007-R-3 B-3 Institute for Water Resources
The third WPD will be held at the Sheraton National Hotel in Arlington, Virginia on January 22-23, 2007. The stated aim of the upcoming next dialogue is to provide “decision makers with guidance in the formulation and development of water resources policies attuned to societal needs and preferences.”
Reference 2 Brown, T.C. 2000. Projecting U.S. Freshwater Withdrawals. Journal of Water Resources Research. 36 (3): 769-80, March 2000.
The aim of the author was to make projections of future water use in the U.S. based on the historical trends during the period 1960-1995. The projections are based on trends in basic water use factors and the expected future growth (or changes) in population, income, electric energy production and irrigated acreage. Projections of freshwater withdrawals are prepared for five water use categories in the U.S. as a whole and in each of six aggregated regions characterized by relatively homogeneous precipitation, climate, geography and water use characteristics (the six regions were obtained by grouping the 18 Water Resources Regions defined by the Water Resources Council in 1978).
The key assumptions of the projections for each sector of water use were:
Constant ratio of future livestock numbers to population and constant per capita livestock withdrawals at the 1995 level of 21 gallons per capita per day (gpcd).
Census population projections and constant per capita withdrawals of 121 gpcd in the domestic and public use sector.
Gradually decreasing rate (from 2 percent to 1 percent per year over the 1995-2040 period) in unit industrial and commercial withdrawals per $1000 of per capita income.
Gradually decreasing rate (from 1.3 percent to 0.6 percent per year over the 1995-2040 period) in unit water withdrawal per kilowatt-hour of electricity produced at freshwater plants; and increasing energy use per person per year at an annual rate, which would be decreasing from 0.6 percent to 0.14 percent over the period 1995-2040.
An increase in irrigated acreage from 57.9 million acres in 1995 to 62.4 million in 2040 and withdrawal per acre in the west at a slightly declining annual rate of 0.08 percent to 0.04 percent between 1995 and 2040 but a constant unit withdrawal in the east.
The resultant estimates of the change in total national and regional withdrawals are:
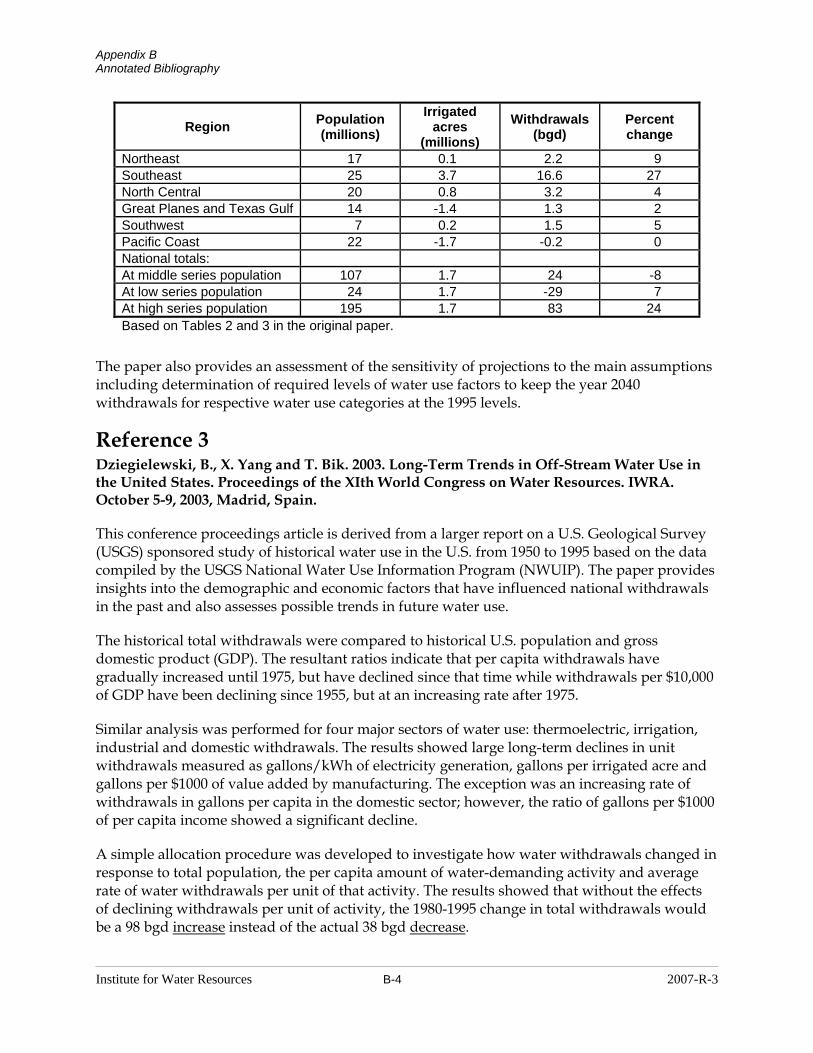
Appendix B Annotated Bibliography
Institute for Water Resources B-4 2007-R-3
Region Population (millions)
Irrigated acres
(millions) Withdrawals
(bgd) Percent change
Northeast 17 0.1 2.2 9 Southeast 25 3.7 16.6 27 North Central 20 0.8 3.2 4 Great Planes and Texas Gulf 14 -1.4 1.3 2 Southwest 7 0.2 1.5 5 Pacific Coast 22 -1.7 -0.2 0 National totals: At middle series population 107 1.7 24 -8 At low series population 24 1.7 -29 7 At high series population 195 1.7 83 24 Based on Tables 2 and 3 in the original paper.
The paper also provides an assessment of the sensitivity of projections to the main assumptions including determination of required levels of water use factors to keep the year 2040 withdrawals for respective water use categories at the 1995 levels.
Reference 3 Dziegielewski, B., X. Yang and T. Bik. 2003. Long-Term Trends in Off-Stream Water Use in the United States. Proceedings of the XIth World Congress on Water Resources. IWRA. October 5-9, 2003, Madrid, Spain.
This conference proceedings article is derived from a larger report on a U.S. Geological Survey (USGS) sponsored study of historical water use in the U.S. from 1950 to 1995 based on the data compiled by the USGS National Water Use Information Program (NWUIP). The paper provides insights into the demographic and economic factors that have influenced national withdrawals in the past and also assesses possible trends in future water use.
The historical total withdrawals were compared to historical U.S. population and gross domestic product (GDP). The resultant ratios indicate that per capita withdrawals have gradually increased until 1975, but have declined since that time while withdrawals per $10,000 of GDP have been declining since 1955, but at an increasing rate after 1975.
Similar analysis was performed for four major sectors of water use: thermoelectric, irrigation, industrial and domestic withdrawals. The results showed large long-term declines in unit withdrawals measured as gallons/kWh of electricity generation, gallons per irrigated acre and gallons per $1000 of value added by manufacturing. The exception was an increasing rate of withdrawals in gallons per capita in the domestic sector; however, the ratio of gallons per $1000 of per capita income showed a significant decline.
A simple allocation procedure was developed to investigate how water withdrawals changed in response to total population, the per capita amount of water-demanding activity and average rate of water withdrawals per unit of that activity. The results showed that without the effects of declining withdrawals per unit of activity, the 1980-1995 change in total withdrawals would be a 98 bgd increase instead of the actual 38 bgd decrease.

Appendix B Annotated Bibliography
2007-R-3 B-5 Institute for Water Resources
The final section of the paper applies the method used to review past water use trends to project the potential future quantities of water that are likely to be used in major water use sectors in 2040. The projected 2040 withdrawals by sector (original Table 3) are:
Sector of Water Use
1995 Withdrawal
(bgd)
2040 Withdrawal
(bgd)
1995-2040 Change
(bgd)
1995-2040 Change
(%) Thermoelectric 190 216 26 13.7 Irrigation 134 110 -24 -17.9 Industrial 29 35 6 20.7 Domestic 49 79 30 61.2 Total 402 440 38 9.5
In summary, the authors concluded that the general picture of the sectoral composition of water withdrawals will not change much in the next decades. Thermoelectric generation will remain the leading water user followed by irrigation, domestic and industrial. Total withdrawals in 2040 are expected to increase by 9.5 percent, growing at a much slower rate than before 1980. The thermoelectric and domestic sectors are expected to contribute the most to the increase in total withdrawals. Only a minor increase in industrial withdrawals and a significant decrease in irrigation withdrawals are projected.
Reference 4 Frederick, K.D. 1995. America’s Water Supply: Status and Prospects for the Future. Consequences. Vol. 1, No. 1, 1995.
This 12 page article (plus 2 tables and 4 figures) is an excellent primer and overview of the U.S. water supply situation. Although the paper was written more than 10 years ago, it covers five important and still relevant issues concerning the availability of water to meet the demands of growing population while sustaining a healthy environment. These issues include: (1) uncertainty of supplies stemming from natural variability and global warming induced change of climate, (2) high cost of developing additional surface supplies, (3) vulnerability, restoration and protection of water resources, (4) importance of reliable high-quality supplies and (5) institutional shortcomings in allocating supplies under changing conditions of supply and demand.
The author makes several perceptive observations about the critical issues and the general nature of water supply problems:
A. Water resource problems tend to be local or regional in nature because water cannot be easily transported from the water surplus to water shortage areas due to the cost of transportation which is too high relative to the marginal value of water.
B. Future increases in assured supplies for off-stream uses of water achieved through the addition of surface storage are likely to be modest because of increasing costs of storage (i.e., due to declining storage per cubic yard of dam), diminishing returns in safe yield with increasing regulation and increasing environmental costs of storing and diverting water.
Appendix B Annotated Bibliography
Institute for Water Resources B-6 2007-R-3
C. The importance of water to society is difficult to measure and it is usually unnoticed when water is plentiful—but large economic and environmental losses result from water shortages caused by drought.
D. Past laws and policies favored offstream over instream uses of water but now the policy has shifted toward protecting remaining flows and recovering some of the environmental and recreational benefits of instream uses.
E. Water institutions are not effectively interlinked and are not capable of protecting the quality of water supplies and aquatic ecosystems and of allocating scarce supplies to higher value uses.
F. Although the costs of water supply are likely to rise in the future, the magnitude of these costs can be controlled by improved water management.
In the closing paragraph, the author gives the following outlook for the future:
“In summary, with improved basin-wide management of supplies, institutions that enable water to be transferred efficiently and expeditiously among uses in response to changing supply and demand conditions, and cost-effective approaches to protecting aquatic ecosystems and drinking water supplies, reliable supplies of freshwater will be available at readily affordable prices for the foreseeable future.”
Reference 5 Howitt, R. and K. Hansen. 2005. The Evolving Western Water Markets. Choices. American Agricultural Economics Association. 1st Quarter 2005, 20(1): 59-64
Given the scarcity of water in the arid and semi-arid areas of the western U.S., extensive water trading in this region could provide a voluntary self-compensating mechanism for reallocation of water to higher value uses. However, the authors note that a traditional water trading has been slow to evolve in the region. The paper examines the existing nature water markets and attempts to identify the obstacles to their development.
The data reviewed in the paper showed that during the 1999 to 2002 period, the volume of the reported water transactions was 8,140 thousand acre feet. This amount is equivalent to 2,035 thousand acre feet per year about the average annual flow in the aqueducts of the California State Water Project. Typically farmers were the sellers of water rights and municipal water providers were the buyers.
The likely three fundamental obstacles to the development of water markets in the west are:
1. Both “private” and “public good” characteristics of water, which resulted in water development with public financing or subsidies.
2. Natural fluctuations in water supply which often result in markets with few participants.
Appendix B Annotated Bibliography
2007-R-3 B-7 Institute for Water Resources
3. Significant costs of water transfers because of physical and environmental externalities and third-party financial impacts.
Other obstacles to water transfers include (1) lack of appropriate infrastructure to facilitate the transportation and storage of water, (2) low economic value of water relative to the cost of conveyance and (3) lack of clearly defined, enforceable and transferable water rights.
Because the externalities and third-party damages are likely to increase with increasing volume in trades, the authors expect that this will result in a higher percentage of leases relative to permanent transfers. At present, leases dominate water trades in 12 out of 14 states for which data are available. The high volume states are Arizona and California. Permanent trading is only dominant in Nevada and Utah.
The authors conclude that while water markets are “gaining traction” in the western United States, and many states west of the Mississippi River have implemented legislation to facilitate water trading within their borders, the concern over environmental and economic externalities and third-party impacts in exporting regions will likely continue in the future and will affect both the traded volume and the type of transfers.
Reference 6 Gerlak, A.K. 2005. Federalism and U.S. Water Policy: Lessons for the Twenty-First Century. Publius: The Journal of Federalism 36(2), pp. 231–257
This article provides an excellent overview of the past 250 years of water policy in the United States by presenting and characterizing five historical periods (referred to as policy streams) starting from the early years of late 1700s to early 1900s and ending on the period from 1990s to present. The paper also describes the increasing emphasis of U.S. water policy on “pragmatic federalism.” It concludes by reviewing challenges and obstacles for future management of water resources.
The names of the five historical streams of U.S. water policy discussed by the author are:
1. State Ingenuity and Independence (1700s to 1900s); characterized by state-based federalism, when the canal building and flood control were done by the states with only a minor role of the Federal government.
2. Federal Development and Dominance (1900-1960); a period of centralized federalism with an increasing role of Federal government.
3. Development Doubts and Environmental Concerns (1960s-1980s); a period of cooperative federalism with shared Federal-state authority.
4. Devolution and Penny-Pinching (1980s); characterized by an emphasis on increasing state responsibilities such as cost sharing in water projects and reduction in Federal funding.
5. Restoration and Collaboration (1990s-present); continued devolution with focus on restoration and collaboration evolving to the pragmatic federalism of today.
Appendix B Annotated Bibliography
Institute for Water Resources B-8 2007-R-3
The pragmatic federalism is a central theme of the paper. This new form of federalism is characterized by “collaborative partnerships, adaptable management strategies and a focus that is problem and process oriented.” It is less regulatory with a greater emphasis on incentives and efficiency with increased employment of working groups, task forces, cooperative agreements and cost sharing. Pragmatic federalism also promises greater accessibility to environmental and local interests and it is holistic within a watershed or problem area.
In considering the challenges and obstacles for the future the author mentions three relevant trends:
1. Increasing recognition of the limits of horizontal fragmentation and piecemeal approaches to policymaking.
2. Movement toward greater coordination as indicated by the recent regionally based restoration efforts along with cooperative programs and agreements.
3. Challenges to intergovernmental relations caused by the mounting compliance costs for state and local governments.
The author concludes by saying that the real test of pragmatic federalism will be its ability to overcome the policy fragmentation.
Reference 7 Grumet, J.S. 2006. Executive Director National Commission on Energy Policy. Testimony before the U.S. Senate Committee on Foreign Relations, May 16, 2006. http://lugar.senate.gov/energy/hearings/pdf/060516/Grumet_Testimony.pdf
This is a 21-page long transcript of the Congressional Testimony by Mr. Jason Grumet.
The testimony was based on a report prepared by the National Commission on Energy Policy entitled Ending the Energy Stalemate: A Bipartisan Strategy to Meet America’s Energy Challenges, which was released in December 2004. The focus of the testimony was on the first chapter of that report which deals with oil security as one of the nation’s foremost economic, national security and energy challenges.
One of the Commission’s specific recommendations for increasing supply of oil was to explore “technologies and processes that would allow for the use of unconventional oil resources in a manner that is compatible with climate change and other environmental concerns.” More specifically, the Commission recommended a “sustained and vigorous effort to spur public and private sector investment in the development and early deployment of domestically-produced transportation fuels derived from biomass and organic wastes.” Among the available alternatives to petroleum fuels, cellulosic ethanol is believed to hold the most potential for displacing a significant fraction of transportation oil demand within the next 20–30 years.
The portion of the presentation which is relevant to water resources pertains to the production of alternative fuels. The Commission identified four criteria that characterize a promising alternative fuel: (1) it can be produced from ample domestic feedstocks; (2) it has low net, full
Appendix B Annotated Bibliography
2007-R-3 B-9 Institute for Water Resources
fuel-cycle carbon emissions; (3) it can work in existing vehicles and with existing infrastructure and (4) it has the potential to become cost-competitive with petroleum fuels given sufficient time and resources dedicated to technology development.
While corn-based ethanol is currently our most successful non-petroleum transportation fuel, the Commission believes that ethanol produced from cellulosic biomass should be the main focus. Currently, corn is grown on about 77 million acres, 12 percent of which is dedicated to ethanol production. However, it takes roughly 4 percent of our total corn supply to displace 1 percent of the current gasoline supply (we burn about 140 billion gallons of gasoline per year) and the expansion of the production of corn and sugar cane for fuel is not really feasible. However, the cellulosic alternatives can be grown on marginal land without extra water requirements.
According to the estimates prepared by the Oak Ridge National Laboratory, it would take 180 million acres or roughly 40 percent of the land already in cultivation in the U.S. to fuel half the current vehicle fleet with cellulosic ethanol. This land requirement would shrink to only 30 million acres (the current enrolled acreage in the Conservation Reserve Program), if we could double per-acre yields of switchgrass, increase its conversion efficiency to ethanol by one-third and double the fuel economy of our vehicle fleet. One important caveat to this projection is that the use of switchgrass is dependent on the development of an inexpensive enzyme to convert cellulose to wood sugar.
Reference 8 Jacobs, K., D.B. Adams, and P. Gleick. 2001. Chapter 14. Potential Consequences of Climate Variability and Change for the Water Resources of the United States, Final Synthesis Team Reports & Newsletter U.S. Global Change Research Program Published in 2000/2001.
This chapter was written as a part of the National Assessment's Overview and Foundation reports, which are essential references for understanding the possible consequences of climate variability and change on the United States. The chapter covers several aspects of climate and water resources including an overview of U.S. water resources and their socioeconomic and institutional contexts, historical and predicted climate variability and change, key issues in water resources management, and adaptation strategies and research needs.
The chapter summary includes a list of climatic changes during the past century and a list of predictions for the twenty-first century. Some of the important past and anticipated changes are:
1. Precipitation has increased an average of 10 percent across the U.S. with much of the increase attributed to the heaviest precipitation events. These historic trends toward increased precipitation are likely to continue in the coming century. Predictions from two GCMs do not agree on precipitation impacts except for a prediction of precipitation increase in the Southwest.
2. Nationally, median annual streamflow has increased at 29 percent of stream gages and decreased at only 1 percent. No streamflow increases were observed in the West. However,

Appendix B Annotated Bibliography
Institute for Water Resources B-10 2007-R-3
in snowpack dominated streams, a shift has been observed in the timing run-off to earlier in the season.
3. Reductions in areal extent of snowpack in the western mountains have been observed. In the future snowpack is very likely to be reduced even in the context of higher precipitation.
4. No significant increases in the frequency of droughts or winter-type storms have been observed on a national basis. It is possible that there will be an increase in interannual variability, resulting in more severe droughts in some years.
5. Increases in temperature, even in the context of increases in precipitation, are likely to result in significant loss of soil moisture in the Northern Great Planes.
While considering the impacts of climate change on water resources, the authors focused on the existing key issues and their potential worsening under the added impacts of climate change. One of the concerns is the potentially increasing pressures on groundwater supplies caused by the need to offset changes in surface water supply availability, although long-term increases in precipitation will possibly increase recharge rates.
Regarding possible adaptations, the report states that “water managers have multiple opportunities to reduce future risks by incorporating ‘no regrets’ changes into their operating strategies that are appropriate regardless of climate change.” The authors also stated that “It is not known whether the effects of climate change will require dramatic changes in infrastructure to control flooding and provide reliable water supplies during drought.”

IWR Future Directions
IWR’s Future Directions program activities include the identification of emerging water challenges and opportunities and the tactical engagement of USACE senior leaders on these issues. Such critical thinking is seen as an essential prerequisite to strategy development and planning.
IWR employs a variety of approaches to encourage strategic thinking, including the development of Water Resources Outlook papers and the conduct of topic specific provocation sessions with senior leaders.
Other tools IWR has recently developed to engage senior leaders strategically are the Castle Forum and the Lunch Roundtable. The Castle Forum is an off-site event where senior leaders and external thought leaders can engage in out-of-the-box thinking regarding subjects not usually addressed by them. The Lunch Roundtable brings in water experts from outside the Corps to provide different perspectives on issues familiar to senior leaders.
Future Directions activities include:
• Water Resources Outlook papers • Post-Katrina Studies • Interagency Performance Evaluation Task Force (IPET) • Planning Framework for Coastal Louisiana • Hurricane Protection Decision Chronology • Twelve Actions for Change • Louisiana Coastal Protection and Restoration (LACPR) • National Shoreline Management Study • Strategic Planning • Policy Development • Other activities headed by the USACE Chief Economist
For more information about the Future Directions program, contact:
Norman Starler, IWR Future Directions U.S. Army Corps of Engineers Institute for Water Resources Casey Building, 7701 Telegraph Road Alexandria, VA 22315-3868 www.iwr.usace.army.mil

2007-R-3