U.S. Trends in Food Availability
38
Economic Research Service Economic Information Bulletin Number 166 January 2017 U.S. Trends in Food Availability and a Dietary Assessment of Loss-Adjusted Food Availability, 1970-2014 Jeanine Bentley United States Department of Agriculture
Transcript of U.S. Trends in Food Availability

Economic Research Service
Economic Information Bulletin Number 166
January 2017
U.S. Trends in Food Availability and a Dietary Assessment of Loss-Adjusted Food Availability, 1970-2014Jeanine Bentley
United States Department of Agriculture

Economic Research Service www.ers.usda.gov
United States Department of Agriculture
Cover is a derivative of images from iStock.
Use of commercial and trade names does not imply approval or constitute endorsement by USDA.
To ensure the quality of its research reports and satisfy government-wide standards, ERS requires that all research reports with substantively new material be reviewed by qualified technical research peers. This technical peer review process, coordinated by ERS' Peer Review Coordinating Council, allows experts who possess the technical background, perspective, and expertise to provide an objective and meaningful assessment of the output’s substantive content and clarity of communication during the publication’s review. For more information on the Agency’s peer review process, go to: http://www.ers.usda.gov/about-ers/peer-reviews.aspx
In accordance with Federal civil rights law and U.S. Department of Agriculture (USDA) civil rights regulations and policies, the USDA, its Agencies, offices, and employees, and institutions participating in or administering USDA programs are pro-hibited from discriminating based on race, color, national origin, religion, sex, gender identity (including gender expression), sexual orientation, disability, age, marital status, family/parental status, income derived from a public assistance program, political beliefs, or reprisal or retaliation for prior civil rights activity, in any program or activity conducted or funded by USDA (not all bases apply to all programs). Remedies and complaint filing deadlines vary by program or incident.
Persons with disabilities who require alternative means of communication for program information (e.g., Braille, large print, audiotape, American Sign Language, etc.) should contact the responsible Agency or USDA's TARGET Center at (202) 720-2600 (voice and TTY) or contact USDA through the Federal Relay Service at (800) 877-8339. Additionally, program information may be made available in languages other than English.
To file a program discrimination complaint, complete the USDA Program Discrimination Complaint Form, AD-3027, found online at How to File a Program Discrimination Complaint and at any USDA office or write a letter addressed to USDA and provide in the letter all of the information requested in the form. To request a copy of the complaint form, call (866) 632-9992. Submit your completed form or letter to USDA by: (1) mail: U.S. Department of Agriculture, Office of the Assis-tant Secretary for Civil Rights, 1400 Independence Avenue, SW, Washington, D.C. 20250-9410; (2) fax: (202) 690-7442; or (3) email: [email protected].
USDA is an equal opportunity provider, employer, and lender.
This digital publication is available at
www.ers.usda.gov/publications/
Recommended citation format for this publication:
Jeanine Bentley. U.S. Trends in Food Availability and a Dietary Assessment of Loss-Adjusted Food Availability, 1970-2014, EIB-166, U.S. Department of Agriculture, Economic Research Service, January 2017.
United States Department of Agriculture
Economic Research Service
Economic Information Bulletin Number 166
January 2017
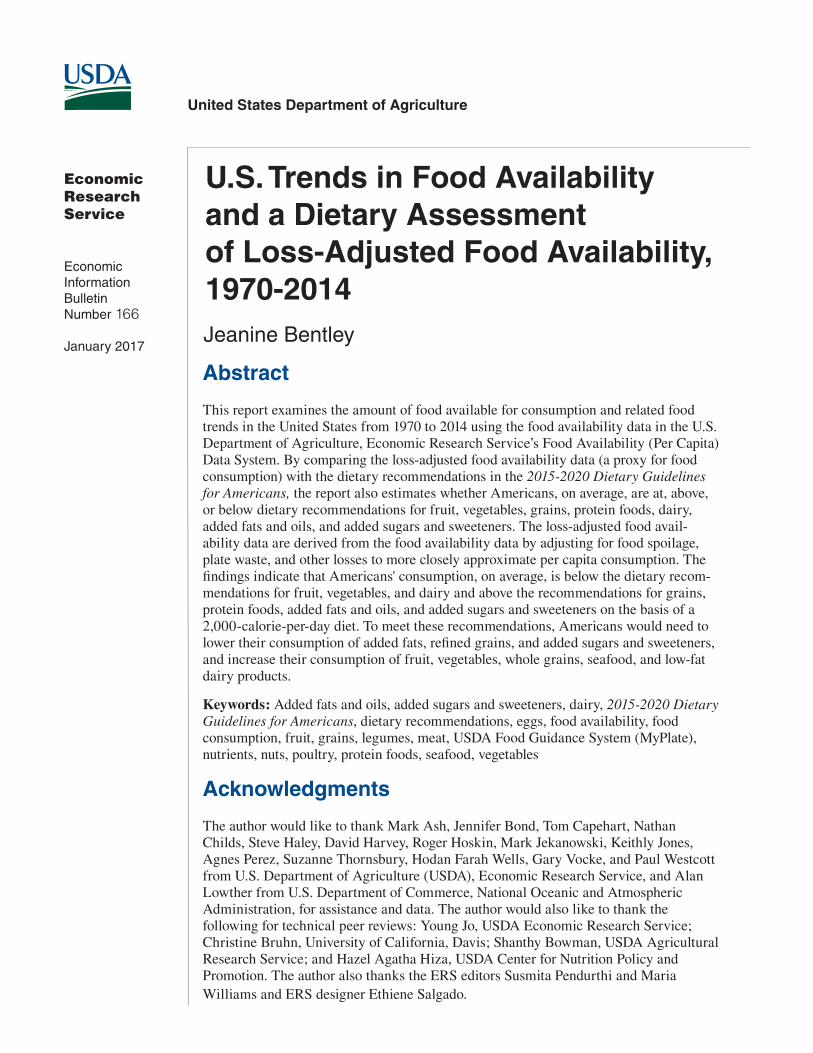
Abstract
This report examines the amount of food available for consumption and related food trends in the United States from 1970 to 2014 using the food availability data in the U.S. Department of Agriculture, Economic Research Service’s Food Availability (Per Capita) Data System. By comparing the loss-adjusted food availability data (a proxy for food consumption) with the dietary recommendations in the 2015-2020 Dietary Guidelines for Americans, the report also estimates whether Americans, on average, are at, above, or below dietary recommendations for fruit, vegetables, grains, protein foods, dairy, added fats and oils, and added sugars and sweeteners. The loss-adjusted food avail-ability data are derived from the food availability data by adjusting for food spoilage, plate waste, and other losses to more closely approximate per capita consumption. The findings indicate that Americans' consumption, on average, is below the dietary recom-mendations for fruit, vegetables, and dairy and above the recommendations for grains, protein foods, added fats and oils, and added sugars and sweeteners on the basis of a 2,000-calorie-per-day diet. To meet these recommendations, Americans would need to lower their consumption of added fats, refined grains, and added sugars and sweeteners, and increase their consumption of fruit, vegetables, whole grains, seafood, and low-fat dairy products.
Keywords: Added fats and oils, added sugars and sweeteners, dairy, 2015-2020 Dietary Guidelines for Americans, dietary recommendations, eggs, food availability, food consumption, fruit, grains, legumes, meat, USDA Food Guidance System (MyPlate), nutrients, nuts, poultry, protein foods, seafood, vegetables
Acknowledgments
The author would like to thank Mark Ash, Jennifer Bond, Tom Capehart, Nathan Childs, Steve Haley, David Harvey, Roger Hoskin, Mark Jekanowski, Keithly Jones, Agnes Perez, Suzanne Thornsbury, Hodan Farah Wells, Gary Vocke, and Paul Westcott from U.S. Department of Agriculture (USDA), Economic Research Service, and Alan Lowther from U.S. Department of Commerce, National Oceanic and Atmospheric Administration, for assistance and data. The author would also like to thank the following for technical peer reviews: Young Jo, USDA Economic Research Service; Christine Bruhn, University of California, Davis; Shanthy Bowman, USDA Agricultural Research Service; and Hazel Agatha Hiza, USDA Center for Nutrition Policy and Promotion. The author also thanks the ERS editors Susmita Pendurthi and Maria Williams and ERS designer Ethiene Salgado.
Jeanine Bentley
U.S. Trends in Food Availability and a Dietary Assessment of Loss-Adjusted Food Availability, 1970-2014

ii U.S. Trends in Food Availability and a Dietary Assessment of Loss-Adjusted Food Availability, 1970-2014, EIB-166
USDA, Economic Research Service
Contents
Summary . . . . . . . . . . . . . . . . . . . . . . . . . . . . . . . . . . . . . . . . . . . . . . . . . . . . . . . . . . . . . . . . . . . . . iii
Introduction . . . . . . . . . . . . . . . . . . . . . . . . . . . . . . . . . . . . . . . . . . . . . . . . . . . . . . . . . . . . . . . . . . . .1
Methodology . . . . . . . . . . . . . . . . . . . . . . . . . . . . . . . . . . . . . . . . . . . . . . . . . . . . . . . . . . . . . . . . . . .2
Findings . . . . . . . . . . . . . . . . . . . . . . . . . . . . . . . . . . . . . . . . . . . . . . . . . . . . . . . . . . . . . . . . . . . . . . .6
Fruit . . . . . . . . . . . . . . . . . . . . . . . . . . . . . . . . . . . . . . . . . . . . . . . . . . . . . . . . . . . . . . . . . . . . . . . .6
Vegetables . . . . . . . . . . . . . . . . . . . . . . . . . . . . . . . . . . . . . . . . . . . . . . . . . . . . . . . . . . . . . . . . . . 11
Grains . . . . . . . . . . . . . . . . . . . . . . . . . . . . . . . . . . . . . . . . . . . . . . . . . . . . . . . . . . . . . . . . . . . . . . 16
Protein Foods . . . . . . . . . . . . . . . . . . . . . . . . . . . . . . . . . . . . . . . . . . . . . . . . . . . . . . . . . . . . . . . . 18
Dairy . . . . . . . . . . . . . . . . . . . . . . . . . . . . . . . . . . . . . . . . . . . . . . . . . . . . . . . . . . . . . . . . . . . . . .20
Added Fats and Oils (2010) . . . . . . . . . . . . . . . . . . . . . . . . . . . . . . . . . . . . . . . . . . . . . . . . . . . . .23
Added Sugars and Sweeteners . . . . . . . . . . . . . . . . . . . . . . . . . . . . . . . . . . . . . . . . . . . . . . . . . . .27
Data Limitations . . . . . . . . . . . . . . . . . . . . . . . . . . . . . . . . . . . . . . . . . . . . . . . . . . . . . . . . . . . . . . .29
Sources of Error . . . . . . . . . . . . . . . . . . . . . . . . . . . . . . . . . . . . . . . . . . . . . . . . . . . . . . . . . . . . . .29
Conclusion . . . . . . . . . . . . . . . . . . . . . . . . . . . . . . . . . . . . . . . . . . . . . . . . . . . . . . . . . . . . . . . . . . . .30
Future Research . . . . . . . . . . . . . . . . . . . . . . . . . . . . . . . . . . . . . . . . . . . . . . . . . . . . . . . . . . . . . .30
References . . . . . . . . . . . . . . . . . . . . . . . . . . . . . . . . . . . . . . . . . . . . . . . . . . . . . . . . . . . . . . . . . . . .31
Errata
On February 17, ERS made corrections to three column heading labels in table 8, pages 22-23. In the
first section of the table, on page 22, the first column heading under the column “Change, 1970 to 2014”
was changed from “Pounds per year” to “Gallons per year.” In the last row of column headings on page
23 (labeling the “Total milk and milk products” row), the first column heading “Pounds per person” was
changed to “Pounds per person per year” and, next to that, the second column heading “Pounds” was
changed to “Pounds per year.”
United States Department of Agriculture
A report summary from the Economic Research Service
ERS is a primary source of economic research and
analysis from the U.S. Department of Agriculture, providing timely informa-
tion on economic and policy issues related to agriculture, food, the environment, and
rural America.
www.ers.usda.gov
January 2017
Find the full report at www.ers.usda.gov/
publicationsWhat Is the Issue?
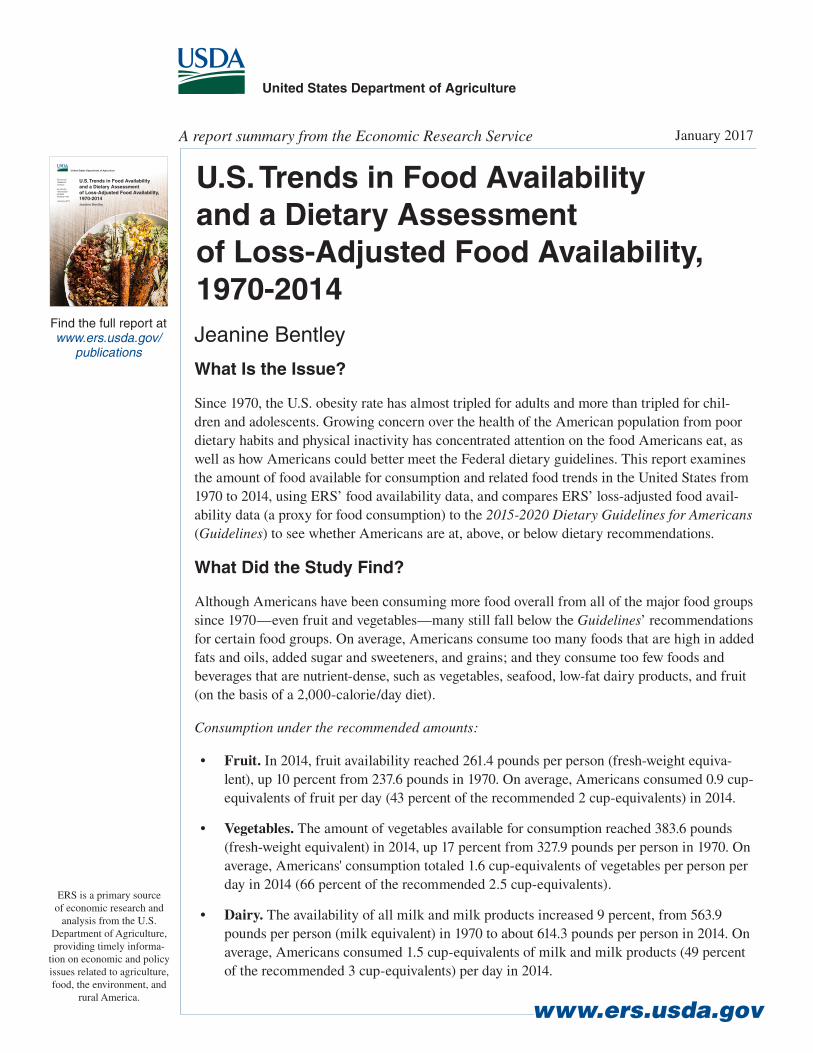
Since 1970, the U.S. obesity rate has almost tripled for adults and more than tripled for chil-dren and adolescents. Growing concern over the health of the American population from poor dietary habits and physical inactivity has concentrated attention on the food Americans eat, as well as how Americans could better meet the Federal dietary guidelines. This report examines the amount of food available for consumption and related food trends in the United States from 1970 to 2014, using ERS’ food availability data, and compares ERS’ loss-adjusted food avail-ability data (a proxy for food consumption) to the 2015-2020 Dietary Guidelines for Americans (Guidelines) to see whether Americans are at, above, or below dietary recommendations.
What Did the Study Find?
Although Americans have been consuming more food overall from all of the major food groups since 1970—even fruit and vegetables—many still fall below the Guidelines’ recommendations for certain food groups. On average, Americans consume too many foods that are high in added fats and oils, added sugar and sweeteners, and grains; and they consume too few foods and beverages that are nutrient-dense, such as vegetables, seafood, low-fat dairy products, and fruit (on the basis of a 2,000-calorie/day diet).
Consumption under the recommended amounts:
• Fruit . In 2014, fruit availability reached 261.4 pounds per person (fresh-weight equiva-lent), up 10 percent from 237.6 pounds in 1970. On average, Americans consumed 0.9 cup-equivalents of fruit per day (43 percent of the recommended 2 cup-equivalents) in 2014.
• Vegetables . The amount of vegetables available for consumption reached 383.6 pounds (fresh-weight equivalent) in 2014, up 17 percent from 327.9 pounds per person in 1970. On average, Americans' consumption totaled 1.6 cup-equivalents of vegetables per person per day in 2014 (66 percent of the recommended 2.5 cup-equivalents).
• Dairy . The availability of all milk and milk products increased 9 percent, from 563.9 pounds per person (milk equivalent) in 1970 to about 614.3 pounds per person in 2014. On average, Americans consumed 1.5 cup-equivalents of milk and milk products (49 percent of the recommended 3 cup-equivalents) per day in 2014.
Economic Research Service
Economic Information Bulletin Number 166
January 2017
U.S. Trends in Food Availability and a Dietary Assessment of Loss-Adjusted Food Availability, 1970-2014Jeanine Bentley
United States Department of Agriculture
Jeanine Bentley
U.S. Trends in Food Availability and a Dietary Assessment of Loss-Adjusted Food Availability, 1970-2014
Consumption over the recommended amounts:
• Grains . The availability of grains (wheat flour, rice, corn products, oat products, and barley products) increased 28 percent, from 136.7 pounds per person in 1970 to 174.4 pounds in 2014 (rice not included after 2010). However, Americans, on average, consumed 6.7 ounce-equivalents of grains per person per day (12 percent over the recommended 6 ounce-equivalents) in 2014.
• Protein foods . From 1970 to 2014, the total amount of protein foods (not including seeds and soy prod-ucts) available for consumption increased 1 percent, from 224.5 pounds per person to 226.6 pounds. On average, Americans consumed an estimated 7.1 ounce-equivalent of meat, poultry, fish, shellfish eggs, and nuts per person per day (29 percent over the recommended 5.5 ounce-equivalents) in 2014.
• Added sugars and sweeteners . In 2014, added sugars and sweeteners available for consumption totaled 131 pounds per person, up 10 percent since 1970. The Guidelines suggest that calories from added sugars and sweeteners should not exceed 10 percent of daily calories (200 calories or 12.5 teaspoons for a 2,000-calorie/day diet). However, Americans, on average, consumed 366 calories (roughly 23 teaspoons) of added sugars and sweeteners in 2014 (83 percent over the recommended 12.5 teaspoon limit).
• Added fats and oils (data only available to 2010) . The availability of added fats and oils reached 82.2 pounds per person (fat-content basis) in 2010, compared with 52.5 pounds per person in 1970. In 2010, Americans, on average, consumed 63 grams of added oils per person per day. Of this amount, 44.7 grams were the recommended “healthy intake of oils,” such as olive and canola oil (66 percent over the recommended amount of 27 grams per day), and 14.7 grams were solid fats from butter, lard, shortening (animal and vegetable), and tallow.
Note: Because of rounding, some calculations based on the numbers cited will not be precisely accurate.
How Was the Study Conducted?
This report presents trends in the amount of food available for consumption from 1970 to 2014 and estimates whether Americans’ consumption was at, above, or below the recommendations in the 2015-2020 Dietary Guidelines for Americans using the food availability data, the loss-adjusted food availability data, and the nutrient availability data in ERS’s Food Availability (Per Capita) Data System. The food availability data track the amount of food available for human consumption in the United States by measuring the movement of food supplies from production through marketing channels for domestic consumption. The loss-adjusted food availability data are derived from the food availability data by adjusting for spoilage and other losses at the primary, retail, and consumer levels to more closely approximate actual intake. The data are different from the National Health and Nutrition Examination Survey (NHANES) in that they do not measure actual food intake by individuals. Once adjusted for loss, the data are then converted to daily food-pattern equiva-lents to estimate whether Americans are at, above, or below the dietary guidelines for the food groups. The nutrient availability data use the food availability data to estimate the amounts per capita per day of calories and nutrients.
www.ers.usda.gov

1 U.S. Trends in Food Availability and a Dietary Assessment of Loss-Adjusted Food Availability, 1970-2014, EIB-166
USDA, Economic Research Service
U.S. Trends in Food Availability and a Dietary Assessment of Loss-Adjusted Food Availability, 1970-2014
Introduction
Since the 1970s, the U.S. obesity rate among adults has almost tripled, from 16 percent in 1971-74 to 46 percent in 2013-14 (Fryar et al., 2016a). The National Center for Health Statistics (NCHS) reports that 32 percent of adults (20 to 74) are overweight. Of that 32 percent, 38.2 percent are obese and 8.1 are extremely obese (using body mass index) in the results from the 2013-14 National Health and Nutrition Examination Survey (NHANES) (Fryar et al., 2016a). Among chil-dren and adolescents (ages 2 to 19 years old), the obesity rate more than tripled from 5.2 percent in 1971-74 to 17.2 percent in 2013-14 (Fryar et al., 2016b). Poor dietary habits and decreased phys-ical activity contributed to obesity and other chronic diseases, including cardiovascular disease and type 2 diabetes (DGA, 2015). Evidence shows that a healthy, nutrient-dense diet and physical activity promote good health and reduce the risk of chronic diseases—principles reflected in the dietary recommendations in the 2015-2020 Dietary Guidelines for Americans (USDA, DGA, 2015). This report examines the amount of food available for consumption and related food trends in the United States from 1970 to 2014 using the U.S. Department of Agriculture (USDA), Economic Research Service’s (ERS) food availability data, and compares the loss-adjusted food availability data to the Guidelines to see whether Americans are at, above, or below dietary recommendations.
2 U.S. Trends in Food Availability and a Dietary Assessment of Loss-Adjusted Food Availability, 1970-2014, EIB-166
USDA, Economic Research Service
Methodology
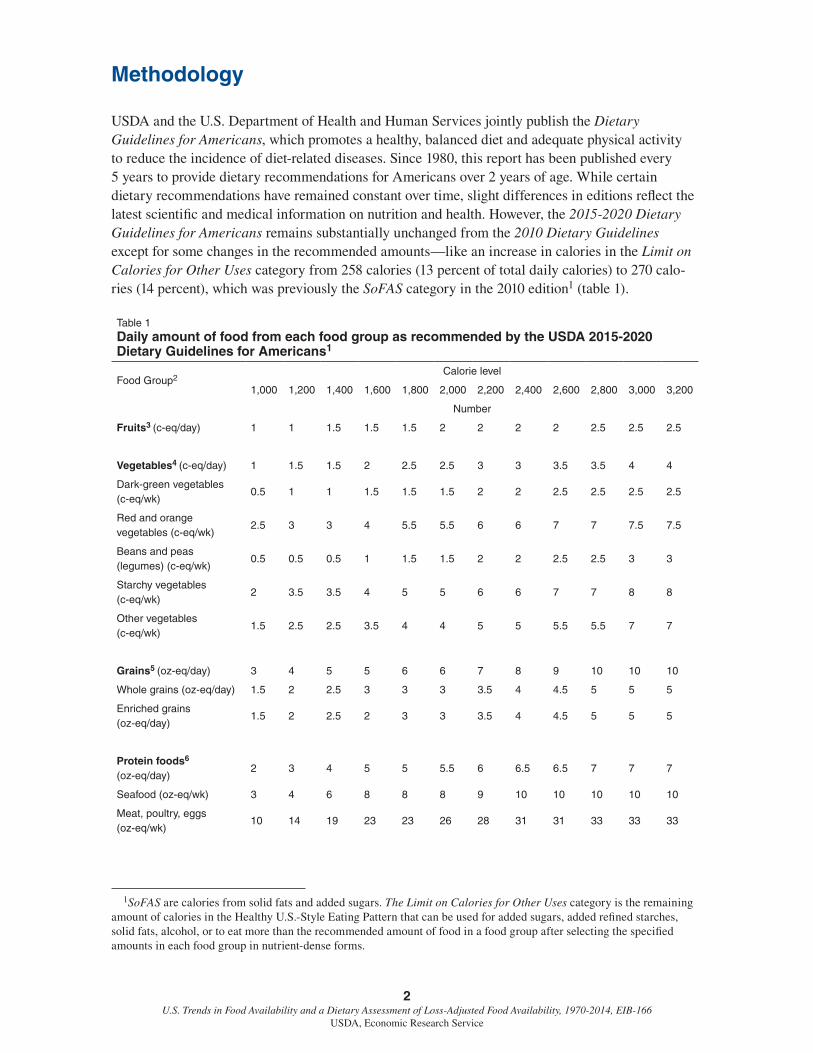
USDA and the U.S. Department of Health and Human Services jointly publish the Dietary Guidelines for Americans, which promotes a healthy, balanced diet and adequate physical activity to reduce the incidence of diet-related diseases. Since 1980, this report has been published every 5 years to provide dietary recommendations for Americans over 2 years of age. While certain dietary recommendations have remained constant over time, slight differences in editions reflect the latest scientific and medical information on nutrition and health. However, the 2015-2020 Dietary Guidelines for Americans remains substantially unchanged from the 2010 Dietary Guidelines except for some changes in the recommended amounts—like an increase in calories in the Limit on Calories for Other Uses category from 258 calories (13 percent of total daily calories) to 270 calo-ries (14 percent), which was previously the SoFAS category in the 2010 edition1 (table 1).
Table 1Daily amount of food from each food group as recommended by the USDA 2015-2020 Dietary Guidelines for Americans1 - continued
Food Group2Calorie level
1,000 1,200 1,400 1,600 1,800 2,000 2,200 2,400 2,600 2,800 3,000 3,200
Number
Fruits3 (c-eq/day) 1 1 1.5 1.5 1.5 2 2 2 2 2.5 2.5 2.5
Vegetables4 (c-eq/day) 1 1.5 1.5 2 2.5 2.5 3 3 3.5 3.5 4 4
Dark-green vegetables (c-eq/wk)
0.5 1 1 1.5 1.5 1.5 2 2 2.5 2.5 2.5 2.5
Red and orange vegetables (c-eq/wk)
2.5 3 3 4 5.5 5.5 6 6 7 7 7.5 7.5
Beans and peas (legumes) (c-eq/wk)
0.5 0.5 0.5 1 1.5 1.5 2 2 2.5 2.5 3 3
Starchy vegetables (c-eq/wk)
2 3.5 3.5 4 5 5 6 6 7 7 8 8
Other vegetables (c-eq/wk)
1.5 2.5 2.5 3.5 4 4 5 5 5.5 5.5 7 7
Grains5 (oz-eq/day) 3 4 5 5 6 6 7 8 9 10 10 10
Whole grains (oz-eq/day) 1.5 2 2.5 3 3 3 3.5 4 4.5 5 5 5
Enriched grains (oz-eq/day)
1.5 2 2.5 2 3 3 3.5 4 4.5 5 5 5
Protein foods6
(oz-eq/day)2 3 4 5 5 5.5 6 6.5 6.5 7 7 7
Seafood (oz-eq/wk) 3 4 6 8 8 8 9 10 10 10 10 10
Meat, poultry, eggs (oz-eq/wk)
10 14 19 23 23 26 28 31 31 33 33 33
1SoFAS are calories from solid fats and added sugars. The Limit on Calories for Other Uses category is the remaining amount of calories in the Healthy U.S.-Style Eating Pattern that can be used for added sugars, added refined starches, solid fats, alcohol, or to eat more than the recommended amount of food in a food group after selecting the specified amounts in each food group in nutrient-dense forms.

3 U.S. Trends in Food Availability and a Dietary Assessment of Loss-Adjusted Food Availability, 1970-2014, EIB-166
USDA, Economic Research Service
Table 1Daily amount of food from each food group as recommended by the USDA 2015-2020 Dietary Guidelines for Americans1 - continued
Food Group2Calorie level
1,000 1,200 1,400 1,600 1,800 2,000 2,200 2,400 2,600 2,800 3,000 3,200
Number
Nuts, seeds, soy products (oz-eq/wk)
2 2 3 4 4 5 5 5 5 6 6 6
Dairy7 (c-eq/day) 2 2.5 2.5 3 3 3 3 3 3 3 3 3
Oils (g/day) 15 17 17 22 24 27 29 31 34 36 44 51
Limit on Calories for Other Uses, calories (% of calories)8
150 100 110 130 170 270 280 350 380 400 470 610
(15%) (8%) (8%) (8%) (9%) (14%) (13%) (15%) (15%) (14%) (16%) (19%)
1All foods are assumed to be in nutrient-dense forms, lean or low-fat and prepared without added fats, sugars, or salt. If all food choices to meet food group recommendations are in nutrient-dense forms, a small number of calories remain within the overall calorie limit of the Pattern (i.e., limit on calories for other uses).2Food group amounts are shown in cup-equivalents per day (c-eq/day), cup-equivalents per week (c-eq/wk), ounce-equiv-alents per day (oz-eq/day) or ounce-equivalents per week (oz-eq/wk). Oils are shown in grams per day (g/day).3The fruit group includes all fresh, frozen, canned, and dried fruits and fruit juices (oranges and orange juice, apples and apple juice, bananas, grapes, melons, berries, raisins). In general, 1 cup equivalent is: 1 cup raw or cooked fruit; ½ cup dried fruit; 1 cup fruit juice.4The vegetable group includes all fresh, frozen, canned, and dried vegetables and vegetable juices (broccoli, spinach, mustard greens, tomatoes, red peppers, kidney beans, lentils, white potatoes, corn). In general, 1 cup equivalent is: 1 cup raw or cooked vegetable; ½ cup dried vegetable; 1 cup vegetable juice; 2 cups leafy salad greens.5The grains group includes all foods made from wheat, rice, oats, cornmeal, and barley (whole-wheat bread, pasta, oat-meal, refined grain cereals, crackers, and brown rice). In general, 1 cup-equivalent is: one-ounce slice bread; 1 ounce dry pasta or rice; ½ cup cooked rice, pasta, or cereal; 1 ounce ready-to-eat cereal (about 1 cup flaked cereal).6The protein group includes all meat, poultry, seafood, eggs, nuts, seeds, and soy products (beef, chicken, turkey, tofu). In general, 1 cup-equivalent is: 1 ounce lean meat, poultry, seafood; 1 egg; 1 Tbsp peanut butter; ½ ounce nuts or seeds. Also, ¼ cup cooked beans or tofu may also be counted as 1 ounce-equivalent.7The milk group includes all fluid milk products and foods made from milk that retain their calcium content (milk, yogurt, cheese, frozen yogurt, fortified soy beverages). Cream, sour cream, and cream cheese are not included due to their low calcium content. In general, 1 cup equivalent is: 1 cup milk, fortified soy beverage, or yogurt; 1½ ounces natural cheese (e.g., cheddar); 2 ounces of processed cheese (e.g., American). The amount of dairy foods in the 1,200 and 1,400 calorie patterns have increased to reflect new recommended daily allowances for calcium that are higher than previous recom-mendations for children ages 4 to 8 years.8Calories up to the specified limit can be used for added sugars, added refined starches, solid fats, alcohol, or to eat more than the recommended amount of food in a food group. The overall eating Pattern also should not exceed the limits of less than 10 percent of calories from added sugars and less than 10 percent of calories from saturated fats.Source: Prepared by USDA, Economic Research Service using data from 2015-2020 Dietary Guidelines for Americans, Appendix 3 “USDA Food Patterns: Healthy U.S.-Style Eating Pattern.”
The key recommendations in the Guidelines include:
• Fruit, especially whole fruit;
• A variety of vegetables from all of the subgroups—dark green, red and orange, legumes (beans and peas), starchy, and other vegetables;
• Grains, at least half of consumption should be whole grains;

4 U.S. Trends in Food Availability and a Dietary Assessment of Loss-Adjusted Food Availability, 1970-2014, EIB-166
USDA, Economic Research Service
• A variety of protein foods, including seafood, lean meats and poultry, eggs, legumes (beans and peas), and nuts, seeds, and soy products;
• Fat-free or low-fat (1-percent) dairy, including milk, yogurt, cheese, and milk products, and/or fortified soy beverages
Additionally, the key recommendations in the Guidelines limit:
• Saturated fat consumption to less than 10 percent of daily calories;
• Added sugars and sweeteners consumption to less than 10 percent of daily calories;
• Sodium consumption to less than 2,300 milligrams (mg) per day
This report updates Wells and Buzby (2008), which used the ERS Food Availability (Per Capita) Data System and the 2005 Dietary Guidelines for Americans to estimate the amount of food avail-able for consumption from 1970 to 2005 for each food group and to determine whether Americans’ consumption was at, above, or below the dietary recommendations.
The ERS Food Availability (Per Capita) Data System is the only time-series data system available that provides proxies for actual food consumption in the United States that spans decades (USDA, ERS, 2016a). The data system contains three separate but related data series—the food availability data, the loss-adjusted food availability data, and the nutrient availability data—that examine food consumption differently.
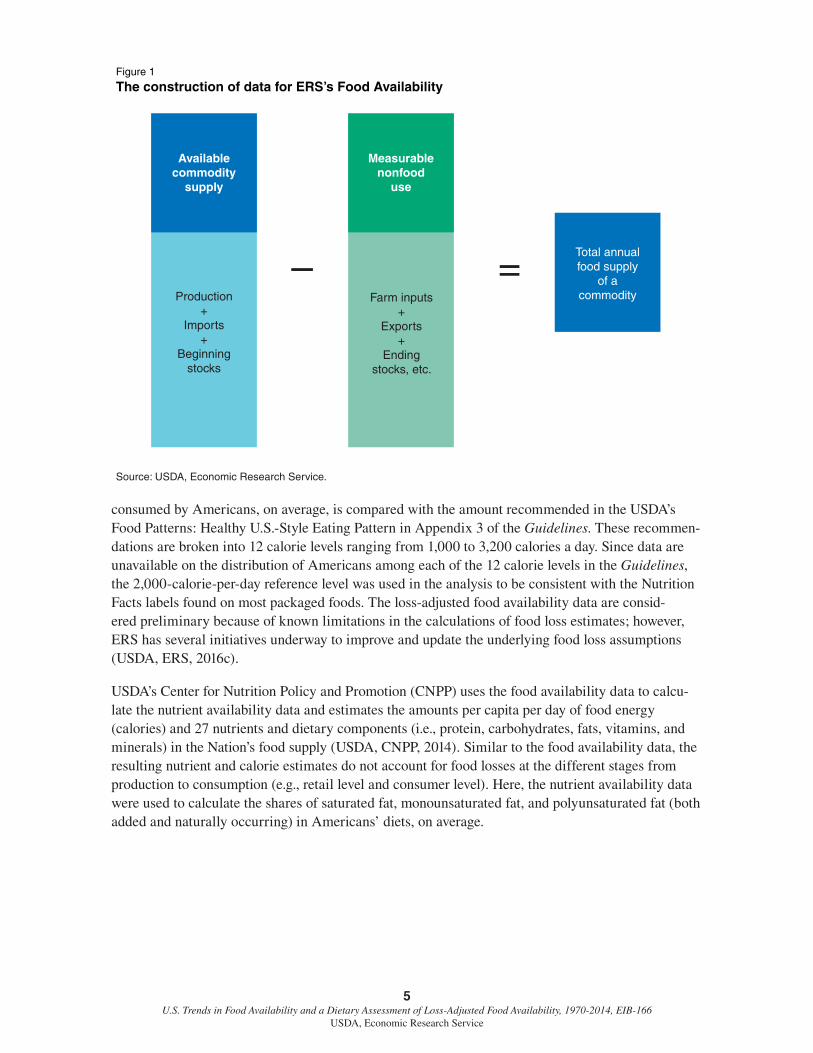
The food availability data calculate the amount of food available for consumption in the United States, extending back to 1909 for many commodities. For a given year, annual production, begin-ning stocks, and imports are collected and combined for each food or commodity (e.g., beef, low-fat milk, and fresh broccoli) (fig. 1). Then, farm inputs, exports, ending stocks, and other nonfood uses are subtracted out of that sum to estimate the amount available for consumption (USDA, ERS, 2016b). Per capita availability estimates are then calculated by dividing the total annual food supply of a commodity by the U.S. population for that year. While food availability data do not directly measure actual consumption, they do serve as useful indicators of food availability trends over time. In this report, the per capita estimates are used to assess food trends from 1970 to 2014.
The loss-adjusted food availability data uses the food availability data and adjusts for spoilage, plate waste, and other losses at the farm, retail, and consumer levels to more closely approximate actual intake (USDA, ERS, 2016c).2 The estimates also incorporate loss assumptions to remove nonedible food parts, such as rinds, seeds, cores, and stems, as estimated in USDA’s Nutrient Database for Standard Reference (USDA, ARS, 2013). The loss-adjusted data are then converted from pounds per capita per year to grams per capita per day into food-pattern equivalents (informally, servings), comparable to those identified in USDA’s Food Pattern Equivalents Database (FPED) (Bowman et al., 2013). The estimated food-pattern equivalents for individual commodities or foods are then aggregated to determine total daily amounts for each food group. In this report, the food-pattern equivalents (cups per day and ounces per day) are compared with the 2,000-calorie-per-day diet recommendations in the Guidelines to provide an estimate of whether Americans are at, above, or below the dietary recommendations for the different food groups. The estimated amount of food
2The data presented are different from the National Health and Nutrition Examination Survey (NHANES) in that they do not measure actual food intake by individuals.
5 U.S. Trends in Food Availability and a Dietary Assessment of Loss-Adjusted Food Availability, 1970-2014, EIB-166
USDA, Economic Research Service
consumed by Americans, on average, is compared with the amount recommended in the USDA’s Food Patterns: Healthy U.S.-Style Eating Pattern in Appendix 3 of the Guidelines. These recommen-dations are broken into 12 calorie levels ranging from 1,000 to 3,200 calories a day. Since data are unavailable on the distribution of Americans among each of the 12 calorie levels in the Guidelines, the 2,000-calorie-per-day reference level was used in the analysis to be consistent with the Nutrition Facts labels found on most packaged foods. The loss-adjusted food availability data are consid-ered preliminary because of known limitations in the calculations of food loss estimates; however, ERS has several initiatives underway to improve and update the underlying food loss assumptions (USDA, ERS, 2016c).
USDA’s Center for Nutrition Policy and Promotion (CNPP) uses the food availability data to calcu-late the nutrient availability data and estimates the amounts per capita per day of food energy (calories) and 27 nutrients and dietary components (i.e., protein, carbohydrates, fats, vitamins, and minerals) in the Nation’s food supply (USDA, CNPP, 2014). Similar to the food availability data, the resulting nutrient and calorie estimates do not account for food losses at the different stages from production to consumption (e.g., retail level and consumer level). Here, the nutrient availability data were used to calculate the shares of saturated fat, monounsaturated fat, and polyunsaturated fat (both added and naturally occurring) in Americans’ diets, on average.
Figure 1
The construction of data for ERS’s Food Availability
Source: USDA, Economic Research Service.
Availablecommodity
supply
Production+
Imports+
Beginningstocks
Farm inputs+
Exports+
Endingstocks, etc.
Measurablenonfood
use
Total annualfood supply
of acommodity
– =

6 U.S. Trends in Food Availability and a Dietary Assessment of Loss-Adjusted Food Availability, 1970-2014, EIB-166
USDA, Economic Research Service
Findings
In 2014, Americans, per person, consumed an estimated 525 calories from grains (mainly refined grains); 366 calories from added sugar and sweeteners; 213 calories from dairy; 513 calories from meat, eggs, and nuts; and 211 calories from fruit and vegetables after adjusting for plate waste, spoilage, and other food losses (fig. 2). Of added fats and oils, Americans, per person, consumed 562 calories in 2010, the latest year available.
Additionally, Americans, on average, were either above or below the recommendations in the Guidelines; they consume too many foods and beverages high in fats and refined grains and too few nutrient-dense foods and beverages (e.g., vegetables, whole grains, low-fat dairy products, seafood, and fruit).
Fruit
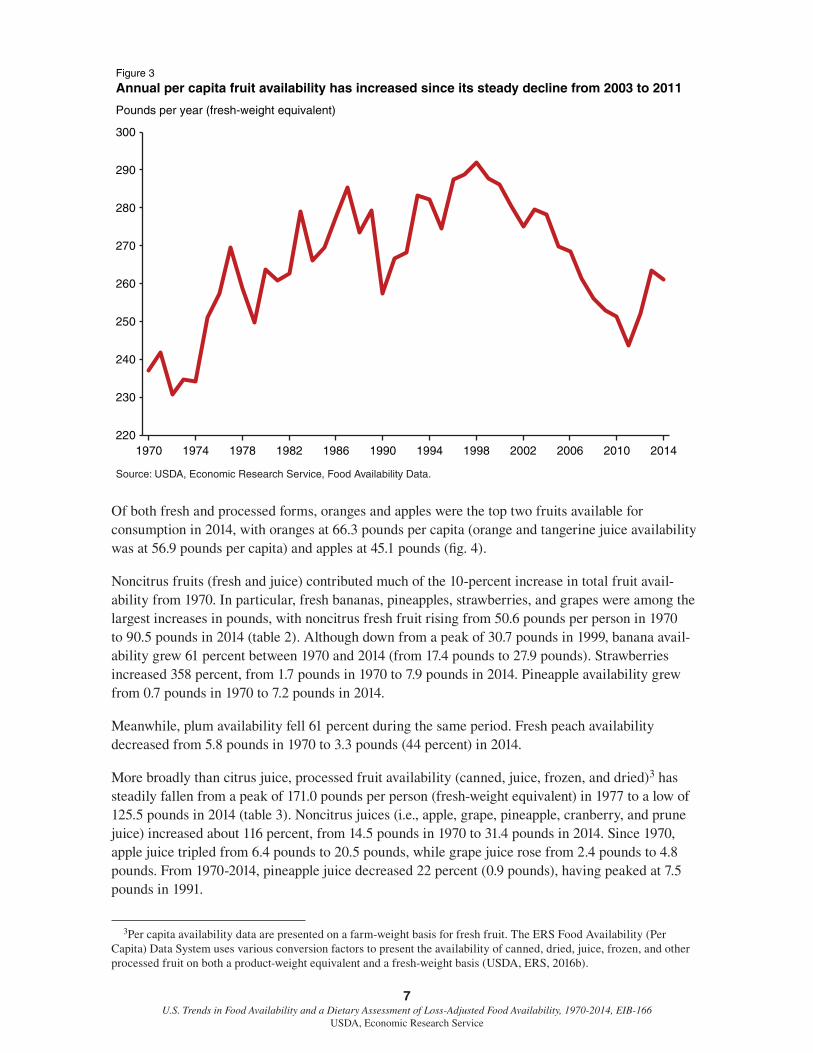
Fruit are relatively low in calories and high in nutrients (USDA, USFGS, 2016). According to the food availability data, fruit availability increased 10 percent (23.7 pounds) from 237.6 pounds in 1970 to 261.4 pounds in 2014, but decreased from a peak of 291.9 pounds in 1998 (fig. 3). The bulk of the decline came from citrus juice (i.e., orange, grapefruit, lemon, and lime juice) (fresh-weight equivalent), which dropped 20 percent from 82.2 pounds per person in 1970 to 65.3 pounds per person in 2014. During that time, orange juice decreased 11.7 pounds (17 percent), while grapefruit juice declined 67 percent, from 11.2 pounds to 3.7 pounds. Weather and disease from citrus canker and citrus greening (which reduced citrus acreage) have partly affected domestic orange and grape-fruit production in recent years (Bentley and Perez, 2015).
Figure 2
Calories by food group, 1970 (inner ring) and 2014 (outer ring)
Note: Loss-Adjusted Food Availability data serve as a proxy for food consumption. Data on added fats and oils and rice were unavailable after 2010. Added fats and oils and added sugars are added to foods during processing or preparation. They do not include naturally occurring fats and sugars in food (e.g., fats in meat or sugars in fruits).Source: USDA, Economic Research Service, Loss-Adjusted Food Availability data.
525
409
211
197
213
234366
333
513
506
337
562
1970
2014
Dairy
Added sugar and sweeteners
Grains
Meat, eggs, and nuts Added fats
and oils (2010)
Fruit and vegetables
7 U.S. Trends in Food Availability and a Dietary Assessment of Loss-Adjusted Food Availability, 1970-2014, EIB-166
USDA, Economic Research Service
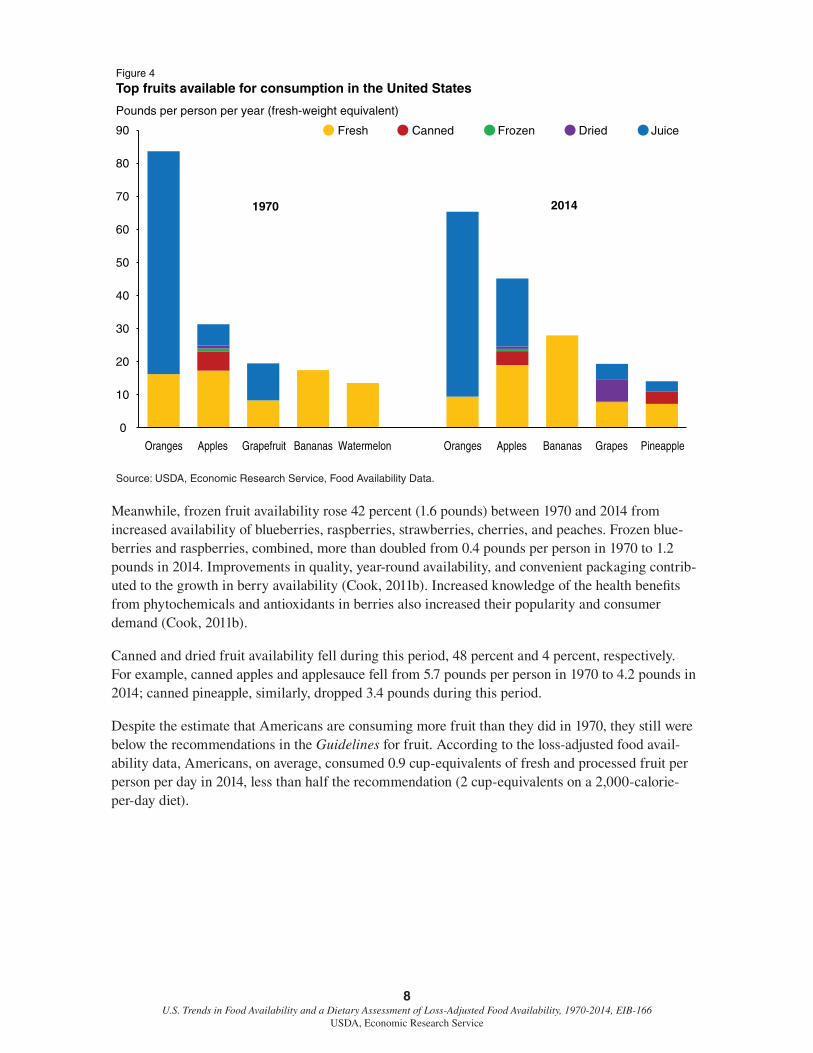
Of both fresh and processed forms, oranges and apples were the top two fruits available for consumption in 2014, with oranges at 66.3 pounds per capita (orange and tangerine juice availability was at 56.9 pounds per capita) and apples at 45.1 pounds (fig. 4).
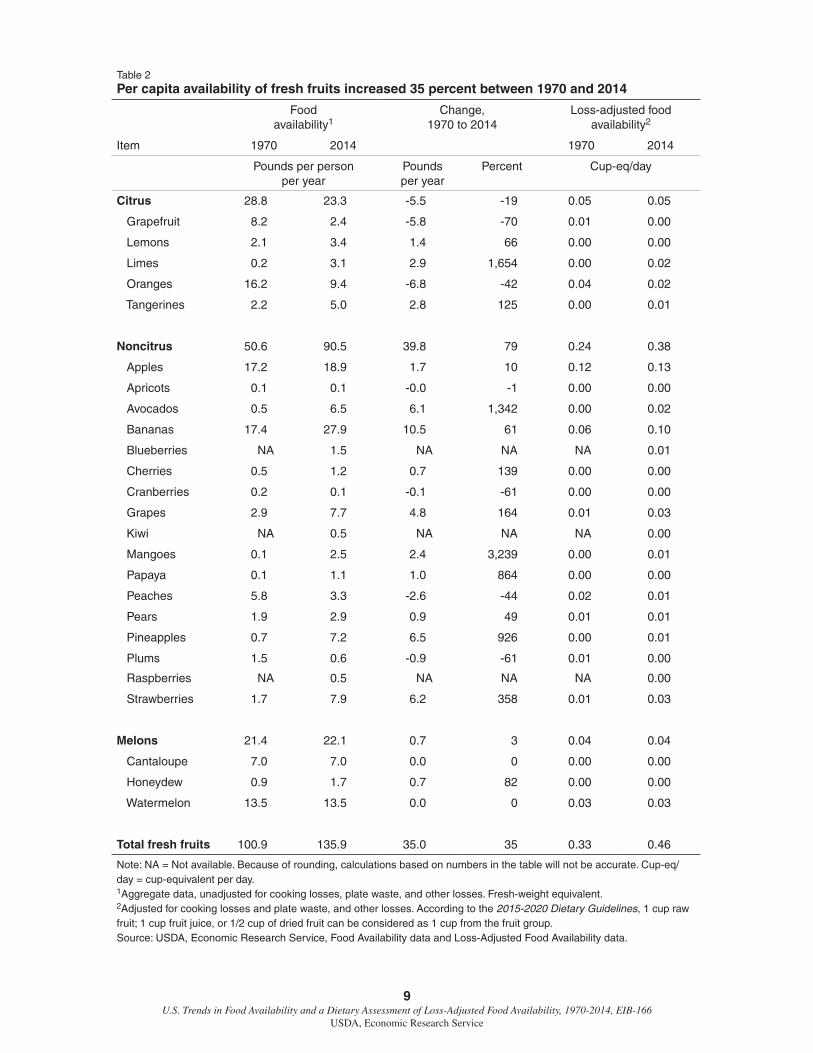
Noncitrus fruits (fresh and juice) contributed much of the 10-percent increase in total fruit avail-ability from 1970. In particular, fresh bananas, pineapples, strawberries, and grapes were among the largest increases in pounds, with noncitrus fresh fruit rising from 50.6 pounds per person in 1970 to 90.5 pounds in 2014 (table 2). Although down from a peak of 30.7 pounds in 1999, banana avail-ability grew 61 percent between 1970 and 2014 (from 17.4 pounds to 27.9 pounds). Strawberries increased 358 percent, from 1.7 pounds in 1970 to 7.9 pounds in 2014. Pineapple availability grew from 0.7 pounds in 1970 to 7.2 pounds in 2014.
Meanwhile, plum availability fell 61 percent during the same period. Fresh peach availability decreased from 5.8 pounds in 1970 to 3.3 pounds (44 percent) in 2014.
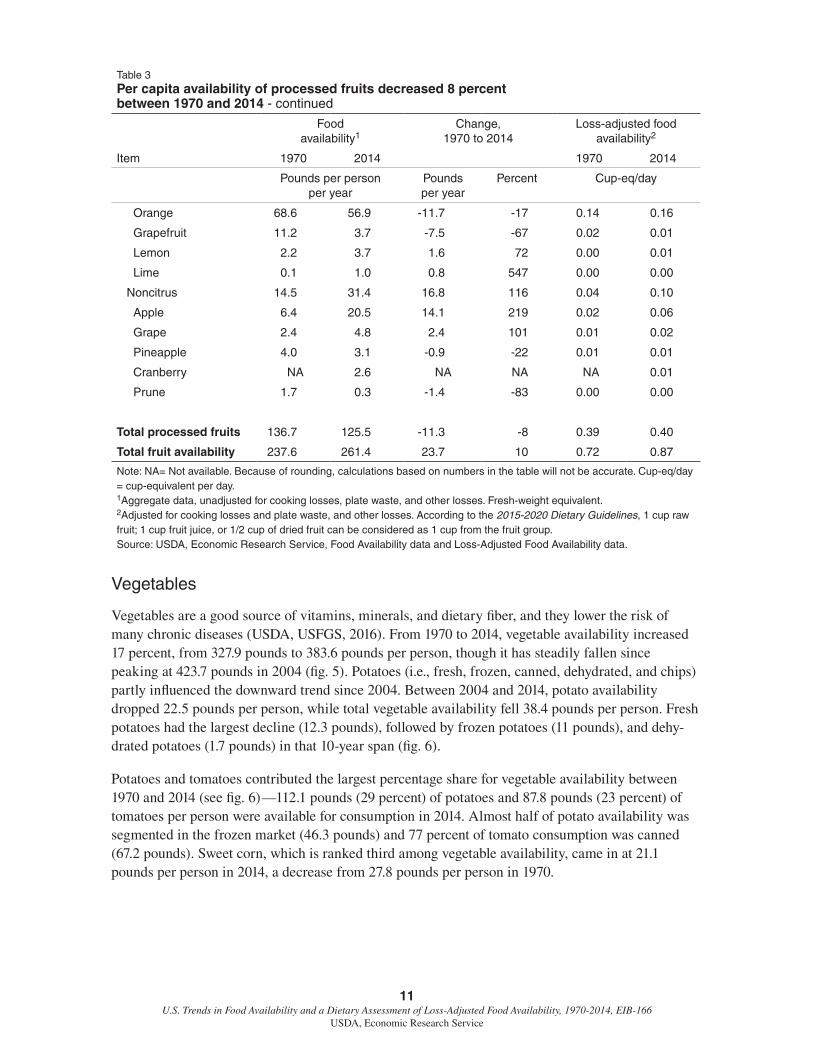
More broadly than citrus juice, processed fruit availability (canned, juice, frozen, and dried)3 has steadily fallen from a peak of 171.0 pounds per person (fresh-weight equivalent) in 1977 to a low of 125.5 pounds in 2014 (table 3). Noncitrus juices (i.e., apple, grape, pineapple, cranberry, and prune juice) increased about 116 percent, from 14.5 pounds in 1970 to 31.4 pounds in 2014. Since 1970, apple juice tripled from 6.4 pounds to 20.5 pounds, while grape juice rose from 2.4 pounds to 4.8 pounds. From 1970-2014, pineapple juice decreased 22 percent (0.9 pounds), having peaked at 7.5 pounds in 1991.
3Per capita availability data are presented on a farm-weight basis for fresh fruit. The ERS Food Availability (Per Capita) Data System uses various conversion factors to present the availability of canned, dried, juice, frozen, and other processed fruit on both a product-weight equivalent and a fresh-weight basis (USDA, ERS, 2016b).
Figure 3
Annual per capita fruit availability has increased since its steady decline from 2003 to 2011
Source: USDA, Economic Research Service, Food Availability Data.
220
230
240
250
260
270
280
290
300
1970 1974 1978 1982 1986 1990 1994 1998 2002 2006 2010 2014
Pounds per year (fresh-weight equivalent)
8 U.S. Trends in Food Availability and a Dietary Assessment of Loss-Adjusted Food Availability, 1970-2014, EIB-166
USDA, Economic Research Service
Meanwhile, frozen fruit availability rose 42 percent (1.6 pounds) between 1970 and 2014 from increased availability of blueberries, raspberries, strawberries, cherries, and peaches. Frozen blue-berries and raspberries, combined, more than doubled from 0.4 pounds per person in 1970 to 1.2 pounds in 2014. Improvements in quality, year-round availability, and convenient packaging contrib-uted to the growth in berry availability (Cook, 2011b). Increased knowledge of the health benefits from phytochemicals and antioxidants in berries also increased their popularity and consumer demand (Cook, 2011b).
Canned and dried fruit availability fell during this period, 48 percent and 4 percent, respectively. For example, canned apples and applesauce fell from 5.7 pounds per person in 1970 to 4.2 pounds in 2014; canned pineapple, similarly, dropped 3.4 pounds during this period.
Despite the estimate that Americans are consuming more fruit than they did in 1970, they still were below the recommendations in the Guidelines for fruit. According to the loss-adjusted food avail-ability data, Americans, on average, consumed 0.9 cup-equivalents of fresh and processed fruit per person per day in 2014, less than half the recommendation (2 cup-equivalents on a 2,000-calorie-per-day diet).
Figure 4
Top fruits available for consumption in the United States
Source: USDA, Economic Research Service, Food Availability Data.
0
10
20
30
40
50
60
70
80
90
Oranges Apples Grapefruit Bananas Watermelon Oranges Apples Bananas Grapes Pineapple
1970 2014
Pounds per person per year (fresh-weight equivalent)
Fresh Canned Frozen Dried Juice
9 U.S. Trends in Food Availability and a Dietary Assessment of Loss-Adjusted Food Availability, 1970-2014, EIB-166
USDA, Economic Research Service
Table 2Per capita availability of fresh fruits increased 35 percent between 1970 and 2014
Food availability1
Change, 1970 to 2014
Loss-adjusted food availability2
Item 1970 2014 1970 2014
Pounds per person per year
Pounds per year
Percent Cup-eq/day
Citrus 28.8 23.3 -5.5 -19 0.05 0.05
Grapefruit 8.2 2.4 -5.8 -70 0.01 0.00
Lemons 2.1 3.4 1.4 66 0.00 0.00
Limes 0.2 3.1 2.9 1,654 0.00 0.02
Oranges 16.2 9.4 -6.8 -42 0.04 0.02
Tangerines 2.2 5.0 2.8 125 0.00 0.01
Noncitrus 50.6 90.5 39.8 79 0.24 0.38
Apples 17.2 18.9 1.7 10 0.12 0.13
Apricots 0.1 0.1 -0.0 -1 0.00 0.00
Avocados 0.5 6.5 6.1 1,342 0.00 0.02
Bananas 17.4 27.9 10.5 61 0.06 0.10
Blueberries NA 1.5 NA NA NA 0.01
Cherries 0.5 1.2 0.7 139 0.00 0.00
Cranberries 0.2 0.1 -0.1 -61 0.00 0.00
Grapes 2.9 7.7 4.8 164 0.01 0.03
Kiwi NA 0.5 NA NA NA 0.00
Mangoes 0.1 2.5 2.4 3,239 0.00 0.01
Papaya 0.1 1.1 1.0 864 0.00 0.00
Peaches 5.8 3.3 -2.6 -44 0.02 0.01
Pears 1.9 2.9 0.9 49 0.01 0.01
Pineapples 0.7 7.2 6.5 926 0.00 0.01
Plums 1.5 0.6 -0.9 -61 0.01 0.00
Raspberries NA 0.5 NA NA NA 0.00
Strawberries 1.7 7.9 6.2 358 0.01 0.03
Melons 21.4 22.1 0.7 3 0.04 0.04
Cantaloupe 7.0 7.0 0.0 0 0.00 0.00
Honeydew 0.9 1.7 0.7 82 0.00 0.00
Watermelon 13.5 13.5 0.0 0 0.03 0.03
Total fresh fruits 100.9 135.9 35.0 35 0.33 0.46
Note: NA = Not available. Because of rounding, calculations based on numbers in the table will not be accurate. Cup-eq/day = cup-equivalent per day.1Aggregate data, unadjusted for cooking losses, plate waste, and other losses. Fresh-weight equivalent.2Adjusted for cooking losses and plate waste, and other losses. According to the 2015-2020 Dietary Guidelines, 1 cup raw fruit; 1 cup fruit juice, or 1/2 cup of dried fruit can be considered as 1 cup from the fruit group.Source: USDA, Economic Research Service, Food Availability data and Loss-Adjusted Food Availability data.

10 U.S. Trends in Food Availability and a Dietary Assessment of Loss-Adjusted Food Availability, 1970-2014, EIB-166
USDA, Economic Research Service
Table 3Per capita availability of processed fruits decreased 8 percent between 1970 and 2014 - continued
Food availability1
Change, 1970 to 2014
Loss-adjusted food availability2
Item 1970 2014 1970 2014
Pounds per person per year
Pounds per year
Percent Cup-eq/day
Canned 26.2 13.7 -12.5 -48 0.14 0.07
Apples and applesauce 5.7 4.2 -1.5 -26 0.03 0.02
Apricots 1.1 0.1 -1.0 -90 0.00 0.00
Cherries 0.5 0.0 -0.4 -89 0.00 0.00
Grapes 0.5 0.1 -0.4 -75 NA NA
Olives 1.0 0.9 -0.1 -8 0.01 0.01
Peaches 6.8 2.6 -4.2 -62 0.04 0.01
Pears 3.3 2.0 -1.3 -40 0.02 0.01
Pineapples 7.1 3.7 -3.4 -48 0.03 0.01
Plums 0.2 0.0 -0.2 -96 0.00 0.00
Dried 10.0 9.6 -0.4 -4 0.03 0.03
Apples 0.9 0.7 -0.2 -19 0.00 0.00
Apricots 0.3 0.4 0.1 34 0.00 0.00
Dates 0.3 0.5 0.2 78 0.00 0.00
Figs 0.6 0.2 -0.4 -67 0.00 0.00
Peaches 0.1 0.2 0.0 36 0.00 0.00
Pears 0.1 0.0 -0.1 -100 0.00 NA
Prunes 1.8 0.9 -0.9 -48 0.01 0.00
Raisins 5.8 6.6 0.8 14 0.02 0.01
Frozen 3.9 5.5 1.6 42 0.02 0.03
Berries 1.7 3.3 1.6 90 0.01 0.02
Blackberries 0.1 0.1 -0.0 -24 0.00 0.00
Blueberries 0.2 0.6 0.4 187 0.00 0.00
Raspberries 0.2 0.5 0.4 224 0.00 0.00
Strawberries 1.2 2.0 0.8 65 0.01 0.01
Other berries 0.1 0.1 0.0 52 0.00 0.00
Other frozen fruit 2.1 2.2 0.1 3 0.01 0.01
Apples 1.0 0.7 -0.3 -33 0.00 0.00
Apricots 0.1 0.0 -0.0 -51 0.00 0.00
Cherries 0.7 0.8 0.2 23 0.00 0.00
Peaches 0.4 0.7 0.3 84 0.00 0.00
Plums 0.0 0.0 -0.0 -95 0.00 0.00
Juice 96.7 96.7 0.0 0 0.20 0.27
Citrus 82.2 65.3 -16.8 -20 0.16 0.17
11 U.S. Trends in Food Availability and a Dietary Assessment of Loss-Adjusted Food Availability, 1970-2014, EIB-166
USDA, Economic Research Service
Table 3Per capita availability of processed fruits decreased 8 percent between 1970 and 2014 - continued
Food availability1
Change, 1970 to 2014
Loss-adjusted food availability2
Item 1970 2014 1970 2014
Pounds per person per year
Pounds per year
Percent Cup-eq/day
Orange 68.6 56.9 -11.7 -17 0.14 0.16
Grapefruit 11.2 3.7 -7.5 -67 0.02 0.01
Lemon 2.2 3.7 1.6 72 0.00 0.01
Lime 0.1 1.0 0.8 547 0.00 0.00
Noncitrus 14.5 31.4 16.8 116 0.04 0.10
Apple 6.4 20.5 14.1 219 0.02 0.06
Grape 2.4 4.8 2.4 101 0.01 0.02
Pineapple 4.0 3.1 -0.9 -22 0.01 0.01
Cranberry NA 2.6 NA NA NA 0.01
Prune 1.7 0.3 -1.4 -83 0.00 0.00
Total processed fruits 136.7 125.5 -11.3 -8 0.39 0.40
Total fruit availability 237.6 261.4 23.7 10 0.72 0.87
Note: NA= Not available. Because of rounding, calculations based on numbers in the table will not be accurate. Cup-eq/day = cup-equivalent per day.1Aggregate data, unadjusted for cooking losses, plate waste, and other losses. Fresh-weight equivalent.2Adjusted for cooking losses and plate waste, and other losses. According to the 2015-2020 Dietary Guidelines, 1 cup raw fruit; 1 cup fruit juice, or 1/2 cup of dried fruit can be considered as 1 cup from the fruit group.Source: USDA, Economic Research Service, Food Availability data and Loss-Adjusted Food Availability data.
Vegetables
Vegetables are a good source of vitamins, minerals, and dietary fiber, and they lower the risk of many chronic diseases (USDA, USFGS, 2016). From 1970 to 2014, vegetable availability increased 17 percent, from 327.9 pounds to 383.6 pounds per person, though it has steadily fallen since peaking at 423.7 pounds in 2004 (fig. 5). Potatoes (i.e., fresh, frozen, canned, dehydrated, and chips) partly influenced the downward trend since 2004. Between 2004 and 2014, potato availability dropped 22.5 pounds per person, while total vegetable availability fell 38.4 pounds per person. Fresh potatoes had the largest decline (12.3 pounds), followed by frozen potatoes (11 pounds), and dehy-drated potatoes (1.7 pounds) in that 10-year span (fig. 6).
Potatoes and tomatoes contributed the largest percentage share for vegetable availability between 1970 and 2014 (see fig. 6)—112.1 pounds (29 percent) of potatoes and 87.8 pounds (23 percent) of tomatoes per person were available for consumption in 2014. Almost half of potato availability was segmented in the frozen market (46.3 pounds) and 77 percent of tomato consumption was canned (67.2 pounds). Sweet corn, which is ranked third among vegetable availability, came in at 21.1 pounds per person in 2014, a decrease from 27.8 pounds per person in 1970.

12 U.S. Trends in Food Availability and a Dietary Assessment of Loss-Adjusted Food Availability, 1970-2014, EIB-166
USDA, Economic Research Service
Figure 5
Annual per capita vegetable availability peaked at 424.3 pounds in 1996
Source: USDA, Economic Research Service, Food Availability Data.
Pounds (fresh-weight equivalent) per year
300
320
340
360
380
400
420
440
1970 1974 1978 1982 1986 1990 1994 1998 2002 2006 2010 2014
Figure 6
Top vegetables available for consumption in the United States
Source: USDA, Economic Research Service, Food Availability Data.
Pounds per person per year (fresh-weight equivalent)
Fresh Canned Frozen Dehydrated Potato Chips
0
20
40
60
80
100
120
140
Potatoes Tomatoes Sweet corn Headlettuce
Onions Potatoes Tomatoes Sweet corn Onions Headlettuce
19702014

13 U.S. Trends in Food Availability and a Dietary Assessment of Loss-Adjusted Food Availability, 1970-2014, EIB-166
USDA, Economic Research Service
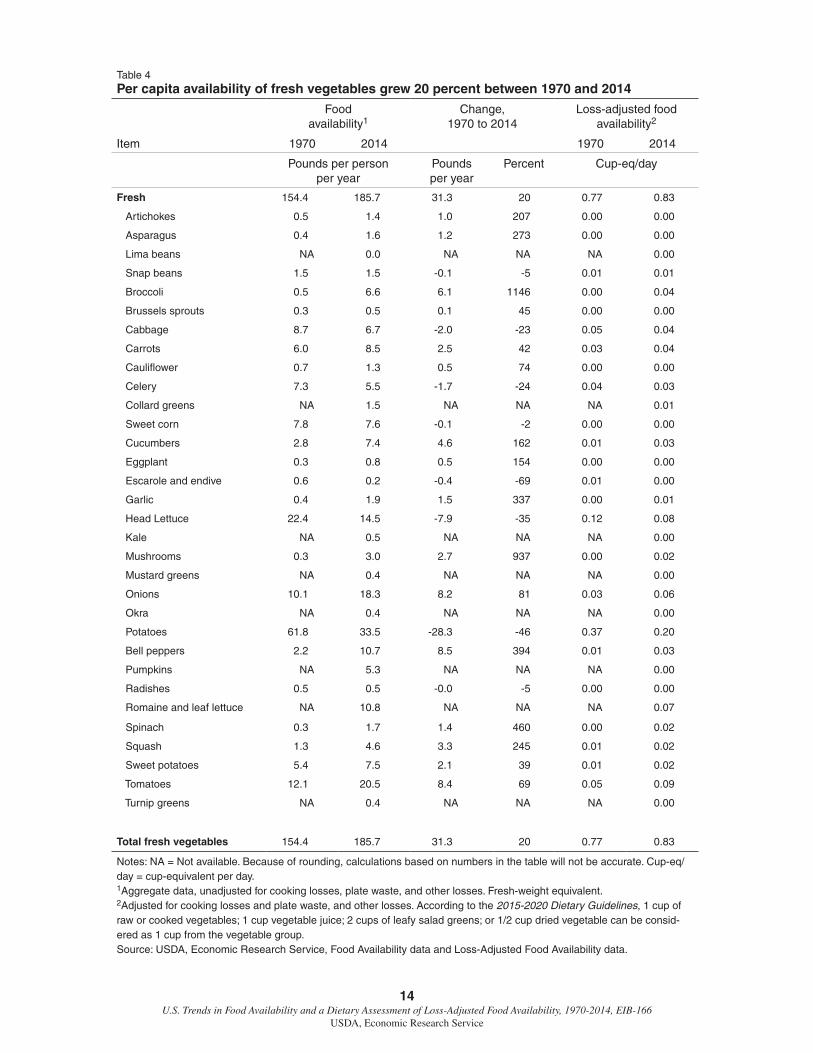
Fresh vegetables increased 20 percent during this period (table 4), largely contributing to the 17-percent growth in total vegetable availability (table 5).4 Fresh bell peppers, tomatoes, onions, broccoli, and cucumbers all contributed to the increase in fresh vegetable availability. Bell peppers rose from 2.2 pounds per person in 1970 to 10.7 pounds in 2014; fresh tomatoes increased 8.4 pounds; and fresh onions increased 8.2 pounds. Broccoli and cucumber availability, combined, increased 10.7 pounds in the 44 years. Increased awareness of the health benefits of fresh vegetables, as well as year-round availability from imports, contributed to this growth (Cook, 2011a).
Per capita availability of fresh dark-green and leafy vegetables—escarole, romaine and leaf lettuce, broccoli, collard greens, kale, mustard greens, spinach, and turnip greens—increased from 1.4 pounds per person in 1970 to 22.1 pounds in 2014. This increase is partly due to the introduction of romaine lettuce to the Food Availability (Per Capita) Data System in 1985, and collard greens, kale, mustard greens, and turnip greens in 1997. Additionally, collard greens rose to 1.5 pounds in 2014 (the highest recorded since tracking the data in 1997), broccoli grew over 1,100 percent (from 0.5 pounds in 1970 to 6.6 pounds in 2014), and romaine and leaf lettuce more than tripled from 1985 to 2014 (from 3.3 pounds per person to 10.8 pounds). The increased availability of prepackaged, ready-to-eat salad greens also contributed to this increase (Thornsbury et al., 2012). In contrast, the avail-ability of head lettuce in fresh vegetables dropped to 14.5 pounds per person in 2014.
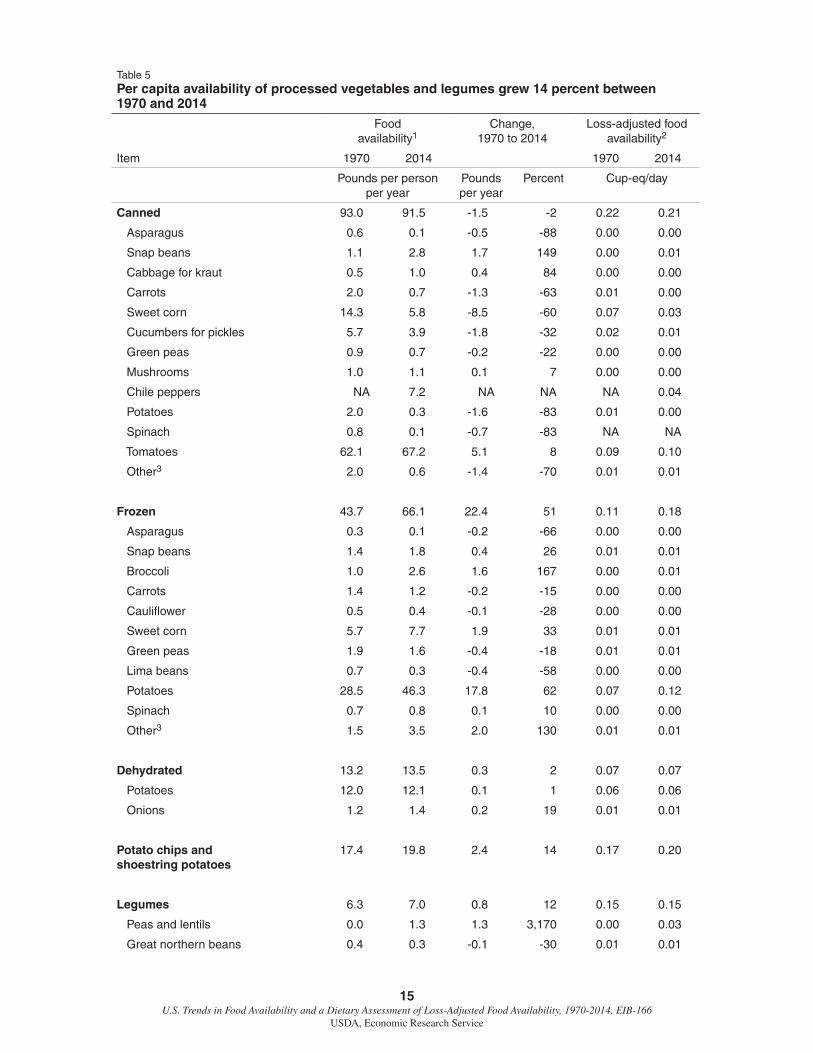
Processed vegetable availability (canned, frozen, and dehydrated forms)5 and legumes increased 14 percent, from 173.5 pounds per person (fresh-weight equivalent) in 1970 to 197.9 pounds in 2014 (see table 5). Despite the increase, canned vegetable availability declined 2 percent, from 93.0 pounds per person to 91.5 pounds per person in 2014. Canned tomatoes had a 74-percent share of canned vegetable availability in 2014, increasing 5.1 pounds over the 44 years. Canned snap beans, cabbage for kraut, and canned mushrooms rose as well.
Frozen vegetable availability climbed to 66.1 pounds in 2014. Frozen potatoes contributed to the bulk of the increase, growing from 28.5 pounds per person in 1970 to 46.3 pounds per person in 2014 (62 percent). In addition, frozen sweet corn increased 1.9 pounds per person over this period, while broccoli grew 1.6 pounds per person.
Legumes (i.e., pulses and beans, including peas and lentils)6 increased from 6.3 pounds per person in 1970 to 7.0 pounds per person in 2014 (12 percent), despite declines in the availability of great northern beans, lima beans, and navy beans. The availability of pinto beans grew 19 percent over this time period.
While total vegetable consumption has increased since 1970, Americans’ consumption of vegetables was below the recommendations in the Guidelines. Americans consumed an average of 1.6 cup-equivalents of fresh and processed vegetables per person per day in 2014, about 66 percent of the recommended 2.5 cup-equivalents on a 2,000-calorie-per-day diet.
4Lima beans were introduced to the Food Availability (Per Capita) Data System in 1989; pumpkin was introduced in 1987; and okra was introduced in 1974.
5Since the food availability tables of vegetables for freezing, canning, and dehydrating are presented on a fresh-weight basis, all product weight data for imports, exports, pack, and stocks are converted to a fresh-weight basis using conver-sion factors.
6This category includes both fresh and processing beans.
14 U.S. Trends in Food Availability and a Dietary Assessment of Loss-Adjusted Food Availability, 1970-2014, EIB-166
USDA, Economic Research Service
Table 4Per capita availability of fresh vegetables grew 20 percent between 1970 and 2014
Food availability1
Change, 1970 to 2014
Loss-adjusted food availability2
Item 1970 2014 1970 2014
Pounds per person per year
Pounds per year
Percent Cup-eq/day
Fresh 154.4 185.7 31.3 20 0.77 0.83
Artichokes 0.5 1.4 1.0 207 0.00 0.00
Asparagus 0.4 1.6 1.2 273 0.00 0.00
Lima beans NA 0.0 NA NA NA 0.00
Snap beans 1.5 1.5 -0.1 -5 0.01 0.01
Broccoli 0.5 6.6 6.1 1146 0.00 0.04
Brussels sprouts 0.3 0.5 0.1 45 0.00 0.00
Cabbage 8.7 6.7 -2.0 -23 0.05 0.04
Carrots 6.0 8.5 2.5 42 0.03 0.04
Cauliflower 0.7 1.3 0.5 74 0.00 0.00
Celery 7.3 5.5 -1.7 -24 0.04 0.03
Collard greens NA 1.5 NA NA NA 0.01
Sweet corn 7.8 7.6 -0.1 -2 0.00 0.00
Cucumbers 2.8 7.4 4.6 162 0.01 0.03
Eggplant 0.3 0.8 0.5 154 0.00 0.00
Escarole and endive 0.6 0.2 -0.4 -69 0.01 0.00
Garlic 0.4 1.9 1.5 337 0.00 0.01
Head Lettuce 22.4 14.5 -7.9 -35 0.12 0.08
Kale NA 0.5 NA NA NA 0.00
Mushrooms 0.3 3.0 2.7 937 0.00 0.02
Mustard greens NA 0.4 NA NA NA 0.00
Onions 10.1 18.3 8.2 81 0.03 0.06
Okra NA 0.4 NA NA NA 0.00
Potatoes 61.8 33.5 -28.3 -46 0.37 0.20
Bell peppers 2.2 10.7 8.5 394 0.01 0.03
Pumpkins NA 5.3 NA NA NA 0.00
Radishes 0.5 0.5 -0.0 -5 0.00 0.00
Romaine and leaf lettuce NA 10.8 NA NA NA 0.07
Spinach 0.3 1.7 1.4 460 0.00 0.02
Squash 1.3 4.6 3.3 245 0.01 0.02
Sweet potatoes 5.4 7.5 2.1 39 0.01 0.02
Tomatoes 12.1 20.5 8.4 69 0.05 0.09
Turnip greens NA 0.4 NA NA NA 0.00
Total fresh vegetables 154.4 185.7 31.3 20 0.77 0.83
Notes: NA = Not available. Because of rounding, calculations based on numbers in the table will not be accurate. Cup-eq/day = cup-equivalent per day. 1Aggregate data, unadjusted for cooking losses, plate waste, and other losses. Fresh-weight equivalent. 2Adjusted for cooking losses and plate waste, and other losses. According to the 2015-2020 Dietary Guidelines, 1 cup of raw or cooked vegetables; 1 cup vegetable juice; 2 cups of leafy salad greens; or 1/2 cup dried vegetable can be consid-ered as 1 cup from the vegetable group.Source: USDA, Economic Research Service, Food Availability data and Loss-Adjusted Food Availability data.
15 U.S. Trends in Food Availability and a Dietary Assessment of Loss-Adjusted Food Availability, 1970-2014, EIB-166
USDA, Economic Research Service
Table 5Per capita availability of processed vegetables and legumes grew 14 percent between 1970 and 2014 - continued
Food availability1
Change, 1970 to 2014
Loss-adjusted food availability2
Item 1970 2014 1970 2014
Pounds per person per year
Pounds per year
Percent Cup-eq/day
Canned 93.0 91.5 -1.5 -2 0.22 0.21
Asparagus 0.6 0.1 -0.5 -88 0.00 0.00
Snap beans 1.1 2.8 1.7 149 0.00 0.01
Cabbage for kraut 0.5 1.0 0.4 84 0.00 0.00
Carrots 2.0 0.7 -1.3 -63 0.01 0.00
Sweet corn 14.3 5.8 -8.5 -60 0.07 0.03
Cucumbers for pickles 5.7 3.9 -1.8 -32 0.02 0.01
Green peas 0.9 0.7 -0.2 -22 0.00 0.00
Mushrooms 1.0 1.1 0.1 7 0.00 0.00
Chile peppers NA 7.2 NA NA NA 0.04
Potatoes 2.0 0.3 -1.6 -83 0.01 0.00
Spinach 0.8 0.1 -0.7 -83 NA NA
Tomatoes 62.1 67.2 5.1 8 0.09 0.10
Other3 2.0 0.6 -1.4 -70 0.01 0.01
Frozen 43.7 66.1 22.4 51 0.11 0.18
Asparagus 0.3 0.1 -0.2 -66 0.00 0.00
Snap beans 1.4 1.8 0.4 26 0.01 0.01
Broccoli 1.0 2.6 1.6 167 0.00 0.01
Carrots 1.4 1.2 -0.2 -15 0.00 0.00
Cauliflower 0.5 0.4 -0.1 -28 0.00 0.00
Sweet corn 5.7 7.7 1.9 33 0.01 0.01
Green peas 1.9 1.6 -0.4 -18 0.01 0.01
Lima beans 0.7 0.3 -0.4 -58 0.00 0.00
Potatoes 28.5 46.3 17.8 62 0.07 0.12
Spinach 0.7 0.8 0.1 10 0.00 0.00
Other3 1.5 3.5 2.0 130 0.01 0.01
Dehydrated 13.2 13.5 0.3 2 0.07 0.07
Potatoes 12.0 12.1 0.1 1 0.06 0.06
Onions 1.2 1.4 0.2 19 0.01 0.01
Potato chips and shoestring potatoes
17.4 19.8 2.4 14 0.17 0.20
Legumes 6.3 7.0 0.8 12 0.15 0.15
Peas and lentils 0.0 1.3 1.3 3,170 0.00 0.03
Great northern beans 0.4 0.3 -0.1 -30 0.01 0.01

16 U.S. Trends in Food Availability and a Dietary Assessment of Loss-Adjusted Food Availability, 1970-2014, EIB-166
USDA, Economic Research Service
Table 5Per capita availability of processed vegetables and legumes grew 14 percent between 1970 and 2014 - continued
Food availability1
Change, 1970 to 2014
Loss-adjusted food availability2
Item 1970 2014 1970 2014
Pounds per person per year
Pounds per year
Percent Cup-eq/day
Lima beans 0.4 0.0 -0.3 -98 0.01 0.00
Navy beans 1.7 0.0 -1.7 -99 0.04 0.00
Pinto beans 2.2 2.7 0.4 19 0.06 0.07
Red kidney beans 0.4 0.4 -0.1 -15 0.01 0.01
Other dry beans4 1.1 2.4 1.3 113 0.03 0.04
Total processed vegetables 173.5 197.9 24.4 14 0.72 0.81
Total vegetable availability (fresh and processed)
327.9 383.6 55.7 17 1.49 1.64
Notes: NA = Not available. Because of rounding, calculations based on numbers in the table will not be accurate. Cup-eq/day = cup-equivalent per day.1Aggregate data, unadjusted for cooking losses, plate waste, and other losses. Fresh-weight equivalent.2Adjusted for cooking losses and plate waste, and other losses. According to the 2015-2020 Dietary Guidelines for Ameri-cans, 1 cup of raw or cooked vegetables; 1 cup vegetable juice; 2 cups of leafy salad greens; or 1/2 cup dried vegetable can be considered as 1 cup from the vegetable group. 3Other includes lima beans and beets for canning. 4Other dry beans includes dry black beans.Source: USDA, Economic Research Service, Food Availability data and Loss-Adjusted Food Availability data.
Grains
Grains provide several vitamins (e.g., thiamin, riboflavin, niacin, and folate) and minerals (e.g., iron, and magnesium) that are important for maintaining health by reducing the risk of heart disease and aiding in weight management (USFGS, 2016). Whole grains are also a good source of dietary fiber, which may reduce blood cholesterol levels and promote proper bowel function (USFGS, 2016). According to ERS’s food availability data, the amount of grains available for consumption increased 28 percent, from 136.7 pounds per capita in 1970 to 174.4 pounds in 20147 (fig. 7).
Of the 37.7-pound increase in total grains between 1970 and 2014, corn products contributed 22.9 pounds, while 23.8 pounds came from wheat flour (i.e., white and whole wheat flour and durum flour) (table 6). Barley availability fell from 1.0 pound in 1970 to 0.7 pounds in 2014.
The Guidelines recommend that half of the daily grain allowance be from whole grains (e.g., whole-wheat bread, whole-grain cereals and crackers, oatmeal, quinoa, popcorn, and brown rice) and that Americans on a 2,000-calorie-per-day diet consume 6 ounce-equivalents (oz-eq) of grains per day, at least 3 oz-eq of which are whole grains. However, Americans, on average, consumed 6.7 oz-eq of grains per day (12 percent over the recommended amount) in 2014, and that was mostly refined grains. Since the database contains significant gaps for whole grains (such as popcorn, whole-grain products, and other whole grains) and no longer has data on rice since 2010, the data cannot provide a comprehensive estimate of the per capita consumption.
7Rice not included after 2010.

17 U.S. Trends in Food Availability and a Dietary Assessment of Loss-Adjusted Food Availability, 1970-2014, EIB-166
USDA, Economic Research Service
Table 6Per capita availability of grains increased 28 percent between 1970 and 2014
Foodavailability1
Change,1970 to 2014
Loss-adjusted food availability2
Item 1970 2014 1970 2014
Pounds per person per year
Pounds per year
Percent Oz-eq/day
Total wheat flour 110.9 134.7 23.8 21 4.00 4.91
White and wholewheat flour 104.0 134.7 30.7 30 3.79 4.91
Durum wheat flour3 6.9 NA NA NA 0.21 NA
Rye flour 1.2 0.5 -0.7 -60 0.07 0.03
Rice (milled)4 7.7 NA NA NA 0.20 NA
Total corn products 11.1 34.0 22.9 206 0.55 1.66
Corn flour and meal 7.0 19.9 12.9 184 0.35 0.99
Hominy and grits 2.2 9.5 7.3 332 0.10 0.42
Corn starch 1.9 4.6 2.7 142 0.10 0.25
Oat products 4.8 4.5 -0.3 -5 0.12 0.11
Barley products 1.0 0.7 -0.3 -30 0.03 0.02
Total grains 136.7 174.4 37.7 28 4.96 6.73
Notes: NA = Not available. Because of rounding, calculations based on numbers in the table will not be accurate. Cup-eq/day = cup-equivalent per day.1Aggregate data, unadjusted for cooking losses, plate waste, and other losses. 2Adjusted for cooking losses, plate waste, and other losses. According to 2015-2020 Dietary Guidelines for Americans,1/2 cup of cooked rice, pasta, or cereal; 1 ounce dry pasta or rice; 1 medium (1 ounce) slice of bread; 1 ounce of ready-to-eat cereal (about 1 cup of flaked cereal) can be considered as 1 oz-eq from the grains group. At least half of all grains consumed should be whole grains. 3Includes flour equivalent of imported pasta products. 4Rice not available after 2010.Source: USDA, Economic Research Service, Food Availability data and Loss-Adjusted Food Availability data.
Figure 7
Per capita total grain availability grew by 58 pounds between 1970 and 2010
Note: Rice is unavailable after 2010. Source: USDA, Economic Research Service, Food Availability Data.
Pounds per person per year
0
20
40
60
80
100
120
140
160
180
200
1970 1974 1978 1982 1986 1990 1994 1998 2002 2006 2010 2014
Wheat flour Rice Corn products
Oat Products Barley and rye products Total

18 U.S. Trends in Food Availability and a Dietary Assessment of Loss-Adjusted Food Availability, 1970-2014, EIB-166
USDA, Economic Research Service
Protein Foods
Protein foods8 provide protein, niacin, thiamin, riboflavin, vitamin B6, iron, zinc, and magnesium, which build bones and muscles, formulate red blood cells, and promote proper immune system func-tion (USFGS, 2016). According to the food availability data, the per capita supply of protein foods increased 1 percent, from 224.5 pounds in 1970 to about 226.6 pounds in 2014, though has declined 19 pounds since 2004 (fig. 8).
Chicken contributed the most to the 1-percent growth during this period, more than doubling from 27.4 pounds per person in 1970 to 58.7 pounds per person in 2014 (table 7). Chicken availability overtook pork in 1996 as the second-most-available protein food, and then surpassed beef in 2010 as the most available protein food. Skinless, boneless, breasts, breaded chicken nuggets, and ready-to-serve chicken offerings contributed to the increase in chicken availability (Bentley, 2012).
Overall, red meat availability (i.e., beef, pork, veal, lamb, and mutton) declined significantly from its high of 136.1 pounds per person in 1971 to 95.4 pounds per person in 2014 (30 percent). After peaking at 88.8 pounds per capita (boneless, edible basis) in 1976, beef availability declined, drop-ping 35 percent between 1970 and 2014. Per capita availability of pork also fell during this period, declining 11 percent from 48.1 pounds per person in 1970 to 43.1 pounds in 2014. Veal, lamb, and mutton dropped to 0.9 pounds in 2014, compared to 4.2 pounds in 1970.
8Does not include seeds or soy products.
Figure 8
Annual protein food availability declined 19 pounds between 2006 and 2012
Source: USDA, Economic Research Service, Food Availability Data.
190
200
210
220
230
240
250
1970 1974 1978 1982 1986 1990 1994 1998 2002 2006 2010 2014
Pounds per person per year

19 U.S. Trends in Food Availability and a Dietary Assessment of Loss-Adjusted Food Availability, 1970-2014, EIB-166
USDA, Economic Research Service
The Guidelines recommend Americans consume 5.5 oz-eq from the protein foods group (meat, poultry, fish, shellfish, eggs, nuts, seeds, and soy products)9 per person as part of a 2,000-calorie-per-day diet. In addition, lean forms should be chosen for meats and poultry, and nuts and seeds should be unsalted. Processed meats and processed poultry may be included as long as the resulting eating pattern is within limits for sodium, calories from saturated fats and added sugars, and total calories. According to the loss-adjusted food availability data, Americans consumed 7.1 oz-eq of meat, poultry, fish, eggs, and nuts per person per day in 2014 (i.e., not including legumes), 29 percent over the recommended amount of 5.5 oz-eq.
Table 7Per capita availability of protein foods grew 1 percent between 1970 and 20141
Food availability2, 4
Change,1970 to 2014
Loss-adjusted food availability3
Item 1970 2014 1970 2014
Pounds per person per year
Pounds per year
Percent Oz-eq/day
Total meat, poultry, fish, and shellfish
177.5 181.0 3.5 2 5.54 5.74
Red meat 131.9 95.4 -36.5 -28 4.22 3.04
Beef 79.6 51.5 -28.1 -35 2.67 1.73
Pork 48.1 43.1 -5.1 -11 1.43 1.28
Veal, lamb, and mutton 4.2 0.9 -3.3 -78 0.12 0.03
Poultry 33.8 71.1 37.3 110 1.16 2.44
Chicken 27.4 58.7 31.3 114 0.98 2.10
Turkey 6.4 12.4 6.0 94 0.18 0.34
Fish and shellfish 11.8 14.5 2.7 23 0.17 0.26
Eggs 39.5 34.3 -5.2 -13 0.59 0.50
Nuts (Including peanut butter) 7.4 11.2 3.8 51 0.57 0.84
Total protein foods 224.5 226.6 2.1 1 6.71 7.08
Notes: NA = Not available. Because of rounding, calculations based on numbers in the table will not be accurate. Oz-eq/day = ounce-equivalent per day.1Legumes are counted in the vegetable group.2Aggregate data, unadjusted for cooking losses, plate waste, and other losses. Edible weight.3Adjusted for cooking losses, plate waste, and other losses. According to 2015-2020 Dietary Guidelines for Americans, 1 ounce of lean meat, poultry, or seafood; 1 egg; 1/4 cup cooked beans or tofu; 1 tablespoon of peanut butter; or 1/2 ounces of nuts or seeds can be considered as 1 oz-eq.4Boneless, trimmed-weight equivalent for the meat group. Excludes all legumes consumed, which are included under the vegetable group in this analysis.Source: USDA, Economic Research Service, Food Availability data and Loss-Adjusted Food Availability data.
9In the Guidelines, legumes are considered part of the protein foods group as well as the vegetables group. In this report, legumes are included in the vegetables group. ERS does not have data on seeds and soy products.
20 U.S. Trends in Food Availability and a Dietary Assessment of Loss-Adjusted Food Availability, 1970-2014, EIB-166
USDA, Economic Research Service
Dairy
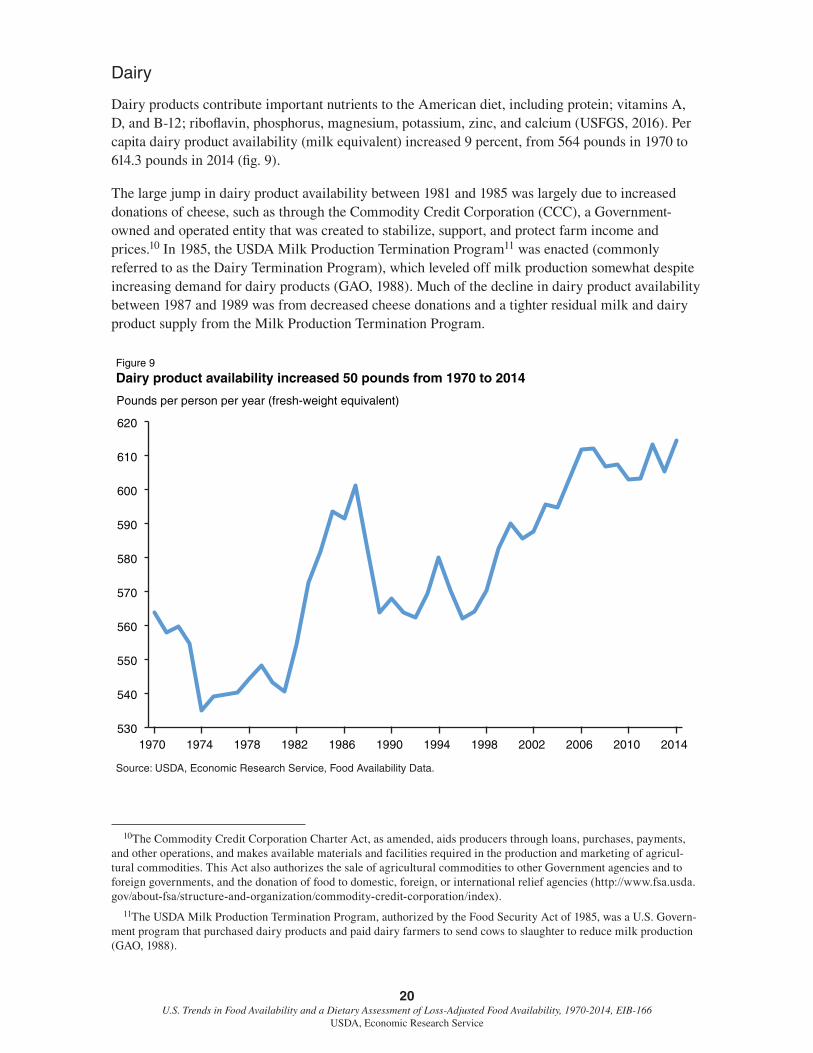
Dairy products contribute important nutrients to the American diet, including protein; vitamins A, D, and B-12; riboflavin, phosphorus, magnesium, potassium, zinc, and calcium (USFGS, 2016). Per capita dairy product availability (milk equivalent) increased 9 percent, from 564 pounds in 1970 to 614.3 pounds in 2014 (fig. 9).
The large jump in dairy product availability between 1981 and 1985 was largely due to increased donations of cheese, such as through the Commodity Credit Corporation (CCC), a Government-owned and operated entity that was created to stabilize, support, and protect farm income and prices.10 In 1985, the USDA Milk Production Termination Program11 was enacted (commonly referred to as the Dairy Termination Program), which leveled off milk production somewhat despite increasing demand for dairy products (GAO, 1988). Much of the decline in dairy product availability between 1987 and 1989 was from decreased cheese donations and a tighter residual milk and dairy product supply from the Milk Production Termination Program.
10The Commodity Credit Corporation Charter Act, as amended, aids producers through loans, purchases, payments, and other operations, and makes available materials and facilities required in the production and marketing of agricul-tural commodities. This Act also authorizes the sale of agricultural commodities to other Government agencies and to foreign governments, and the donation of food to domestic, foreign, or international relief agencies (http://www.fsa.usda.gov/about-fsa/structure-and-organization/commodity-credit-corporation/index).
11The USDA Milk Production Termination Program, authorized by the Food Security Act of 1985, was a U.S. Govern-ment program that purchased dairy products and paid dairy farmers to send cows to slaughter to reduce milk production (GAO, 1988).
Figure 9
Dairy product availability increased 50 pounds from 1970 to 2014
Source: USDA, Economic Research Service, Food Availability Data.
530
540
550
560
570
580
590
600
610
620
Pounds per person per year (fresh-weight equivalent)
1970 1974 1978 1982 1986 1990 1994 1998 2002 2006 2010 2014

21 U.S. Trends in Food Availability and a Dietary Assessment of Loss-Adjusted Food Availability, 1970-2014, EIB-166
USDA, Economic Research Service
Cheese (other than cottage cheese) contributed significantly to the overall increase in dairy product availability over the last four decades, almost tripling from 10.8 pounds per person in 1970 to 31.5 pounds in 2014 (table 8). In particular, the availability of cheddar cheese rose 67 percent (3.9 pounds), while other American cheeses more than tripled. Italian cheeses increased to 14.2 pounds per person in 2014 from 2.0 pounds in 1970. In particular, per capita availability of mozzarella grew over 800 percent, from 1.2 pounds in 1970 to 11.2 pounds in 2014. In the miscellaneous cheese category, brick cheese declined, while Swiss cheese and other increased to 1.0 and 1.3 pounds per person, respectively, over the 44 years. Time-saving, commercially manufactured and prepared convenience foods (e.g., frozen pizza, macaroni and cheese, prepackaged cheese slices, and cheese-rich Italian and Tex-Mex cuisines) helped increase consumption (Bentley, 2014b).
While cheese consumption has increased since the 1970s, milk consumption has decreased. Total fluid milk products available for consumption fell from 31.2 gallons per person in 1970 to 20.1 gallons in 2014 (35 percent). Since its peak of 42.3 gallons in 1945, beverage milk availability has steadily fallen, dipping to a low of 18.4 gallons per person in 2014. Whole milk decreased 20.0 gallons per person during this period. Although lower fat and skim milk increased 7.3 gallons from 1970, it has declined in recent years, dipping to 13.1 gallons per person in 2014, the lowest since 1987.
Americans consume milk less frequently than in the past, opting to drink nondairy beverages at lunch-time and with dinner (Stewart et al., 2013). National food consumption surveys found that Americans born in the early 1960s drank milk 1.5 times a day as teenagers, 0.7 times a day as young adults, and 0.6 times a day in middle age (Stewart et al., 2013). In contrast, Americans born in the early 1980s drank milk just 1.2 times a day in their teenage years and drank milk 0.5 times a day as young adults (Stewart et al., 2013). Carbonated soft drinks, fruit juices, bottled water, and cow milk substitutes—nut milks, coconut milk, soy milk, etc.—all provide alternatives to fluid milk (Bentley, 2014b).
Frozen dairy products decreased 17 percent, from 25.4 pounds per person in 1970 to 21.0 pounds in 2014. Ice cream availability dropped 27 percent to 12.2 pounds per person in 2014, while low-fat ice cream (formerly known as ice milk) availability decreased to 6.1 pounds per person in 2014. Condensed and evaporated milk declined 5.1 pounds per person, while dry milk dropped 2.2 pounds per person.
The Guidelines recommend that Americans on a 2,000-calorie-per-day diet consume 3 cups of milk and milk products per day. According to the loss-adjusted food availability data, Americans consumed about 1.5 cup-equivalents in 2014 (roughly 49 percent). The Guidelines also suggest that most dairy products should be fat free or low-fat. The food availability data measure reduced fat and nonfat versions for some dairy products, such as fluid milk, cottage cheese, dry milk, and condensed/evaporated milks, which contributed about a third of the total dairy allowance per person per day. The data do not, however, distinguish the fat content of other dairy products, such as cheese. Therefore, the data cannot indicate what part of the increase in cheese consumption is from reduced fat, low-fat, and nonfat cheese.

22 U.S. Trends in Food Availability and a Dietary Assessment of Loss-Adjusted Food Availability, 1970-2014, EIB-166
USDA, Economic Research Service
Table 8Per capita availability of milk and milk products grew 9 percent between 1970 and 2014 - continued
Food availability1
Change,1970 to 2014
Loss-adjusted food availability2
Item 1970 2014 1970 2014
Gallons per personper year
Gallons per year
Percent Cup-eq/day
Total fluid milk products 31.2 20.1 -11.1 -35 0.95 0.61
Beverage milk 31.1 18.4 -12.7 -41 0.95 0.55
Whole 25.3 5.3 -20.0 -79 0.78 0.16
Plain 24.7 5.1 -19.6 -79 0.76 0.16
Flavored 0.6 0.2 -0.4 -69 0.01 0.00
Lower fat and skim milk 5.8 13.1 7.3 127 0.17 0.39
Plain (2% fat) 3.2 6.5 3.3 102 0.10 0.20
Plain (1% fat) 0.2 2.7 2.5 1,186 0.01 0.08
Flavored (1% and 2% fat) 0.3 1.4 1.0 302 0.01 0.03
Skim 1.3 2.3 1.0 73 0.04 0.07
Buttermilk 0.6 0.2 -0.5 -72 0.02 0.01
Yogurt 0.1 1.7 1.6 1,700 0.00 0.05
Pounds per person per year
Pounds per year
Percent Cup-eq/day
Total cheese3 15.8 33.6 17.7 112 0.24 0.65
Cheese other than cottage4 10.8 31.5 20.7 193 0.23 0.64
American Cheese 7.0 13.5 6.5 93 0.17 0.31
Cheddar 5.8 9.7 3.9 67 0.14 0.24
Other American cheese 1.2 3.8 2.6 215 0.02 0.08
Italian cheese 2.0 14.2 12.1 592 0.04 0.28
Provolone 0.2 5/ NA NA 0.01 5/
Romano 0.1 5/ NA NA 0.00 5/
Parmesan 0.2 5/ NA NA 0.00 5/
Mozzarella 1.2 11.2 10.0 839 0.02 0.21
Ricotta 0.2 5/ NA NA 0.00 5/
Other Italian cheese 0.1 3.0 2.9 3,802 0.00 0.07
Miscellaneous cheese 1.7 3.8 2.1 123 0.03 0.05
Swiss 0.9 1.0 0.1 14 0.01 0.01
Brick 0.1 0.0 -0.1 -91 0.00 0.00
Muenster 0.2 0.5 0.3 176 0.00 0.01
Blue 0.1 0.3 0.2 117 0.00 0.00
Hispanic NA 0.7 NA NA NA NA
Other 0.4 1.3 0.9 216 0.01 0.02
Cottage cheese 5.1 2.1 -3.0 -59 0.01 0.00
23 U.S. Trends in Food Availability and a Dietary Assessment of Loss-Adjusted Food Availability, 1970-2014, EIB-166
USDA, Economic Research Service
Table 8Per capita availability of milk and milk products grew 9 percent between 1970 and 2014 - continued
Food availability1
Change,1970 to 2014
Loss-adjusted food availability2
Item 1970 2014 1970 2014
Pounds per person per year
Pounds per year
Percent Cup-eq/day
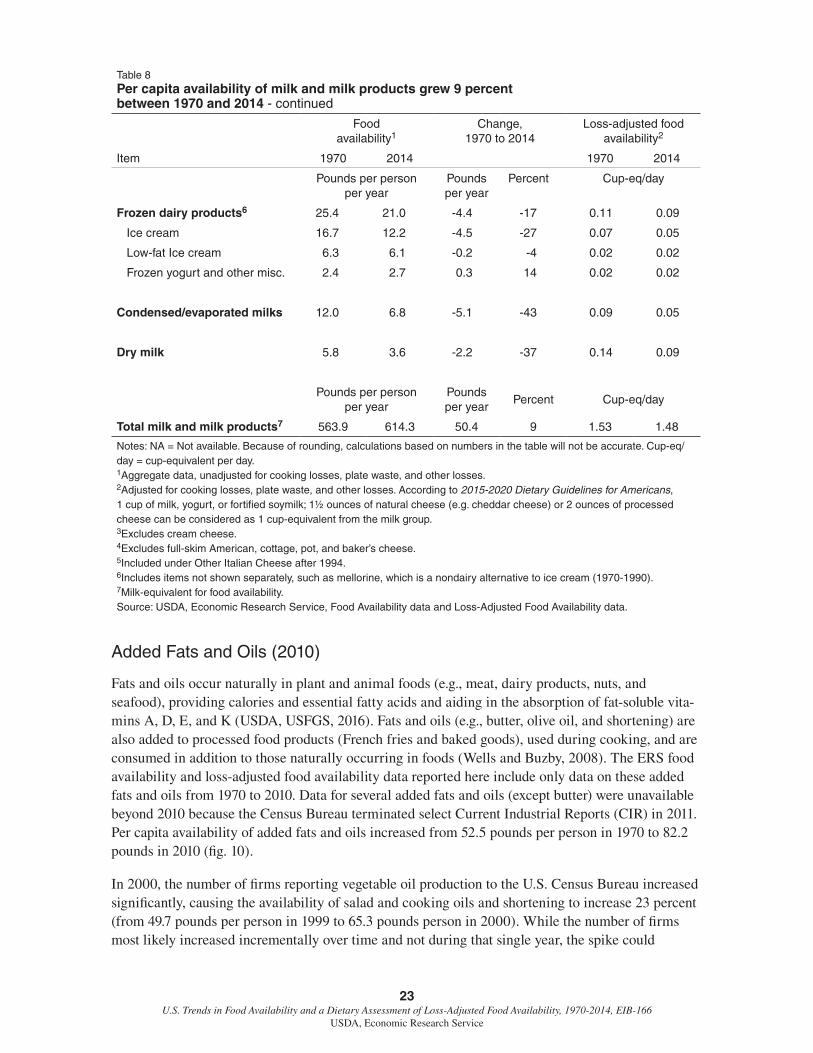
Frozen dairy products6 25.4 21.0 -4.4 -17 0.11 0.09
Ice cream 16.7 12.2 -4.5 -27 0.07 0.05
Low-fat Ice cream 6.3 6.1 -0.2 -4 0.02 0.02
Frozen yogurt and other misc. 2.4 2.7 0.3 14 0.02 0.02
Condensed/evaporated milks 12.0 6.8 -5.1 -43 0.09 0.05
Dry milk 5.8 3.6 -2.2 -37 0.14 0.09
Pounds per person per year
Pounds per year
Percent Cup-eq/day
Total milk and milk products7 563.9 614.3 50.4 9 1.53 1.48
Notes: NA = Not available. Because of rounding, calculations based on numbers in the table will not be accurate. Cup-eq/day = cup-equivalent per day.1Aggregate data, unadjusted for cooking losses, plate waste, and other losses.2Adjusted for cooking losses, plate waste, and other losses. According to 2015-2020 Dietary Guidelines for Americans, 1 cup of milk, yogurt, or fortified soymilk; 1½ ounces of natural cheese (e.g. cheddar cheese) or 2 ounces of processed cheese can be considered as 1 cup-equivalent from the milk group. 3Excludes cream cheese.4Excludes full-skim American, cottage, pot, and baker’s cheese. 5Included under Other Italian Cheese after 1994. 6Includes items not shown separately, such as mellorine, which is a nondairy alternative to ice cream (1970-1990).7Milk-equivalent for food availability.Source: USDA, Economic Research Service, Food Availability data and Loss-Adjusted Food Availability data.
Added Fats and Oils (2010)
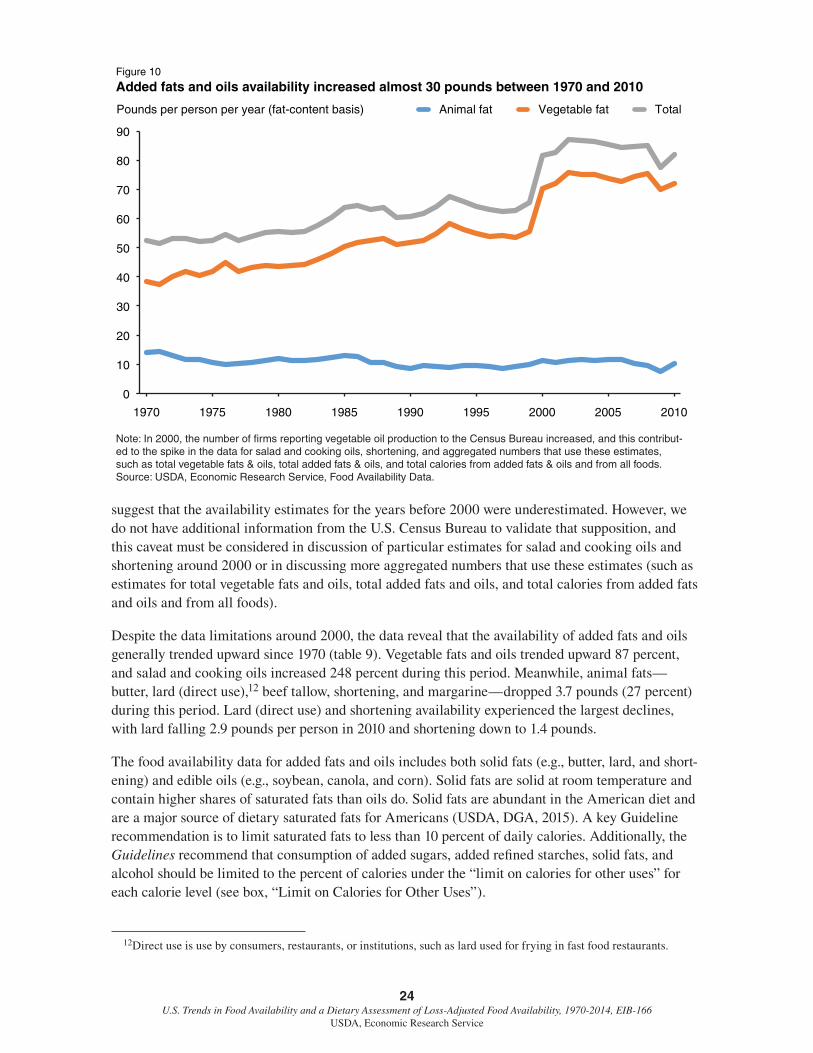
Fats and oils occur naturally in plant and animal foods (e.g., meat, dairy products, nuts, and seafood), providing calories and essential fatty acids and aiding in the absorption of fat-soluble vita-mins A, D, E, and K (USDA, USFGS, 2016). Fats and oils (e.g., butter, olive oil, and shortening) are also added to processed food products (French fries and baked goods), used during cooking, and are consumed in addition to those naturally occurring in foods (Wells and Buzby, 2008). The ERS food availability and loss-adjusted food availability data reported here include only data on these added fats and oils from 1970 to 2010. Data for several added fats and oils (except butter) were unavailable beyond 2010 because the Census Bureau terminated select Current Industrial Reports (CIR) in 2011. Per capita availability of added fats and oils increased from 52.5 pounds per person in 1970 to 82.2 pounds in 2010 (fig. 10).
In 2000, the number of firms reporting vegetable oil production to the U.S. Census Bureau increased significantly, causing the availability of salad and cooking oils and shortening to increase 23 percent (from 49.7 pounds per person in 1999 to 65.3 pounds person in 2000). While the number of firms most likely increased incrementally over time and not during that single year, the spike could
24 U.S. Trends in Food Availability and a Dietary Assessment of Loss-Adjusted Food Availability, 1970-2014, EIB-166
USDA, Economic Research Service
suggest that the availability estimates for the years before 2000 were underestimated. However, we do not have additional information from the U.S. Census Bureau to validate that supposition, and this caveat must be considered in discussion of particular estimates for salad and cooking oils and shortening around 2000 or in discussing more aggregated numbers that use these estimates (such as estimates for total vegetable fats and oils, total added fats and oils, and total calories from added fats and oils and from all foods).
Despite the data limitations around 2000, the data reveal that the availability of added fats and oils generally trended upward since 1970 (table 9). Vegetable fats and oils trended upward 87 percent, and salad and cooking oils increased 248 percent during this period. Meanwhile, animal fats—butter, lard (direct use),12 beef tallow, shortening, and margarine—dropped 3.7 pounds (27 percent) during this period. Lard (direct use) and shortening availability experienced the largest declines, with lard falling 2.9 pounds per person in 2010 and shortening down to 1.4 pounds.
The food availability data for added fats and oils includes both solid fats (e.g., butter, lard, and short-ening) and edible oils (e.g., soybean, canola, and corn). Solid fats are solid at room temperature and contain higher shares of saturated fats than oils do. Solid fats are abundant in the American diet and are a major source of dietary saturated fats for Americans (USDA, DGA, 2015). A key Guideline recommendation is to limit saturated fats to less than 10 percent of daily calories. Additionally, the Guidelines recommend that consumption of added sugars, added refined starches, solid fats, and alcohol should be limited to the percent of calories under the “limit on calories for other uses” for each calorie level (see box, “Limit on Calories for Other Uses”).
12Direct use is use by consumers, restaurants, or institutions, such as lard used for frying in fast food restaurants.
Figure 10
Added fats and oils availability increased almost 30 pounds between 1970 and 2010
Note: In 2000, the number of firms reporting vegetable oil production to the Census Bureau increased, and this contribut-ed to the spike in the data for salad and cooking oils, shortening, and aggregated numbers that use these estimates, such as total vegetable fats & oils, total added fats & oils, and total calories from added fats & oils and from all foods. Source: USDA, Economic Research Service, Food Availability Data.
0
10
20
30
40
50
60
70
80
90
1970 1975 1980 1985 1990 1995 2000 2005 2010
Animal fat Vegetable fat TotalPounds per person per year (fat-content basis)

25 U.S. Trends in Food Availability and a Dietary Assessment of Loss-Adjusted Food Availability, 1970-2014, EIB-166
USDA, Economic Research Service
Table 9Per capita availability of added fats and oils increased 57 percent between 1970 and 2010
Food availability1
Change,1970 to 2010
Loss-adjusted food availability2
Item 1970 2010 1970 2010
Pounds per person/year
Pounds per year
Percent Grams
Animal fats 14.0 10.2 -3.7 -27 8.33 5.85
Butter 4.3 3.9 -0.4 -8 3.22 2.95
Lard (direct use)3 4.5 1.5 -2.9 -65 1.81 0.63
Edible beef tallow (direct use)3
NA 3.3 NA NA NA 1.33
Shortening 4.7 1.4 -3.3 -69 3.01 0.92
Margarine 0.5 0.0 -0.4 -92 0.29 0.03
Vegetable fats and oils4 38.5 71.9 33.4 87 27.85 57.14
Salad and cooking oils 15.4 53.6 38.2 248 12.83 44.70
(olive and canola oil)
Shortening 12.6 13.9 1.3 10 8.06 8.86
Margarine 8.2 2.8 -5.4 -66 4.92 2.10
Other edible fats and oils5 2.3 1.7 -0.6 -27 2.04 1.48
Total added fats and oils6 52.5 82.2 29.7 57 36.18 62.99
Notes: NA = Not available. Because of rounding, calculations based on numbers in the table will not be accurate. 1Aggregate data, unadjusted for cooking losses, plate waste, and other losses. Fats and oils reported on a fat content basis.2Adjusted for cooking losses, plate waste, and other losses. Fat content of butter and margarine calculated at 80 percent. One gram of fat equals 9 calories. 3Exlcudes use in margarine and shortening.4In 2000, the number of firms reporting vegetable oil production increased.5Specialty fats used mainly in confections and nondairy creamers. 6Excludes most naturally occurring fat, such as meats, beverage milks, nuts, and avocados. Source: USDA, Economic Research Service, Food Availability data and Loss-Adjusted Food Availability data.
Oils are fats that contain higher shares of monounsaturated and polyunsaturated fat and are liquid at room temperature. The Guidelines emphasize consumption of oils as part of an overall healthy eating pattern (27 grams per day for a 2,000 calorie diet) because they are a major source of essen-tial fatty acids and Vitamin E (USDA, DGA, 2015). Since oils are a concentrated source of calories, the Guidelines advise that they should replace solid fats in the diet, rather than add to total fat intake (USDA, DGA, 2015).
According to the loss-adjusted food availability data, Americans consumed 63 grams of added fats and oils per day in 2010. Of this amount, 44.7 grams were vegetable oils or “salad and cooking oils,” which were the recommended “healthy intake of oils” (66 percent over the recommended amount of 27 grams per day for a 2,000 calorie diet), and 14.7 grams were solid fats from butter, lard, short-ening (animal and vegetable), and tallow. While there is no quantitative limit for solid fats in the Guidelines, the Guidelines recommend that Americans limit their intake of saturated fats (both added and naturally occurring) to no more than 10 percent of the calorie level of the overall eating pattern. According to the nutrient availability data (unadjusted for waste and spoilage), per capita total fat (both saturated and unsaturated, added and naturally occurring) reached 190 grams per day in 2010. Of this amount, saturated fat accounted for 59 grams (31 percent), and unsaturated fats (monounsaturated and polyunsaturated) accounted for 121 grams per day (64 percent).
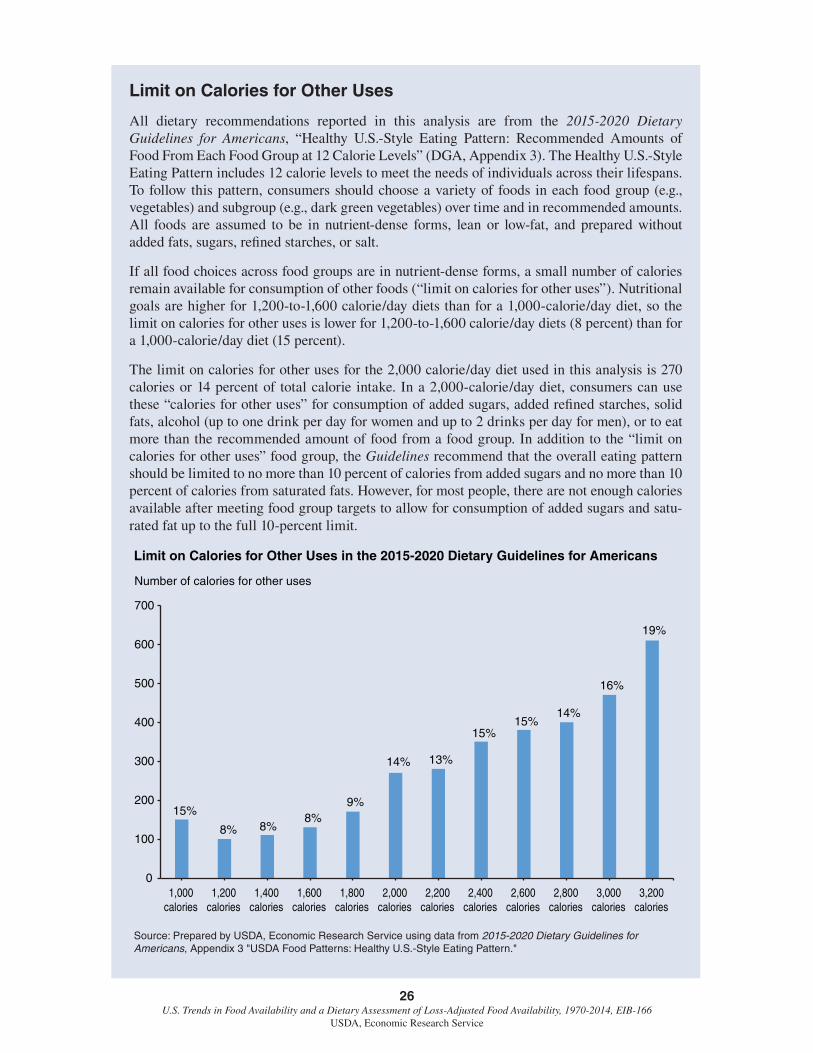
26 U.S. Trends in Food Availability and a Dietary Assessment of Loss-Adjusted Food Availability, 1970-2014, EIB-166
USDA, Economic Research Service
Limit on Calories for Other Uses
All dietary recommendations reported in this analysis are from the 2015-2020 Dietary Guidelines for Americans, “Healthy U.S.-Style Eating Pattern: Recommended Amounts of Food From Each Food Group at 12 Calorie Levels” (DGA, Appendix 3). The Healthy U.S.-Style Eating Pattern includes 12 calorie levels to meet the needs of individuals across their lifespans. To follow this pattern, consumers should choose a variety of foods in each food group (e.g., vegetables) and subgroup (e.g., dark green vegetables) over time and in recommended amounts. All foods are assumed to be in nutrient-dense forms, lean or low-fat, and prepared without added fats, sugars, refined starches, or salt.
If all food choices across food groups are in nutrient-dense forms, a small number of calories remain available for consumption of other foods (“limit on calories for other uses”). Nutritional goals are higher for 1,200-to-1,600 calorie/day diets than for a 1,000-calorie/day diet, so the limit on calories for other uses is lower for 1,200-to-1,600 calorie/day diets (8 percent) than for a 1,000-calorie/day diet (15 percent).
The limit on calories for other uses for the 2,000 calorie/day diet used in this analysis is 270 calories or 14 percent of total calorie intake. In a 2,000-calorie/day diet, consumers can use these “calories for other uses” for consumption of added sugars, added refined starches, solid fats, alcohol (up to one drink per day for women and up to 2 drinks per day for men), or to eat more than the recommended amount of food from a food group. In addition to the “limit on calories for other uses” food group, the Guidelines recommend that the overall eating pattern should be limited to no more than 10 percent of calories from added sugars and no more than 10 percent of calories from saturated fats. However, for most people, there are not enough calories available after meeting food group targets to allow for consumption of added sugars and satu-rated fat up to the full 10-percent limit.
Limit on Calories for Other Uses in the 2015-2020 Dietary Guidelines for Americans
Source: Prepared by USDA, Economic Research Service using data from 2015-2020 Dietary Guidelines for Americans, Appendix 3 "USDA Food Patterns: Healthy U.S.-Style Eating Pattern."
Number of calories for other uses
0
100
200
300
400
500
600
700
1,000calories
1,200calories
1,400calories
1,600calories
1,800calories
2,000calories
2,200calories
2,400calories
2,600calories
2,800calories
3,000calories
3,200calories
15%
8% 8%8%
9%
14% 13%
15%15%
14%
16%
19%

27 U.S. Trends in Food Availability and a Dietary Assessment of Loss-Adjusted Food Availability, 1970-2014, EIB-166
USDA, Economic Research Service
Added Sugars and Sweeteners
Added sugars and sweeteners—refined cane and beet sugars, corn sweeteners, and edible syrups—differ from dietary sugars found naturally in foods (e.g., in fruits, milk, etc.). Since these sugar and sweeteners are added to processed foods and beverages during or following production, these added sugars and sweeteners increase calorie consumption. Consumption of these “empty calories” prevents Americans from meeting their nutrient needs primarily through food (i.e., not through supplements) while remaining under the caloric limit (USDA, DGA, 2015). According to the food availability data, added sugars and sweeteners totaled 131 pounds in 2014, a 14-percent drop from the 1999 record high of 153.1 pounds per person, but still 10 percent more than in 1970 (fig. 11). The largest factor in the 1999-2014 decline in added sugars and sweeteners was the decline in high-fruc-tose corn syrup (HFCS) availability, which fell 19.8 pounds per person, dry weight during that time. Rising sales of zero-calorie drinks, bottled water, and diet soft drinks influenced the drop in HFCS-sweetened soft drink availability (Bentley, 2014a).
Per capita corn sweetener availability increased 282 percent over the past 44 years, with HFCS accounting for 75 percent of its availability in 2014 (table 10). HFCS rose from 0.5 pounds per person in 1970 to 45.5 pounds in 2014. According to the food availability data, per capita availability of glucose, down from its peak of 17.3 pounds in 1997, increased 1.4 pounds (13 percent) over the 44 years, while dextrose declined 1.6 pounds (36 percent). Availability of refined cane and beet sugars dropped 33.4 pounds per person (33 percent).
Figure 11
Added sugar and sweetener availability reached 131 pounds in 2014
Source: USDA, Economic Research Service, Food Availability Data.
Pounds per person per year (dry-weight equivalent)
0
20
40
60
80
100
120
140
160
1970 1974 1978 1982 1986 1990 1994 1998 2002 2006 2010 2014
Refined cane and beet sugars Corn sweetenersEdible syrups and honey Total

28 U.S. Trends in Food Availability and a Dietary Assessment of Loss-Adjusted Food Availability, 1970-2014, EIB-166
USDA, Economic Research Service
Table 10Per capita availability of added sugars and sweeteners grew 10 percent between 1970 and 2014
Food availability1
Change, 1970 to 2014
Loss-adjusted food availability2
Item 1970 2014 1970 2014
Pounds per person per year, dry weight
Pounds per year
Percent Teaspoons
Refined cane and 101.8 68.3 -33.4 -33 17.69 11.88
beet sugars
Corn sweeteners 15.9 60.7 44.8 282 2.76 10.54
High-fructose corn 0.5 45.5 45.0 8,212 0.10 7.92
syrup
Glucose 10.7 12.2 1.4 13 1.87 2.11
Dextrose 4.6 3.0 -1.6 -36 0.80 0.51
Edible syrups 0.5 0.8 0.3 62 0.11 0.18
Honey 1.0 1.2 0.2 21 0.22 0.27
Total added sugars and sweeteners 119.1 131.0 11.9 10 20.78 22.87
Notes: Because of rounding, calculations based on numbers in the table will not be accurate. Cup-eq/day = cup-equivalent per day.1Aggregate data, unadjusted for cooking losses, plate waste, and other losses. Dry-weight equivalent.2Adjusted for cooking losses, plate waste, and other losses. One teaspoon of sugar equals 16 calories.Source: USDA, Economic Research Service, Food Availability data and Loss-Adjusted Food Availability data.
The Guidelines recommend that Americans limit their consumption of food and beverages with added sugars and sweeteners to no more than 10 percent of calories per day (200 calories or 12.5 teaspoons for a 2,000-calorie-per-day-diet) (see box, “Limit on Calories for Other Uses”). According to the loss-adjusted food availability data, Americans consumed roughly 23 teaspoons of added sugars and sweeteners per person per day in 2014 (83 percent over the recommended 12.5 teaspoon limit), up from 20.8 teaspoons in 1970. Twenty-three teaspoons of added sugars and sweeteners are equivalent to roughly 366 calories per day.

29 U.S. Trends in Food Availability and a Dietary Assessment of Loss-Adjusted Food Availability, 1970-2014, EIB-166
USDA, Economic Research Service
Data Limitations
The Food Availability (Per Capita) Data System uses data collected from producers and distribu-tors, not from consumers in individual surveys that record actual intake. Because it measures food supplies moving from production through marketing channels for domestic consumption, it is considered a proxy for actual food consumption because the food availability data, the loss-adjusted food availability data, and the nutrient availability data are not based on direct observations of actual, individual intake or quantities ingested. In addition, the Food Availability (Per Capita) Data System does not capture the entire universe of commodities (e.g., some tropical fruit and vegetables) consumed by Americans. Despite the data series covering over 200 commodities, coverage is incom-plete because of data limitations. Nonetheless, it provides a useful, time-series measure of food patterns and trends, tracking both long-term and year-to-year changes.
Since the loss-adjusted food availability data do not account for all spoilage and waste that occurs from the farmgate to fork, the data typically overstate actual consumption. The data series calculates three loss estimates—primary, retail, and consumer—that account for food loss. Although the loss-adjusted food availability data adjust for those losses to more closely approximate actual intake, it is important to note that the data are considered preliminary because of known limitations in the calculations of food loss estimates. For example, while the data series has updated data on food loss estimates for fresh fruit, vegetables, meat, poultry, and seafood at the retail level, the retail food-loss estimates for several commodity groups (e.g., fats and oils, grains, dairy, and added sugar and sweet-eners) need updating. Moreover, the dietary findings represent the average per capita consumption for Americans—an amount that likely varies significantly across subgroups within the U.S. popula-tion (gender, age, income, etc.).
Additionally, although ERS’s Food Availability (Per Capita) Data System provides data for several added fats and oils through 2010, the data for 2011 through 2014 were unavailable for several added fats and oils because the Census Bureau terminated select Current Industrial Reports (CIR) in 2011. Therefore, certain summary estimates—such as per capita daily amounts of calories and food-pattern equivalents (or servings)—cannot be calculated for 2011 through 2014 for the added fats and oils group. Thus, the summary estimates or totals across all food groups cannot be calculated for 2011 through 2014. In August 2015, the National Agricultural Statistics Service (USDA, NASS, 2015), through its new Current Agricultural Industrial Reports (CAIR), published monthly produc-tion, consumption, and stocks data for added fats and oils. These data will replace the discontinued CIRs for added fats and oils, and ERS anticipates incorporating these estimates into the Food Availability (Per Capita) Data System in 2017.
Sources of Error
Food-use data, generally estimated as the residual in the balance sheets, are susceptible to errors within the balance sheet components, including incomplete reporting, inaccurate conversion factors, inappropriate estimation techniques, and scarcity of data and information on the supply and disap-pearance components. In addition, the food availability data overestimate the quantity of food Americans consume since it includes substantial quantities of nonedible food and food discarded through waste and spoilage in the home and marketing system. As previously mentioned, the loss-adjusted food availability data have some underlying loss rates in need of updating, and thus the series is considered preliminary.

30 U.S. Trends in Food Availability and a Dietary Assessment of Loss-Adjusted Food Availability, 1970-2014, EIB-166
USDA, Economic Research Service
Conclusion
Food consumption patterns change in response to changes in relative food prices, increases in real (adjusted for inflation) disposable income, changes in the tastes and preferences of consumers, and food assistance for those in need (among other factors). Research findings on food consumption and trends over time can help aid public policy decisions, State-level programs, and consumer food choices.
While commodity consumption has changed over time, Americans continue to fall short of the recommended amounts in USDA’s Dietary Guidelines for Americans for fruit, vegetables, whole grains, seafood, and dairy products, and their consumption continues to exceed the recommended amounts for total grains, some protein foods, saturated fat, and added sugars. In order to meet these recommendations, Americans would need to lower their consumption of added fats, refined grains, and added sugars and sweeteners, and to increase their consumption of vegetables, whole grains, dairy products, and fruit.
Future Research
The Food Availability (Per Capita) Data System serves as a proxy for actual consumption at the national level. As a result, the data do not track who in America eats these food commodities and the amounts eaten. An ERS report disaggregates the loss-adjusted food availability estimates by key characteristics, such as household income, age, gender, adult education, and race and ethnicity (Lin et al., 2016). This information may be helpful for policymakers and for educators interested in targeting nutrition education efforts.

31 U.S. Trends in Food Availability and a Dietary Assessment of Loss-Adjusted Food Availability, 1970-2014, EIB-166
USDA, Economic Research Service
References
Bentley, J. September 2012. “U.S. Per Capita Availability of Chicken Surpasses That of Beef,” Amber Waves, U.S. Department of Agriculture, Economic Research Service. http://www.ers.usda.gov/amber-waves/2012-september/us-consumption-of-chicken.aspx#.VCm67hjD_cs
Bentley, J. May 2014a. “U.S. Per Capita Sweetener Availability has Fallen Since its 1999 Peak,” Chart of Note, U.S. Department of Agriculture, Economic Research Service. http://www.ers.usda.gov/data-products/chart-gallery/detail.aspx?chartId=46888&ref=collection
Bentley J. June 2014b. “Trends in U.S. Per Capita Consumption of Dairy Products, 1970-2012,” Amber Waves, U.S. Department of Agriculture, Economic Research Service. http://www.ers.usda.gov/amber-waves/2014-june/trends-in-us-per-capita-consumption-of-dairy-products,-1970-2012.aspx#.VCm7XhjD_cs
Bentley, J., and A. Perez. 2015. “Fresh Fruit Makes Up a Growing Share of U.S. Fruit Availability,” Amber Waves, U.S. Department of Agriculture, Economic Research Service. http://ers.usda.gov/amber-waves/2015-may/fresh-fruit-makes-up-a-growing-share-of-us-fruit-availability.aspx#.Vg2FLxFVhBc
Bowman S.A., J.C. Clemens, R.C. Thoerig, J.E. Friday, M. Shimizu, and A. J. Moshfegh. 2013. Food Patterns Equivalents Database 2009-10: Methodology and User Guide, U.S. Department of Agriculture, Agricultural Research Service, Beltsville Human Nutrition Research Center. http://www.ars.usda.gov/ba/bhnrc/fsrg
Cook, R.L. 2011a. “Fundamental Forces Affecting U.S. Fresh Produce Growers and Marketers,” Choices 26(4):1-13. http://www.choicesmagazine.org/magazine/pdf/cmsarticle_202.pdf
Cook, R.L. 2011b. “Fundamental Forces Affecting the U.S. Fresh Berry and Lettuce/Leafy Green Subsectors,” Choices 26(4):1-15. http://www.choicesmagazine.org/magazine/pdf/cmsarticle_201.pdf
Fryar, C.D., M.D. Carroll, and C.L. Ogden. 2016a. Prevalence of Overweight, Obesity, and Extreme Obesity Among Adults Aged 20 and Over: United States, 1960-1962 Through 2013-2014, National Health and Nutrition Examination Survey, U.S. Centers for Disease Control and Prevention. http://www.cdc.gov/nchs/data/hestat/obesity_adult_13_14/obesity_adult_13_14.pdf
Fryar, C.D., M.D. Carroll, and C.L. Ogden. 2016b. Prevalence of Overweight and Obesity Among Children and Adolescents Aged 2-19: United States, 1963–1965 Through 2013–2014, National Health and Nutrition Examination Survey, U.S. Centers for Disease Control and Prevention. http://www.cdc.gov/nchs/data/hestat/obesity_child_13_14/obesity_child_13_14.pdf
Lin, B.H., J.C. Buzby, T. Anekwe, and J. Bentley. 2016. U.S. Food Commodity Consumption Broken Down by Demographics, EIB-206, U.S. Department of Agriculture, Economic Research Service. http://www.ers.usda.gov/publications/err-economic-research-report/err206.aspx
Stewart, H., D. Dong, and A. Carlson. 2013. Why Are Americans Consuming Less Fluid Milk? A Look at Generational Differences in Intake Frequency, ERR-149, U.S. Department of Agriculture, Economic Research Service. http://www.ers.usda.gov/media/1118789/err149.pdf
32 U.S. Trends in Food Availability and a Dietary Assessment of Loss-Adjusted Food Availability, 1970-2014, EIB-166
USDA, Economic Research Service
Thornsbury, S., A. Jerardo, and H.F. Wells. 2012. Vegetables and Pulses Outlook, VGS-351, U.S. Department of Agriculture, Economic Research Service. http://www.ers.usda.gov/media/922639/vgs351.pdf
U.S. Department of Agriculture, Agricultural Research Service (ARS). 2013. USDA National Nutrient Database for Standard Reference, Release 25, Nutrient Data Laboratory Home Page. http://www.ars.usda.gov/ba/bhnrc/ndl
U.S. Department of Agriculture, Center for Nutrition Policy and Promotion (CNPP). 2014. Nutrient Content of the U.S. Food Supply, 1909-2010, http://www.cnpp.usda.gov/USfoodsupply
U.S. Department of Agriculture, Economic Research Service. 2016a. Food Availability (Per Capita) Data System. http://www.ers.usda.gov/data-products/food-availability-(per-capita)-data-system.aspx
U.S. Department of Agriculture, Economic Research Service. 2016b. Food Availability Documentation. http://www.ers.usda.gov/data-products/food-availability-(per-capita)-data-system/food-availability-documentation.aspx
U.S. Department of Agriculture, Economic Research Service. 2016c. Loss-Adjusted Food Availability Documentation. http://www.ers.usda.gov/data-products/food-availability-(per-capita)-data-system/loss-adjusted-food-availability-documentation.aspx
U.S. Department of Agriculture and U.S. Department of Health and Human Services. December 2010. Dietary Guidelines for Americans 2010.
http://www.health.gov/dietaryguidelines/dga2010/DietaryGuidelines2010.pdf
U.S. Department of Health and Human Services and U.S. Department of Agriculture. December 2015. 2015-2020 Dietary Guidelines for Americans. http://health.gov/dietaryguidelines/2015/
U.S. Department of Agriculture, National Agriculture Statistics Service (NASS). 2015. Cold Storage. http://www.nass.usda.gov/Surveys/Guide_to_NASS_Surveys/Cold_Storage/index.php
U.S. Department of Agriculture, United States Food Guidance System (USFGS). 2016. ChooseMyPlate.gov. http://www.choosemyplate.gov/
U.S. General Accounting Office (GAO). May 1988. Dairy Termination Program. http://dairy.wisc.edu/PubPod/Reference/Library/U.S.GAO.05.1988.pdf
Wells, H.F., and J.C. Buzby. 2008. Dietary Assessment of Major Trends in U.S. Food Consumption, 1970-2005, EIB-33, U.S. Department of Agriculture, Economic Research Service. http://www.ers.usda.gov/media/210681/eib33_1_.pdf