U.S. Travel and Tourism S atellite Account for 1998–2018 · U.S. Travel and Tourism S atellite...
11
November 2019 Volume 99, Number 11 U.S. Travel and Tourism Satellite Account for 1998–2018 By Connor Franks and Sarah Osborne The travel and tourism industry—as measured by the real output of goods and services sold directly to visitors—increased 4.2 percent in 2018, according to the most recent statistics from the Travel and Tourism Satellite Account (TTSA) published by the Bureau of Economic Analysis (BEA). This is an acceleration from the 2.3 percent growth in 2017. These new statistics show growth in the travel and tourism industry for the last 9 years. Employment in the travel and tourism industry grew more slowly than real output, growing 1.5 percent in 2018. Other highlights from the TTSA include: Real output increased 4.2 percent in 2018. This growth was driven by increases in domestic passenger air transportation, gasoline, and traveler accommodations. Overall growth accelerated from the 2.3 percent growth in 2017. The drivers of the acceleration were increased growth in gasoline, food and beverage services, and domestic passenger air transportation. Prices for tourism goods and services increased 2.9 percent in 2018. Driving this increase was an increase in gasoline and domestic and international passenger air transportation services. These TTSA statistics incorporated newly available source data from BEA Industry Economic Accounts (IEAs) and National Income and Product Accounts (NIPAs) and several methodological improvements that were incorporated in the comprehensive update of the IEAs. These statistics also incorporated the most recent annual update to the IEAs that was released October 29 , 2019. The incorporation of the annual update allowed this release of the TTSA to contain the full suite of products for 2018 as well as revised estimates for the full set of accounts from 1998– 2017. The complete set of detailed annual statistics for 1998 through 2018 are available on the BEA website. The remainder of this article includes a discussion of trends in travel and tourism output and prices, tourism value added, and employment. The final section discusses changes in methodology in this update. th – 1 –
Transcript of U.S. Travel and Tourism S atellite Account for 1998–2018 · U.S. Travel and Tourism S atellite...

November 2019 Volume 99, Number 11
U.S.TravelandTourismSatelliteAccountfor1998–2018ByConnorFranksandSarahOsborne
The travel and tourism industry—as measured by the real output of goods and services solddirectly to visitors—increased 4.2 percent in 2018, according to the most recent statistics fromthe Travel and Tourism Satellite Account (TTSA) published by the Bureau of Economic Analysis(BEA). This is an acceleration from the 2.3 percent growth in 2017. These new statistics showgrowth in the travel and tourism industry for the last 9 years. Employment in the travel andtourism industry grew more slowly than real output, growing 1.5 percent in 2018.
Other highlights from the TTSA include:
Real output increased 4.2 percent in 2018. This growth was driven by increases in domesticpassenger air transportation, gasoline, and traveler accommodations.Overall growth accelerated from the 2.3 percent growth in 2017. The drivers of theacceleration were increased growth in gasoline, food and beverage services, and domesticpassenger air transportation.Prices for tourism goods and services increased 2.9 percent in 2018. Driving this increasewas an increase in gasoline and domestic and international passenger air transportationservices.
These TTSA statistics incorporated newly available source data from BEA Industry EconomicAccounts (IEAs) and National Income and Product Accounts (NIPAs) and several methodologicalimprovements that were incorporated in the comprehensive update of the IEAs. These statisticsalso incorporated the most recent annual update to the IEAs that was released October 29 ,2019. The incorporation of the annual update allowed this release of the TTSA to contain the fullsuite of products for 2018 as well as revised estimates for the full set of accounts from 1998–2017.
The complete set of detailed annual statistics for 1998 through 2018 are available on the BEAwebsite.
The remainder of this article includes a discussion of trends in travel and tourism output andprices, tourism value added, and employment. The final section discusses changes inmethodology in this update.
th
– 1 –

TrendsinOutputandPrices
RealoutputReal direct output—the value of the tourism industry’s goods and services sold directly tovisitors—increased 4.2 percent in 2018. The main contributors to the growth were domesticpassenger air transportation services, which increased 6.6 percent in 2018 after increasing 4.4percent in 2017. Also contributing to the growth was gasoline, which increased 7.7 percent in2018, and traveler accommodations, which increased 3.4 percent in 2018. Food and beverageservices increased 2.4 percent, and passenger water transportation services increased 14.2percent (table A and chart 1).
– 2 –

TableA.AnnualGrowth,ContributionstoGrowth,andLevelsofRealOutputbyTourismCommodityin2015–2018
Commodity
Annualgrowthrates(percentchangefromprecedingperiod)
Contributions(percentagepoints)
Realoutput(millionsofchained(2012)dollars)
2015 2016 2017 2018 2015 2016 2017 2018 2015 2016 2017 2018Alltourismgoodsandservices 5.5 1.8 2.3 4.2 5.46 1.81 2.35 4.22 977,236 994,951 1,018,286 1,061,271
Traveler accommodations 3.3 1.3 2.3 3.4 0.65 0.28 0.47 0.70 178,852 181,261 185,405 191,786Food and beverage services 4.3 0.1 −1.6 2.4 0.57 0.01 −0.22 0.32 120,992 121,110 119,204 122,105Transportation 8.2 3.8 4.5 5.4 3.48 1.57 1.88 2.36 447,630 464,508 485,397 511,814
Passenger air transportation 6.8 1.7 4.5 4.6 1.33 0.34 0.87 0.91 193,499 196,798 205,623 215,167Domestic passenger airtransportation services 4.2 2.3 4.4 6.6 0.63 0.34 0.64 0.97 142,908 146,227 152,674 162,697
International passenger airtransportation services 14.6 −0.1 4.7 −1.1 0.70 0.00 0.23 −0.05 50,596 50,553 52,935 52,360
All other transportation-relatedcommodities −6.1 −0.1 10.5 13.0 2.15 1.23 1.01 1.45 214,376 214,119 236,505 267,244
Passenger railtransportation services −0.3 0.4 2.1 −0.1 0.00 0.00 0.00 0.00 2,226 2,234 2,280 2,277
Passenger watertransportation services −2.1 −0.5 3.7 14.2 −0.04 −0.01 0.06 0.23 15,163 15,092 15,655 17,873
Intercity bus services −1.8 −3.0 0.2 0.9 0.00 0.00 0.00 0.00 1,321 1,281 1,283 1,295Intercity charter busservices 4.2 −1.6 2.8 10.0 0.01 0.00 0.01 0.02 2,387 2,349 2,415 2,657
Local bus and othertransportation services 4.7 13.6 10.1 3.0 0.02 0.07 0.06 0.02 4,603 5,229 5,755 5,928
Taxicab services 2.7 −4.9 −1.9 −8.0 0.02 −0.03 −0.01 −0.04 5,161 4,908 4,817 4,432Scenic and sightseeingtransportation services 5.9 −1.0 4.4 3.9 0.02 0.00 0.02 0.01 3,130 3,098 3,233 3,358
Automotive rental andleasing 10.1 12.2 3.0 4.6 0.31 0.37 0.09 0.15 30,314 34,003 35,013 36,634
Other vehicle rental andleasing 4.9 1.1 4.0 10.3 0.00 0.00 0.00 0.01 620 627 652 719
Automotive repair services 5.3 8.1 2.8 1.9 0.06 0.09 0.03 0.02 10,587 11,443 11,758 11,977Parking 7.2 −1.7 5.9 1.7 0.02 0.00 0.02 0.00 2,320 2,281 2,416 2,457Highway tolls 6.8 3.5 −0.1 1.1 0.01 0.00 0.00 0.00 801 829 828 837Travel arrangement andreservation services 5.7 4.2 11.5 4.7 0.24 0.18 0.51 0.22 40,960 42,687 47,609 49,843
Gasoline 14.4 6.2 2.3 7.7 1.48 0.56 0.22 0.80 136,303 144,715 148,078 159,449Recreation, entertainment, andshopping 3.2 −0.2 0.9 3.6 0.76 −0.05 0.21 0.85 210,918 210,510 212,339 220,063
Recreation and entertainment 2.3 2.5 2.2 4.3 0.24 0.26 0.23 0.46 89,330 91,570 93,546 97,523Motion pictures andperforming arts 3.4 0.6 0.6 4.4 0.06 0.01 0.01 0.09 17,642 17,742 17,857 18,638
Spectator sports 1.8 7.8 −0.2 8.8 0.01 0.04 0.00 0.04 3,967 4,275 4,267 4,643Participant sports 0.3 6.0 5.4 3.8 0.00 0.08 0.08 0.06 12,504 13,258 13,974 14,507Gambling 2.7 1.8 2.1 1.9 0.14 0.10 0.11 0.10 48,423 49,318 50,335 51,283All other recreation andentertainment 1.7 2.5 2.2 11.4 0.02 0.04 0.03 0.17 13,682 14,023 14,332 15,966
Shopping 3.8 −2.3 −0.2 3.1 0.52 −0.31 −0.03 0.39 134,366 131,279 131,010 135,087
The growth of real direct output acceleratedin 2018 from a 2.3 percent increase in 2017.The acceleration was led by gasoline, whichaccelerated from 2.3 percent growth in 2017to 7.7 percent growth in 2018. Alsocontributing to the acceleration of real directoutput was domestic air passengertransportation services, which acceleratedfrom 4.4 percent growth to 6.6 percentgrowth. Traveler accommodations and foodand beverage services were also significantcontributors.
– 3 –

PricesTourism goods and services prices increased 2.9 percent in 2018. The growth was led by strongprice growth in gasoline and domestic and international passenger air transportation services.Gasoline prices accelerated from a 13.1 percent increase in 2017 to a 13.5 percent increase in2018. Domestic passenger air transportation services accelerated from 0.7 percent growth in2017 to 1.8 percent growth in 2018, and international passenger air transportation servicesprices turned up from a 0.3 percent decrease in 2017 to a 4.8 percent increase in 2018 (table Band chart 2).
– 4 –

TableB.AnnualGrowth,ContributionstoGrowth,andLevelsofChain-TypePriceIndexesforTourismCommoditiesin2015–2018
Commodity
Annualgrowthrates(percentchangefrompreceding
period)
Contributions(percentagepoints)
PriceIndexes(indexnumber,2012=100)
2015 2016 2017 2018 2015 2016 2017 2018 2015 2016 2017 2018Alltourismgoodsandservices −3.6 −0.9 2.2 2.9 −3.65 −0.93 2.25 2.95 98.4 97.5 99.7 102.6
Traveler accommodations 3.1 2.5 0.6 0.6 0.60 0.50 0.12 0.12 108.5 111.2 111.9 112.5Food and beverage services 2.7 2.5 2.3 2.5 0.35 0.34 0.32 0.33 107.5 110.2 112.7 115.6Transportation −9.5 −4.2 3.2 4.7 −4.23 −1.80 1.36 2.03 90.9 87.1 89.9 94.1
Passenger air transportation −3.7 −2.8 0.5 2.5 −0.73 −0.56 0.09 0.50 99.5 96.7 97.1 99.6Domestic passenger air transportationservices −2.9 −2.3 0.7 1.8 −0.43 −0.34 0.11 0.27 99.9 97.6 98.3 100.1
International passenger airtransportation services −6.0 −4.2 −0.3 4.8 −0.30 −0.22 −0.02 0.23 98.3 94.1 93.8 98.4
All other transportation-relatedcommodities −14.2 −5.5 5.7 6.5 −3.50 −1.24 1.27 1.53 84.2 79.6 84.2 89.6
Passenger rail transportation services −1.0 2.2 3.3 0.3 0.00 0.01 0.01 0.00 98.1 100.2 103.6 103.8Passenger water transportationservices −0.1 3.6 0.9 0.3 0.00 0.06 0.02 0.00 100.4 104.0 105.0 105.3
Intercity bus services −0.1 3.6 0.9 0.3 0.00 0.00 0.00 0.00 100.4 104.1 105.0 105.2Intercity charter bus services −0.1 3.6 0.8 0.3 0.00 0.01 0.00 0.00 100.5 104.1 105.0 105.3Local bus and other transportationservices 2.2 1.7 1.7 1.8 0.01 0.01 0.01 0.01 107.9 109.7 111.6 113.5
Taxicab services 2.1 1.7 1.8 1.7 0.01 0.01 0.01 0.01 107.8 109.7 111.6 113.5Scenic and sightseeing transportationservices 2.3 2.4 2.6 2.4 0.01 0.01 0.01 0.01 105.3 107.8 110.6 113.2
Automotive rental and leasing −7.9 −7.5 0.4 2.2 −0.25 −0.24 0.01 0.07 99.0 91.6 91.9 94.0Other vehicle rental and leasing 0.0 2.5 −2.2 −1.0 0.00 0.00 0.00 0.00 103.2 105.8 103.5 102.4Automotive repair services 1.6 1.6 1.9 1.9 0.02 0.02 0.02 0.02 104.8 106.5 108.5 110.5Parking 2.6 2.8 2.5 2.3 0.01 0.01 0.01 0.01 108.8 111.8 114.6 117.2Highway tolls 2.6 2.7 2.5 2.3 0.00 0.00 0.00 0.00 108.8 111.8 114.6 117.2Travel arrangement and reservationservices 0.6 −0.1 −0.2 0.5 0.03 0.00 −0.01 0.02 101.6 101.5 101.3 101.9
Gasoline −27.1 −11.4 13.1 13.5 −3.32 −1.12 1.18 1.37 68.0 60.2 68.1 77.3Recreation, entertainment, and shopping −1.5 0.1 1.9 2.0 −0.37 0.03 0.45 0.47 100.0 100.1 102.1 104.1
Recreation and entertainment 1.1 1.9 2.3 2.1 0.11 0.20 0.24 0.23 104.0 105.9 108.3 110.6Motion pictures and performing arts 2.2 3.6 2.6 2.1 0.04 0.07 0.05 0.04 105.3 109.1 111.8 114.2Spectator sports 7.1 3.3 2.3 1.8 0.03 0.02 0.01 0.01 113.2 117.0 119.6 121.8Participant sports 0.6 1.6 2.3 2.9 0.01 0.02 0.03 0.04 103.7 105.4 107.8 110.9Gambling 0.1 1.3 2.1 2.4 0.01 0.07 0.11 0.13 103.2 104.5 106.8 109.4All other recreation and entertainment 1.8 1.6 2.3 0.6 0.03 0.02 0.03 0.01 102.5 104.2 106.6 107.2
Shopping −3.5 −1.3 1.6 1.9 −0.48 −0.17 0.21 0.24 97.1 95.9 97.4 99.3
Prices for the travel and tourism industryaccelerated in 2018 from a 2.2 percentincrease in 2017 to a 2.9 percent increase in2018. Domestic and international airpassenger transportation services andgasoline were both contributors to theacceleration in 2018.
– 5 –
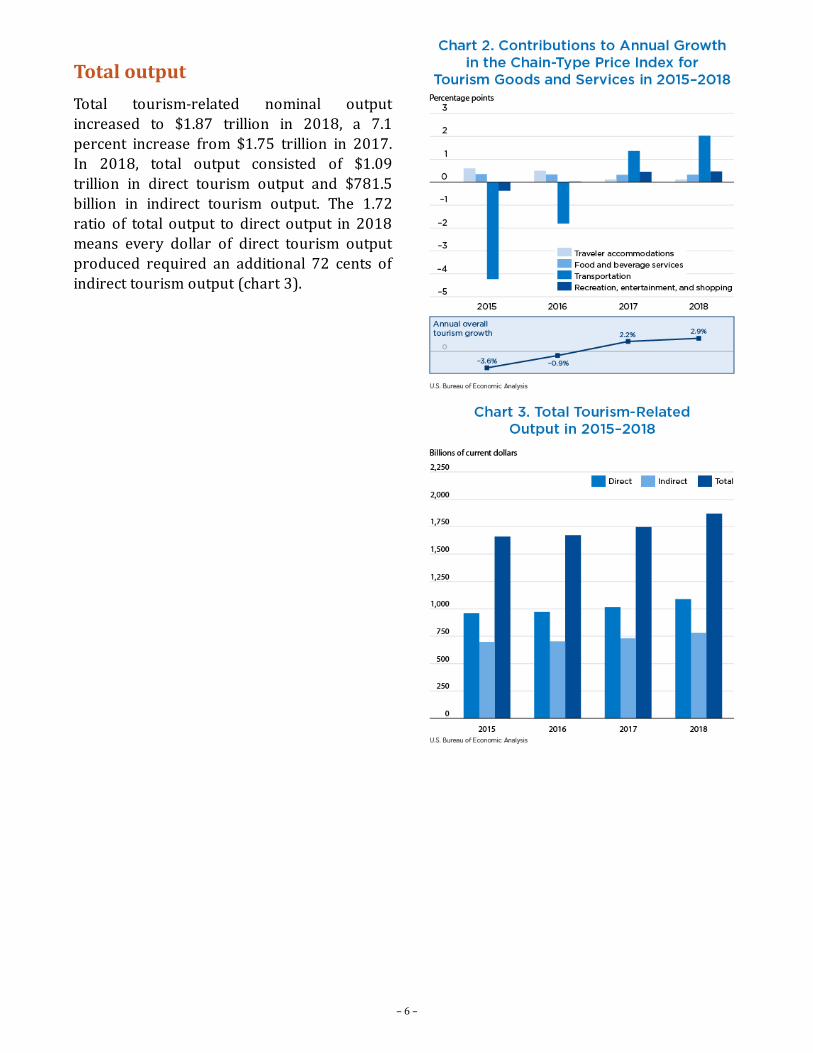
TotaloutputTotal tourism-related nominal outputincreased to $1.87 trillion in 2018, a 7.1percent increase from $1.75 trillion in 2017.In 2018, total output consisted of $1.09trillion in direct tourism output and $781.5billion in indirect tourism output. The 1.72ratio of total output to direct output in 2018means every dollar of direct tourism outputproduced required an additional 72 cents ofindirect tourism output (chart 3).
– 6 –

TourismValueAddedandEmployment
Value added and employment are presented by industry in the TTSA and facilitate analysis of thetravel and tourism estimates in an industry dimension.
ValueaddedA sector’s value added measures its contribution to gross domestic product (GDP). In 2018,travel and tourism’s share of GDP was 2.9 percent. The share of GDP peaked in 2000 at 3.1percent. In 2004, the share started a decline until 2010 at 2.5 percent. From 2010 to 2015, theshare rose every year to 2.8 percent, and the share reached 2.9 percent in 2018 (table C). Traveland tourism’s share of GDP remains larger than many significant industries, such as agriculture,mining, or utilities.
Directemployment
TableC.TravelandTourismasaShareofGrossDomesticProductin2008–2018
YearBillionsofdollars Percent
Grossdomesticproduct(GDP) Tourismvalueadded TourismvalueaddedasashareofGDP2008 14,713 399 2.662009 14,449 372 2.542010 14,992 392 2.522011 15,543 419 2.602012 16,197 435 2.692013 16,785 466 2.782014 17,527 489 2.792015 18,225 525 2.882016 18,715 539 2.882017 19,519 563 2.882018 20,580 597 2.90
Direct tourism employment includes jobs thatinvolve producing goods and services that aresold directly to visitors. Airline pilots, hotelclerks, and travel agents are examples of suchpositions. Overall, direct employmentincreased 1.5 percent in 2018, or by 90,000jobs. This was driven by growth inemployment for traveler accommodations,food services and drinking places, andparticipant sports. Traveler accommodationsadded 25,000 jobs, food services and drinkingplaces added 13,000 jobs, and participantsports added 14,000 jobs (chart 4 and tableD).
– 7 –

TableD.AnnualGrowth,ContributionstoGrowth,andLevelsofDirectEmploymentbyTourismIndustryin2015–2018
Commodity
Annualgrowthrates(percentchangefromprecedingperiod)
Contributions(percentagepoints)
Directemployment(thousands)
2015 2016 2017 2018 2015 2016 2017 2018 2015 2016 2017 2018Alltourismindustries 2.1 1.8 0.8 1.5 2.09 1.77 0.79 1.54 5688 5789 5835 5925
Traveler accommodations 2.1 1.4 2.1 1.7 0.53 0.37 0.55 0.43 1460 1481 1513 1538Vacation Home Rentals −5.0 −3.9 −1.8 −2.3 −0.01 −0.01 0.00 −0.01 14 13 13 13Food services and drinkingplaces 1.3 1.3 −1.9 0.8 0.39 0.37 −0.54 0.22 1662 1684 1652 1665
Transportation 4.7 3.2 3.5 2.0 1.03 0.72 0.80 0.47 1271 1312 1358 1385Air transportationservices 4.2 1.8 5.5 2.2 0.38 0.17 0.51 0.21 530 540 569 582
All othertransportation-relatedindustries
5.1 4.2 2.1 1.9 0.65 0.54 0.28 0.25 741 772 789 803
Rail transportationservices 6.7 −3.1 −2.7 −4.3 0.01 −0.01 0.00 −0.01 10 10 9 9
Watertransportationservices
−2.7 3.3 2.1 6.6 −0.02 0.02 0.01 0.04 37 39 39 42
Interurban bustransportation 1.7 −0.9 2.0 −2.6 0.01 0.00 0.01 −0.01 18 18 19 18
Interurban charterbus transportation −2.5 1.6 −0.3 −1.9 −0.01 0.01 0.00 −0.01 19 19 19 19
Urban transitsystems and othertransportation
12.6 6.9 6.5 −1.5 0.11 0.07 0.07 −0.02 55 59 63 62
Taxi service −7.8 −8.3 −13.2 −6.6 −0.01 −0.01 −0.02 −0.01 8 7 7 6Scenic andsightseeingtransportationservices
2.7 3.2 1.4 0.2 0.01 0.02 0.01 0.00 27 27 28 28
Automotiveequipment rentaland leasing
3.8 2.6 1.6 2.1 0.06 0.04 0.03 0.04 98 100 102 104
– 8 –

Totalemployment
PCE
Commodity
Annualgrowthrates(percentchangefromprecedingperiod)
Contributions(percentagepoints)
Directemployment(thousands)
2015 2016 2017 2018 2015 2016 2017 2018 2015 2016 2017 2018Automotive repairservices 4.6 4.1 0.2 0.2 0.06 0.05 0.00 0.00 73 76 76 76
Parking lots andgarages 8.3 −0.7 2.0 3.2 0.05 0.00 0.01 0.02 36 36 36 38
Toll highways 2.4 8.5 6.5 3.2 0.00 0.01 0.01 0.00 4 5 5 5Travel arrangementand reservationservices
3.3 6.5 1.1 0.1 0.11 0.21 0.04 0.00 184 196 198 199
Petroleumrefineries 9.2 4.8 0.7 0.5 0.01 0.01 0.00 0.00 9 9 9 9
Gasoline servicestations 9.5 4.8 4.3 6.0 0.25 0.14 0.13 0.18 163 171 178 189
Recreation, entertainment,and shopping 0.2 1.8 0.3 2.0 0.03 0.33 0.05 0.35 1038 1057 1060 1081
Recreation andentertainment −2.4 4.9 3.1 4.2 −0.22 0.44 0.28 0.40 511 536 552 575
Motion pictures andperforming arts −0.1 3.5 −3.0 4.2 0.00 0.03 −0.03 0.04 56 58 56 59
Spectator sports 1.2 4.8 1.7 8.1 0.01 0.03 0.01 0.06 40 42 42 46Participant sports −1.1 8.5 4.5 5.7 −0.04 0.33 0.19 0.24 220 238 249 263Gambling −6.8 0.2 5.2 −0.2 −0.17 0.00 0.12 0.00 130 131 137 137All other recreationand entertainment −1.0 3.6 −0.2 5.1 −0.01 0.04 0.00 0.06 65 67 67 71
Shopping 2.8 −1.2 −2.6 −0.5 0.25 −0.11 −0.23 −0.04 528 521 508 505Industriesproducingnondurable PCEcommodities,excludingpetroleumrefineries
3.2 −1.4 −2.2 −0.7 0.08 −0.03 −0.05 −0.02 136 135 132 131
Retail tradeservices, excludinggasoline servicestations
2.6 −1.1 −2.7 −0.4 0.18 −0.08 −0.18 −0.03 391 387 376 375
All other industries 2.8 −0.1 −1.5 1.7 0.12 −0.01 −0.06 0.07 242 242 239 242All other industries,excluding Wholesaletrade andtransportation services
−0.3 −0.6 −2.1 2.1 0.00 −0.01 −0.03 0.03 81 80 79 80
Wholesale trade andtransportation services 4.4 0.1 −1.2 1.5 0.12 0.00 −0.03 0.04 162 162 160 162
Personal consumption expenditures
Total tourism-related employment (the sum ofdirect and indirect jobs) increased from 9.0million jobs in 2017 to 9.2 million jobs in2018. The 9.2 million jobs were comprised of5.9 million direct tourism jobs and 3.3 millionindirect tourism jobs (chart 5). Indirecttourism jobs consist of jobs related to the
– 9 –

MethodologicalImprovements
These revised and newly available travel and tourism statistics primarily reflect the incorporationof the 2018 comprehensive update of the IEAs, released on November 1 , 2018. Thiscomprehensive update incorporated updated definitions and classifications as well as statisticalchanges, including improved methodologies and newly available and revised source data.Combined with new and revised travel- and tourism-specific source data, these improvementsallow the travel and tourism accounts to more accurately capture the dynamics of this sector.Comprehensive updates, which occur every 5 years, go beyond annual updates by introducingimprovements to the entire IEA time series. Major changes introduced with this latest updateinclude the following:
Full integration of the 2012 benchmark Input-Output Accounts and the annual IEAs.Updated industry and commodity definitions consistent with the 2012 North AmericanIndustry Classification System.Updated wage and salary employment multipliers from the BEA Regional Input-OutputModeling System II program, which are used to measure total employment.
production of goods and services that supplythe tourism industry, such as refinery workersproducing jet fuel. The updated statisticsindicate that for every 100 jobs supporteddirectly from travel and tourism, an additional55 jobs are needed to support the industry.
st 1
– 10 –

KeyTerms
The following key terms are used to describe the Travel and Tourism Satellite Account.
Domestictourism. Travel-related expenditures by U.S. residents traveling within the United States. It comprisestravel by resident households, business travel, and travel by government employees.
Inboundtourism. Travel-related expenditures by nonresidents traveling within the United States and expendituresby nonresidents on international transportation purchased from U.S. providers. These expenditures excludeexpenditures for travel to study in the United States and for medical reasons.
Tourism commodities. Goods and services that are typically purchased by visitors, such as airline passengertransportation, hotel accommodations, and meals.
Tourismemployment. Total tourism-related employment consists of direct tourism employment plus indirecttourism employment. Direct tourism employment comprises all jobs where the workers are engaged in theproduction of direct tourism output (for example, hotel staff and airline pilots), and indirect tourism employmentcomprises all jobs where the workers are engaged in the production of indirect tourism output (for example,workers producing hotel toiletries and delivering fuel to airlines).
Tourismoutput. Total tourism-related output consists of direct tourism output and indirect tourism output. Directtourism output comprises all domestically produced goods and services purchased by travelers (for example,traveler accommodations and passenger air transportation), and indirect tourism output comprises all outputrequired to support the production of direct tourism output (for example, toiletries for hotel guests and fuel forairplanes).
Visitor. A person who travels outside of his or her usual environment (more than 50–100 miles from the area ofnormal, everyday activities) for less than a year or who stays overnight in a hotel or motel. The visitor may travelfor pleasure or business (private sector or government). Visitors exclude travelers who expect to be compensated atthe location of their visit (such as migrant workers, persons traveling to new assignments, and diplomatic andmilitary personnel traveling to and from their duty stations and their home countries).
1. For more information, see Thomas F. Howells III, Edward T. Morgan, and Casey Ross, “Improved Estimates of theIndustry Economic Accounts,” SurveyofCurrentBusiness 98 (December 2018).
1
2
3
Acknowledgments
Paul V. Kern of the National Economic Accounts supervised the preparation of the estimates. Sarah Osborne andConnor Franks prepared the estimates. Louis Feagans assisted in table preparation.
Staff members of the National Economic Accounts Directorate and the Regional Product Division contributed to thedevelopment of the estimates.
The Office of Travel and Tourism Industries of the International Trade Administration provided funding for thepreparation of the Travel and Tourism Satellite Account.
SurveyofCurrentBusinessapps.bea.gov/scb
[email protected](301) 278-9004
– 11 –