U.S. SWORDFISH FISHERIES IN THE NORTH PACIFIC … · harpoon, drift gill net, ... U.S. swordfish...
21
ISC/14/SWO-WG/06 U.S. SWORDFISH FISHERIES IN THE NORTH PACIFIC OCEAN 1 Russell Y. Ito Pacific Islands Fisheries Science Center National Marine Fisheries Service, NOAA Honolulu, Hawaii 96822 U.S.A. and John Childers Southwest Fisheries Science Center National Marine Fisheries Service, NOAA La Jolla, California 92038 U.S.A. February 2014 1 PIFSC Working Paper WP-14-001. Issued 21 February 2014. Working document submitted to a meeting of the Billfish Working Group, International Scientific Committee for Tuna and Tuna-like Species in the North Pacific Ocean (ISC), February 11-19 2014, Honolulu, Hawaii, U.S.A. [swordfish stock assessment update]. Document not to be cited without authors’ permission.
Transcript of U.S. SWORDFISH FISHERIES IN THE NORTH PACIFIC … · harpoon, drift gill net, ... U.S. swordfish...

ISC/14/SWO-WG/06
U.S. SWORDFISH FISHERIES IN THE NORTH PACIFIC OCEAN1
Russell Y. Ito Pacific Islands Fisheries Science Center
National Marine Fisheries Service, NOAA Honolulu, Hawaii 96822 U.S.A.
and
John Childers
Southwest Fisheries Science Center National Marine Fisheries Service, NOAA
La Jolla, California 92038 U.S.A.
February 2014
1PIFSC Working Paper WP-14-001. Issued 21 February 2014.
Working document submitted to a meeting of the Billfish Working Group, International Scientific Committee for Tuna and Tuna-like Species in the North Pacific Ocean (ISC), February 11-19 2014, Honolulu, Hawaii, U.S.A. [swordfish stock assessment update]. Document not to be cited without authors’ permission.

Abstract
This working paper presents catch, effort and catch-per-unit-effort information on U.S. fisheries for swordfish in the North Pacific Ocean. The major gear types employed by U.S. fisheries were harpoon, drift gill net, and longline. The oldest of the fisheries was the California harpoon fishery which dates back to the early 1900’s. The California drift gillnet fishery began in early the 1980’s and was the dominant fishery for swordfish throughout that decade. This fishery was succeeded by the Hawaii-based longline fishery in 1990 as the largest U.S. fishery for swordfish. The longline fishery is currently the largest fishery for swordfish in the North Pacific Ocean. Longline vessels in Hawaii also migrate to California. This report summarizes historical trends and recent developments for each of these fisheries.

3

4
U.S. SWORDFISH FISHERIES IN THE NORTH PACIFIC OCEAN
Russell Y. Ito
Pacific Islands Fisheries Science Center National Marine Fisheries Service, NOAA
Honolulu, Hawaii 96822 U.S.A.
and
John Childers Southwest Fisheries Science Center
National Marine Fisheries Service, NOAA La Jolla, California 92038 U.S.A.
INTRODUCTION
The United States is a major harvesting and consuming nation for swordfish (Xiphias
gladius). U.S. fisheries in the Atlantic Ocean, Gulf of Mexico, and Pacific Ocean harvested 4,061 metric tons (mt) in 2012 (NMFS, OST, Fisheries Statistics and Economics Division, 2013). Of this total, 1,528 mt (38%) were taken by the U.S. fisheries for swordfish in the North Pacific Ocean. This report summarizes historical trends and recent developments for these fisheries. 1. FISHERIES AND CATCHES
U.S. swordfish fisheries in the North Pacific Ocean can be categorized by the gear types employed (harpoon and drift gill net, and longline). Harpoon fishing for swordfish in California is the oldest of the three, dating back to the early 1900’s (Coan et al., 1998). This fishery primarily supplied the local market for swordfish until the late 1970s. Harpoon landings reached 1,699 mt in 1978, subsided to a more typical level the following year, and remained at relatively low levels thereafter (Fig. 1). The California drift gill net fishery began in 1980, and expanded so rapidly that it became the largest U.S. swordfish fishery in the North Pacific Ocean after only one year. These landings peaked at 2,990 mt in 1985 but then decreased in the following years. Swordfish-directed longlining in Hawaii began in 1988. It expanded rapidly to become the largest U.S. fishery in the Pacific Ocean for swordfish by 1990 with landings peaking at 5,936 mt in 1993. Many of the Hawaii-based vessels migrated to California during 2001-2004 then moved back to Hawaii in 2004 and 2005 due to regulatory changes. Some of these vessels continue to migrate between states according to fishing conditions.
5
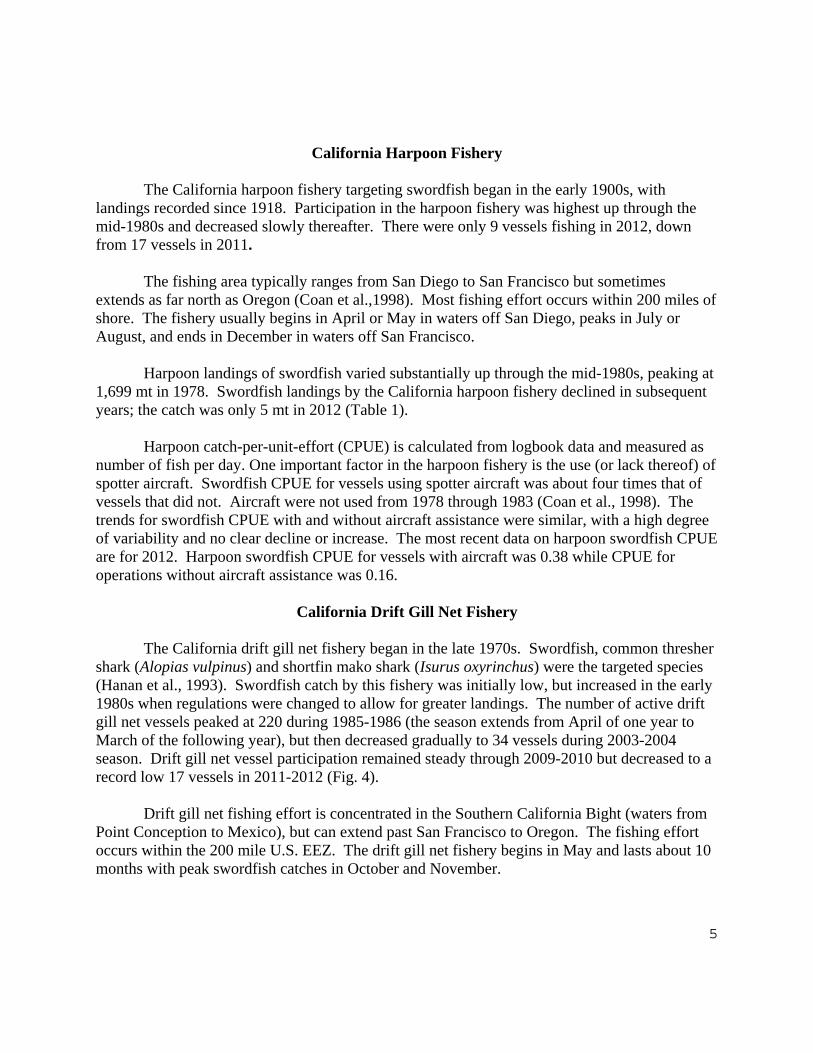
California Harpoon Fishery
The California harpoon fishery targeting swordfish began in the early 1900s, with landings recorded since 1918. Participation in the harpoon fishery was highest up through the mid-1980s and decreased slowly thereafter. There were only 9 vessels fishing in 2012, down from 17 vessels in 2011.
The fishing area typically ranges from San Diego to San Francisco but sometimes extends as far north as Oregon (Coan et al.,1998). Most fishing effort occurs within 200 miles of shore. The fishery usually begins in April or May in waters off San Diego, peaks in July or August, and ends in December in waters off San Francisco.
Harpoon landings of swordfish varied substantially up through the mid-1980s, peaking at 1,699 mt in 1978. Swordfish landings by the California harpoon fishery declined in subsequent years; the catch was only 5 mt in 2012 (Table 1).
Harpoon catch-per-unit-effort (CPUE) is calculated from logbook data and measured as number of fish per day. One important factor in the harpoon fishery is the use (or lack thereof) of spotter aircraft. Swordfish CPUE for vessels using spotter aircraft was about four times that of vessels that did not. Aircraft were not used from 1978 through 1983 (Coan et al., 1998). The trends for swordfish CPUE with and without aircraft assistance were similar, with a high degree of variability and no clear decline or increase. The most recent data on harpoon swordfish CPUE are for 2012. Harpoon swordfish CPUE for vessels with aircraft was 0.38 while CPUE for operations without aircraft assistance was 0.16.
California Drift Gill Net Fishery
The California drift gill net fishery began in the late 1970s. Swordfish, common thresher shark (Alopias vulpinus) and shortfin mako shark (Isurus oxyrinchus) were the targeted species (Hanan et al., 1993). Swordfish catch by this fishery was initially low, but increased in the early 1980s when regulations were changed to allow for greater landings. The number of active drift gill net vessels peaked at 220 during 1985-1986 (the season extends from April of one year to March of the following year), but then decreased gradually to 34 vessels during 2003-2004 season. Drift gill net vessel participation remained steady through 2009-2010 but decreased to a record low 17 vessels in 2011-2012 (Fig. 4).
Drift gill net fishing effort is concentrated in the Southern California Bight (waters from
Point Conception to Mexico), but can extend past San Francisco to Oregon. The fishing effort occurs within the 200 mile U.S. EEZ. The drift gill net fishery begins in May and lasts about 10 months with peak swordfish catches in October and November.

6
Swordfish landings by the drift gill net fishery increased from 160 mt in 1980 to 2,990 mt in 1985. Since then, swordfish catches have fluctuated on a decreasing trend to a record low 61 mt in 2010 with catches at 97 mt in 2012 (Table 1).
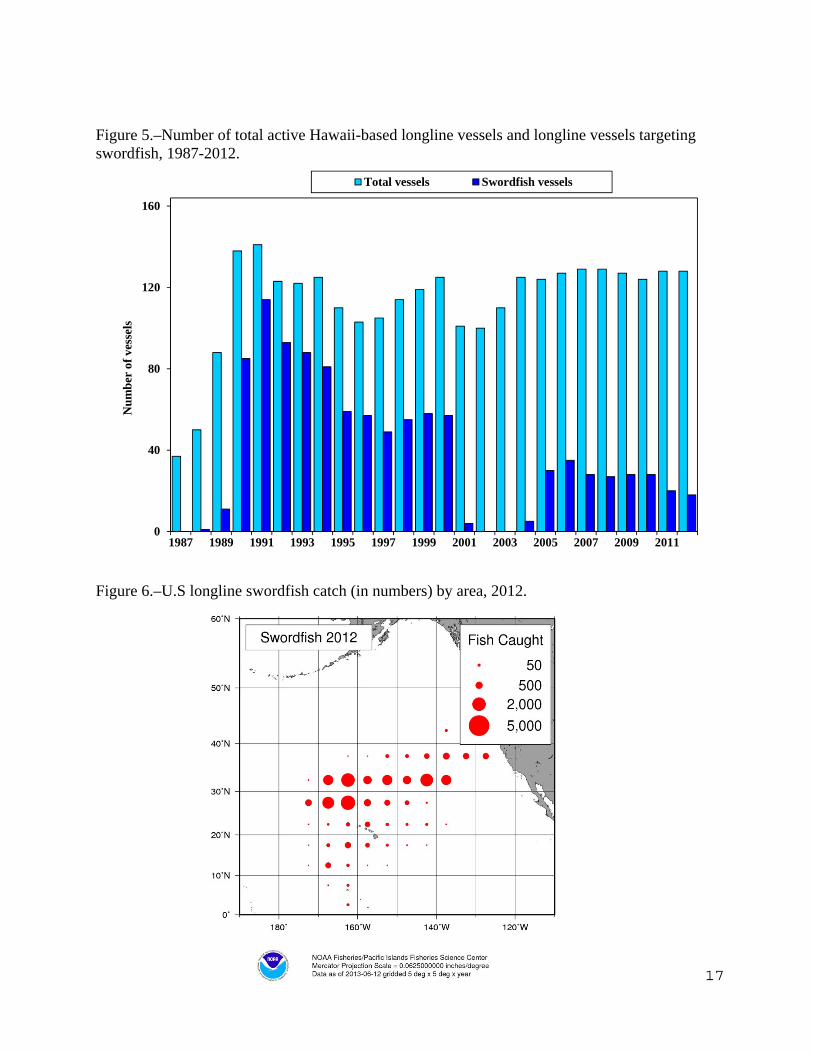
Hawaii-based Longline Fishery The fishing vessel Magic Dragon came to Hawaii and introduced swordfish longline techniques from Florida in 1988 (Ito et al., 1998). This segment of the longline fishery eventually grew and established Hawaii as a major domestic producer of swordfish. The number of Hawaii-based longline vessels increased rapidly from 37 vessels in 1987 to 141 vessels in 1991 as U.S. longliners from the Gulf of Mexico and the Atlantic swordfish fisheries joined the Hawaii-based longline fishery (Fig. 5). A federal moratorium was implemented in 1991 to limit the number of longline permits at 167 in light of this rapid expansion. Vessel participation never reached the limit. The moratorium on permits was replaced with a limited entry program in 1994 which capped participation in Hawaii’s longline fishery at 164 vessels. Vessel activity ranged from 100 to 129 vessels up through 2005, with 129 active longline vessels in 2012. Eighteen Hawaii-based longline vessels set their gear shallow to target swordfish in 2012, down from 20 in 2011.
The Hawaii-based longline fishery for swordfish, which was heavily regulated in 1999-2001 and prohibited from 2002 through early 2004 due to sea turtle interactions. It reopened in April 2004 under new regulations promulgated by NOAA Fisheries. The new regulations were enacted to minimize interactions between longline gear and sea turtles included a limit of 2,120 shallow sets per year, use of transferable shallow-set certificates (one certificate per set) by eligible Hawaii longline limited access permit holders, a requirement to notify NOAA Fisheries of an intent to deploy shallow sets before any such trips, a requirement that the vessel operator make shallow sets throughout the entire trip, carry an observer, use circle hooks, use mackerel or mackerel-type bait, begin setting operations one hour after sunset, and carry a dehooking device and large dip nets to bring hooked turtles on board gently. They established annual limits on the numbers of interactions between longline gear and leatherback (Dermochelys coriacea) and loggerhead (Caretta caretta) sea turtles with mandatory fishery closures when either limit is reached (16 and 17, respectively). Although the shallow-set longline fishery for swordfish in Hawaii was reopened in March 2004, 2005 was the first complete year this fishery operated under the new guidelines. The limit on shallow sets was removed in 2009. The sea turtle interaction limits were revised from 16 to 26 for leatherback turtles and from 17 to 34 for loggerhead turtles by NMFS on November 5, 2012. Though restrictions on shallow-set longline fishing decreased, the effort in this sector of the longline fishery has decreased.
The Hawaii-based longline fishery ranged from the equator to 45o N latitude and from 125o to 175oW longitude in 2012. The total range since 1991 extended from the equator to 50o N latitude and from 130o W to 175o E longitude. Effort by the Hawaii-based longline fishery has been on an increasing trend with a record 45.6 million hooks set in 2012. The shallow-set

7
longline fishery, which typically operates in latitudes north of the Hawaiian Islands on the high seas accounted for 3% of the total effort. Shallow-set longline effort for swordfish was typically highest during the first half of the year and the area with the highest swordfish catches was between 30o and 35o N latitude (Figure 6). Swordfish landing statistics for the California-based longline fishery during 2005-2012 were confidential because there was only one active vessel. Therefore, Hawaii- and California -based longline swordfish landings in the North Pacific Ocean were combined (Table 1). The preliminary estimate of 2012 U.S. swordfish longline landings in the North Pacific Ocean was 1,418 mt, down 13% from the previous year. The shallow-set longline fishery for swordfish was affected by the sea turtle interaction limit in 2006 when this segment of the fleet reached the loggerhead sea turtle interaction limit in March and was closed for the remainder of the year. The shallow-set longline fishery also reached the leatherback sea turtle interaction limit in November 2011 and was closed for the remainder of that year as well. Sea turtle interactions were well below the allowable limits with only 7 leatherback and 6 loggerhead interactions in 2012.
Swordfish CPUE (number of fish per 1,000 hooks) varies substantially according to targeting practice (Fig. 7). Swordfish CPUE for trips that specifically set their gear shallow to targeted swordfish ranged from 9.3 fish in 2010 to 19.1 fish in 2006. The average swordfish CPUE under the conditions of the pre-litigation period (1991-2001) was 13.8. The shallow-set swordfish fishery was reopened in March 2004. There was a low level of shallow-set effort in the fourth quarter of that year but those who first tried fishing under the new regulations were able to achieve a swordfish CPUE of 12.7. The first complete year in which the Hawaii-based longline fishery operated under the new set of regulations was 2005; vessel operators reported a CPUE of 15.5 on shallow-sets during that year. Shallow-set swordfish CPUE reached a record 19.1 in 2006 because that sector of the Hawaii-based longline fishery was closed after the peak of the swordfish season after reaching the limit on loggerhead sea turtle interactions. Swordfish then declined to a record low of 9.3 in 2010 and remained stable in 2011-2012, with CPUE at 9.8 in 2012. The average swordfish CPUE under the conditions of the post-litigation period (2004-2012) was 13.0. Shallow-sets had their highest CPUE during the first quarter and lowest CPUE in the third (Figure 8a). Deep-sets had negligible swordfish catch rates and had relatively low mean annual CPUE of 0.1 and remained unchanged over the past 12 years. Deep sets swordfish mean quarterly CPUE was lowest in the first quarter and highest in the second quarter at 0.2 (Figure 8b).
The mean weight of swordfish from the shallow-set sector exceeded the mean weight of
swordfish from the deep-set sector by 10 kgs in 2012. Shallow-set longline fishing for swordfish had a higher proportion of larger fish than deep-set swordfish. The weight-frequency histograms for shallow-set and deep-set swordfish both had a dominant mode at the 21-30 kg interval (Figures 9a & 9b), but the shallow-set swordfish had secondary mode at the 71-80 kg interval.

8
California-based Longline Fishery
The California-based longline fishery began in 1991 when three vessels based in San Pedro fished waters outside the U.S. EEZ (Vojkovich and Barsky, 1998). The longline fleet increased more than 10-fold from 3 in 1991 to 31 vessels in 1994. Participation in the California-based longline fishery peaked at 44 vessels in 2000 (Fig. 10). The California-based longline fleet consisted primarily of vessels that had targeted swordfish in Hawaii, but migrated to California in reaction to the turtle interaction lawsuit in 2000. Almost all of those vessels returned to Hawaii in 2004 when the shallow set longline fishery in California was closed and longline vessel operators were only allowed to set their gear deep. The California longline fishery has since decreased to only a single vessel targeting tunas during 2005-2012, although federally permitted Hawaii longline vessels are allowed to unload their catch in California
California does not allow pelagic longline fishing within the EEZ; therefore, the California-based longline fishery operated exclusively on the high seas. When this fishery first began, effort typically peaked late in the year and the fleet began fishing closer to Hawaii. Shallow-set longline fishing targeting swordfish out of California was prohibited in 2004. Swordfish landings by the California-based longline fishery increased from negligible levels in the early 1980s to a peak in 2000. The California-based longline fishery was the largest U.S. swordfish fishery in the North Pacific Ocean from 2001 to 2004 . The single California-based longline vessel employed deep-set tuna target gear and had only small incidental catches of swordfish during the past three years. California-based longline CPUE (number of fish per 1000 hooks) for swordfish varied from 6.3 in 1995 to 25.3 in 2004 (Fig. 11), the most recent year for which swordfish CPUE data are available. 2. DATA SOURCES
Hawaii
Federal longline logbooks have been mandatory for Hawaii-based longline vessels since November 1990. The Federal longline logbook data provide detailed information among the various data sets for the Hawaii-based longline fishery. Logbooks must be maintained by vessel operators and submitted after each trip. Data recorded in the logbooks include: vessel, date, fishing location, effort and gear configuration, catch by species, and interactions with protected species. Coverage of the Federal longline logbook data is estimated to be very close to 100%.
From 1987-2000, market data on longline landings were collected at the Honolulu fish auction by the NMFS. Individual fish weights were obtained from 25%- 90% of fish landed by the Hawaii-based longline fishery and recorded to the nearest half pound. Weights were raised
9
to an estimated whole weight when processing or damage was observed. Sex of fish was not available as most swordfish were landed in processed form (headed, finned, and gutted). The responsibility for collecting market data was transferred to the State of Hawaii, Division Aquatic Resources (DAR) in 2000. Coverage of the DAR market data is estimated to be in excess of 95%.
Data collection by at-sea observers was initiated in 1990 when Hawaii-based longline vessels volunteered to take observers aboard to investigate longline fishery interactions with Hawaiian monk seals (Monachus schauinslandi) (Dollar, 1991). A mandatory observer program began in February 1994 (Dollar, 1994) using statistical guidelines to improve the estimates of incidental takes of sea turtles (DiNardo, 1993). Observers covered about 5% of the total longline trips from 1994-1999. Observer coverage was then increased in response to new regulations and has remained at or above 20% for the deep-set tuna sector of the Hawaii-based longline fishery from the latter part of 2000 through 2012. Beginning in 2004, observer coverage on shallow-set trips targeting swordfish was 100%. The observer data are similar to logbooks, although more detailed. The primary purpose for the data collected by the observer program is to assess the fleet-wide impact of longlining on protected and endangered species but the data are also used for stock assessment purposes.
California
There are four types of data on the California-based longline fishery: CDFG landing receipts; CDFG and Federal daily longline logbooks; dockside sampling of swordfish landings collected by the CDFG; and data collected at sea by NMFS observers. Landing receipts have been collected by the CDFG since the start of the fishery in 1991. Daily longline logbook data were first collected by the CDFG on a voluntary basis from 1993 to 1994. Collecting and submitting CDFG longline logbook data (Pacific Offshore) became mandatory in 1995. This system was replaced in 1999 by a NMFS High Seas longline logbook data reporting system in response to Federal requirements under the High Seas Fisheries Compliance Act. Data recorded in the logbooks include: vessel, date, fishing location, effort and gear configuration, numbers of fish caught by species, and number of interactions with protected species. Collection of size samples from longline-caught swordfish began in 1991 in conjunction with drift gill net swordfish sampling (Childers and Halko, 1994) but was discontinued in 2000. NMFS began placing observers on longline vessels from 2001 to investigate interactions with sea turtles and collect detailed catch and effort data. Some size data are also collected by observers.
The California drift gill net fishery is monitored by use of CDFG landing receipts, vessel logbooks, size sampling, and a CDFG and NMFS observer program. Landing receipts have been collected by the CDFG since the fishery's inception in 1980. Drift gill net fishermen are required to collect logbook data on daily operations and catch. Location is recorded in 10 minute squares. CDFG sampled drift gill net swordfish catch for length at local markets beginning in 1981. An observer program to monitor the drift gill net fishery was initiated and maintained by CDFG

10
from 1980 to 1989 and has continued since 1990 under NMFS. The observer program is used to monitor bycatch, especially of marine mammals. The NMFS observer program also collects size samples of swordfish.
The California harpoon fishery is also monitored through landing receipts, vessel logbook, and size sampling by the CDFG. Landings have been collected since the early 1900s through a landings receipt system. A mandatory vessel logbook system for the harpoon fishery started in 1974. These logbooks are completed daily and record catches by location in the CDFG 10-minute square codes. Information on aircraft assistance, water color, sea surface temperature and condition, harpooning success, and areas searched is also included. Size sampling of swordfish landings began in 1981 in conjunction with the drift gill net sampling. The sampling program was discontinued in 2000.

11
LITERATURE CITED Childers, J., and L. Halko
1994. Length-frequency database description: California Department of Fish and Game gill net market samples. Southwest Fish. Sci. Cent. Admin. Rep. LJ-94-01. 46 p.
Coan, A. L., M. Vojkovich, and D. Prescott.
1998. The California harpoon fishery for swordfish (Xiphias gladius). In I. Barrett, O. Sosa-Nishizaki and N. Bartoo (eds.). 1998. Biology and fisheries of swordfish, Xiphias gladius. Papers from the International Symposium on Pacific Swordfish, Ensenada, Mexico, 11-14 December 1994. U.S. Dept. of Comm., NOAA Tech. Rept. NMFS 142. p 37-48.
DiNardo, G. T.
1993. Statistical Guidelines for a Pilot Observer Program to Estimate Turtle Takes in the Hawaii Longline Fishery. NOAA Technical Memorandum NOAA-TM-NMFS-SWFC-190. 40p.
Dollar, R. A.
1994. Annual report of the 1993 western Pacific longline fishery. Honolulu Lab., Southwest Fish. Cent., Natl. Mar. Fish. Serv., NOAA Honolulu, HI 96822-2396. Southwest Fish. Cent. Admin. Rep. H-94-06. 38 p.
Dollar, R. A.
1991. Summary of swordfish longline observations in Hawaii, July 1990-March 1991. Honolulu Lab., Southwest Fish. Cent., Natl. Mar. Fish. Serv., NOAA Honolulu, HI 96822-2396. Southwest Fish. Cent. Admin. Rep. H-91-09. 13 p.
DOC, NOAA, NMFS, Fisheries Statistics and Economics Division.
2013. Fisheries of the United States, 2006. Current Fishery Statistics No. 2012. Van Voorhees (Chief), and Lowther (Editor). Natl. Mar. Fish. Serv., NOAA, Dept. of Comm. 124p.
Hanan, D. A., D. B. Holts, and A. L. Coan Jr.
1993. The California drift gill net fishery for sharks and swordfish, 1981-82 through 1990-91. Calif. Dept. of Fish and Game, Fish. Bull. 175. 95p.
12
LITERATURE CITED (continued) Ito, R. Y., R. A. Dollar, and K. E. Kawamoto.
1998. The Hawaii-based Longline Fishery for swordfish (Xiphias gladius). In I. Barrett, O. Sosa-Nishizaki and N. Bartoo (eds.). 1998. Biology and fisheries of swordfish, Xiphias gladius. Papers from the International Symposium on Pacific Swordfish, Ensenada, Mexico, 11-14 December 1994. U.S. Dept. of Comm., NOAA Tech. Rept. NMFS 142. p 77-88.
Otsu, T.
1954. Analysis of the Hawaiian long-line fishery, 1948-52. Comm. Fish. Rev. 16(9):1-17. Vojkovich, M. and K. Barsky.
1998. The California-based Longline Fishery for Swordfish, Xiphias gladius, beyond the U.S. Exclusive Economic Zone. In I. Barrett, O. Sosa-Nishizaki and N. Bartoo (eds.). 1998. Biology and fisheries of swordfish, Xiphias gladius. Papers from the International Symposium on Pacific Swordfish, Ensenada, Mexico, 11-14 December 1994. U.S. Dept. of Comm., NOAA Tech. Rept. NMFS 142. p 147-157.

13
Table 1.--U.S. North Pacific swordfish landings* (metric tons), 1970-2012. Dashes indicate no fishery.
* Based on estimated whole weight.
1970 612 --- 10 5 6271971 99 --- 3 1 1031972 171 --- 4 0 1751973 399 --- 4 0 4031974 406 --- 22 0 4281975 557 --- 13 0 5701976 42 --- 13 0 551977 318 --- 19 17 3541978 1,699 --- 13 9 1,7211979 329 --- 57 7 3931980 566 160 62 5 7931981 267 461 20 3 7511982 156 911 43 5 1,1151983 58 1,321 378 5 1,7621984 96 2,101 678 3 2,8781985 305 2,990 108 2 3,4051986 291 2,069 113 2 2,4751987 235 1,529 35 24 1,8231988 196 1,376 70 24 1,6661989 62 1,243 63 218 1,5861990 64 1,131 48 2,437 3,6801991 20 944 50 4,535 5,5491992 75 1,356 48 5,762 7,2411993 168 1,412 165 5,936 7,6811994 157 792 28 3,807 4,7841995 97 771 35 2,981 3,8841996 81 761 20 2,848 3,7101997 84 708 18 3,393 4,2031998 48 931 26 3,681 4,6861999 81 606 36 4,329 5,0522000 90 649 33 4,834 5,6062001 52 375 19 1,969 2,4152002 90 302 3 1,524 1,9192003 107 216 21 1,958 2,3022004 69 182 51 1,185 1,4872005 77 220 10 1,622 1,9292006 71 443 9 1,211 1,7342007 59 490 6 1,735 2,2902008 48 405 25 2,014 2,4922009 50 251 5 1,817 2,1232010 37 61 21 1,676 1,7952011 24 118 95 1,623 1,8602012 5 97 8 1,418 1,528
Other Longline Harpoon Gill net YearNorth Pacific

14
Figure 1.–Catch by the U.S. swordfish fisheries of the North Pacific Ocean, 1970-2012.
0
2,000
4,000
6,000
8,000
1970 1975 1980 1985 1990 1995 2000 2005 2010
Lan
ding
s (m
etri
c to
ns)
Harpoon Gill net Longline Other

15
Figure 2.--Number of California harpoon vessels, 1974-2012.
Figure 3.--California harpoon fishery swordfish catch-per-unit-effort (CPUE), 1974-2012.
0
100
200
300
400
1974 1978 1982 1986 1990 1994 1998 2002 2006 2010
Ves
sels
0.0
1.0
2.0
3.0
1974 1978 1982 1986 1990 1994 1998 2002 2006 2010
CP
UE
(fi
sh p
er d
ay)
Aircraft assisted No aircraft Mean

16
Figure 4.--Number of California drift gill net vessels, 1981-1982 through 2011-2012.
0
100
200
300
1981-82 1985-86 1989-90 1993-94 1997-98 2001-02 2005-06 2009-10
Nu
mb
er o
f ve
ssel
s
17
Figure 5.–Number of total active Hawaii-based longline vessels and longline vessels targeting swordfish, 1987-2012.
Figure 6.–U.S longline swordfish catch (in numbers) by area, 2012.
0
40
80
120
160
1987 1989 1991 1993 1995 1997 1999 2001 2003 2005 2007 2009 2011
Num
ber
of
vess
els
Total vessels Swordfish vessels

18
Figure 7.–Hawaii-based longline catch-per-unit-effort (CPUE) for swordfish by set type, 1991-2012.
0.0
0.3
0.5
0.8
1.0
0.0
5.0
10.0
15.0
20.0
1991 1993 1995 1997 1999 2001 2003 2005 2007 2009 2011
Dee
p-s
et C
PU
E
Shal
low
-set
CP
UE
Shallow-set Deep-set

19
Figure 8a.–Quarterly Hawaii-based longline shallow-set swordfish CPUE, 1991-2012.
Figure 8b.–Quarterly Hawaii-based longline deep-set swordfish CPUE, 1991-2012.
1 2 3 42012 10.67 8.84 7.18 9.732011 12.96 8.67 10.25 10.21Mean (1991-2012) 14.99 11.80 11.12 12.95
0.0
5.0
10.0
15.0
20.0
25.0
Quarter
1 2 3 42012 0.05 0.14 0.07 0.052011 0.06 0.12 0.08 0.04Mean (1991-2012) 0.11 0.20 0.16 0.13
0.00
0.25
0.50
0.75
1.00
CP
UE
(F
ish
per
1000
Hoo
ks)
Quarter

20
Figure 9a.–Hawaii-based longline shallow-set swordfish weight-frequency, 2012.
Figure 9b.–Hawaii-based longline deep-set swordfish weight-frequency, 2012.
0
3
6
9
12
1-10 51-60 101-110 151-160 201-210 251-260 >300
Shallow-set swordfishn = 9,622
0
4
8
12
16
1-10 51-60 101-110 151-160 201-210 251-260 >300
Deep-set swordfishn = 3,005

21
Figure 10.— Number of California-based longline vessels, 1987-2012.
Figure 11.–California-based longline catch-per-unit-effort (CPUE), 1994-2004.
0
10
20
30
40
50
1991 1993 1995 1997 1999 2001 2003 2005 2007 2009 2011
Nu
mb
er o
f ve
ssel
s
0.0
10.0
20.0
30.0
1994 1996 1998 2000 2002 2004
CP
UE
(fi
sh p
er 1
000
hook
s)