U.S. Solar Market Insight: Q4 2016 · 2018-2020 Booms: New York and Maryland ... pilot programs ......
24
U.S. Solar Market Insight: Q4 2016 State and Future of U.S. Solar Markets Austin Perea Solar Analyst [email protected] 12/14/2016
Transcript of U.S. Solar Market Insight: Q4 2016 · 2018-2020 Booms: New York and Maryland ... pilot programs ......

U.S. Solar Market Insight: Q4 2016
State and Future of U.S. Solar Markets
Austin Perea
Solar Analyst
12/14/2016

1Perea - US Solar Market Insight: Q4 2016
Contents
1. National Overview and Key Market Drivers #
2. Residential PV #
3. Non-Residential PV #
4. Utility PV #

Perea - US Solar Market Insight: Q4 2016
National Overview & Key Market Drivers1.

3Perea - US Solar Market Insight: Q4 2016
Q3 2016 – The Largest Quarter for Solar PV
479
795
546
822690
1,314
747
941 964
2,110
1,3641,287
1,395
2,205
1,3461,436 1,425
3,295
2,0032,079
4,143
0
500
1,000
1,500
2,000
2,500
3,000
3,500
4,000
Inst
alla
tio
ns
(MW
dc)
Residential Non-Residential Utility
Q3 2016: 4,143 MWdc installed
Q1-Q3 2016: 8,225 MWdc installed
Utility PV: 3,174 MWdc
• ~75% of total PV capacity installed in Q3 2016;
~65% of total PV installed in 2016 to-date
• Contracted utility PV pipeline currently totals
19.9 GWdc
Non-Residential PV: 311 MWdc
• Up 15% from Q2 2016
• Up 37% over Q3 2015
Residential PV: 593 MWdc
• Down 10% over Q2 2016
• Up 2% over Q3 2015

Perea - US Solar Market Insight: Q4 2016
Market Segment Breakdown: Residential PV
2016: The Year of Major Market Slowdown?
2.
5Perea - US Solar Market Insight: Q4 2016
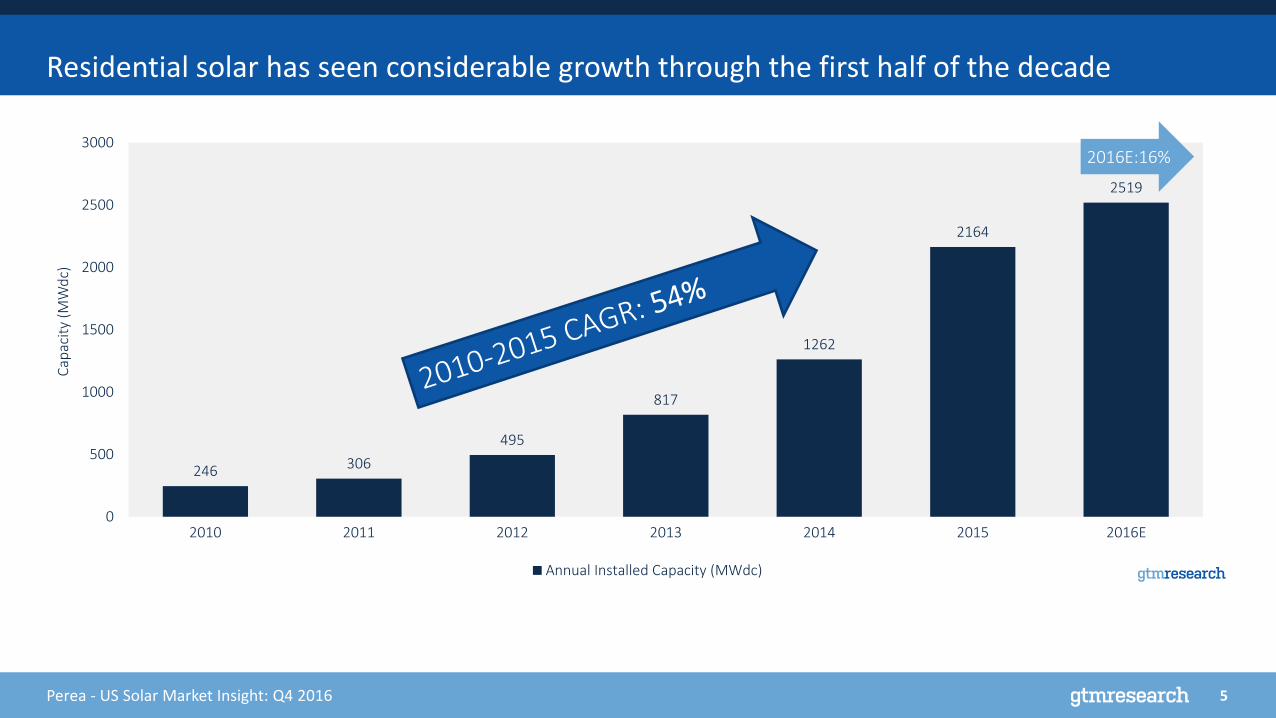
Residential solar has seen considerable growth through the first half of the decade
246 306
495
817
1262
2164
2519
0
500
1000
1500
2000
2500
3000
2010 2011 2012 2013 2014 2015 2016E
Cap
acit
y (M
Wd
c)
Annual Installed Capacity (MWdc)
2016E:16%

6Perea - US Solar Market Insight: Q4 2016
Residential PV continues to be a geographically consolidated market
California’s lowest share of residential market since 2012
76%
-7%
346%
36%59%
69%
283%
5%
211%
-15%-50%
0%
50%
100%
150%
200%
250%
300%
350%
400%
Q1 2015 Q2 2015 Q3 2015 Q4 2015 Q1 2016 Q2 2016 Q3 2016
Year
-ove
r-Ye
ar %
Gro
wth
Top 5 Residential State Markets Q1 2015-Q3 2016
California New York New JerseyMaryland Massachusetts
42%
9%7%
6%
6%
30%
Q3 2016 State Market Shares
California
New York
New Jersey
Maryland
Massachusetts
All Other States

7Perea - US Solar Market Insight: Q4 2016
Major market growth increasingly inhibited by customer fatigue
and market saturation
• Protracted lead generation timelines
• Higher customer acquisition costs
• Declining lead conversation ratios
Longer sales cycles leading to slower growth among California and other key
markets
Additionally, NEM reform and rate design continues to present
near- and long-term risk to DG economics
Emerging market most risk most pronounced
• Nevada: Rollback to NEM has cratered promising top ten market in 2016
• Utah: Utility has proposed new discriminatory solar rate class
• Arizona: Peak demand charge has potential to slash savings in 2017
• California: Transition to NEM 2.0 complicates sales process for installers
Customer fatigue and ongoing NEM & rate design battles remain hurdles for residential PV
National Level Trends for Residential Solar
Source: GTM Research/SEIA, Q3 2016 U.S. Solar Market Insight
California Residential Growth % vs. Customer Penetration
89%97%
153%
68%
52%
28%
76%
62%67%
56%
23% 19%
2%
3%
4%
7%
8%
0%
1%
2%
3%
4%
5%
6%
7%
8%
9%
0%
20%
40%
60%
80%
100%
120%
140%
160%
180%
Share o
f Ro
ofto
p P
V A
dd
ressable M
arket with
Solar
Installed
Year
-ove
r-Ye
ar %
Gro
wth
CA: Growth (%) CA: Customer Penetration (%)

8Perea - US Solar Market Insight: Q4 2016
Emerging markets will partially offset major market decline
72%
28%
2015Top Five Market Share
Rest of Market 62%
38%
2021ETop Five Market Share
Rest of Market
No state-level net metering policy – state growth primarily supported by utility-level rebates
◦ With utilities offering robust incentives the state has recently become top ten market
◦ Austin Energy VOST continues to attract national installers
20% aggregate NEM cap, retail-rate NEM but looming tax credit expiration and NEM uncertainty pose risk
◦ In-state tax credit has fueled growth in H1 2016 with 12,000 applications in 2016 vs. 3,000 in 2015
◦ 20+ MW installed in Q3 and could see significant demand pull-in from customers trying to qualify for the tax credit and
grandfathered retail-rate NEM

9Perea - US Solar Market Insight: Q4 2016
Near Term: Growth to continue, though at slower rates than expected
• Despite NEM policy certainty across most major state markets, deceleration is expected
to continue
• That said, major markets will continue to account for a large share of reduced growth
with occasional demand pull-in and emerging market growth also contributing
Long Term: Demand diversification to accelerate via Federal ITC Extension
• Policy certainty in major state markets will provide strong baseline growth for residential
PV though rate of growth will be slower than in previous years
• Demand diffusion will continue, as secondary state markets are already surpassing
growth rates of major states and are poised to assume a larger share of the market
• Growth will depend on the extent to which installers can adapt to evolving customer
acquisition landscape and tap in to new customer demographics
U.S. Residential Solar Market Outlook
Source: GTM Research/SEIA, Q4 2016 U.S. Solar Market Insight
Annual Residential PV Installation Forecast: 2010-2021E Near Term (2017) and Long Term (2018-2021) Market Outlook
0
500
1,000
1,500
2,000
2,500
3,000
3,500
4,000
4,500
5,000
2010 2011 2012 2013 2014 2015 2016E 2017E 2018E 2019E 2020E 2021E
Res
iden
tial
PV
Inst
alla
tio
ns
(MW
dc)

Perea - US Solar Market Insight: Q4 2016
Market Segment Breakdown: Non-Residential PV
The Little Sector That Could
3.

11Perea - US Solar Market Insight: Q4 2016
2016 installations poised to benefit from:
Community solar pipeline realization
• Upside stems from nearly 300 MW of community
solar projects in development
California demand pull-in
• Solar-friendly rate design
• Customer continue to leverage NEM-Agg
Non-residential PV expected to experience
reboot
Traditional C&I still struggling
• Rate design still matters
• Declining incentive environment
• Lack of credit-worthy offtakers
• NEM cap and structure uncertainty
Non-Residential PV Overview – Where’s the upside?
0
200
400
600
800
1000
1200
1400
1600
2010 2011 2012 2013 2014 2015 2016E
Cap
acit
y (M
Wd
c)
Non-Residential 2010-2016E

12Perea - US Solar Market Insight: Q4 2016
• 2016 Outlook: Pent up demand unrealized due to…
◦ 12+ month regulatory and legislative debates over
– Interconnection cost upgrades
– NEM capacity limits
– Successor bill credit methodologies in lieu of full retail rate
• 3rd party led: Boom and bust cycles to yield flat demand ranging
between 300 – 400 MW per year beginning in 2017
◦ 2017-2018 Booms: Massachusetts and Minnesota
◦ 2018-2020 Booms: New York and Maryland
• Utility led: Majority of announced programs are 1 MW+, signaling
market’s beginning to mature beyond smaller scale, single project
pilot programs
Realizing the promise of community solar
0
100
200
300
400
500
600
An
nu
al In
stal
lati
on
s (M
Wd
c)
Utility Led Total CS Installations (MWdc)Source: GTM Research

13Perea - US Solar Market Insight: Q4 2016
California accounted for 52% of the non-residential market in
Q3 – it’s highest share of the commercial market ever
Solar-friendly tariffs such as SCE’s Option R and PG&E’s A-6 are
made up by higher portion of volumetric charges, which solar is
directly able to offset
• SCE’s Option R Tariff: 150 MW remaining in program
• PG&E’s A-6: CPUC delayed closure for medium-size customers
until March 31, 2017
No system size limitations under NEM 2.0 to fuel 1+
MW development
• NEM-A customers to benefit from higher system sizes
California’s solar-friendly rate design and NEM 2.0 transition fueling commercial market
Average Commercial Solar Export Rates in CA: Default
Tariff vs. Option R in SCE and PG&ECalifornia’s largest non-residential quarter ever?
0%
10%
20%
30%
40%
-
5
10
15
20
25
30
35
Q1-2014 Q3-2014 Q1-2015 Q3-2015 Q1-2016 Q3-2016
% N
on
-Resid
ential M
arket
Cap
acit
y (M
Wd
c) NEM-Agg Capacity
NEM-Agg Installed Capacity
NEM-Agg % Non-Residential Market Share

14Perea - US Solar Market Insight: Q4 2016
Near Term: Demand Fueled by Large Scale (1 MW+) Development
2017-2018: A gradual rebound is expected via:
• Pent-up third-party community solar demand in MA, MN, and CO and nearly 100 MWdc
of utility-led community solar
• Strong CA demand via solar-friendly rates and 1 MW+ development as NEM 2.0
transition begins
• NEM cap relief in MA, though SREC successor program rollout delay risks pushing out
greenfield origination opportunities
Long Term: Saved By the Federal ITC Extension (Especially Small Commercial)
• Long term growth will increasingly stem from the sub 1 MW non-residential PV market,
as third party financing solutions expand into the small and medium sized commercial
customer bases.
• As the effects of revised virtual NEM rules are felt in the Northeast, customer sited
development and increasingly solar + storage will play a larger role in long term growth.
◦ The exception to that trend is community solar, which remains a long term incentive-
funded growth opportunity for offsite commercial development.
U.S. Non-Residential Solar Market Outlook
Source: GTM Research/SEIA, Q3 2016 U.S. Solar Market Insight
Annual Non-Residential PV Installation Forecast: 2010-2021E Near Term (2017-2018) and Long Term (2018-2021) Market Outlook
0
500
1,000
1,500
2,000
2,500
3,000
3,500
2010 2011 2012 2013 2014 2015 2016E 2017E 2018E 2019E 2020E 2021E
No
n-R
esid
enti
al P
V In
stal
lati
on
s (M
Wd
c)
Perea - US Solar Market Insight: Q4 2016
Market Segment Breakdown: Utility PV
Non-RPS procurement becomes largest driver of utility PV demand
4.
16Perea - US Solar Market Insight: Q4 2016
13,882
28,579
20,946
0
5,000
10,000
15,000
20,000
25,000
30,000
Operating Contracted (PPA Signed) Announced (Pre-Contract)
U.S
Uti
lity
Cap
acit
y (M
Wd
c)
In Construction
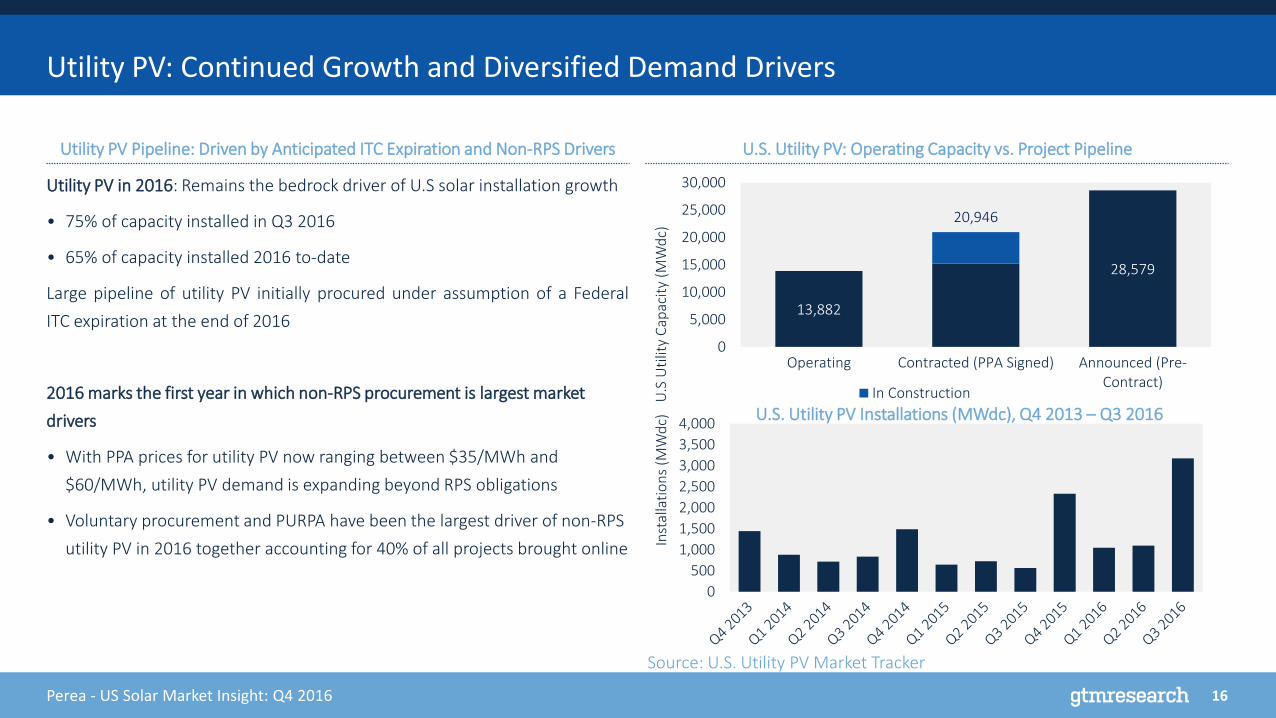
Utility PV in 2016: Remains the bedrock driver of U.S solar installation growth
• 75% of capacity installed in Q3 2016
• 65% of capacity installed 2016 to-date
Large pipeline of utility PV initially procured under assumption of a Federal
ITC expiration at the end of 2016
2016 marks the first year in which non-RPS procurement is largest market
drivers
• With PPA prices for utility PV now ranging between $35/MWh and
$60/MWh, utility PV demand is expanding beyond RPS obligations
• Voluntary procurement and PURPA have been the largest driver of non-RPS
utility PV in 2016 together accounting for 40% of all projects brought online
Utility PV: Continued Growth and Diversified Demand Drivers
Utility PV Pipeline: Driven by Anticipated ITC Expiration and Non-RPS Drivers
Source: U.S. Utility PV Market Tracker
U.S. Utility PV: Operating Capacity vs. Project Pipeline
U.S. Utility PV Installations (MWdc), Q4 2013 – Q3 2016
0
500
1,000
1,500
2,000
2,500
3,000
3,500
4,000
Inst
alla
tio
ns
(MW
dc)
17Perea - US Solar Market Insight: Q4 2016
Non-RPS drivers drive the majority of pipeline procurement
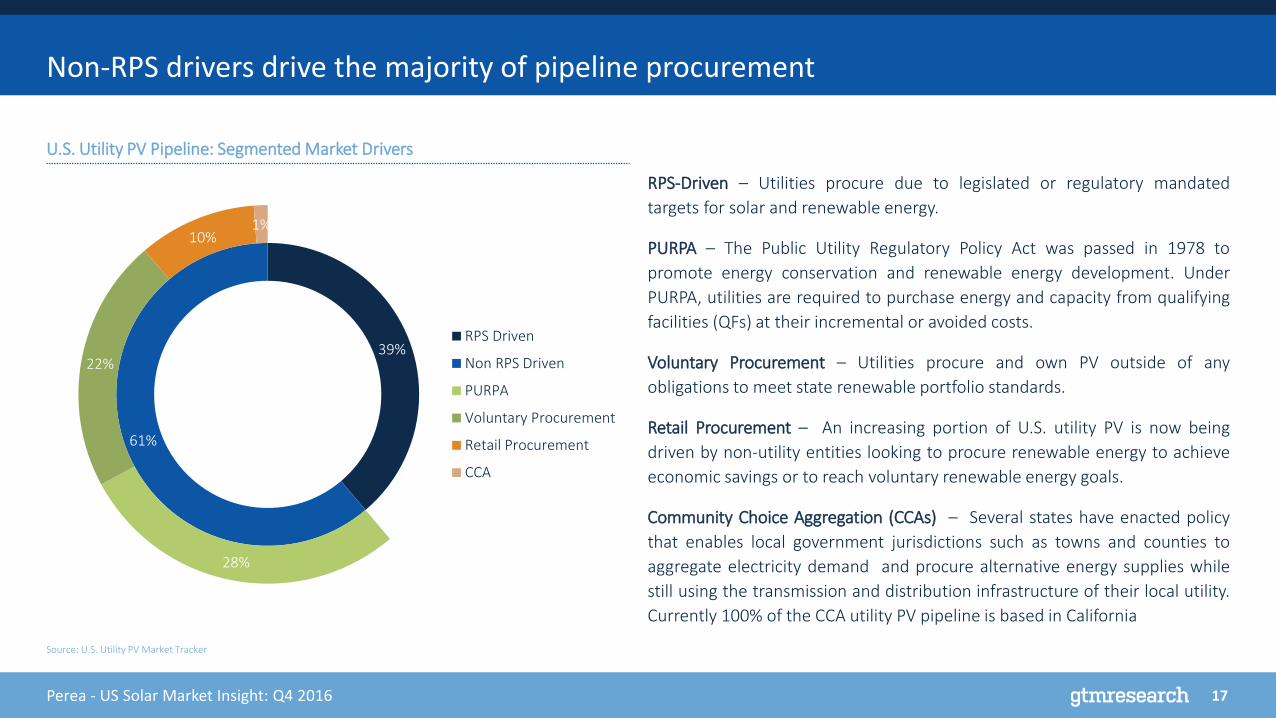
RPS-Driven – Utilities procure due to legislated or regulatory mandated
targets for solar and renewable energy.
PURPA – The Public Utility Regulatory Policy Act was passed in 1978 to
promote energy conservation and renewable energy development. Under
PURPA, utilities are required to purchase energy and capacity from qualifying
facilities (QFs) at their incremental or avoided costs.
Voluntary Procurement – Utilities procure and own PV outside of any
obligations to meet state renewable portfolio standards.
Retail Procurement – An increasing portion of U.S. utility PV is now being
driven by non-utility entities looking to procure renewable energy to achieve
economic savings or to reach voluntary renewable energy goals.
Community Choice Aggregation (CCAs) – Several states have enacted policy
that enables local government jurisdictions such as towns and counties to
aggregate electricity demand and procure alternative energy supplies while
still using the transmission and distribution infrastructure of their local utility.
Currently 100% of the CCA utility PV pipeline is based in California
Source: U.S. Utility PV Market Tracker
U.S. Utility PV Pipeline: Segmented Market Drivers
39%
61%
39%
28%
22%
10%1%
RPS Driven
Non RPS Driven
PURPA
Voluntary Procurement
Retail Procurement
CCA

18Perea - US Solar Market Insight: Q4 2016
• While renewable portfolio standards
will continue to drive a significant
volume of new utility PV capacity,
non-RPS drivers will spur the majority
of new solar development for the
next several years
• In 2017, PURPA driven projects in NC,
OR, and other states will represent
the single largest driver of new
capacity additions
• Pacific Gas & Electric and Southern
California Edison account for the
biggest decline in demand for RPS
driven utility PV. In 2015 and 2016,
the two utilities accounted for 52% of
all RPS driven demand in the US and
are not facing net shorts in RPS
demand until 2021 or later
RPS Steps Down as the Primary Driver of Utility PV
Source: U.S. Utility PV Market Tracker
Percent Share of Annual Installed Capacity by Primary Utility PV Driver
83% 85%
56%49%
39%
8% 5%
14%23%
21%
9%10%
23% 17%28%
5%10% 9%
1% 1% 1% 1%
0%
10%
20%
30%
40%
50%
60%
70%
80%
90%
100%
2013 2014 2015 2016 In Development
% C
apac
ity
of
Uti
lity
PV
Pri
mar
y D
rive
rs
RPS Voluntary Procurement PURPA Retail Procurement CCA

19Perea - US Solar Market Insight: Q4 2016
States With >50 MW Contracted, Non RPS Utility PV Pipeline as of Nov 2016
MT
WY
ID
WA
OR
NV
UTCA
AZ
ND
SD
NE
CO
NM
TX
OK
KS
AR
LA
MO
IA
MN
WI
IL IN
KY
TN
MS AL GA
FL
SC
NC
VAWV
OH
MI
NY
PA
MD
DE
NJ
CTRI
MA
ME
VT
NH
Non RPS Drivers
Voluntary
Procurement
PURPA
Wholesale
Retail
Procurement
CCAs
MD

20Perea - US Solar Market Insight: Q4 2016
• The top 5 states (NC, TX, OR, SC, UT)
represent 58% of non-RPS utility scale
solar in development.
• PURPA: Duke Energy is seeking approval
from the NC-Utility Commission to make
developers competitively bid to develop
PURPA projects and limit PURPA growth.
• Voluntary Procurement: 92% is
concentrated in the southeast, primarily in
states with no RPS.
• Retail Procurement: With direct access
legislation in place, CA represents 36% of
retail procurement. NV represents another
20%. Retail procurement has grown rapidly
in VA and several developers have
announced they are looking for corporate
offtakers in VA or PJM territory.
Top States for All non-RPS Projects
Source: U.S. Utility PV Market Tracker
Top State Markets for Utility PV Projects Outside of RPS Obligations in Development
0
500
1000
1500
2000
2500
NC TX OR SC UT CA GA VA FL NV MT AZ IN MS MD AllOther
U.S
. Uti
lity
PV
Cap
acit
y (M
Wd
c)
Voluntary Procurement PURPA Wholesale Retail Procurement CCA
21Perea - US Solar Market Insight: Q4 2016
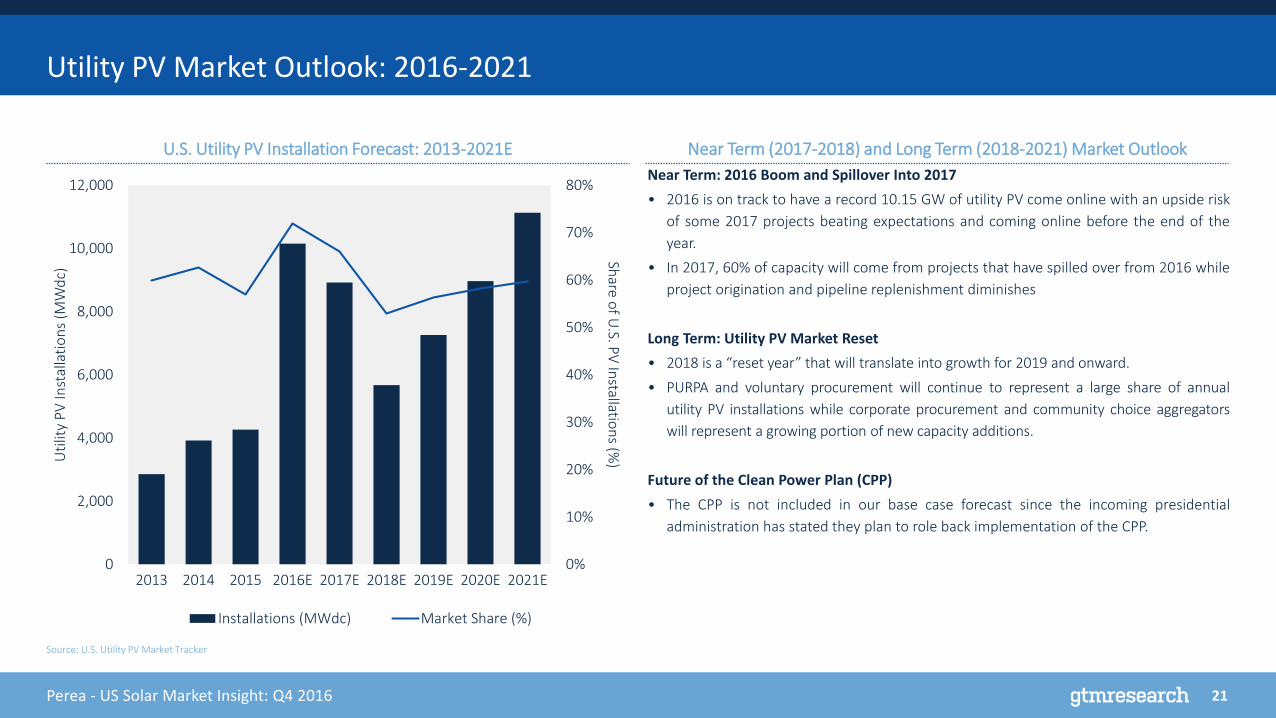
Near Term: 2016 Boom and Spillover Into 2017
• 2016 is on track to have a record 10.15 GW of utility PV come online with an upside risk
of some 2017 projects beating expectations and coming online before the end of the
year.
• In 2017, 60% of capacity will come from projects that have spilled over from 2016 while
project origination and pipeline replenishment diminishes
Long Term: Utility PV Market Reset
• 2018 is a “reset year” that will translate into growth for 2019 and onward.
• PURPA and voluntary procurement will continue to represent a large share of annual
utility PV installations while corporate procurement and community choice aggregators
will represent a growing portion of new capacity additions.
Future of the Clean Power Plan (CPP)
• The CPP is not included in our base case forecast since the incoming presidential
administration has stated they plan to role back implementation of the CPP.
Utility PV Market Outlook: 2016-2021
Source: U.S. Utility PV Market Tracker
U.S. Utility PV Installation Forecast: 2013-2021E
0%
10%
20%
30%
40%
50%
60%
70%
80%
0
2,000
4,000
6,000
8,000
10,000
12,000
2013 2014 2015 2016E 2017E 2018E 2019E 2020E 2021E
Share o
f U.S. P
V In
stallation
s (%)U
tilit
y P
V In
stal
lati
on
s (M
Wd
c)
Installations (MWdc) Market Share (%)
Near Term (2017-2018) and Long Term (2018-2021) Market Outlook

Perea - US Solar Market Insight: Q4 2016
Five Things to Keep in Mind in 20175.

23Perea - US Solar Market Insight: Q4 2016
California accounted for 42% of the residential market in Q3 – it’s lowest share since 2012
5 Things to Keep in Mind for 2017
Changes to net metering will continue to be a threat to DG economics in emerging and major states alike
The cost competitiveness of utility PV will continue to drive growth through the remainder of 2016 and
2017 as non-RPS drivers become a larger share of the pipeline
Emerging state markets are seeing unprecedented growth, but we remain cautiously optimistic due to
the susceptibility of incentive markets to boom-and-bust cycles
The future is bright for community solar with 2016 seeing the first signs of project completion - looking
forward we expect a growing portion of non-residential to be driven by community solar
1
2
3
4
5