U.S. Silver & Gold Corporate Presentation - February 2013
27
Low Risk, Low Capital, High Growth FEBRUARY 2013 TSX:USA OTCQX:USGIF
description
U.S. Silver & Gold Corporate Presentation - February 2013
Transcript of U.S. Silver & Gold Corporate Presentation - February 2013

Low Risk, Low Capital, High Growth
FEBRUARY 2013
TSX:USA
OTCQX:USGIF

Forward Looking Statement – Safe Harbour
Certain information in this presentation may contain forward-looking statements. This information is based on current
expectations that are subject to significant risks, assumptions and uncertainties that are difficult to predict. Potential risks
include: that U.S. Silver & Gold may not achieve anticipated synergies; loss of key personnel; reduction in the anticipated cash
levels; and, not achieving production goals stated. Actual results might differ materially from results suggested in any forward-
looking statements. All statements, other than statements of historical fact, included in the presentation, including, without
limitation, statements regarding potential mineralization and reserves, exploration results, and future plans and objectives of
U.S. Silver & Gold, are forward-looking statements. Words such as “expect”, “anticipate”, “estimate”, “may”, “will”, “should”,
“intend”, “believe” and other similar expressions are forward-looking statements. Forward-looking statements are not
guarantees of future results and conditions but rather reflect our current views with respect to future events and are subject to
risks, uncertainties, assumptions and other factors, and actual results and future events could differ materially from those
anticipated in such statements. There can be no assurance that such forward-looking statements will prove to be accurate.
U.S. Silver & Gold assume no obligation to update the forward-looking statements, or to update the reasons why actual results
could differ from those reflected in the forward looking-statements unless and until required by securities laws applicable to the
U.S. Silver & Gold. Additional information identifying risks and uncertainties is contained in filings by U.S. Silver & Gold with
the Canadian securities regulators, which filings are available at www.sedar.com.
An additional Cautionary Note to Investors – In the event that we use certain terms in this presentation, such as “resource”,
“measured resource”, “indicated resource” and “inferred resource”. U.S .investors are cautioned that, while such terms are
recognized and required by Canadian Securities Laws, the United States Securities and Exchange Commission does not
recognize them. Under U.S. standards, mineralization may not be classified as a “reserve” unless the determination has been
made that the mineralization could be economically and legally produced or extracted at the time the reserve determination
has been made. U.S. investors should not assume that all or any part of measured or indicated resources will ever be
converted into reserves. In addition, “inferred resources” have a great amount of uncertainty as to their existence and as to
whether they can be mined legally or economically. Accordingly, information concerning descriptions of mineralization in this
presentation may not be comparable to information made public by companies that are subject to the SEC’s Industry Guide 7.
Mr. Jim Atkinson, Vice President, Exploration and a Qualified Person under Canadian Securities Administrators guidelines has
approved the applicable contents of this presentation.
Please see SEDAR or www.us-silver.com for the 43-101 compliant Technical Report and Resource Estimate on the
Drumlummon Mine Project dated April 9, 2012 and the Galena Project dated March 19, 2012.
2
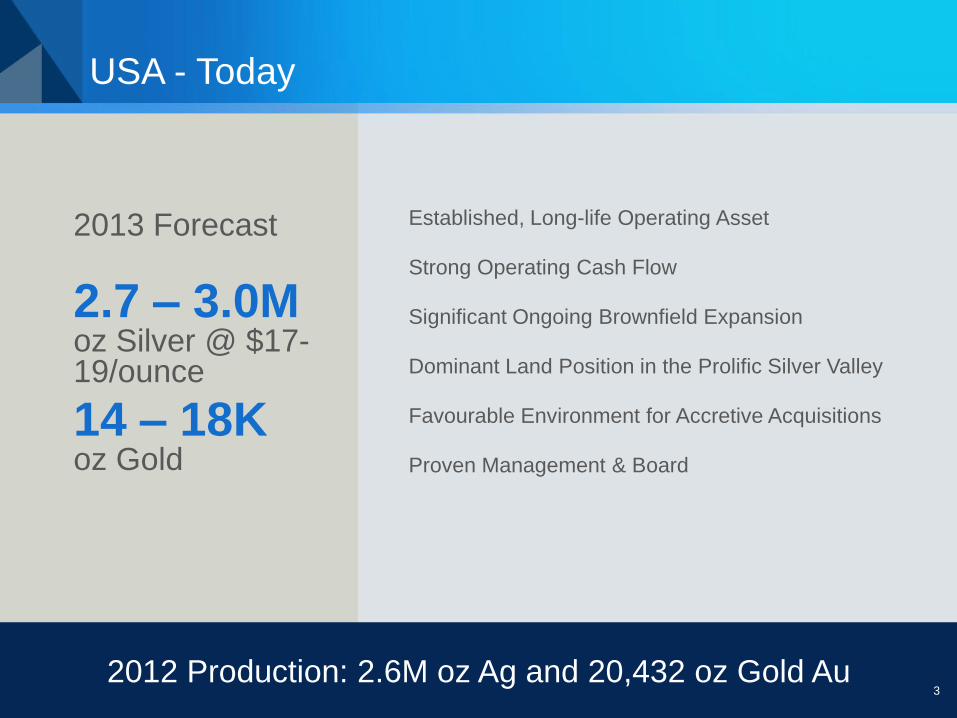
USA - Today
2012 Production: 2.6M oz Ag and 20,432 oz Gold Au
2.7 – 3.0M oz Silver @ $17-19/ounce
Established, Long-life Operating Asset
Strong Operating Cash Flow
Significant Ongoing Brownfield Expansion
Dominant Land Position in the Prolific Silver Valley
Favourable Environment for Accretive Acquisitions
Proven Management & Board
14 – 18K oz Gold
3
2013 Forecast

Darren Blasutti
President and CEO, Director
• Former SVP Corporate Development and Investor Relations for Barrick Gold, reported to President and CEO
• Led Barrick's strategic development for over 13 years executing over 25 gold mining transactions including Sutton Resources,
Homestake Mining, Placer Dome, consolidation of the Cortez property from Rio Tinto
• Responsible for creation of Barrick Energy to hedge Barrick’s exposure to energy prices
Robert Taylor
COO
• Over 40 years of experience in operations, management, engineering, and exploration for underground and open-pit mines
• Most recently VP and President North American Operations for Kinross Gold where he was responsible for all operations
and exploration
• Former VP, Mine Operations at Stillwater Mining in Montana
Warren Varga
CFO
• Over 17 years of progressive financial leadership experience and brings extensive senior management expertise
• Most recently Senior Director, Corporate Development at Barrick Gold Corporation and former CFO of RX Gold & Silver Inc.
• Member of the Canadian Institute of Chartered Accountants and the Chartered Financial Analyst Institute
Steve Long
SVP, Operations
• Over 35 years experience in mine engineering and management
• Senior manager for underground mining operations for Newmont Mining Corporation, Barrick Gold, Echo Bay and
Homestake Mining
Jim Atkinson
VP, Exploration
• Licensed Professional Geologist, over 40 years of experience in exploration geology
• Completed more than a dozen exploration programs across North America
Daren Dell
VP, Technical Services
• Over 20 years experience and brings extensive knowledge gained from evaluating mining assets around the globe
• Formerly Director, Corporate Development and Director, Technical Evaluations at Barrick Gold. Prior to joining Barrick Gold,
Mr. Dell was at Placer Dome for 15 years
Peter McRae
VP, General Counsel
• Most recently VP Corporate Counsel of RX Gold & Silver Inc. and in private practice at Weil, Gotshal & Manges LLP, a major
international law firm based in NY with extensive experience on general corporate, securities law, and governance matters
• Private practice focused on representing private equity funds, public and private companies in connection with complex commercial
transactions including acquisitions, dispositions, minority investments, financings, joint ventures, and restructurings.
Management Team: Experienced + Proven
4

Board of Directors
Gordon Pridham
Chairman
• Over 30 years of experience as a global finance executive
• Serves on the public company boards of Newalta Corporation and Titanium Corporation, where he is Chairman of the Board
Hugh Agro
Director
• Retired in 2009 as EVP Strategic Development at Kinross Gold, where he oversaw corporate development and exploration
• Held senior positions with Placer Dome Canada and Deustche Bank
John Brock
Director
• Geologist with 40 years experience as an executive for 20 public junior exploration companies. CEO of Pacific Ridge Exploration
• Participated in 12 major mineral deposit discoveries in north and western Canada, Nevada, Mexico, and Ecuador
Alex Davidson
Director
• Retired in 2009 as EVP Exploration and Corporate Development at Barrick Gold
• 2005 AO Dufresue Award to recognize exceptional achievement and distinguished contribution to mining exploration in Canada
• In 2003 was named Prospector of the Year by PDAC for discovery of Alto Chicama in Peru
Louis Dionne
Director
• Former Senior Vice President Underground Operations at Barrick Gold
• Currently a director of Detour Gold Corporation and Aurizon Mining Ltd.
Alan Edwards
Director
• Board of directors for AuRico Gold Inc., Entrée Gold Inc., Copper One Inc., Oracle Mining Corp. and AQM Copper Inc. (Chairman)
• Senior management positions with Frontera Copper, Apex Silver Mines, Kinross, Cyprus Amax and Phelps Dodge
Tom Ryley
Director
• Board of directors for Newalta Corporation, Tribute Resources and Benefuel Inc., where he is Chairman of the Board
• Former Executive Vice President of Suncor Energy, where he worked for 25 years in a variety of roles
Lorie Waisberg
Director
• Former Senior Partner at Goodmans LLP and EVP, Finance and Administration of Co-Steel Inc.
• Accredited with Institute of Corporate Directors and sits on Boards of Tembec and Chemtrade Logistics Inc
Darren Blasutti
Director
• President and CEO
5

Asset Overview

Asset Overview
7 Close Proximity Provides Synergies
Galena Complex – 100%
• High grade Cu-Ag and Pb-Ag
• Produced over 240 M oz Ag historically
• Over 23 M oz Ag in “Proven and Probable”
Reserves and 12 M oz Ag in “Measured and
Indicated” Resources*
• Galena area operating
• Coeur area now operating
• Caladay Zone being assessed for high
grade conventional mining and bulk mining
potential
• Excess hoisting and milling capacity
Drumlummon Mine – 100%
• High grade Au and Ag
• Produced over 1 M oz Au and 12 M oz Ag
• Extensive mining infrastructure
• Recently acquired adjacent Belmont mine
• Evaluating milling of ore at Galena Complex
7
*Descriptions of our mineral deposits are not comparable to similar information reported by U.S. companies which are subject to the
reporting and disclosure requirements under the United States federal securities laws and the rules and regulations thereunder.
** See www.fraserinstitute.org for details.
Galena Complex located in mining friendly Idaho • Ranked 5th in the US by The Fraser Institute in 2011/2012**
• Supportive local communities
• Established mining state
• Experienced knowledgeable workforce
* Descriptions of our mineral deposits are not comparable to similar information reported by
U.S. companies which are subject to the reporting and disclosure requirements under the
United States federal securities laws and the rules and regulations thereunder. See www.us-
silver.com for NI 43-101 Technical Report.

Galena Complex
8
Galena and Coeur Areas
• Galena 2012 production of 2.25M oz Ag @ ~$20/ounce from 25 production stopes
• Productivity improvements being realized with adoption of new 24/7 shift
schedule
• Q4 silver production of 625,600 under new management
• 2013 production increasing by 10% and reducing cash costs by 10-15%
• Coeur re-development started February 2012 with small production in late 2012
• $5 million budgeted in 2012
• Forecast of 125,000 oz Ag in 2013 with 500,000 oz Ag by 2016
• Current M&I resource is 3.3 million oz Ag*
• Drilling underway targeting 6.0 million oz by end of 2014
• Two separate mills with combined total 1,500 tons/day capacity, currently operating at
50%-60%
• Mill recovery rates of 96% for silver-copper and 92% for silver-lead ores
• Continued exploration success and mine life extension at Silver Vein, Caladay Zone
and 350-370 Veins
• Expect to replace silver reserves and significantly increase silver resources in
February or March 2013.
• Discovery of 350-370 vein system and Caladay expected to allow for ramp-up to
1,500 tons over next 3-4 years with modest capital outlays
* See www.us-silver.com for NI 43-101 Technical Report
Large Reserve and Resource Base
2nd largest
Primary silver
producer in
the U.S.
8

Galena Complex – Long Section
Western
Coeur Mine
Deep
Coeur Mine Deep
Silver
Vein
Caladay
Silver-Lead
Zone
Galena
Targets
Opportunities for Significant Brownfield Expansion
Controlled by US Silver & Gold

Galena Complex
10 Supports Lower Cost Mining Techniques
Caladay Zone
• Semi-continuous mineralized zone extending from Galena into Caladay Mine at depth
• Currently 2,800-3,000 vertical feet with estimated strike length of 1,200-3,600
feet and apparent widths of 200-400 feet
• Mineralization comprises broad areas of Ag and Pb containing both higher and lower
grade areas
• Global grades of 3-4 oz/ton Ag and 3-5% Pb
• Higher grades are 30-40 % with continuous widths of 15-30 feet ranging from
5-15 oz/ton Ag and 5-15% Pb
• Global tonnage target of 60-70 million tons and potential silver resource of 150-200
million ounces based on over 800 drill holes
• Area is expected to support lower cost bulk mining methods
• High grade silver copper areas discovered within the broader Caladay Zone are
currently being evaluated and drilled
• Test mining in recently identified high grade areas adjacent to infrastructure at 4900
level will commence in H2 2013
• A preliminary plan will be communicated first half of Q1 2013
• Phase 1 – “Fill the Mill” with high grade areas close to infrastructure
• Phase 2 – Caladay shaft expansion using bulk mining techniques .
10
Caladay Zone
targeting
initial
production in
2014
* Some of the potential quantities and grades disclosed in this presentation are
conceptual in nature. At the current stage of exploration, there is insufficient
drilling to determine the extent of continuity of the mineralization required to
define a mineral resource for all mineralization at the Galena Mine Complex and
Drumlummon Mine. It is uncertain if further exploration will result in certain
exploration targets being delineated as a mineral resource

Caladay Zone (Illustrative View)
New High Grade Ag-Cu Discovery

Caladay Zone - 4900 Level Plan of Mineralization
Close Proximity to Existing Mine Infrastructure

Galena Complex Operating Goals
13 5.0 M oz Ag by end of 2015
Focus 2013 and LOM plan on high-grade profitable ounces
versus arbitrary ounce targets
Increase 2013 productivity at the Galena Complex by moving
to a 24/7 shift schedule and enact labour and processing cost
reductions
Evaluate milling of high gold and silver ore from the
Drumlummon site at Galena Complex in early 2013
Coeur area re-started and ramping up to full production by end
of 2015
“Fill the mill” strategy starting in 2014
Prepare preliminary analysis of the Caladay Zone bulk mining
expansion case
13
Low risk,
low capital,
high growth

Drumlummon Mine
14
• 2012 production of 20,070 oz Au and 316,194 oz Ag
• Mill recoveries averaged ~ 91% for Au and 84% for Ag
• Evaluating options to process Drumlummon ore in Idaho starting in early 2013 to achieve expected
processing synergies
• All current required permits in place under small miners exemption. In process of renewing appropriate
water discharge permit.
• 2012 exploration success at the Frankie Vein, the Northstar Vein, Sampson and Pixley areas of the
Drumlummon Vein and the New Years Vein
• Recently acquired Belmont Mine being reviewed for development late 2013, drilling commenced in Q4 2012
including
• 3.5 feet of 0.50 oz/ton Au and 3.8 oz/ton Ag
• 8.0 feet of 0.47 oz/ton Au and 0.9 oz/ton Ag
• 3.0 feet of 2.67 oz/ton Au and 7.4 oz/ton Ag
* See November 28th press release for more details and www.us-silver.com for complete drill results.
14 High Grade Gold & Silver Production

Strategic Objectives

Strategic Objectives
16 Grow earnings and cash flow per share
Execute on operational improvements and
brownfield expansions
Secure line of credit to support brownfield
initiatives
Assess exploration, processing and capital
synergies with geographically focused assets
Assess accretive per share acquisition opportunities in North America
1
2
3
4
16
Roadmap For
Success
Exceed 5.0 M oz Ag by end of 2015:

Share Price Performance & Capital Structure
17
Symbol: USA-T
Recent Price*: $1.67
Market Cap (CDN): $100.2 M
Cash Balance: $19.0M
Debt: $7.9M
Shares Basic: 60 M
Options : 5.7 M
Warrants: 2.0 M
Fully Diluted: 67.7 M
*As of Feb. 19, 2013
Vo
lum
e (
TS
X &
OT
CQ
X)
Sh
are
Price
0
200,000
400,000
600,000
800,000
1,000,000
1,200,000
1,400,000
1,600,000
$0.00
$0.50
$1.00
$1.50
$2.00
$2.50
$3.00
8/15/2012 9/15/2012 10/15/2012 11/15/2012 12/15/2012 1/15/2013

EV / M&I Resources* EV / 2013E EBITDA*
Junior Silver Producer Multiples
18 Undervalued Relative To Peers
EV
/ M
&I R
eso
urc
es (
US
$/o
z A
gE
q)
EV
/ 2
013E
EB
ITD
A
*As of February 8, 2012 based on Cormark Securities Estimates
Market data and other statistical information used in this presentation may be based on independent industry publications, government publications, reports by market research firms,
or other published independent sources. Some data is also based on U.S. Silver & Gold’s good faith estimates that are derived from its review of internal data and information, as well
as the sources listed above. Although U.S. Silver & Gold believes these sources are reliable, U.S. Silver & Gold has not independently verified the information and cannot guarantee
its accuracy or completeness.
10.14x
7.24x
6.26x
5.63x
4.81x
2.63x 2.11x
$0.00
$2.00
$4.00
$6.00
$8.00
$10.00
$12.00
SPM FR FVI HL EDR SVM USA
Average: 6.12x
$5.82
$5.45
$4.57
$3.19
$2.71
$2.31
$1.76
$0.00
$1.00
$2.00
$3.00
$4.00
$5.00
$6.00
$7.00
FR FVI EDR USA HL SVM SPM
Average: $3.77

$0
$150
$300
$450
$600
$750
0.0 1.0 2.0 3.0 4.0 5.0 6.0 7.0 8.0 9.0 10.0 11.0
Ente
rpri
se V
alu
e(U
S$ M
M)
2013 Production Guidance (MM oz Ag Eq.)
Mid-Tier Silver Producers
EDR
SVMFVI
U.S. Silver & GoldEXN SPM
Attractively Positioned Among Peers
Re-Rating Potential
Companies Included: FVI – Fortuna Silver Mines Inc.; SVM – Silvercorp Metals Corp.; EDR – Endeavour Silver Corp.; EXN –Excellon Resources Inc.; SPM – Scorpio Mining Corp.
1Research consensus 2Enterprise Value is calculated on a fully-diluted ITM basis 3Silver equivalent based on Cormark research 2013 metal prices of US$1,800/oz Au, US$35.00/oz Ag, US$0.90/lb Pb, US$0.95/lb Zn and US$4.00/lb Cu
U.S. Silver & Gold is attractively positioned amongst its mid-tier
silver producer peers and could experience a significant re-rating
19
(1)
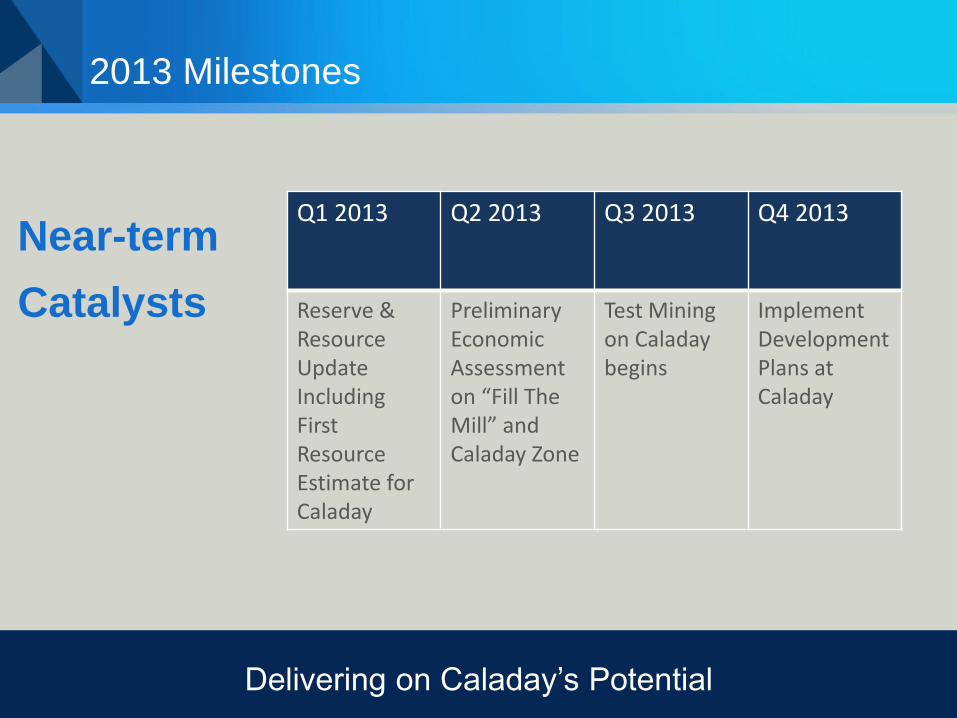
2013 Milestones
Q1 2013 Q2 2013 Q3 2013 Q4 2013
Reserve & Resource Update Including First Resource Estimate for Caladay
Preliminary Economic Assessment on “Fill The Mill” and Caladay Zone
Test Mining on Caladay begins
Implement Development Plans at Caladay
Near-term
Catalysts
Delivering on Caladay’s Potential

Why U.S. Silver & Gold?
Executing on
operational
improvements and
low risk brownfield
expansion
100% owned, royalty free
Fully permitted
Near existing infrastructure
Excess capacity
Increasing production and reducing costs
Experienced management team
Catalysts in place for improved valuation
Focused on Unlocking Value 21

Appendix

Galena Complex Long Section
Galena
Shaft
Caladay
Shaft
Coeur
Shaft
2400
Sea Level
3700
5500
Callahan
Shaft
4900
2800 3000
3400
1200
Silver
Vein
5200
4600
4300
4000
Ag - Pb Veins Ag - Cu Veins Major Production Areas 0 2500
feet
No. 3 Shaft

Galena Caladay Silver-Lead Zone
(Illustrative View)
3000 Level
4000 Level
5500 Level
No. 3
Shaft
Galena
Shaft
0 1000
feet
Silver
Vein
Caladay Silver-
Lead Zone
Caladay
Shaft

Drumlummon Vein Long Section (Looking Northwest)
South
Drumlummon
Zone
1600 Level
1400
1200
1000 Level
800
400 Level
1.5+
1.00 - 1.49
0.50 - 0.99
0.20 - 0.49
No significant intersection
Grade x Thickness (oz.ft)
Decline
0 1000
feet
Nine-Hour
Workings
#1 Shaft #2 Shaft
A/B Block
A
B
C
D
Jubilee
Sampson
Pixley 1
Pixley 4
Ore Shoots
A
B
C
D
Existing workings
Ore shoots
Drilling station
Mined stopes
D Block
OPEN
OPEN
Drilled (assays pending)
Jubilee Deep
Target Area
Pixley Deep
Target Area #1 South Deep
Target Area

Belmont Long Section
200 Level
300 Level
400 Level
600 Level
750 Level
2 1
Zone 1
19,000T @
0.81 oz/ton Au
2.66 oz/ton Ag Zone 2
32,300T @
0.42 oz/ton Au
1.45 oz/ton Ag
250
feet
0
*
* *
*
Phase 1 proposed drilling
Phase 2 proposed drilling
Possible Ore
Existing Workings
Historical Mineralization
Mined Out
*
(1) Note that these are historical estimates that are not NI43-101 compliant.
A qualified person has not done sufficient work to classify this historical estimate
as current mineral resources or mineral reserves.
(1)