US Photovoltaic Prices and Cost Breakdowns: Q1 2015 Benchmarks
51
NREL is a national laboratory of the U.S. Department of Energy Office of Energy Efficiency & Renewable Energy Operated by the Alliance for Sustainable Energy, LLC This report is available at no cost from the National Renewable Energy Laboratory (NREL) at www.nrel.gov/publications. Contract No. DE-AC36-08GO28308 U.S. Photovoltaic Prices and Cost Breakdowns: Q1 2015 Benchmarks for Residential, Commercial, and Utility-Scale Systems Donald Chung, Carolyn Davidson, Ran Fu, Kristen Ardani, and Robert Margolis National Renewable Energy Laboratory Technical Report NREL/TP-6A20-64746 September 2015
Transcript of US Photovoltaic Prices and Cost Breakdowns: Q1 2015 Benchmarks

NREL is a national laboratory of the U.S. Department of Energy Office of Energy Efficiency & Renewable Energy Operated by the Alliance for Sustainable Energy, LLC This report is available at no cost from the National Renewable Energy Laboratory (NREL) at www.nrel.gov/publications.
Contract No. DE-AC36-08GO28308
U.S. Photovoltaic Prices and Cost Breakdowns: Q1 2015 Benchmarks for Residential, Commercial, and Utility-Scale Systems Donald Chung, Carolyn Davidson, Ran Fu, Kristen Ardani, and Robert Margolis National Renewable Energy Laboratory
Technical Report NREL/TP-6A20-64746 September 2015

NREL is a national laboratory of the U.S. Department of Energy Office of Energy Efficiency & Renewable Energy Operated by the Alliance for Sustainable Energy, LLC This report is available at no cost from the National Renewable Energy Laboratory (NREL) at www.nrel.gov/publications.
Contract No. DE-AC36-08GO28308
National Renewable Energy Laboratory 15013 Denver West Parkway Golden, CO 80401 303-275-3000 • www.nrel.gov
U.S. Photovoltaic Prices and Cost Breakdowns: Q1 2015 Benchmarks for Residential, Commercial, and Utility-Scale Systems Donald Chung, Carolyn Davidson, Ran Fu, Kristen Ardani, and Robert Margolis National Renewable Energy Laboratory
Prepared under Task No. SS13.6510
Technical Report NREL/TP-6A20-64746 September 2015

NOTICE
This report was prepared as an account of work sponsored by an agency of the United States government. Neither the United States government nor any agency thereof, nor any of their employees, makes any warranty, express or implied, or assumes any legal liability or responsibility for the accuracy, completeness, or usefulness of any information, apparatus, product, or process disclosed, or represents that its use would not infringe privately owned rights. Reference herein to any specific commercial product, process, or service by trade name, trademark, manufacturer, or otherwise does not necessarily constitute or imply its endorsement, recommendation, or favoring by the United States government or any agency thereof. The views and opinions of authors expressed herein do not necessarily state or reflect those of the United States government or any agency thereof.
This report is available at no cost from the National Renewable Energy Laboratory (NREL) at www.nrel.gov/publications.
Available electronically at SciTech Connect http:/www.osti.gov/scitech
Available for a processing fee to U.S. Department of Energy and its contractors, in paper, from:
U.S. Department of Energy Office of Scientific and Technical Information P.O. Box 62 Oak Ridge, TN 37831-0062 OSTI http://www.osti.gov Phone: 865.576.8401 Fax: 865.576.5728 Email: [email protected]
Available for sale to the public, in paper, from:
U.S. Department of Commerce National Technical Information Service 5301 Shawnee Road Alexandria, VA 22312 NTIS http://www.ntis.gov Phone: 800.553.6847 or 703.605.6000 Fax: 703.605.6900 Email: [email protected]
Cover Photos by Dennis Schroeder: (left to right) NREL 26173, NREL 18302, NREL 19758, NREL 29642, NREL 19795.
NREL prints on paper that contains recycled content.

iii
This report is available at no cost from the National Renewable Energy Laboratory (NREL) at www.nrel.gov/publications.
Acknowledgments The authors would like to thank the following individuals and organizations for their contributions to and review of this work: Cary Hayes; Benny Faraone; Dan Moss; John Marcarelli; Anthony Fotopoulos; Don Massa; Mike August; Galen Barbose; and Joachim Seel. This work was supported by the U.S. Department of Energy under contract number DE-AC36-08GO28308.

iv
This report is available at no cost from the National Renewable Energy Laboratory (NREL) at www.nrel.gov/publications.
List of Acronyms AC alternating current AHJ authority having jurisdiction BLS U.S. Bureau of Labor Statistics BNEF Bloomberg New Energy Finance BOS balance of system CAGR compound annual growth rate c-Si crystalline silicon DC direct current DDP delivery duty paid DSIRE Database of State Incentives for Renewables & Efficiency EPC engineering, procurement, and construction G&A general and administrative ITC investment tax credit kWac kilowatts alternating current LCOE levelized cost of energy NEC National Electric Code NREL National Renewable Energy Laboratory PII permitting, inspection, and interconnection PV photovoltaic Q quarter SEC U.S. Securities and Exchange Commission SG&A selling, general, and administrative TPO third-party ownership Vdc Volts direct current Wac Watts alternating current Wdc Watts direct current

v
This report is available at no cost from the National Renewable Energy Laboratory (NREL) at www.nrel.gov/publications.
Executive Summary This report benchmarks installed prices of U.S. solar photovoltaic (PV) for systems built in the first quarter of 2015 (Q1 2015), and it is the first in an intended series of annual benchmarking reports covering residential-, commercial-, and utility-scale systems. Our methodology includes bottom-up accounting for all system and project-development costs incurred when installing residential-, commercial-, and utility-scale systems, and it models the cash purchase price for such systems. In general, we attempt to model best-in-class installation techniques and business operations from an installed cost perspective, and our benchmarks are national averages of installed capacities, weighted by state. The residential benchmark is further averaged across installer and integrator business models, weighted by market share. All benchmarks assume non-union construction labor. Benchmarked system prices are presented in Figure ES-1.
Figure ES-1. Benchmark price summary
The residential and commercial benchmarks represent rooftop systems, with residential systems modeled as pitched-roof installations and commercial systems modeled as ballasted flat-roof installations. The utility benchmarks represent ground-mounted, fixed-tilt and single-axis tracking systems.
The hardware category includes modules, inverters, racking, and all balance-of-system (BOS) hardware required for a complete system. The soft costs-other category includes all non-hardware and non-installation-labor costs, primarily overhead and customer acquisition in the residential model and EPC (engineering, procurement, and construction) overhead/profit and development costs in the commercial- and utility-scale models.
$1.40 $1.25 $1.17 $1.23
$0.33 $0.19 $0.19 $0.20
$1.36
$0.72 $0.41 $0.48
$3.09
$2.15
$1.77 $1.91
$0.00
$0.50
$1.00
$1.50
$2.00
$2.50
$3.00
Residential, 5-kW Commercial, 200-kW Utility, Fixed 100-MW Utility, Single-Axis100-MW
Benc
hmar
k Pr
ice
(201
5 $/
W)
Benchmarked Prices and Price Breakdowns
Soft costs - otherSoft costs - installation laborHardware (module, inverter, rack, BOS)
45%
11%
44%
Residential
58% 9%
33%
Commercial
66% 11%
23%
Utility, Fixed
64% 11%
25%
Utility, Single-Axis

vi
This report is available at no cost from the National Renewable Energy Laboratory (NREL) at www.nrel.gov/publications.
Economies of scale are evident in hardware and installation costs across the segment benchmarks (i.e., each benchmark represents progressively larger systems) as well as within the commercial and utility segment systems. Soft costs—which include the installation labor and other categories—constitute the highest portion of system price in residential-scale systems and smaller shares of commercial- and utility-scale system prices. While this is due in part to the larger system sizes in the commercial- and utility-scale models, market segment specifics such as disaggregation of customers (in residential and commercial) and the non-standardized nature of contract documents (in commercial) also contribute to higher soft costs in the residential- and commercial-scale models.
Benchmark prices are down in comparison to Q4 2013 results, with price reductions primarily coming from lower equipment prices and compressed margins. Reductions in the commercial-scale benchmark also reflect changes in our conceptual system design and a change in how we approach modeling profit—we now exclude development profit above total cost coverage, reflecting a project price that results in a developer net income of zero. This change is adopted owing to the wide variation in developer profits in the commercial segment, where project pricing is highly dependent on region and project specifics that are not adequately represented with a simple average markup. Similarly, this approach has been used in our utility price benchmarks since 2013. Price changes from previous benchmark reports are presented in Table ES-1. The rate of price and cost reductions has slowed compared to annually benchmarked prices from previous reports spanning back to Q4 2009, mirroring the reduced rate of cost reductions in equipment, especially PV modules.
Table ES-1. Price Changes from Q4 2013 Benchmarks
Benchmark Q4 2013 (2015 $/Wdc)
Q1 2015 (2015 $/Wdc)
Change
Residential-scale benchmark $3.31 $3.09 -7%
Commercial-scale benchmark $2.41a $2.16 -10%
Utility-scale benchmark $1.81 $1.77 -2% a Adjusted to match updated methodology

vii
This report is available at no cost from the National Renewable Energy Laboratory (NREL) at www.nrel.gov/publications.
Table of Contents 1 Introduction ........................................................................................................................................... 1
1.1 U.S. PV Markets ............................................................................................................................ 1 1.2 U.S. Market Hardware Costs ......................................................................................................... 2
2 Methodology ......................................................................................................................................... 4 3 Residential-Scale System Benchmark ............................................................................................... 5
3.1 Residential Market Characteristics ................................................................................................ 5 3.2 Residential-Scale System Benchmark ........................................................................................... 6
3.2.1 Residential-Scale System Benchmark Result ................................................................... 6 3.2.2 Model Changes and Adjustments from Previous Benchmark .......................................... 9 3.2.3 Regional Variations in Price ............................................................................................ 9 3.2.4 Benchmark Comparison to Other Sources ..................................................................... 10 3.2.5 Benchmark Trends Over Time ....................................................................................... 11
3.3 Key Developments and Trends ................................................................................................... 12 3.3.1 Inverter Trends ............................................................................................................... 12 3.3.2 Racking Trends .............................................................................................................. 13 3.3.3 Residential Segment Soft Costs ..................................................................................... 13
4 Commercial-Scale System Benchmark ............................................................................................ 17 4.1 Commercial Market Characteristics ............................................................................................ 17 4.2 Commercial-Scale System Benchmark ....................................................................................... 18
4.2.1 Commercial-Scale System Benchmark Result ............................................................... 19 4.2.2 Model Changes and Adjustments from Previous Benchmark ........................................ 21 4.2.3 Regional Variations in Price .......................................................................................... 22 4.2.4 Benchmark Comparison to Other Sources ..................................................................... 23 4.2.5 Benchmark Trends Over Time ....................................................................................... 23
4.3 Key Developments and Trends ................................................................................................... 24 4.3.1 Inverter and Module Trends ........................................................................................... 24 4.3.2 Effects of System Size and Labor Type on System Prices ............................................. 25 4.3.3 Developer Equipment Purchases to Avoid EPC Markups ............................................. 26 4.3.4 Effect of Annual Sales Volumes on Development Costs ............................................... 26
5 Utility-Scale System Benchmark ....................................................................................................... 27 5.1 Utility Market Characteristics ..................................................................................................... 27 5.2 Utility-Scale System Benchmark ................................................................................................ 28
5.2.1 Utility-Scale System Benchmark Result ........................................................................ 29 5.2.2 Regional Variations in Price .......................................................................................... 31 5.2.3 Benchmark Comparison to Other Sources ..................................................................... 32 5.2.4 Benchmark Trends Over Time ....................................................................................... 32
5.3 Key Trends and Developments ................................................................................................... 33 5.3.1 Fixed-Tilt vs. Single-Axis-Tracking Mounting Systems ............................................... 33 5.3.2 Utility-Scale System Soft Costs ..................................................................................... 34 5.3.3 Developer Hardware Purchases to Avoid EPC Markups ............................................... 34 5.3.4 Effects of System Size and Labor Type on System Prices ............................................. 35
6 Summary ............................................................................................................................................. 36 6.1 Overall Benchmark Prices ........................................................................................................... 36 6.2 Price Trends and Drivers ............................................................................................................. 36
6.2.1 Labor .............................................................................................................................. 36 6.2.2 Other Soft Costs ............................................................................................................. 36 6.2.3 Scale ............................................................................................................................... 36 6.2.4 Technical Trends ............................................................................................................ 37
References ................................................................................................................................................. 38 Appendix: Residential Racking Prices ................................................................................................... 41

viii
This report is available at no cost from the National Renewable Energy Laboratory (NREL) at www.nrel.gov/publications.
List of Figures Figure ES-1. Benchmark price summary ...................................................................................................... v Figure 1. U.S. PV market growth and growth forecast ................................................................................. 2 Figure 2. Annual residential PV market segment installed capacity by state, 2010–2014 (GTM Research
and SEIA 2015) ........................................................................................................................ 5 Figure 3. Residential PV system model schematic ....................................................................................... 6 Figure 4. NREL modeled residential rooftop PV system prices (nationwide average, 5.2 kW) .................. 7 Figure 5. Regional variations in residential-scale PV system price (5.2-kW system) .................................. 9 Figure 6. Comparison of residential system costs (excludes profit) ........................................................... 10 Figure 7. Comparison of residential system prices ..................................................................................... 11 Figure 8. NREL benchmark residential installed prices, Q4 2009-Q1 2015 .............................................. 12 Figure 9. Publicly reported integrator customer-acquisition costs compared with NREL integrator
customer-acquisition cost estimate ........................................................................................ 14 Figure 10. Publicly reported integrator overhead costs compared with NREL integrator overhead cost
estimate .................................................................................................................................. 16 Figure 11. Annual commercial PV market segment installed capacity by state, 2010–2014 (GTM
Research and SEIA 2015) ...................................................................................................... 17 Figure 12. Schematic of commercial system model ................................................................................... 18 Figure 13. Modeled commercial PV system price (national weighted average, 200 kW) .......................... 19 Figure 14. Regional variations in commercial-scale PV system price ........................................................ 22 Figure 15. Comparison of commercial system prices ................................................................................. 23 Figure 16. NREL benchmark commercial installed prices, Q4 2009–Q1 2015 ......................................... 24 Figure 17. Commercial-scale system EPC economies of scale .................................................................. 25 Figure 18. Development cost per watt as a function of annual commercial project volume ...................... 26 Figure 19. Annual utility PV market segment installed capacity by state, 2010–2014 .............................. 27 Figure 20. Schematic of utility system model ............................................................................................. 28 Figure 21. Modeled utility-scale PV system prices (national weighted average, 100 MW) ....................... 29 Figure 22. Regional variations in utility-scale PV system price, 100-MW fixed-tilt systems using non-
union labor ............................................................................................................................. 31 Figure 23. Comparison of utility-scale system EPC prices (10-MW systems in California) ..................... 32 Figure 24. NREL benchmark utility-scale installed prices (fixed-tilt systems), Q4 2009–Q1 2015 .......... 33 Figure 25. Effects of scale and labor type on modeled utility-scale system price ...................................... 35 Figure A-1. Change in per-watt rail cost compared with 2012 baseline ..................................................... 42
List of Tables Table ES-1. Price Changes from Q4 2013 Benchmarks .............................................................................. vi Table 1. Key Residential Modeling Assumptions ........................................................................................ 7 Table 2. Key Commercial Modeling Assumptions ..................................................................................... 20 Table 3. Key Utility Modeling Assumptions .............................................................................................. 30 Table 4. 100-MW Fixed-Tilt System vs. Single-Axis-Tracking Systems .................................................. 34

1
This report is available at no cost from the National Renewable Energy Laboratory (NREL) at www.nrel.gov/publications.
1 Introduction This report benchmarks the first quarter (Q1) 2015 installed cash purchase price for U.S. solar photovoltaic (PV) systems using a bottom-up cost-analysis methodology. It updates previous work by Goodrich et al. (2012), Davidson et al. (2014), Feldman et al. (2014), and Fu et al. (forthcoming). The report documents modeled cash purchase prices for systems constructed in Q1 2015. System types modeled include rooftop systems in the residential and commercial market segments, as well as ground-mounted systems (fixed and single-axis tracking) in the utility market segment.1
Our bottom-up methodology is consistent with previous National Renewable Energy Laboratory (NREL) work, and it is distinguished from most market research products that focus on system prices as reported to utility and other solar incentive program databases. Reported pricing and fair market values are typically not derived on a cost-plus basis and thus can be strongly influenced by market factors unrelated to installation costs. By instead providing insight into system installed costs and cost drivers as well as price, our approach enables tracking of industry progress in reducing costs over time. It also allows for the identification and assessment of impactful technological improvements and research and development efforts.
The remainder of this introduction summarizes broad market trends to provide context for our benchmarking results. Section 2 describes our benchmarking methodology. The next three sections present and discuss cost and price results for the residential market segment (Section 3), commercial market segment, (Section 4), and utility market segment (Section 5). Section 6 summarizes the results and offers conclusions.
1.1 U.S. PV Markets Installed U.S. PV capacity grew at a 76% compound annual growth rate (CAGR) between 2010 and 2014 (Figure 1). While this was driven disproportionately by growth in the utility segment—which experienced an 82% CAGR from 2010 to 2014—the residential and commercial segments also grew robustly, at CAGRs of 45% and 44%, respectively, over the same period (GTM Research and SEIA 2015, BNEF 2014, Deutsche Bank 2015). Despite generally declining incentives nationwide, rapid declines in equipment costs, system installation prices, and investor return expectations have helped sustain this growth.
1 Previous NREL benchmarks focused on Q4 prices, and they were published roughly one year after the benchmarked period. With this report, we have updated our reporting cycle to focus on Q1 pricing, and we are publishing our results within the same year to provide more timely information on system pricing and costs.

2
This report is available at no cost from the National Renewable Energy Laboratory (NREL) at www.nrel.gov/publications.
Figure 1. U.S. PV market growth and growth forecasta
a Average of data from GTM Research and SEIA (2015), BNEF (2014), and Deutsche Bank (2015)
1.2 U.S. Market Hardware Costs Hardware remains an important driver of PV system cost structures, constituting between 45% and 65% of modeled total system cash purchase prices. While ex-factory gate prices for modules have declined dramatically in recent years, they still constitute the largest single hardware cost for all system types.
Crystalline silicon (c-Si) modules continue to constitute the majority of PV deployments in all market segments. U.S. prices for c-Si modules dropped sharply between 2010 and 2013—from $1.85/W (BNEF 2013) to $0.64/W in Q1 2013 (GTM Research and SEIA 2014)—due in part to de-bottlenecking of polysilicon supply as well as to improvements in manufacturing costs across the supply chain (Fu et al. 2015). However, U.S. prices rose throughout 2013 and held steady in 2014 due in part to the implementation of antidumping and countervailing duties (AD/CVD) on Chinese- and Taiwanese-produced cells and modules, with prices peaking at $0.75/W in Q3 2014 (GTM Research and SEIA 2015). Recent interviews with industry participants indicate Q1 2015 U.S. module prices have fallen to between $0.65/W and $0.70/W on delivery duty paid2 (DDP) terms for U.S. coastal destinations. Interviews further indicate that purchasing scale appears to drive relatively minor discounts, with prices for purchase volumes of up to 5 megawatts (MW) between $0.68/W and $0.70/W DDP and prices for volumes beyond 5 MW between $0.65/W and $0.68/W DDP.
2 “Delivered Duty Paid means that the seller delivers the goods when the goods are placed at the disposal of the buyer, cleared for import on the arriving means of transport ready for unloading at the named place of destination. The seller bears all the costs and risks involved in bringing the goods to the place of destination and has an obligation to clear the goods not only for export but also for import, to pay any duty for both export and import and to carry out all customs formalities.” International Chamber of Commerce (n.d.).
876
1,961
3,335
4,738 5,701
7,458
10,727
-
2,000
4,000
6,000
8,000
10,000
12,000
2010 2011 2012 2013 2014 2015E 2016E
Annu
al M
W In
stal
led
Utility
Commercial
Residential
3
This report is available at no cost from the National Renewable Energy Laboratory (NREL) at www.nrel.gov/publications.
Declines in module prices have increased attention on inverter and racking prices, which have also dropped sharply in recent years. Between Q1 2014 and Q1 2015, ex-factory gate prices for inverters dropped approximately 6% (average across all market segments), while prices for racking dropped approximately 17% (average across all market segments) (Davidson et al. 2014; GTM Research and SEIA 2015; industry interviews 2015). Flush-mounted, pitched-roof residential solutions saw the highest percentage price reductions, dropping 54% from approximately $0.28/W in Q1 2014 (GTM Research and SEIA 2015) to approximately $0.12/W in Q1 2015 (industry interviews 2015). Inverter and racking price drops are in part attributed to significantly increased and intense competitive pressure in all equipment categories (GTM Research and SEIA 2015). Residential racking price declines are also driven by a combination of other factors including aluminum prices, optimized designs, and customer preference (see the appendix).

4
This report is available at no cost from the National Renewable Energy Laboratory (NREL) at www.nrel.gov/publications.
2 Methodology We estimate the cash purchase prices of PV systems using a bottom-up methodology consistent with Goodrich et al. (2012) and Davidson et al. (2014). We develop market segment-specific models intended to benchmark prices of systems sold into residential, commercial, and utility segments. In addition to original analysis and model development, the methodology includes input and validation from industry and subject matter experts via interviews as well as review of draft results.
The resulting benchmark metric reflects Q1 2015 prices for hardware as well as the cost of labor associated with typical installation methods, system size constraints, regulatory costs, and all relevant direct and indirect costs associated with operationalizing a system in a sustainable business. In benchmarking the cash purchase price, we rely on a combination of public and private sources to inform inputs and validate our model results.
We generate a bill of materials that considers typical areas available (U.S. rooftop sizes for residential and commercial installations and land area for utility installations), materials (e.g., asphalt shingles, membrane roofs), site specifics (e.g., number of stories, rooftop pitch, environmental conditions, proximity to distribution or transmission), labor rates and classes, and PV installation methods in order to estimate material costs and installation labor requirements. In addition, we include indirect costs such as business overhead, profits, supply-chain costs, and regulatory costs, all of which vary by market segment and type of installation business modeled. In general, we attempt to model best-in-class installation techniques and business operations from an installed-cost perspective.
Each market-segment-specific model has slightly different inputs and cost categories due to differences in physical system implementation, typical commercial structures of the companies involved, and norms for project financing structures. Cost categories and key inputs are described in detail in the following sections.
This methodology is unique in its bottom-up accounting for all system costs and its ability to capture variations in system cost and price driven by a number of factors. For example, we capture cost variations driven by regional differences in environmental conditions, labor types and rates, and materials prices, in addition to cost variations driven by different system designs and product specifications. This approach enables benchmarking of system costs independent from price, which is critical in understanding industry progress in reducing costs over time. The methodology further enables assessment of the system-level impacts of different design paradigms and proposed technologies.
5
This report is available at no cost from the National Renewable Energy Laboratory (NREL) at www.nrel.gov/publications.
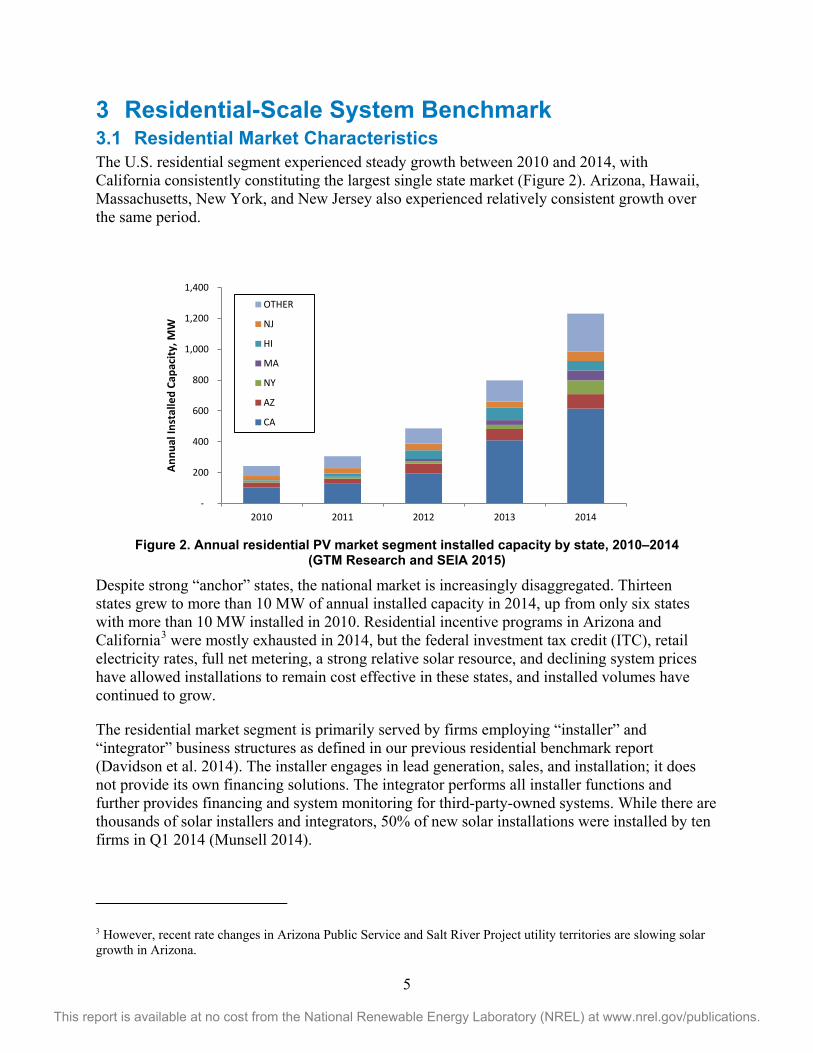
3 Residential-Scale System Benchmark 3.1 Residential Market Characteristics The U.S. residential segment experienced steady growth between 2010 and 2014, with California consistently constituting the largest single state market (Figure 2). Arizona, Hawaii, Massachusetts, New York, and New Jersey also experienced relatively consistent growth over the same period.
Figure 2. Annual residential PV market segment installed capacity by state, 2010–2014
(GTM Research and SEIA 2015)
Despite strong “anchor” states, the national market is increasingly disaggregated. Thirteen states grew to more than 10 MW of annual installed capacity in 2014, up from only six states with more than 10 MW installed in 2010. Residential incentive programs in Arizona and California3 were mostly exhausted in 2014, but the federal investment tax credit (ITC), retail electricity rates, full net metering, a strong relative solar resource, and declining system prices have allowed installations to remain cost effective in these states, and installed volumes have continued to grow.
The residential market segment is primarily served by firms employing “installer” and “integrator” business structures as defined in our previous residential benchmark report (Davidson et al. 2014). The installer engages in lead generation, sales, and installation; it does not provide its own financing solutions. The integrator performs all installer functions and further provides financing and system monitoring for third-party-owned systems. While there are thousands of solar installers and integrators, 50% of new solar installations were installed by ten firms in Q1 2014 (Munsell 2014).
3 However, recent rate changes in Arizona Public Service and Salt River Project utility territories are slowing solar growth in Arizona.
-
200
400
600
800
1,000
1,200
1,400
2010 2011 2012 2013 2014
Annu
al In
stal
led
Capa
city
, MW
OTHER
NJ
HI
MA
NY
AZ
CA

6
This report is available at no cost from the National Renewable Energy Laboratory (NREL) at www.nrel.gov/publications.
Third-party ownership (TPO) remains a critical financing pathway for residential system installations, with TPO rates ranging between 63% and 90% across key state markets in Q1 2015 (GTM Research and SEIA 2015). However, solar loans as a financing tool have grown relative to TPO because of increasing lender familiarity with solar and the ability of some loan products to provide the same no-money-down value proposition as solar leases.
3.2 Residential-Scale System Benchmark We model a 5.2-kW residential rooftop system using 60-cell, multi-crystalline 250-W modules from a Tier 1 supplier; standard single-phase string inverters; and a standard flush-mount, pitched-roof racking system. We further assume national capacity-weighted averages for non-union labor rates and sales tax rates as well as capacity-weighted averages between “installer” and “integrator” business structures. The installer engages in lead generation, sales, and installation; it does not provide its own financing solutions. The integrator performs all installer functions and further provides financing and system monitoring for third-party-owned systems. Differences between the installer and integrator business models primarily manifest in the overhead cost category, where an integrator is modeled with higher expenses for customer acquisition, financial structuring, and asset management. Figure 3 presents the cost drivers and assumptions, cost categories, inputs, and outputs of the model.
Figure 3. Residential PV system model schematic
3.2.1 Residential-Scale System Benchmark Result The resulting Q1 2015 residential benchmark cash purchase price is modeled at $3.09/W, with the cost breakdown presented in Figure 4.

7
This report is available at no cost from the National Renewable Energy Laboratory (NREL) at www.nrel.gov/publications.
Table 1 lists all key system and company assumptions. Details of our residential modeling assumptions are included in Section 3.3.
Figure 4. NREL modeled residential rooftop PV system prices (nationwide average, 5.2 kW)
Table 1. Key Residential Modeling Assumptions
Category Modeled Value (Range) Description Sources
Module ($/Wdc)
$0.70 ($0.64–$0.74)
Ex-factory gate (first buyer) average selling price; Tier 1 modules
BNEF 2014, GTM Research and SEIA (2015), industry interviews
Inverter ($/Wdc)
$0.29 ($0.23–$0.34)
Ex-factory gate prices; single-phase string inverter
GTM Research and SEIA (2015), industry interviews
Racking ($/Wdc)
$0.12 ($0.09–$0.14)
Ex-factory gate prices; includes flashing for roof penetrations Industry interviews
BOS materials ($/Wdc)
$0.20
Wholesale prices for conductors, switches, combiners and/or transition boxes, conduit, grounding equipment, monitoring system/production meter, fuses, and breakers
Industry interviews, RSMeans (2013)
$0.70 $0.70 $0.70
$0.29 $0.29 $0.29
$0.12 $0.12 $0.12 $0.20 $0.20 $0.20
$0.20 $0.20 $0.20 $0.08 $0.08 $0.08
$0.33 $0.33 $0.33
$0.11 $0.11 $0.11
$0.31 $0.42 $0.36
$0.27 $0.38
$0.32
$0.38
$0.38 $0.38
$2.99 $3.21
$3.09
$0.00
$0.50
$1.00
$1.50
$2.00
$2.50
$3.00
$3.50
Installer Integrator Weighted average
Syst
em P
rice
(201
5$/W
dc)
Profit
Overhead
Customer acquisition
Permitting fee and labor
Installation labor
Sales tax on equipment
Supply chain cost
BOS materials
Racking
Inverter
Module

8
This report is available at no cost from the National Renewable Energy Laboratory (NREL) at www.nrel.gov/publications.
Category Modeled Value (Range) Description Sources
Sales tax (%) 0%–6% depending on the state
National benchmark applies an average (by state) weighted by 2014 installed capacities.
Database of State Incentives for Renewables & Efficiency (DSIRE) (2015), RSMeans (2015)
Supply chain costs (% of equipment costs)
10% (5%–10%)
Costs associated with warehousing and logistics Industry interviews
Direct installation labor ($/hr)
Electrician: $15.90–$41.60 Laborer: $9.30–$22.00
Assumes a 1–2 day installation, total of approximately 50 person-hours; modeled labor rate assumes non-union labor and depends on state; national benchmark uses weighted average of state rates; benchmark per-watt cost is $0.33/Wdc
U.S. Bureau of Labor Statistics (BLS) (2013), industry interviews
Burden rates (% of direct labor)
Total nationwide average: 31.7%
Workers compensation (state-weighted average), federal and state unemployment insurance, FICA, builders risk, public liability
RSMeans (2013)
PII ($/Wdc) $0.12
Includes assumed building permitting fee of $400 and eight labor hours: three hours for building permit preparation, two hours for interconnection application preparation, one hour for building permit and interconnection application submission, and two hours for final building inspection
Vote Solar (2015), Vote Solar and Interstate Renewable Energy Council (IREC) (2013), industry interviews
Customer acquisition ($/Wdc)a
$0.31 (installer), $0.42 (integrator) ($0.20–$0.85)
Total cost of sales and marketing activities over the last year—including marketing and advertising, sales calls, site visits, bid preparation, and contract negotiation; adjusted based on state “cost of doing business” index
SolarCity (2015), Vivint Solar (2015), Feldman et al. (2013), GTM Research (2013), industry interviews
Overhead ($/Wdc)
$0.27 (installer), $0.38 (integrator)
General and administrative (G&A) expenses—including fixed overhead expenses covering payroll (excluding permitting payroll), facilities, administrative, finance, legal, information technology, and other corporate functions as well as office expenses; adjusted based on state “cost of doing business” index
SolarCity (2015), Vivint Solar (2015), Feldman et al. (2013), industry interviews
Profit (%) 17% (10%–20%)
Applies a fixed percentage margin to all direct costs including hardware, installation labor, direct sales and marketing, design, installation, and permitting fees
Feldman et al. (2013), industry interviews
a When applicable

9
This report is available at no cost from the National Renewable Energy Laboratory (NREL) at www.nrel.gov/publications.
3.2.2 Model Changes and Adjustments from Previous Benchmark Continued refinement of our models, as opposed to market factors, has contributed to some changes in our benchmarks since our last study (Davidson et al. 2014). Most notably, changes in racking discount level assumptions resulted in a $0.17/W lower racking cost than assumed previously. We discuss this change in detail in Section 3.3.2.
3.2.3 Regional Variations in Price While our benchmark represents a national capacity-weighted average across various cost categories, we also model state-specific prices for the top five residential market states to show price variability by region (Figure 5). Differences across states are driven primarily by the application or exemption of sales tax on equipment as well as variations in labor rates and average business costs. With the exception of Arizona, which has a lower business cost, the business cost of the most active solar markets is 9%–23% higher than the U.S. average.4 While margins are difficult to generalize, we assume a percentage markup on installer costs (derived from industry interviews) to arrive at an estimate of installer profit. In reality, market-specific attributes that are intensely local in nature (e.g., retail electricity rates, incentives available, intensity of competition) will determine the pricing and profit achievable in any given local market.
Figure 5. Regional variations in residential-scale PV system price (5.2-kW system)
4 Moody’s Cost of Doing Business Index (Case 2012) evaluates labor rates, rent, electricity costs, and all taxes relative to a national average, with each component weighted to reflect its contribution to overall business costs.
$1.52 $1.52 $1.52 $1.52 $1.52 $1.52
$0.08 $0.10 $0.09 $0.05 $0.08 $0.05 $0.33 $0.37 $0.26 $0.37 $0.39 $0.40 $0.11 $0.11
$0.11 $0.11 $0.11 $0.11 $0.36 $0.37
$0.35 $0.38 $0.43 $0.43
$0.32 $0.34 $0.31
$0.35 $0.39 $0.39
$0.38 $0.39 $0.37
$0.38 $0.39 $0.38
$3.09 $3.19 $3.00
$3.16 $3.30 $3.28
$0.00
$0.50
$1.00
$1.50
$2.00
$2.50
$3.00
$3.50
U.S. Average CA AZ NY MA HI
Syst
em P
rice
(201
5$/W
dc)
Profit
Overhead
CustomerAcquisition
Permitting Feeand Labor
InstallationLabor
Sales Tax onEquipment
Hardware

10
This report is available at no cost from the National Renewable Energy Laboratory (NREL) at www.nrel.gov/publications.
3.2.4 Benchmark Comparison to Other Sources Our benchmark includes an assumption for profit, but we present our modeling results in Figure 6 without profit to compare to several other sources of system cost information. SolarCity’s and Vivint’s reported costs include a combination of capitalized and expensed costs amortized across booked and installed volumes, which may account for some of the variability observed across all cost categories. Because our bottom-up approach is built on a per-installation basis, our estimate effectively assumes all costs for a system are incurred and expensed immediately upon completion of system installation.
Figure 6. Comparison of residential system costs (excludes profit)
Further, because SolarCity and Vivint are integrators by our definition, we present our integrator scenario costs in Figure 6 because they compare more directly, as opposed to our benchmark that represents a national weighted average between integrator and installer costs. Installation costs appear to be in relative agreement with the exception of Vivint’s reported costs. Discrepancies across the sales and marketing and general and the administrative (G&A) categories are in part due to the strategic and firm-specific nature of these categories.
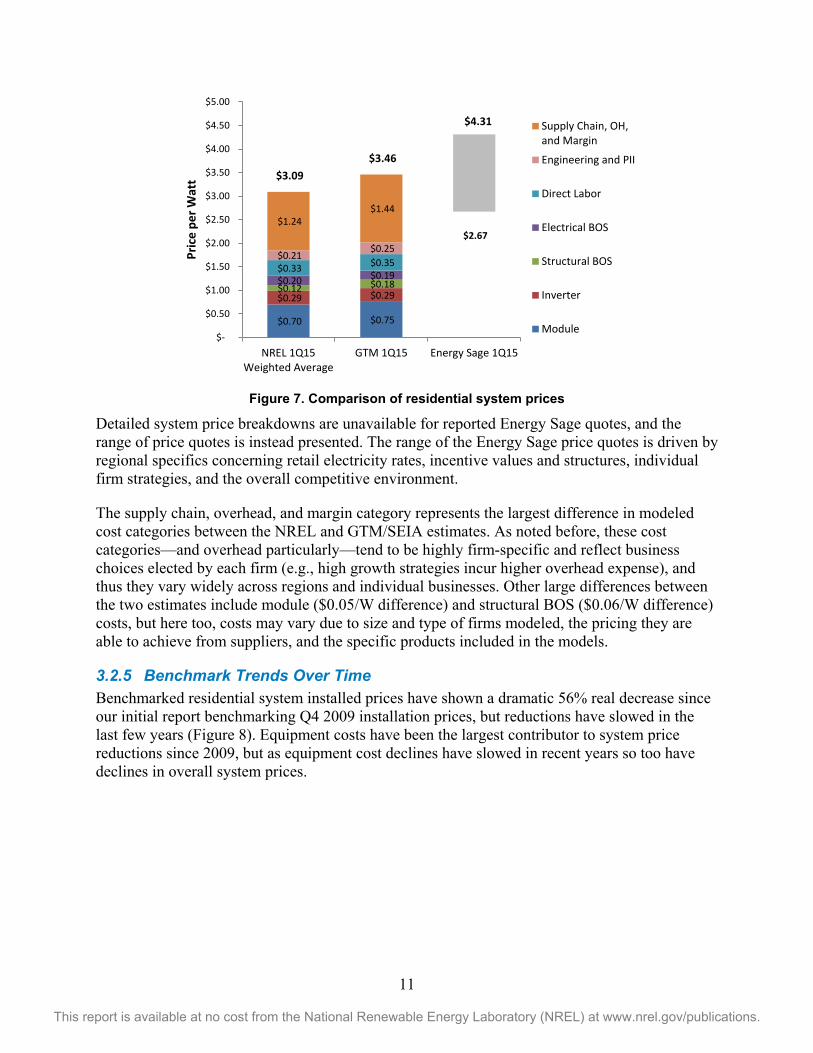
We further compare our weighted average price results with GTM Research and SEIA’s results in Figure 7, where we adopt cost categorizations from GTM Research and SEIA (2015) for more direct comparison. Price-quote data from Energy Sage (Carolyn Davidson, pers. comm., April 7, 2015), an online solar quote aggregation and comparison service—are also included.5
5 Energy Sage data includes 1,577 quotes for systems in 25 states. California, Connecticut, and Massachusetts account for 55% of the total quotes, with each of the remaining 22 states accounting for 8% or less of the total. Quotes are for complete installed systems, and they assume homeowners will monetize any available incentives.
$2.04 $2.09 $2.32
$2.01
$0.42 $0.59
$0.54
$0.47
$0.38 $0.27
$0.35
$0.18
$2.84 $2.95 $3.21
$2.66
$0.00
$0.50
$1.00
$1.50
$2.00
$2.50
$3.00
$3.50
NREL 1Q15Integrator
SolarCity 1Q15 Vivint 1Q15 Deutsche Bank2015
Cost
Inst
alle
d pe
r Wat
t
General andAdministrative
Sales and Marketing
Installation
11
This report is available at no cost from the National Renewable Energy Laboratory (NREL) at www.nrel.gov/publications.
Figure 7. Comparison of residential system prices
Detailed system price breakdowns are unavailable for reported Energy Sage quotes, and the range of price quotes is instead presented. The range of the Energy Sage price quotes is driven by regional specifics concerning retail electricity rates, incentive values and structures, individual firm strategies, and the overall competitive environment.
The supply chain, overhead, and margin category represents the largest difference in modeled cost categories between the NREL and GTM/SEIA estimates. As noted before, these cost categories—and overhead particularly—tend to be highly firm-specific and reflect business choices elected by each firm (e.g., high growth strategies incur higher overhead expense), and thus they vary widely across regions and individual businesses. Other large differences between the two estimates include module ($0.05/W difference) and structural BOS ($0.06/W difference) costs, but here too, costs may vary due to size and type of firms modeled, the pricing they are able to achieve from suppliers, and the specific products included in the models.
3.2.5 Benchmark Trends Over Time Benchmarked residential system installed prices have shown a dramatic 56% real decrease since our initial report benchmarking Q4 2009 installation prices, but reductions have slowed in the last few years (Figure 8). Equipment costs have been the largest contributor to system price reductions since 2009, but as equipment cost declines have slowed in recent years so too have declines in overall system prices.
$0.70 $0.75
$0.29 $0.29 $0.12 $0.18 $0.20 $0.19 $0.33 $0.35 $0.21
$0.25 $2.67
$1.24 $1.44
$3.09 $3.46
$4.31
$-
$0.50
$1.00
$1.50
$2.00
$2.50
$3.00
$3.50
$4.00
$4.50
$5.00
NREL 1Q15Weighted Average
GTM 1Q15 Energy Sage 1Q15
Pric
e pe
r Wat
t
Supply Chain, OH,and Margin
Engineering and PII
Direct Labor
Electrical BOS
Structural BOS
Inverter
Module

12
This report is available at no cost from the National Renewable Energy Laboratory (NREL) at www.nrel.gov/publications.
Figure 8. NREL benchmark residential installed prices, Q4 2009-Q1 2015
The benchmark installed system price dropped 7% (real) since our last residential segment report (Davidson et al. 2014), which benchmarked system prices in Q4 2013. Key market developments since our last report include slight declines in inverter prices, sharp declines in racking prices, and generally lower installer and integrator percentage margins. Installation labor productivity and cost remains essentially unchanged since our previous report.
3.3 Key Developments and Trends 3.3.1 Inverter Trends The majority of U.S. residential systems still use single-phase string inverters. After sharp price declines between 2010 and 2013, U.S. string inverter price reductions appear to have slowed somewhat between our 2013 residential system benchmark (Davidson et al. 2014) and Q1 2015. Previously, 2013 ex-factory gate pricing was between $0.25/Wac (10-kWac inverter) and $0.34/Wac (2-kWac inverter), whereas data from industry interviews suggests Q1 2015 string inverter pricing in the $0.23–$0.29/Wac range.
In the past several years, microinverters have rapidly gained market share in the segment, constituting an estimated 41% of the U.S. residential market in 2014 (GTM Research 2015), up from approximately 25% in 2012 (CSI 2013). Microinverters are typically connected to each module in a system, and they provide module-level maximum power point tracking (MPPT) and power inversion. This architecture can reduce the system-level impacts of partial array shading as well as impacts from non-uniform module performance (e.g., from non-uniform soiling, aging, and manufacturing tolerances). The micro-inverter system architecture also requires less effort for electrical design by eliminating the need for string-sizing calculations, while also providing for greater flexibility in array layouts. However, the price premium for microinverters remains large, with a Q1 2015 ex-factory gate price estimated at $0.57/Wac (industry interviews 2015); this is the same price reported in Q1 2014 (GTM Research and SEIA 2015).
$6.96
$6.10
$4.31 $3.77
$3.31 $3.09
$-
$1.00
$2.00
$3.00
$4.00
$5.00
$6.00
$7.00
$8.00
Q4 2009 Q4 2010 Q4 2011 Q4 2012 Q4 2013 Q1 2015
Inst
alle
d Pr
ice
(201
5 $/
Wdc
) Other
Labor
BOS
Inverter
Module

13
This report is available at no cost from the National Renewable Energy Laboratory (NREL) at www.nrel.gov/publications.
3.3.2 Racking Trends Residential rooftop installation layouts and costs can vary significantly based on roofing type, roof substructure, and geographically driven environmental design conditions (e.g., design wind speeds and snow loads). We assume a flush-mounted, through-roof racking system installed on a composite shingle roof, located in a relatively mild climate such as that found in most of California.
The ex-factory gate price for such racking dropped 54% since Q4 2013 compared to Q1 2015 (industry interviews 2015). This change is based partially on a refinement in how we estimate racking costs; our estimates for residential racking are derived from publicly available list prices and are subsequently discounted by a percentage derived from installer and integrator interviews to arrive at an estimated integrator or installer cost. In our latest round of industry interviews, the estimated best discount achievable increased by 10% compared to previous interview-derived estimates. However, observed market pricing for this type of product also dropped significantly over the last few years—68% since 2012, when the price was reported at $0.40/W (GTM Research and SEIA 2013). See the appendix for additional analysis of residential racking prices.
3.3.3 Residential Segment Soft Costs 3.3.3.1 Installation Labor We assume that a typical 5-kW solar installation takes a crew of three or four a day to a day-and-a-half, or three to six full-time-equivalent days. Racking and module installation constitutes 70% of the installation time. A crew will typically have one electrician who accounts for roughly a third of the installation hours, with the support of an apprentice and/or general laborer(s). For a typical installation, installation labor is estimated at $0.33/W, which represents no material decrease relative to the Q4 2013 estimate. Rework and delays are not accounted for, which can result in substantially higher installation costs. Several companies suggest lower installation costs through one-day installations, streamlined racking hardware, and lean specialized installation crews.
3.3.3.2 Customer Acquisition Customer-acquisition costs continue to vary radically by business model and scale. The strategy selected by a company will depend on its local market, company branding, growth strategy, and functional expertise, to name but a few factors. Strategies include referrals, neighborhood canvassing, purchased leads (cold and hot), commercials, and advertising and channel partnerships, among others. Our installer sales and marketing benchmark is $0.31/W, and it is based on in-house sales and design staff estimates developed by Feldman et al. (2013).6 However, many companies may rely more heavily on a sales and marketing budget, third-party vendor services, and/or lead purchasing. GTM Research (2013) estimated that the cost per customer of specific strategies ranged from $0.15/W to $0.80/W7 (for referrals and direct-response marketing, respectively). Similarly, companies interviewed by NREL indicated a range of strategies employed, from primarily door-to-door canvassing to minimal sales and marketing expenses due to a solar-favorable and educated local consumer base combined with a strong
6 For a company installing 12 MW/year, we assume 24 salespeople and 12 full-time design and engineering employees. 7 $750–$4,000 per customer, assuming a 5-kW system

14
This report is available at no cost from the National Renewable Energy Laboratory (NREL) at www.nrel.gov/publications.
local reputation. Those interviewed by NREL quoted full customer-acquisition costs for installers ranging from $0.20/W to $0.85/W.8
Customer-acquisition costs for large integrators can be tracked based on public filings because SolarCity and Vivint have begun to report transparent sales and marketing estimates on a per-watt basis. Typically, sales and marketing comprise two components in financial statements: (1) direct sales and marketing expenses reported on the income statement and (2) capitalized sales and marketing expenses. For the Q1 2015, Vivint reported $0.54/W, and SolarCity reported $0.59/W (Figure 9). These figures are substantially higher than our integrator estimate of $0.42/W (and our weighted average benchmark estimate of $0.36/W) in part because our modeling approach assumes that installation and integrator firms realize operating profits. However, these companies have been pursuing an aggressive growth strategy, with Vivint nearly tripling installations and SolarCity nearly doubling their installations from 2013 to 2014. The result is an increase in customer-acquisition costs from 2014 to Q1 2015 (Figure 9).
Figure 9. Publicly reported integrator customer-acquisition costs compared with NREL integrator
customer-acquisition cost estimate
3.3.3.3 Permitting, Inspection, and Interconnection (PII) Q1 2015 modeled total PII costs of $0.12/W are lower than NREL’s 2012 benchmark of $0.19/W for a 5-kW system. This PII cost decline is attributed to a lower assumed permitting fee of $400 in 20159 (compared to an assumed permitting fee of $430 in 2012), exclusion of the labor costs associated with obtaining financial incentives, and overall labor efficiency gains as authorities having jurisdiction (AHJs) increasingly move toward online permitting and interconnection application processes for residential systems. While there is considerable
8 Interviewees were asked what their total cost of sales and marketing activities were over the last year, including costs of marketing and advertising, sales calls, site visits, bid preparation, and contract negotiation. Without follow-up questioning, it is difficult to confirm that these categories are conceptualized similarly from company to company. 9 The assumed permitting fee of $400 is based on Vote Solar (2015) and Vote Solar and IREC (2013).
$0.50
$0.59
$0.52 $0.54
$0.42
$0.00
$0.10
$0.20
$0.30
$0.40
$0.50
$0.60
$0.70
2014 Q1 2015
Cost
(201
5 $/
Wdc
)
SolarCity Vivint NREL (Integrator)

15
This report is available at no cost from the National Renewable Energy Laboratory (NREL) at www.nrel.gov/publications.
variation in PII requirements across municipalities and utility territories, and subsequently a wide range in total PII costs across the United States, national average PII costs have decreased slightly in recent years.
In the coming months, however, we expect national average residential PII costs to continue declining, especially in light of state-level efforts in key solar markets, such as California and New York, to promote streamlined permitting and interconnection processes across hundreds of AHJs. Specifically, California’s Solar Permitting Efficiency Act (AB 2188), which was signed into law in September 2014, requires local governments to adopt an administrative ordinance by September 30, 2015, to create an expedited permit process for rooftop PV systems under 10 kW. This follows Senate Bill 1222, signed in September 2012, which caps residential permit fees at $500.10 In New York, the NY-SUN Unified Permit effort seeks to reduce PV soft costs by incentivizing municipalities across the state to adopt a standard residential and small business PV permit. As a collaborative effort of the New York State Energy Research and Development Authority, New York Power Authority, and City University of New York, the NY-SUN initiative provides eligible municipalities that adopt the permit between $2,500 and $5,000, with applications for the program accepted until September 30, 2014.
3.3.3.4 Overhead and Profit Margin The industry has widely varying costs for overhead and the categories that constitute overhead, likely based on different management priorities, strategies, and phases of growth. As a baseline, we rely on adapted figures from Feldman et al. (2013) for a representative high-volume installer. This is largely composed of staff salaries—including corporate, finance, customer service, legal, and human resources—as well as fixed expenses including rent, office supplies, purchased corporate professional services, and vehicle fees. In total, this is estimated at a weighted average $0.27/W for installers and $0.38/W for integrators.
Public companies provide additional references for overhead. Vivint reports $0.35/W, and SolarCity reports $0.27/W for Q1 2015 (Figure 10).
10 SB 1222 allows for a permit fee of $500 for PV systems up to 15 kW, with $15 per kilowatt for each kilowatt above 15 kW.

16
This report is available at no cost from the National Renewable Energy Laboratory (NREL) at www.nrel.gov/publications.
Figure 10. Publicly reported integrator overhead costs compared with NREL integrator overhead
cost estimate
Pricing—and thus profit—also varies based on firm strategy and region-specific factors such as retail electricity rates, local incentive availability and structure, market maturity, and competitive environment. To generalize profit across firms and regions, we estimate profit as a 17% markup on installer direct costs (industry interviews 2015) for a best-in-class, profitable installer.
$0.24 $0.27
$0.40
$0.35 $0.38
$0.00
$0.05
$0.10
$0.15
$0.20
$0.25
$0.30
$0.35
$0.40
$0.45
2014 Q1 2015
Cost
(201
5 $/
Wdc
)
SolarCity Vivint NREL (Integrator)

17
This report is available at no cost from the National Renewable Energy Laboratory (NREL) at www.nrel.gov/publications.
4 Commercial-Scale System Benchmark 4.1 Commercial Market Characteristics The U.S. commercial PV segment experienced steady growth between 2010 and 2012, but annual installed capacities leveled and even contracted between 2012 and 2014 (Figure 11). The commercial segment has proven challenging owing to the disaggregated customer base, relatively small project sizes, off-taker underwriting difficulties, and the non-standardized nature of projects, contracts, and off-takers. Nonetheless, it remains a large segment—24% of the total U.S. market in 2014—with much headroom for growth, and efforts are underway to address many of the challenges in this segment.11
The commercial segment is more geographically disaggregated than the residential market segment. As in the residential and utility segments, however, California is the leading state, constituting approximately 30% of the commercial segment in 2014. Massachusetts grew rapidly from 2012 to 2014, while New Jersey declined steeply—showing the volatility in any given state’s market conditions and resulting annual capacity additions.
Figure 11. Annual commercial PV market segment installed capacity by state, 2010–2014
(GTM Research and SEIA 2015)
11 e.g., standardized contracts developed by the Solar Securitization and Solar Access to Public Capital (SAPC) Working Group (https://financere.nrel.gov/finance/content/solar-securitization-and-solar-access-public-capital-sapc-working-group#standard_contracts)
-
200
400
600
800
1,000
1,200
2010 2011 2012 2013 2014
Annu
al In
stal
led
Capa
city
, MW
OTHER
HI
MD
MO
NY
AZ
NJ
MA
CA

18
This report is available at no cost from the National Renewable Energy Laboratory (NREL) at www.nrel.gov/publications.
4.2 Commercial-Scale System Benchmark We model a 200-kW, 1,000-Vdc commercial-scale flat-roof system using 72-cell, multicrystalline 310-W modules (16% efficient) from a Tier 1 supplier, three-phase string inverters, and a ballasted racking solution on a membrane roof. We further model national capacity-weighted averages for non-union labor rates and sales tax rates. Figure 12 presents a schematic of our commercial-scale system cost model.
The commercial-scale system model structure differs from the residential-scale model in that we separate our commercial-scale system estimate into distinct engineering, procurement, and construction (EPC) and project-development functions. While some firms engage in both activities in an integrated manner, we feel the distinction helps highlight the specific cost trends and cost drivers associated with each function.
Figure 12. Schematic of commercial system model

19
This report is available at no cost from the National Renewable Energy Laboratory (NREL) at www.nrel.gov/publications.
4.2.1 Commercial-Scale System Benchmark Result The resulting Q1 2015 commercial benchmark cash purchase price is modeled at $2.16/W, with the cost breakdown presented in Figure 13. Table 2 lists all key system and company assumptions. Further details of our commercial modeling assumptions are included in Section 4.3.
Figure 13. Modeled commercial PV system price (national weighted average, 200-kW)
$0.68
$0.13
$0.18
$0.16
$0.19
$0.03 $0.06 $0.03 $0.17
$0.07 $0.06
$0.41
$2.16
$-
$0.25
$0.50
$0.75
$1.00
$1.25
$1.50
$1.75
$2.00
$2.25
National Weighted Average
Pric
e (2
015
$/W
dc)
Development Costs
Contingency
Sales Tax
EPC Overhead & Profit
Permitting and Interconnection
Engineering Design
Equipment Rental and Freight
Installation Labor
BOS
Racking Materials
Inverter
PV module
Development $0.47/W
EPC $1.69/W

20
This report is available at no cost from the National Renewable Energy Laboratory (NREL) at www.nrel.gov/publications.
Table 2. Key Commercial Modeling Assumptions
Category Modeled Price (Price Range)
Description Sources
EPC-Module, $/Wdc
$0.68 ($0.65–$0.70)
Ex-factory gate prices. 310-W multicrystalline, 72-cell, 6-inch cell, at 16% efficiency
BNEF (2014), GTM Research and SEIA (2015), industry interviews
EPC-Inverter, $/W
$0.13/Wdc ($0.15–$0.17/Wac, $0.12–$0.13/Wdc)
Ex-factory gate prices; three-phase string inverter; Per-Wdc pricing assumes a 1.3 inverter-loading ratio
GTM Research and SEIA (2015), industry interviews
EPC-Racking, $/Wdc
$0.21 ($0.16–$0.22)
Ex-factory gate prices; flat-roof ballasted racking system Industry interviews
EPC-BOS Materials, $/Wdc
$0.18 Conductors, conduit and fittings, transition boxes, switchgear, panel boards, etc.
RSMeans (2013), industry interviews
EPC-Sales Tax 0%–6% Percent markup on equipment only DSIRE (2015), RSMeans (2015)
EPC-Installation Labor, $/Wdc
$0.19 All direct installation labor BLS (2013), RSMeans (2013), industry interviews
EPC-Permitting and Commissioning, $/Wdc
$0.09
$0.03/W construction permit fees and inspection costs; $0.06/W for interconnection, testing, and commissioning
Industry interviews
EPC-Overhead and Profit
20% (5%–20%)
Markup on all direct costs; covers all overhead items such as back office staff, office space, etc. and profit; We use the upper range of markups because we benchmark a relatively small system size at 200 kW.
Industry interviews
Developer-Contingency 4% Estimated as markup on EPC price Industry interviews
Developer-Overhead, $/Wdc
$0.41
Includes fixed overhead expenses such as payroll, facilities, travel, insurance, etc. across administrative, business development, finance, and other corporate functions; assumes 10 MW/year of system sales
Feldman et al. (2013), industry interviews

21
This report is available at no cost from the National Renewable Energy Laboratory (NREL) at www.nrel.gov/publications.
4.2.2 Model Changes and Adjustments from Previous Benchmark 4.2.2.1 Market-Driven Changes in EPC Price We adjusted our model since our previous benchmark study to better capture regional variations in cost driven by environmental conditions and their impacts on system design and product specification. In addition, we changed our assumed system architecture from a 600-Vdc, central-inverter-based system to a 1,000-Vdc transformer-less, string-inverter-based system. Further, our previous benchmark assumed 245-W, 60-cell, 15%-efficient modules, while our new benchmark assumes that 310-W, 72-cell, 16%-efficient modules are used. These changes reflect a shift in the market: interviews suggest 1,000 Vdc architectures for commercial-scale rooftop systems are increasingly common where possible. Overall, in combination with equipment cost reductions in modules, inverters, and racking, we model a total $0.16/W decrease in the national weighted average EPC price for commercial-scale systems, which dropped from $1.87/W in Q4 2013 to $1.69/W in Q1 2015.
4.2.2.2 Model Adjustments to Development Cost and Profit We have incorporated two key changes to our development cost model. First, we model development activities as performed by a separate, standalone firm as opposed to an integrated development and EPC shop. This dedicated development firm is assumed to have a fixed headcount of 22 full-time employees spanning management, finance, business development, engineering, and administrative support functions. We assume that this smaller, more focused development-only organization pursues projects in the commercial market segment only. Our new estimation method scales by the development firm’s assumed total annual sales volumes. Previously, development costs were built up assuming an integrated firm that pursues both residential and commercial projects, and they were scaled by project size. Our new assumptions are still adapted from estimates by Feldman et al. (2013), but they are modified with input from recent industry interviews. While the market share of third-party-owned versus host-owned systems in the commercial segment is estimated to be split approximately evenly (Feldman et al. 2015), we have made these changes to make development costs and their drivers more distinct from EPC costs and prices.
Second, while all fully loaded costs are still included in our price estimates, we no longer use a percentage markup to estimate any developer net profit. With a no net profit assumption, our modeled price can be interpreted as the minimum price a developer might charge for a system, as the price would result in a developer net income of zero. We adopted this approach owing to the wide variation in developer profits in the commercial segment, where project pricing is highly dependent on region and project specifics (e.g., customer credit, local retail electricity rate structures, local incentive structures, competitive environment, and overall project/deal structures) that are not adequately represented with a simple average markup.

22
This report is available at no cost from the National Renewable Energy Laboratory (NREL) at www.nrel.gov/publications.
The net result of these changes is a total development cost of $0.47/W for a firm that sells 10 MW of projects in aggregate per year. This compares to our Q4 2013 estimate of $0.77/W in total development cost and profit, which includes $0.53/W in development costs plus $0.24/W of profit, for a firm pursuing a mix of residential and commercial projects totaling 70 MW annually. If we adjust our previous methodology to exclude profit, our new development cost result is $0.06/W lower than the earlier estimate. Further, if we apply our old profit estimation methodology to our latest benchmark (10% markup on EPC price and direct developer costs), our development cost and profit would total $0.69/W, or $0.08/W less than our previous benchmark.
4.2.3 Regional Variations in Price Our benchmark represents a national capacity-weighted average across various cost categories, but we also model state-specific prices for the top five commercial markets to present the potential price variability by region (Figure 14).
Figure 14. Regional variations in commercial-scale PV system price
Racking, labor, and differences in sales tax rates drive the majority of variation across these states. Racking costs vary due to differing environmental conditions and resulting design requirements. The Northeast tends to incur higher racking costs owing to generally heavier snow loads in combination with equivalent or higher wind loads compared to other regions. Labor in Massachusetts and New Jersey also contribute to higher costs in those states.
Because margins are difficult to generalize, we assume a price that covers total developer cost and EPC price. In reality, market-specific attributes that are intensely local in nature (e.g., retail electricity rates, incentives available, intensity of competition) will determine the pricing achievable in any given regional market.
$2.15 $2.14 $2.25 $2.26
$2.01 $2.09
$-
$0.50
$1.00
$1.50
$2.00
$2.50
U.S. Avg. CA MA NJ AZ NY
Cost
per
Wat
t
Development CostsContingencySales TaxEPC Overhead & ProfitPermitting and InterconnectionEngineering DesignEquipment Rental and FreightInstallation LaborBOSRacking MaterialsInverterPV module

23
This report is available at no cost from the National Renewable Energy Laboratory (NREL) at www.nrel.gov/publications.
4.2.4 Benchmark Comparison to Other Sources Figure 15 compares our commercial-scale system benchmark against modeled results from GTM Research and SEIA (2015) and against the range of reported developer all-in asking prices for systems from Sol Systems (2015) (a project finance and brokerage service provider). Detailed system price breakdowns are not available for reported Sol Systems prices, and the range of price quotes is instead presented.
Figure 15. Comparison of commercial system prices
We observe minor differences between our benchmark and GTM Research and SEIA’s estimate, with the largest differences driven by a $0.09/W difference in materials—our estimate includes $0.07/W of sales tax in the materials category. We have also included our contingency and development expenses in the overhead and markup category to provide results that are more comparable . Both GTM/SEIA and NREL estimates fall within the lower end of Sol Systems’ reported price range (Sol Systems 2015), but our price estimate does not include any net profit, whereas GTM/SEIA estimates and Sol Systems prices do include net profit. The large range in Sol Systems reported prices is likely due to region, firm, and project specifics that influence both system costs and prices.
4.2.5 Benchmark Trends Over Time As with our residential price benchmarks, our commercial installed price benchmarks have shown a strong decrease (58% real) since our initial studies benchmarking Q4 2009 prices (Figure 16). Equipment costs have been the largest contributor to system price reductions since 2009; over the past 2 years, equipment cost declines and overall system price declines have slowed. Improvements in soft costs have been difficult to realize, especially given the challenge posed by the non-standard nature of projects and the disaggregated customer base in this segment.
$1.22 $1.13
$0.19 $0.22 $0.09 $0.11
$0.67 $0.71
$4.00
$2.16 $2.19
$1.75
$0.00
$0.50
$1.00
$1.50
$2.00
$2.50
$3.00
$3.50
$4.00
$4.50
NREL 1Q15 GTM/SEIA 1Q15 Sol Systems 1Q15, <500kW
Syst
em P
rice
(201
5 $/
Wdc
)
Overhead and Markup Design and Permitting
Installation Labor Materials

24
This report is available at no cost from the National Renewable Energy Laboratory (NREL) at www.nrel.gov/publications.
Figure 16. NREL benchmark commercial installed prices, Q4 2009–Q1 2015
Since our last study benchmarking prices in Q4 2013, we model total real price reductions of 18% (from $2.65/W to $2.16/W). However—as noted in Section 4.2.2.2—this is in part a function of adjustments to our development cost model and not due to significant changes in the market or in installation or development efficiency. If we adjust our previous Q4 2013 benchmark to match our new assumption of no profit, the adjusted benchmark would be $2.41/W, and the total modeled system price decline would be about 10% (declining from $2.41/W to $2.16/W).
If we examine EPC prices in isolation, we model an EPC price decline of $0.18/W, from $1.87 to $1.69/W (real) between Q4 2013 and Q1 2015. This 10% EPC price reduction is indicative of market-driven changes (e.g., changes in equipment prices, system architectures, EPC margins) since our last benchmark. The largest contributor to the market-driven price decline is equipment ($0.09/W across module, inverter, and racking). The balance of the price decline is driven by changes of $0.03/W or less across multiple cost categories including BOS, labor, equipment rental, and EPC overhead and profit.
4.3 Key Developments and Trends 4.3.1 Inverter and Module Trends Market preference for inverter types and inverter market pricing have changed for smaller (< 500 kW) rooftop systems since our last study. In 2013, a typical 200-kW rooftop system used large single central inverters. As of Q1 2015, such a commercial rooftop system nearly exclusively employs multiple three-phase, “large” string inverters (up to approximately 30-kWac capacity) that can accommodate input voltages up to 1,000 Vdc. This is driven by a combination of improved price per watt, ease of siting and installation, slightly higher efficiencies, and potential technical constraints arising from recent National Electric Code (NEC) requirements12 (GTM
12 NEC requirements around rapid system shutdown and arc fault detection and interruption are more easily met via system architectures employing multiple string inverters—or microinverters, or distributed DC-DC converters—as
$5.15 $4.78
$3.29
$2.67 $2.65 $2.16
$-
$1.00
$2.00
$3.00
$4.00
$5.00
$6.00
Q4 2009 Q4 2010 Q4 2011 Q4 2012 Q4 2013 Q1 2015
Syst
em P
rice
(201
5 $/
Wdc
) Other
Labor
BOS
Inverter
Module

25
This report is available at no cost from the National Renewable Energy Laboratory (NREL) at www.nrel.gov/publications.
Research 2015, industry interviews 2015). The ex-factory gate price for a large string inverter (e.g., a 28-kWac inverter) is approximately $0.16/Wac ($0.13/Wdc assuming a 1.3 inverter loading ratio) today (industry interviews 2015). We assume such large string inverters are used in our modeled system. Higher DC voltages also allow for longer strings and potential reductions in combiner box and DC conductor costs.
Typical modules used on commercial-scale rooftop systems have also shifted to larger 72-cell modules with outputs of up to 310 W. EPCs indicate that such modules, while larger than 60-cell modules, do not pose any meaningful additional burden in terms of labor requirements for handling and installation. Thus, the market prefers the larger modules because they can reduce costs that are driven on a per-module basis, such as racking and module installation.
Taken together, our modeling suggests that higher-voltage, string-inverter-based systems combined with larger modules contribute to approximately $0.02/W in BOS savings and $0.01/W in labor savings for our 200-kW benchmark commercial-scale rooftop system.
4.3.2 Effects of System Size and Labor Type on System Prices To explore drivers of commercial-scale system prices, we model sensitivity of system prices to system size and labor rates. Moderate economies of scale exist in the construction of commercial rooftop systems. A total price reduction of $0.16/W, or 7%, is observed between 100-kW and 500-kW systems (Figure 17), with most of the efficiency coming from costs for permitting, labor, equipment rental, and EPC markups.
Figure 17. Commercial-scale system EPC economies of scale
The use of union versus non-union labor can also significantly affect system prices, driving a $0.27/W (12%) system price difference ($2.16/W with non-union labor, $2.43/W with union labor) assuming a 200-kW system and national weighted-average labor rates. The use of union
compared to a single, large central inverter. Microinverters and DC-DC optimizer hardware still command a price premium that renders their use in commercial systems uneconomic except in very specific instances.
$2.28 $2.16 $2.12
$-
$0.50
$1.00
$1.50
$2.00
$2.50
100 kW 200 kW 500 kW
Syst
em P
rice
(201
5 $/
Wdc
)
Development Costs
Contingency
Sales Tax
EPC Overhead & Profit
Permitting and Interconnection
Engineering Design
Equipment Rental and Freight
Installation Labor
BOS
Racking Materials
Inverter
PV module

26
This report is available at no cost from the National Renewable Energy Laboratory (NREL) at www.nrel.gov/publications.
versus non-union labor depends strongly on the location of the system, because union strength, influence, and interest in solar construction projects vary materially from region to region. For example, interviews suggest that unions typically take a strong interest in large commercial projects in urban areas of Massachusetts, using their strength and influence in these localities to secure labor agreements with EPCs and developers. Ultimately, the degree of union labor utilization is intensely project specific and difficult to generalize on a national level. Therefore, for the commercial- and utility-scale modeling results, we analyze separate system prices assuming both union and non-union labor.
4.3.3 Developer Equipment Purchases to Avoid EPC Markups Many developers are beginning to procure modules, inverters, and even mounting systems for projects at their own cost to avoid EPC markups. For our commercial-scale benchmark, this direct procurement approach for modules, inverters, and racking could result in savings of up to $0.20/W.
4.3.4 Effect of Annual Sales Volumes on Development Costs We posit that the capacity sold over a fixed period (we assume annual periods) is more important than individual project sizes in driving per-watt development costs for developers targeting the small (500 kW or less) commercial market segment. This is a result of relatively fixed development costs on a per-project basis, with less cost sensitivity to the size of any one project. Figure 18 shows the dramatic per-watt development cost reductions with increasing total annual capacity sold, given our modeled 22-person development-only firm.
However, because annual volumes sold are a function of both the total number of projects sold and the average project size, there is strong incentive to pursue development of larger systems—all else being equal—if the number of projects that can be sold annually is limited by firm resources. In reality, additional considerations such as competitive market factors, portfolio and risk considerations, financing issues, and other dynamics may constrain a firm from pursuing ever-larger projects.
Figure 18. Development cost per watt as a function of annual commercial project volume
$3.61
$0.82
$0.47 $0.36
$-
$0.50
$1.00
$1.50
$2.00
$2.50
$3.00
$3.50
$4.00
1 5 10 15
Dev
elop
men
t Cos
ts (2
015
$/W
dc)
Annual Total Project Volume, MW
Personnel ExpenseOther ExpensesContingency

27
This report is available at no cost from the National Renewable Energy Laboratory (NREL) at www.nrel.gov/publications.
5 Utility-Scale System Benchmark 5.1 Utility Market Characteristics As Figure 19 shows, the U.S. utility-scale PV segment experienced very strong growth between 2010 and 2014 (82% CAGR). The utility segment is poised to grow at 33% annually between 2014 and 2016 (GTM Research and SEIA 2015, BNEF 2014, Deutsche Bank 2015), after which the ITC is scheduled to drop to 10%. The segment constituted 55% of the U.S. market in 2014, and it is expected to make up 50% of the market in 2016 (GTM Research and SEIA 2015, BNEF 2014). This segment is more sensitive to the scheduled ITC reduction than the residential and commercial segments, in part because of the relatively low electricity rates that utility systems generally compete against (wholesale rather than retail). If the scheduled ITC step down occurs after 2016, analysts estimate that utility-segment annual installed capacity will drop from 5,500 MW in 2016 to 640 MW in 2017 (average of GTM Research and SEIA 2015, BNEF 2014, Deutsche Bank 2015).
Utility-scale system installations have been heavily concentrated in California, and they were initially driven by state renewable portfolio standard requirements. Installations in North Carolina have grown rapidly since 2012, supported by a state tax credit (expiring at the end of 2015) as well as utility purchases driven by Public Utility Regulatory Policy Act (PURPA) provisions. Utility installations in other states such as Arizona and Nevada have been less consistent, with volatility in installed capacity year-on-year.
Figure 19. Annual utility PV market segment installed capacity by state, 2010–2014
-
500
1,000
1,500
2,000
2,500
3,000
3,500
4,000
4,500
2010 2011 2012 2013 2014
Annu
al In
stal
led
Capa
city
, MW
OTHERTXAZNVNCCA

28
This report is available at no cost from the National Renewable Energy Laboratory (NREL) at www.nrel.gov/publications.
5.2 Utility-Scale System Benchmark We model a 100-MW, 600-Vdc utility system using 72-cell, multicrystalline 310-W modules from a Tier 1 supplier, three-phase central inverters, and both fixed-tilt as well as single-axis tracking ground-mounted racking systems using driven-pile foundations that is construction in Q1 2015. We further model national capacity-weighted averages for non-union labor rates and sales tax rates. Finally, we separate our cost estimate into EPC and project-development functions. While some firms engage in both activities in an integrated manner, and potentially achieve lower pricing by reducing the total margin across functions, we feel the distinction helps highlight the specific cost trends and drivers associated with each function. Figure 20 presents a schematic of our utility-scale system cost model.
Figure 20. Schematic of utility system model
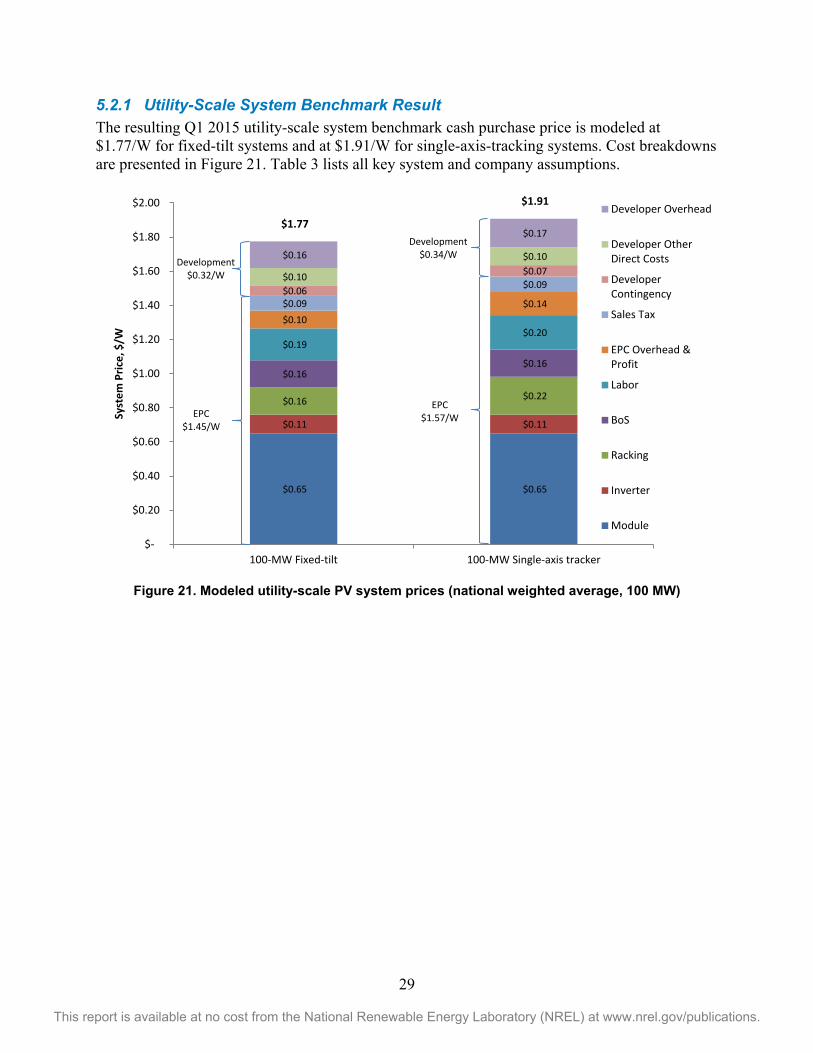
29
This report is available at no cost from the National Renewable Energy Laboratory (NREL) at www.nrel.gov/publications.
5.2.1 Utility-Scale System Benchmark Result The resulting Q1 2015 utility-scale system benchmark cash purchase price is modeled at $1.77/W for fixed-tilt systems and at $1.91/W for single-axis-tracking systems. Cost breakdowns are presented in Figure 21. Table 3 lists all key system and company assumptions.
Figure 21. Modeled utility-scale PV system prices (national weighted average, 100 MW)
$0.65 $0.65
$0.11 $0.11
$0.16 $0.22
$0.16 $0.16
$0.19 $0.20
$0.10 $0.14 $0.09
$0.09 $0.06
$0.07 $0.10
$0.10 $0.16
$0.17 $1.77
$1.91
$-
$0.20
$0.40
$0.60
$0.80
$1.00
$1.20
$1.40
$1.60
$1.80
$2.00
100-MW Fixed-tilt 100-MW Single-axis tracker
Syst
em P
rice,
$/W
Developer Overhead
Developer OtherDirect Costs
DeveloperContingency
Sales Tax
EPC Overhead &Profit
Labor
BoS
Racking
Inverter
Module
Development $0.34/W
Development $0.32/W
EPC $1.45/W
EPC $1.57/W

30
This report is available at no cost from the National Renewable Energy Laboratory (NREL) at www.nrel.gov/publications.
Table 3. Key Utility Modeling Assumptions
Category Modeled Price Description Sources
EPC-module ($/Wdc)
$0.65 Ex-factory gate prices BNEF (2014), GTM Research and SEIA (2015), industry interviews
EPC-inverter ($/Wac and $/Wdc)
$0.14 (AC) $0.11 (DC)
Ex-factory gate prices; assumes 1.3 inverter loading ratio
GTM Research and SEIA (2015), industry interviews
EPC-racking ($/Wdc)
$0.16 (fixed) $0.22 (tracker)
Ex-factory gate prices Industry interviews
EPC-BOS materials ($/Wdc)
$0.16 Ex-factory gate prices for switchgear, transformers, combiners, fuses, breakers, conductors, conduit, and all other ancillary equipment required to complete a system
RSMeans (2013), industry interviews
EPC-interconnection line costs
<10 MW, 0 miles; >200 MW, 5 miles at $500,000/mile; 10–200 MW, linear interpolation at $500,000/mile
All costs associated with construction of AC feeder lines from the main site to the substation at the point of interconnection to existing transmission lines
Industry interviews
EPC-installation Labor ($/Wdc)
$0.19 (fixed) $0.20 (tracker)
Uses national capacity-weighted-average labor rates
BLS (2013), RSMeans (2013), industry interviews
EPC-G&A 8% Markup on EPC direct costs Industry interviews
Development-land costs ($/Wdc)
$0.03 Costs associated with obtaining legal control of the site
Goodrich et al. (2012), industry interviews
Development-entitlement and environmental permitting costs
$500,000 in CA; $250,000 in other states
Land entitlement costs, including activities related to obtaining conditional use permits, and any related environmental studies and permitting
Industry interviews
Development-interconnection costs ($/Wdc)
$0.03 Interconnection costs, including all required studies and interconnection fees; does not include potential grid upgrades beyond the point of interconnection.
Industry interviews
Development-contingency (%)
4% Markup on developer direct costs Industry interviews
Development-overhead (%)
15% for systems <10 MW 10% for systems >100 MW Linear interpolation for systems 10–100 MW
Includes overhead expenses covering payroll, facilities, and other expenses across administrative, finance, legal, information technology, and other corporate functions
Industry interviews

31
This report is available at no cost from the National Renewable Energy Laboratory (NREL) at www.nrel.gov/publications.
5.2.2 Regional Variations in Price While our benchmark represents a national capacity-weighted average across various cost categories, we also model state-specific prices for the top five utility market states to present the variability of pricing by region (Figure 22).
Figure 22. Regional variations in utility-scale PV system price, 100-MW fixed-tilt systems using
non-union labor
For fixed-tilt systems, the maximum total price variation is $0.21/W across these states. EPC labor, overhead, and profit drive the majority of this variation, with a maximum EPC price spread of $0.15/W. Development costs show less geographic variation, with a maximum difference of $0.06/W across the top five states.
North Carolina enjoys low labor rates and relatively mild design conditions, contributing to the lowest total modeled price among the top five state markets. This low price has contributed to North Carolina’s rapid expansion of utility-scale capacity in recent years. However, modeling of all 50 states reveals a handful of potentially less-expensive states (Arkansas, Alabama, Oklahoma, and South Dakota) that host no appreciable utility-scale solar capacity; this illustrates the continued importance of state-level incentives and other market factors in driving utility-scale PV feasibility and adoption.
Because margins are difficult to generalize via markups, we assume a price that covers total developer cost and EPC price. In reality, market-specific attributes that are intensely local in nature (e.g., competing electricity rates, incentives available, intensity of competition) will determine the pricing achievable in any given regional market.
$0.65 $0.65 $0.65 $0.65 $0.65 $0.65
$0.11 $0.11 $0.11 $0.11 $0.11 $0.11
$0.16 $0.16 $0.17 $0.16 $0.16 $0.16
$0.16 $0.16 $0.16 $0.16 $0.16 $0.16
$0.19 $0.20 $0.11 $0.18 $0.14 $0.12
$0.10 $0.11 $0.08
$0.09 $0.07 $0.07
$0.09 $0.09
$0.06 $0.08
$0.08 $0.07
$0.32 $0.33
$0.27
$0.32 $0.31 $0.28
$1.77 $1.82
$1.61
$1.76 $1.68 $1.63
$-
$0.20
$0.40
$0.60
$0.80
$1.00
$1.20
$1.40
$1.60
$1.80
$2.00
U.S. Avg. CA NC NV AZ TX
Syst
em P
rice,
$/W
Development Costs
Sales Tax
EPC Overhead & Profit
Labor
BoS
Racking
Inverter
Module

32
This report is available at no cost from the National Renewable Energy Laboratory (NREL) at www.nrel.gov/publications.
5.2.3 Benchmark Comparison to Other Sources Our benchmarked price (Figure 21) includes an EPC price and all development costs, but we present our EPC-only price in Figure 23 to compare with cost-modeling results from GTM Research and SEIA (2015), which represent EPC prices in their utility PV system analysis. Note that for comparison to GTM and SEIA results, the prices shown in Figure 23 represent modeled EPC prices for 10-MW systems in California, whereas our benchmark results in Figure 21 represent a national weighted average for 10-MW systems.
Figure 23. Comparison of utility-scale system EPC prices (10-MW systems in California)
The benchmarked EPC prices vary predominantly in the assumptions for overhead and markup. Based on our industry interviews, our estimates include an 8%–10% markup on EPC direct costs to cover EPC overhead and profit.
5.2.4 Benchmark Trends Over Time As with our residential and commercial price benchmarks, utility system installed prices show a strong decrease (57% real) since our initial studies benchmarking Q4 2009 installation prices (Figure 24). However, because much of the price reductions were driven by declines in equipment prices that have slowed recently, system price declines have also slowed in the last few years.
$0.65 $0.70 $0.65 $0.70
$0.11 $0.16
$0.11 $0.16
$0.16 $0.14
$0.22 $0.23 $0.18 $0.08 $0.18 $0.13 $0.21 $0.19
$0.22 $0.20 $0.13 $0.31 $0.16
$0.38 $0.09
$0.10 $1.53 $1.58 $1.64
$1.80
$-
$0.20
$0.40
$0.60
$0.80
$1.00
$1.20
$1.40
$1.60
$1.80
$2.00
NREL Fixed Tilt1Q15
GTM/SEIA FixedTilt 1Q15
NRELSingle-Axis
Tracker 1Q15
GTM/SEIASingle-Axis
Tracker 1Q15
EPC
Pric
e (2
015
$/W
dc)
Sales Tax
EPC Overhead & Profit
Labor
BOS
Racking
Inverter
Module
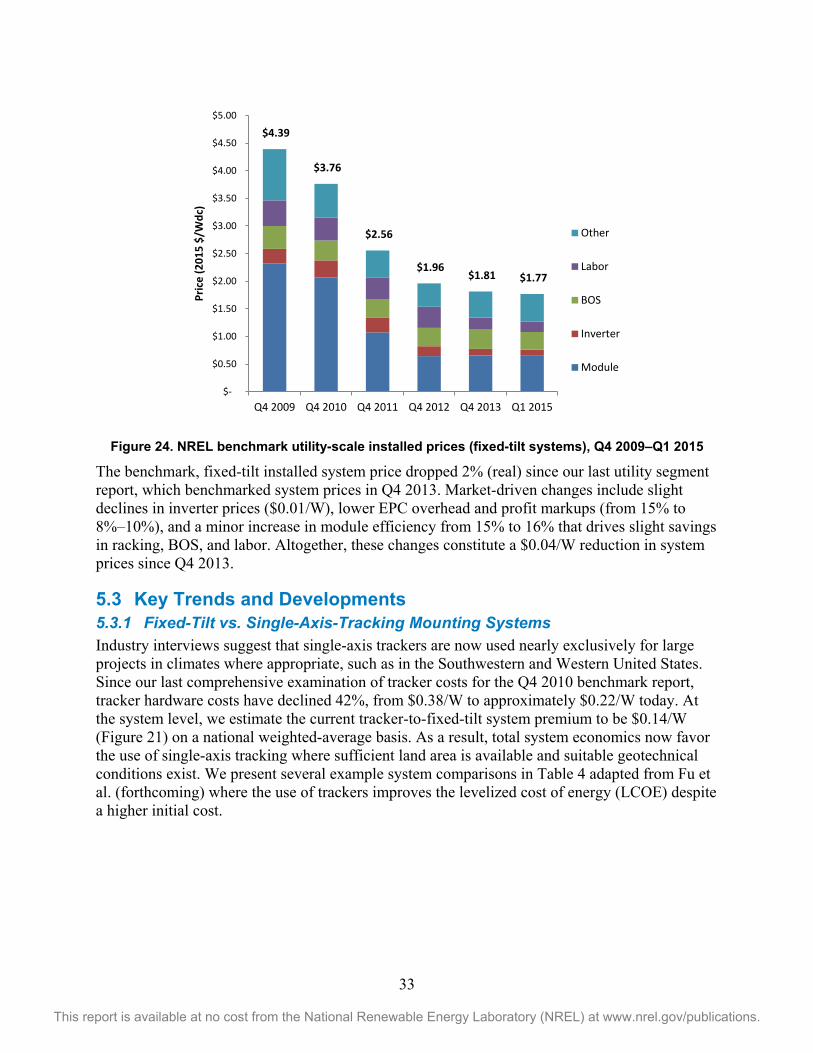
33
This report is available at no cost from the National Renewable Energy Laboratory (NREL) at www.nrel.gov/publications.
Figure 24. NREL benchmark utility-scale installed prices (fixed-tilt systems), Q4 2009–Q1 2015
The benchmark, fixed-tilt installed system price dropped 2% (real) since our last utility segment report, which benchmarked system prices in Q4 2013. Market-driven changes include slight declines in inverter prices ($0.01/W), lower EPC overhead and profit markups (from 15% to 8%–10%), and a minor increase in module efficiency from 15% to 16% that drives slight savings in racking, BOS, and labor. Altogether, these changes constitute a $0.04/W reduction in system prices since Q4 2013.
5.3 Key Trends and Developments 5.3.1 Fixed-Tilt vs. Single-Axis-Tracking Mounting Systems Industry interviews suggest that single-axis trackers are now used nearly exclusively for large projects in climates where appropriate, such as in the Southwestern and Western United States. Since our last comprehensive examination of tracker costs for the Q4 2010 benchmark report, tracker hardware costs have declined 42%, from $0.38/W to approximately $0.22/W today. At the system level, we estimate the current tracker-to-fixed-tilt system premium to be $0.14/W (Figure 21) on a national weighted-average basis. As a result, total system economics now favor the use of single-axis tracking where sufficient land area is available and suitable geotechnical conditions exist. We present several example system comparisons in Table 4 adapted from Fu et al. (forthcoming) where the use of trackers improves the levelized cost of energy (LCOE) despite a higher initial cost.
$4.39
$3.76
$2.56
$1.96 $1.81 $1.77
$-
$0.50
$1.00
$1.50
$2.00
$2.50
$3.00
$3.50
$4.00
$4.50
$5.00
Q4 2009 Q4 2010 Q4 2011 Q4 2012 Q4 2013 Q1 2015
Pric
e (2
015
$/W
dc)
Other
Labor
BOS
Inverter
Module

34
This report is available at no cost from the National Renewable Energy Laboratory (NREL) at www.nrel.gov/publications.
Table 4. 100-MW Fixed-Tilt System vs. Single-Axis-Tracking Systems
Fixed Tilt Installed
Price ($/W)
Tracker Installed
Price ($/W)
Tracker Price
Premium
Fixed Tilt LCOE
(₵/kWh)
Single-Axis Tracker LCOE
(₵/kWh)
Tracker LCOE
Improvement
Bakersfield, CA 1.82 1.96 7.7% 9.49 7.85 17.3%
Imperial Valley, CA 1.82 1.96 7.7% 8.58 6.99 18.5%
Prescott, AZ 1.68 1.80 7.1% 8.34 6.66 20.1%
Tucson, AZ 1.68 1.80 7.1% 8.04 6.46 19.7%
Las Vegas, NV 1.76 1.89 7.4% 8.34 6.70 19.7%
Albuquerque, NM 1.76 1.80 7.8% 8.11 6.60 18.6%
Alamosa, CO 1.67 1.80 7.8% 8.13 6.48 20.3%
Jacksonville, FL 1.67 1.73 7.5% 9.51 8.08 15.0%
San Antonio, TX 1.61 1.75 7.4% 9.38 8.04 14.3%
Newark, NJ 1.84 1.98 7.6% 11.78 10.33 12.3%
Orlando, FL 1.69 1.81 7.1% 10.58 9.11 13.9%
Kona, HI 1.88 2.02 7.5% 10.38 8.93 14.0%
5.3.2 Utility-Scale System Soft Costs While soft costs in the utility segment constitute the smallest percentage of total system price when compared to soft costs in the residential and commercial segments, there may be less opportunity for further utility-segment reductions. This is because, as modeled, most soft costs—excluding direct installation labor—are development activities where costs are somewhat out of the developer’s control. These include land acquisition ($0.03/W), environmental permitting and entitlement ($0.03/W),13 and interconnection studies and potential system upgrades ($0.03/W or more).
5.3.3 Developer Hardware Purchases to Avoid EPC Markups Developers are beginning to procure modules, inverters, and even mounting systems for projects at their own cost to avoid EPC markups. For our utility-scale benchmark, we still model hardware as purchased (and subsequently marked up) by the EPC firm. If a direct developer procurement approach is employed for modules, inverters, and racking, a savings of $0.07–0.08/W for fixed-tilt and single-axis-tracking systems, respectively is possible.
13 Site-specific issues and related additional abatement/control costs arising from permitting and entitlement can include environmental health and safety issues (e.g., dust generation and related public health risks), endangered species issues, cultural resource issues, and social issues (e.g., vandalism).

35
This report is available at no cost from the National Renewable Energy Laboratory (NREL) at www.nrel.gov/publications.
5.3.4 Effects of System Size and Labor Type on System Prices Figure 25 presents the effects of both system size and labor type on utility system pricing. Economies of scale are observed in both EPC and development activities, but they appear to reach diminishing returns above 100 MW regardless of the labor type employed. A 7% reduction in cost is modeled for 100-MW systems as compared to 10-MW systems.
The premium incurred by systems built with union labor (union pricing in red, non-union in blue) is approximately 12% regardless of system size. As noted before, the use of union versus non-union labor depends strongly on the location of the system. For example, interviews suggest that utility-scale projects in California attract much interest from unions in the state that can exert pressure on EPC and development firms through the project entitlement and permitting process. As a result, nearly all utility-scale projects in the state use at least some unionized labor.
Figure 25. Effects of scale and labor type on modeled utility-scale system price
$1.53 EPC
$1.75 EPC $1.46 $1.64 $1.46 $1.63 $1.45 $1.63
$0.44 Development
$0.48 Development
$0.37 $0.40
$0.32 $0.35
$0.32 $0.35
$1.91 $2.12
$1.83 $2.05
$1.77 $1.98
$1.77 $1.98
$-
$0.50
$1.00
$1.50
$2.00
$2.50
10-MWNon-Union
10-MWUnion
50-MWNon-Union
50-MWUnion
100-MWNon-Union
100-MWUnion
200-MWNon-Union
200-MWUnion
Pric
e (2
015
$/W
dc)
36
This report is available at no cost from the National Renewable Energy Laboratory (NREL) at www.nrel.gov/publications.
6 Summary 6.1 Overall Benchmark Prices Our Q1 2015 national weighted average price benchmark modeling results in $3.09/W for residential-scale systems, $2.16/W for commercial-scale systems, $1.77/W for fixed-tilt utility-scale systems, and $1.91/W for single-axis tracking utility-scale systems. Overall, modeled price declines between Q4 2013 and Q1 2015 are 7% for residential systems, 10% for commercial systems, and 2% for fixed-tilt utility systems.14
6.2 Price Trends and Drivers Hardware cost reductions have been an important driver of reductions in overall system cost in past years, but they may not contribute as much to overall system price declines going forward. Increased competition and resulting margin compression also contribute to price reductions, particularly for EPC firms building commercial- and utility-scale projects. Changes in additional specific cost categories and other drivers affecting prices are discussed in this section.
6.2.1 Labor Installation labor productivity and cost appear to be flat for residential- and commercial-scale systems, while utility-scale system labor costs have dropped 12% since Q4 2013. The use of union versus non-union labor can have a strong impact on system installation costs and prices. Projects employing all union labor are modeled at a 12% premium to projects using non-union labor. Unions typically focus their efforts on securing project labor agreements for large commercial- and utility-scale systems. The extent of union strength and influence, and therefore union labor utilization, is highly specific to project type, size, and geographic region.
6.2.2 Other Soft Costs Other soft costs remain a significant portion of total system price, particularly in the residential and commercial market segments. Much variability in residential soft costs remains, as firms engage in different customer-acquisition and growth strategies. Large residential integrators such as SolarCity and Vivint even report increases in customer-acquisition and overhead costs year-on-year, likely due to their aggressive approaches to increasing market share. On the other hand, PII costs have declined in part due to AHJ efforts to streamline permitting processes. Soft-cost improvements may be challenging for utility-scale systems, because many soft costs are somewhat out of the developer’s control, including land control, entitlement, environmental permitting, and interconnection costs.
6.2.3 Scale Scale remains an important factor in the development and construction of commercial- and utility-scale systems. Size-driven price declines of 7% are modeled for both commercial (going from 100 kW to 500 kW) and utility (going from 10 MW to 100 MW) systems.
14 As noted in Section 5, we last benchmarked single-axis tracking system prices for Q4 2010. Since then, single-axis tracking system prices have dropped 60%, from $4.74/W to $1.91/W for Q1 2015 (all in 2015 dollars).
37
This report is available at no cost from the National Renewable Energy Laboratory (NREL) at www.nrel.gov/publications.
6.2.4 Technical Trends In the commercial rooftop market segment, system architectures have shifted to employ larger, 72-cell modules along with larger string inverters up to 30 kilowatts AC (kWac). These inverters also typically operate at 1,000 Vdc, which drives multiple differences in the DC design when compared to 600-Vdc systems. Overall, we estimate the impact of these changes to be a $0.04/W decline in overall EPC costs for our benchmark 200-kW rooftop system.
In the utility market segment, significant cost reductions in single-axis-tracking mounting systems have resulted in much wider adoption of this technology for large systems where appropriate conditions exist. Despite a 7%–8% total system price premium for trackers, we estimate a 12%–20% LCOE improvement over fixed-tilt systems for various U.S. system locations.

38
This report is available at no cost from the National Renewable Energy Laboratory (NREL) at www.nrel.gov/publications.
References BNEF (Bloomberg New Energy Finance). 2014. H1 2014 US PV Market Outlook: Nickel-a-Pop PPAs. New York: Bloomberg New Energy Finance.
BNEF (Bloomberg New Energy Finance). 2013. US Solar Outlook (Presentation). Department of Defense Analyst Briefing. March 14, 2013.
BLS (U.S. Bureau of Labor Statistics). 2013. “Occupational Employment Statistics.” Accessed July 8, 2015. http://www.bls.gov/oes/tables.htm.
Case, Tyler. 2012. “US Cost of Doing Business: Costs Fall in 2010.” Moody’s Analytics Regional Financial Review, September 2012.
CSI (California Solar Initiative). 2013. “CSI Working Data Set.” Accessed July 8, 2015. https://www.californiasolarstatistics.ca.gov/current_data_files/.
Davidson, Carolyn, Ted L. James, Robert Margolis, Ran Fu, and David Feldman. 2014. U.S. Residential Photovoltaic (PV) System Prices, Q4 2013 Benchmarks: Cash Purchase, Fair Market Value, and Prepaid Lease Transaction Prices. Golden, CO: National Renewable Energy Laboratory. NREL/TP-6A20-62671.
Deutsche Bank Markets Research. 2015. Crossing the Chasm. Frankfurt: Deutsche Bank.
“Database of State Incentives for Renewables & Efficiency® - DSIRE.” 2015. Accessed July 8, 2015. http://www.dsireusa.org.
Feldman, David, Barry Friedman, and Robert Margolis. 2013. Financing, Overhead, and Profit: An In-Depth Discussion of Costs Associated with Third-Party Financing of Residential and Commercial Photovoltaic Systems. Golden, CO: National Renewable Energy Laboratory. NREL/TP-6A20-60401.
Feldman, David, Galen Barbose, Robert Margolis, Ted James, Samantha Weaver, Naim Darghouth, Ran Fu, Carolyn Davidson, Sam Booth, and Ryan Wiser. 2014. Photovoltaic System Pricing Trends: Historical, Recent, and Near-Term Projections. 2014 Edition (Presentation). Golden, CO: National Renewable Energy Laboratory. NREL/PR-6A20-62558.
Feldman, David, Robert Margolis, and Daniel Boff. 2015. Q3/Q4 ’14 Industry Update (Presentation). SunShot – U.S Department of Energy. January 2015.
Fu, Ran, Ted L. James, Donald Chung, Douglas Gagne, Anthony Lopez, and Aron Dobos. Forthcoming. Economic Competitiveness of U.S. Utility-Scale Photovoltaic Systems in 2015: Regional Cost Modeling of Installed Cost ($/W) and LCOE ($/kWh). Submitted to IEEE Journal of Photovoltaics.
Fu, Ran, Ted L. James, and Michael Woodhouse. 2015. “Economic Measurements of Polysilicon for the Photovoltaic Industry: Market Competition and Manufacturing Competitiveness.” IEEE Journal of Photovoltaics 5:515–524.

39
This report is available at no cost from the National Renewable Energy Laboratory (NREL) at www.nrel.gov/publications.
Goodrich, Alan, Ted L. James, and Michael Woodhouse. 2012. Residential, Commercial, and Utility-Scale Photovoltaic (PV) System Prices in the United States: Current Drivers and Cost Reduction Opportunities. Golden, CO: National Renewable Energy Laboratory. NREL/TP-6A20-53347.
GTM Research. 2013. U.S. Residential Solar PV Customer Acquisition: Strategies, Costs and Vendors. Boston: Greentech Media.
GTM Research. 2015. The Global PV Inverter Landscape 2015: Technologies, Markets and Prices. Boston: Greentech Media.
GTM Research and SEIA (Solar Energy Industries Association). 2013. U.S. Solar Market Insight Report, Q1 2013. Washington, DC: Solar Energy Industries Association.
GTM Research and SEIA (Solar Energy Industries Association). 2014. U.S. Solar Market Insight Report, Q1 2014. Washington, DC: Solar Energy Industries Association.
GTM Research and SEIA (Solar Energy Industries Association). 2015. U.S. Solar Market Insight Report, Q1 2015. Washington, DC: Solar Energy Industries Association.
International Chamber of Commerce. n.d. “Rules for Any Mode or Modes of Transport.” Accessed July 8, 2015. http://www.iccwbo.org/products-and-services/trade-facilitation/incoterms-2010/the-incoterms-rules/.
Munsell, Mike. 2014. “Top 10 Installers Eclipse 50% of US Residential PV Market in Q1 2014.” Greentech Solar. July 3, 2014. Accessed July 8, 2015. http://www.greentechmedia.com/articles/ read/top-10-installers-eclipse-50-of-us-residential-pv-market-in-q1-2014.
R.S. Means Company, ed. 2015. RSMeans Building Construction Cost Data 2015, 73rd annual edition. Norwell, MA: RSMeans.
R.S. Means Company, ed. 2013. RSMeans Electrical Cost Data, 36th Edition. Norwell, MA: RSMeans.
SolarCity. 2015. “Q1 2015 Review (Presentation).” May 5. From SolarCity events and presentations website. Accessed July 8, 2015. http://files.shareholder.com/downloads/AMDA-14LQRE/4156104285x0x826549/9C67642E-1399-4D86-BB22-4C7F8A2E0428/SolarCity_1Q15_Earnings_Presentation_FINAL2.pdf.
Sol Systems. 2015. “Sol Project Finance Journal: June 2015.” Accessed July 8, 2015.
SPV Market Research. 2015. Photovoltaic Manufacturer Capacity, Shipments, Price & Revenues 2014/2015. San Francisco: SPV Market Research.
Vivint. 2015. “Q1 2015 Financial Results Conference Call (Presentation).” May 12. From Vivint Solar investor relations website. Accessed July 8, 2015. http://investors.vivintsolar.com/files/ doc_presentations/VSLR_Q1_2015_v001_k8ys33.pdf.

40
This report is available at no cost from the National Renewable Energy Laboratory (NREL) at www.nrel.gov/publications.
Vote Solar. 2015. “Project Permit.” Accessed July 8, 2015. http://projectpermit.org/2013/02/06/best-practices/.
Vote Solar and IREC (Interstate Renewable Energy Council). 2013. Project Permit: Best Practices in Residential Solar Permitting. San Francisco: Vote Solar Initiative.

41
This report is available at no cost from the National Renewable Energy Laboratory (NREL) at www.nrel.gov/publications.
Appendix: Residential Racking Prices The decline in pitched-roof residential mounting system prices since 2012 has been drastic, with observed factory gate prices dropping approximately 68% between 2012 and Q1 2015 for a typical system. While this is in part due to an increase in competition among racking manufacturers, we investigate other means by which prices and costs have been reduced in this product category, and we identify several key factors driving down prices. Our analysis finds that these factors can account for a 50% decrease in costs compared with a 2012 baseline scenario.
Aluminum prices are trending downward. Annual average aluminum prices dropped nearly 12% between 2012 and 2015 (average through June 18, 2015).15 In most residential systems, the rails, rail splices, and supports (“L-feet”) are formed as aluminum extrusions and then cut, machined, and otherwise processed into final form. The extrusion process is subcontracted to generalist aluminum extruders, while the final processing is typically performed by specialist PV-racking manufacturers. In our analysis, we assume a constant tolling markup charge for extrusion services, and thus we assume extrusion costs change proportionately with changes in average aluminum prices. Extrusion prices are also volume driven, and while we do not attempt to quantify volume-pricing tiers, we do note that approximate racking volumes in the residential sector increased 133% between 2012 and 2014, based on residential market sector size and increasing module efficiencies over the same period. This suggests room for racking manufacturers to negotiate better pricing from their extrusion partners based on volume growth alone.
Aluminum use is reduced through optimized design. As competition has increased, racking manufacturers have applied focused rail design optimization efforts to drive down the amount of aluminum used in their products without compromising strength. A review of one manufacturer’s specifications shows that 15% less aluminum per foot is used in the company’s newer rail product compared to its 2012 product, while equivalent strength is maintained. Other manufacturers have noted that aluminum use among equivalent modern products can vary by as much as 30%, further indicating that significant material use and cost reductions are possible through optimized rail engineering and design.
A second factor effectively reducing aluminum use is the preference of some installers for a shorter maximum span between supports, enabling the use of lighter, lower-strength rails. While this is at first counterintuitive, because shorter spans result in more roof penetrations (and more subsequent labor and materials), it is driven by a desire to streamline the permitting process. Some jurisdictions employ prescriptive permitting, wherein standard requirements for design elements such as rail span are predefined (and are typically conservative from a safety point of view). Review and approval of designs meeting these prescriptive standards are accelerated over more customized designs outside of prescriptive requirements, and thus the standard designs are sometimes preferred by installers. In comparing rails capable of spanning up to eight feet in most conditions to rails optimized to span only four feet, a 44% reduction in aluminum use is possible.
15 Aluminum price data are from the London Metal Exchange, January 1, 2010 through June 18, 2015. They were accessed online via Bloomberg L.P., June 19, 2015.

42
This report is available at no cost from the National Renewable Energy Laboratory (NREL) at www.nrel.gov/publications.
Increased module efficiency reduces racking costs per watt. Because racking hardware costs are sensitive to module count and dimensions, increasing module efficiency can reduce racking costs per watt. When using 60-cell form factor modules, rail cost per watt can be reduced approximately 0.95% for every 1% relative increase in module efficiency. If 230-W, 14.8%-efficient modules were the norm in 2012, and 250-W, 16.1%-efficient modules are the norm in Q1 2015 (an 8.7% relative increase in efficiency), this enables an 8% reduction in per-watt costs for rails, all else held equal.
Putting the pieces together results in 35%–50% per-watt cost reductions. We estimate potential price differentials by incorporating all of the factors noted above into a comprehensive analysis. We begin by establishing a baseline configuration using 230-W, 14.8%-efficient modules mounted on a racking system capable of spanning up to eight feet, intended to represent the available hardware and prevailing design philosophy in 2012.
Figure A-1 presents the per-watt savings possible from the 2012 baseline by employing either a “medium” rail capable of spanning four feet in most U.S. environmental conditions or a “light” rail capable of spanning four feet in less rigorous conditions, such as those found in most of Arizona or California. The results demonstrate that the factors identified can drive cost reductions of 35% to 50% compared with the baseline scenario.
Figure A-1. Change in per-watt rail cost compared with 2012 baseline
While this might not fully explain the observed market price reduction of 68% since 2012, the identified factors clearly contribute substantially to cost and price declines. However, the mechanisms identified might have limited efficacy going forward, or the improvements might be somewhat out of racking manufacturers’ control. Design optimization will certainly continue, but diminishing returns to this approach are likely, assuming systems based on extruded aluminum, especially as maximum spans cannot easily be reduced further (typical residential roof joist spacing is two feet on center, and installers may find such small spans impractical from a physical installation perspective even if less-expensive racking materials could be used). Other factors, such as aluminum commodity pricing and module efficiency, are not within manufacturers’ control, though module efficiency is expected to continue increasing over time. For this reason, it is unclear whether such large reductions in mounting system cost and price will be sustainable in coming years.