U.S. Manufacturing in International Perspective
19
U.S. Manufacturing in International Perspective Marc Levinson Section Research Manager January 18, 2017 Congressional Research Service 7-5700 www.crs.gov R42135
Transcript of U.S. Manufacturing in International Perspective
U.S. Manufacturing in
International Perspective
Marc Levinson
Section Research Manager
January 18, 2017
Congressional Research Service
7-5700
www.crs.gov
R42135

U.S. Manufacturing in International Perspective
Congressional Research Service
Summary The health of the U.S. manufacturing sector has long been of great concern to Congress. The
decline in manufacturing employment since the start of the 21st century has stimulated particular
congressional interest, leading Members to introduce hundreds of bills over many sessions of
Congress intended to support domestic manufacturing activity in various ways. The proponents of
such measures frequently contend that the United States is by various measures falling behind
other countries in manufacturing, and they argue that this relative decline can be mitigated or
reversed by government policy.
This report is designed to inform the debate over the health of U.S. manufacturing through a
series of charts and tables that depict the position of the United States relative to other countries
according to various metrics. Understanding which trends in manufacturing reflect factors that
may be unique to the United States and which are related to broader changes in technology or
consumer preferences may be helpful in formulating policies intended to aid firms or workers
engaged in manufacturing activity. This report does not describe or discuss specific policy
options.
The main findings are the following:
The United States’ share of global manufacturing activity declined from 28% in
2002, following the end of the 2001 U.S. recession, to 16.5% in 2011. Since then,
the U.S. share has risen to 18.6%, the largest share since 2009. These estimates
are based on the value of each country’s manufacturing in U.S. dollars; part of
the decline in the U.S. share was due to a 23% decline in the value of the dollar
between 2002 and 2011, and part of the rise since 2011 is attributable to a
stronger dollar.
China displaced the United States as the largest manufacturing country in 2010.
Again, part of China’s rise by this measure has been due to the appreciation of its
currency, the renminbi, against the U.S. dollar. The reported size of China’s
manufacturing sector decreased slightly in 2015 due to currency adjustments.
Manufacturing output, measured in each country’s local currency adjusted for
inflation, has been growing more slowly in the United States than in China,
South Korea, Germany, and Mexico, but more rapidly than in most European
countries and Canada.
Employment in manufacturing has fallen in most major manufacturing countries
over the past quarter-century. In the United States, manufacturing employment
since 1990 has declined in line with the changes in Western Europe and Japan,
although the timing of the decline has differed from country to country.
U.S. manufacturers spend far more on research and development (R&D) than
those in any other country, but manufacturers’ R&D spending is rising more
rapidly in several other countries.
Manufacturers in many countries appear to be spending increasing amounts on
R&D, relative to their value added. U.S. manufacturers spend approximately
11% of value added on R&D, an increase of more than three percentage points
since 2002. A large proportion of U.S. manufacturers’ R&D takes place in high-
technology sectors, such as pharmaceutical, electronics, and aircraft
manufacturing, whereas in most other countries the largest share of R&D occurs
in medium-technology sectors such as automotive and machinery manufacturing.

U.S. Manufacturing in International Perspective
Congressional Research Service
Contents
Introduction ..................................................................................................................................... 1
How the U.S. Manufacturing Sector Ranks .................................................................................... 1
The Role of Services in Manufacturing ........................................................................................... 7
Manufacturing Work ........................................................................................................................ 9
Technology and Research in Manufacturing ................................................................................. 14
Figures
Figure 1. Leading Countries, Value Added in Manufacturing ......................................................... 2
Figure 2. Selected Countries’ Shares of Global Manufacturing Value Added ................................. 3
Figure 3. Share of Manufacturing in National Economies .............................................................. 4
Figure 4. Change in Value Added in Manufacturing, 2008-2015 .................................................... 5
Figure 5. Domestic Value in Exports of Transport Equipment ........................................................ 6
Figure 6. Domestic Value in Exports of Electrical and Optical Equipment .................................... 6
Figure 7. Investment in Manufacturing Fixed Capital as Share of GDP, 2015 ............................... 7
Figure 8. Service-Sector Inputs into Manufacturing Exports .......................................................... 9
Figure 9. Manufacturing Employment .......................................................................................... 10
Figure 10. Manufacturing Employment ........................................................................................ 10
Figure 11. Output per Labor Hour in Manufacturing ..................................................................... 11
Figure 12. R&D in Manufacturing, 2014 ...................................................................................... 15
Figure 13. Growth in Manufacturing R&D ................................................................................... 15
Figure 14. Manufacturing R&D as Share of Manufacturing Value Added ................................... 15
Tables
Table 1. Hourly Compensation Costs in Manufacturing ............................................................... 12
Table 2. Hourly Compensation Costs in Selected Manufacturing Industries ................................ 13
Table 3. Manufacturers’ R&D Spending by Sector, 2014 ............................................................. 16
Contacts
Author Contact Information .......................................................................................................... 16

U.S. Manufacturing in International Perspective
Congressional Research Service 1
Introduction The health of the U.S. manufacturing sector has long been of great concern to Congress. The
large decline in manufacturing employment since the start of the 21st century has stimulated
particular congressional interest. Over the years, Members have introduced hundreds of bills
intended to support domestic manufacturing activity in various ways. The proponents of such
measures frequently contend that the United States is in some way falling behind other countries
in manufacturing, and argue that this relative decline can be mitigated by government policy.
Examining U.S. manufacturing in isolation sheds little light on the causes of changes in the
manufacturing sector. While some of those changes may be a result of factors specific to the
United States, others may be attributable to technological advances, shifting consumer
preferences, or macroeconomic forces such as exchange-rate movements. This report is designed
to inform the debate over manufacturing policy by examining changes in the manufacturing
sector in comparative perspective. It does not describe or discuss specific policy options.
The charts and tables on the pages that follow depict the position of the United States relative to
other major manufacturing countries according to various metrics. Not all countries compile
information on each subject. This report draws on data from a number of sources, and has certain
unavoidable statistical problems of which the reader should be aware.
Despite meaningful progress in standardization, countries define “manufacturing” in different
ways. Some associate manufacturing with factory production, while others may label a self-
employed artisan as a manufacturing worker. Some countries have sophisticated sampling
systems to collect data about production and employment from firms and households, whereas
others rely heavily on estimates drawn from macroeconomic models or collect data only from a
non-random subset of enterprises. International comparisons of compensation data are especially
difficult because of national differences in taxation and employee benefits. Complicating matters
further, the organizations that compile statistics obtained from national governments may adjust
the raw data in different ways to improve compatibility, such that certain figures used to prepare
this report may not be identical to those published by national statistical services.
Additionally, analysis of trends in manufacturing is complicated by often arbitrary distinctions
between manufacturing and non-manufacturing activity. If, for example, a manufacturing firm
owns the trucks that deliver its goods, statisticians may count the truck drivers as manufacturing-
sector workers, and their wages may be included in manufacturing value added. If the
manufacturer instead contracts with a separate trucking company to deliver its goods, statisticians
will consider the truck drivers to be transport-sector workers and their wages will be included in
transport-sector value added, making the manufacturing sector appear smaller—even though
there has been no change in the total amount of labor or the tasks performed.
All of these factors argue for caution in the use of these data, and warn against unwarranted
assumptions of precision.
How the U.S. Manufacturing Sector Ranks The standard measure of the size of a nation’s manufacturing sector is not manufacturers’ sales,
but rather their value added. Value added attempts to capture the economic contribution of
manufacturers in designing, processing, and marketing the products they sell.
At the level of an individual firm, value added can be calculated as total sales less the total cost of
purchased inputs, such as raw materials and electricity. Thus, a firm that purchases raw materials
U.S. Manufacturing in International Perspective
Congressional Research Service 2
and processes them only slightly may have substantial sales, but will produce little value added.
Alternatively, a firm’s value added can be measured as the sum of its employee compensation,
business taxes (less subsidies), and profits.
The size of a country’s manufacturing sector cannot be determined simply by adding up the value
added of its manufacturers. If a domestic manufacturer uses inputs from its plants abroad, those
inputs contain value added by the firm, but not domestically. Calculating total value added in
manufacturing thus requires adjustments for imported parts and components incorporated into the
output of domestic factories, and also for domestic goods and services that were exported and
used in another country to make products that were subsequently imported.
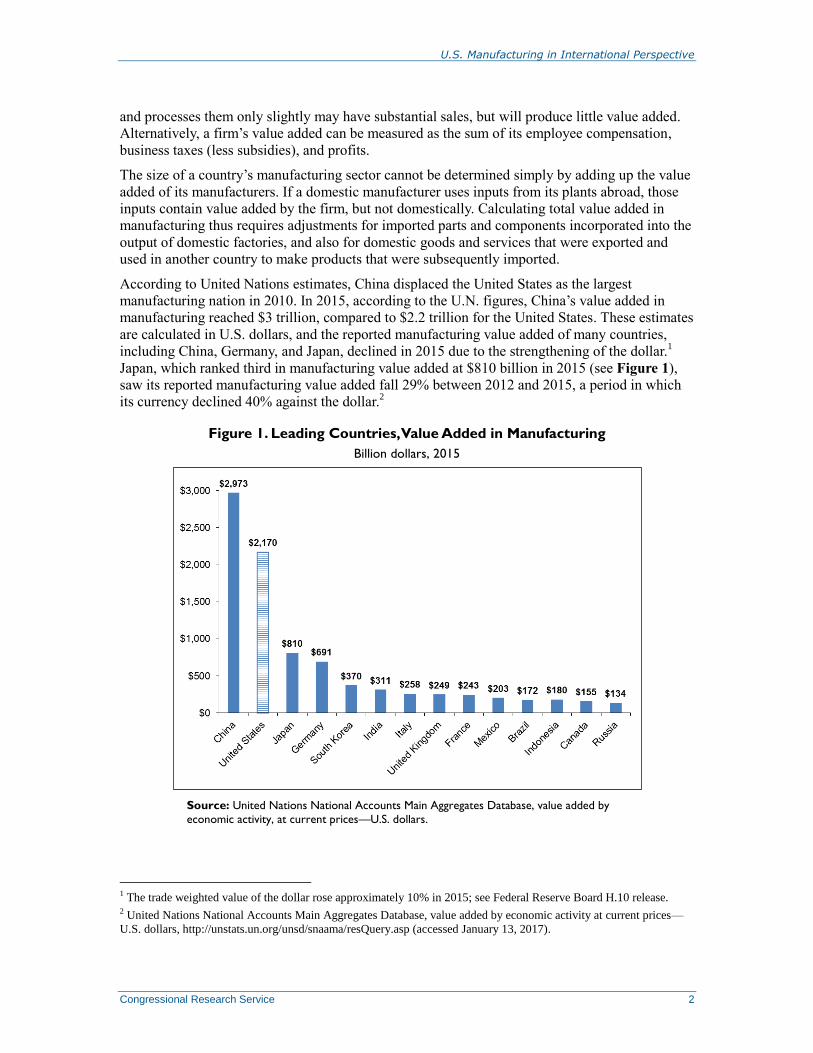
According to United Nations estimates, China displaced the United States as the largest
manufacturing nation in 2010. In 2015, according to the U.N. figures, China’s value added in
manufacturing reached $3 trillion, compared to $2.2 trillion for the United States. These estimates
are calculated in U.S. dollars, and the reported manufacturing value added of many countries,
including China, Germany, and Japan, declined in 2015 due to the strengthening of the dollar.1
Japan, which ranked third in manufacturing value added at $810 billion in 2015 (see Figure 1),
saw its reported manufacturing value added fall 29% between 2012 and 2015, a period in which
its currency declined 40% against the dollar.2
Figure 1. Leading Countries, Value Added in Manufacturing
Billion dollars, 2015
Source: United Nations National Accounts Main Aggregates Database, value added by
economic activity, at current prices—U.S. dollars.
1 The trade weighted value of the dollar rose approximately 10% in 2015; see Federal Reserve Board H.10 release. 2 United Nations National Accounts Main Aggregates Database, value added by economic activity at current prices—
U.S. dollars, http://unstats.un.org/unsd/snaama/resQuery.asp (accessed January 13, 2017).
U.S. Manufacturing in International Perspective
Congressional Research Service 3
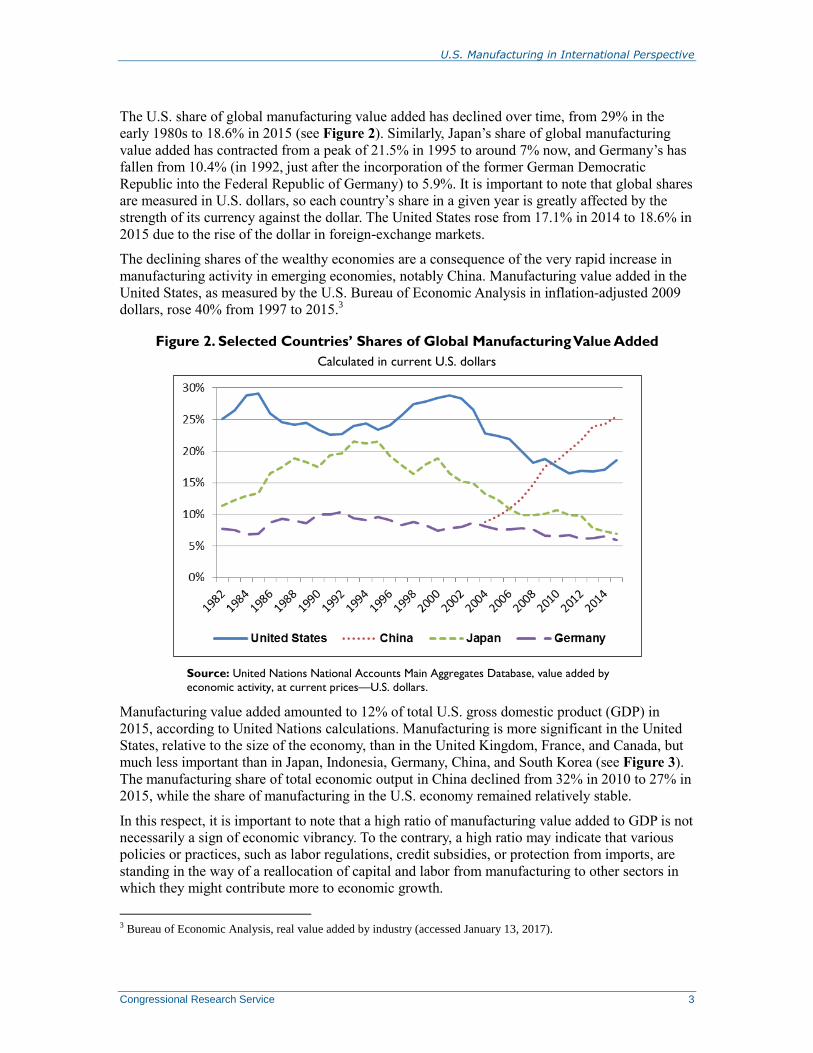
The U.S. share of global manufacturing value added has declined over time, from 29% in the
early 1980s to 18.6% in 2015 (see Figure 2). Similarly, Japan’s share of global manufacturing
value added has contracted from a peak of 21.5% in 1995 to around 7% now, and Germany’s has
fallen from 10.4% (in 1992, just after the incorporation of the former German Democratic
Republic into the Federal Republic of Germany) to 5.9%. It is important to note that global shares
are measured in U.S. dollars, so each country’s share in a given year is greatly affected by the
strength of its currency against the dollar. The United States rose from 17.1% in 2014 to 18.6% in
2015 due to the rise of the dollar in foreign-exchange markets.
The declining shares of the wealthy economies are a consequence of the very rapid increase in
manufacturing activity in emerging economies, notably China. Manufacturing value added in the
United States, as measured by the U.S. Bureau of Economic Analysis in inflation-adjusted 2009
dollars, rose 40% from 1997 to 2015.3
Figure 2. Selected Countries’ Shares of Global Manufacturing Value Added
Calculated in current U.S. dollars
Source: United Nations National Accounts Main Aggregates Database, value added by
economic activity, at current prices—U.S. dollars.
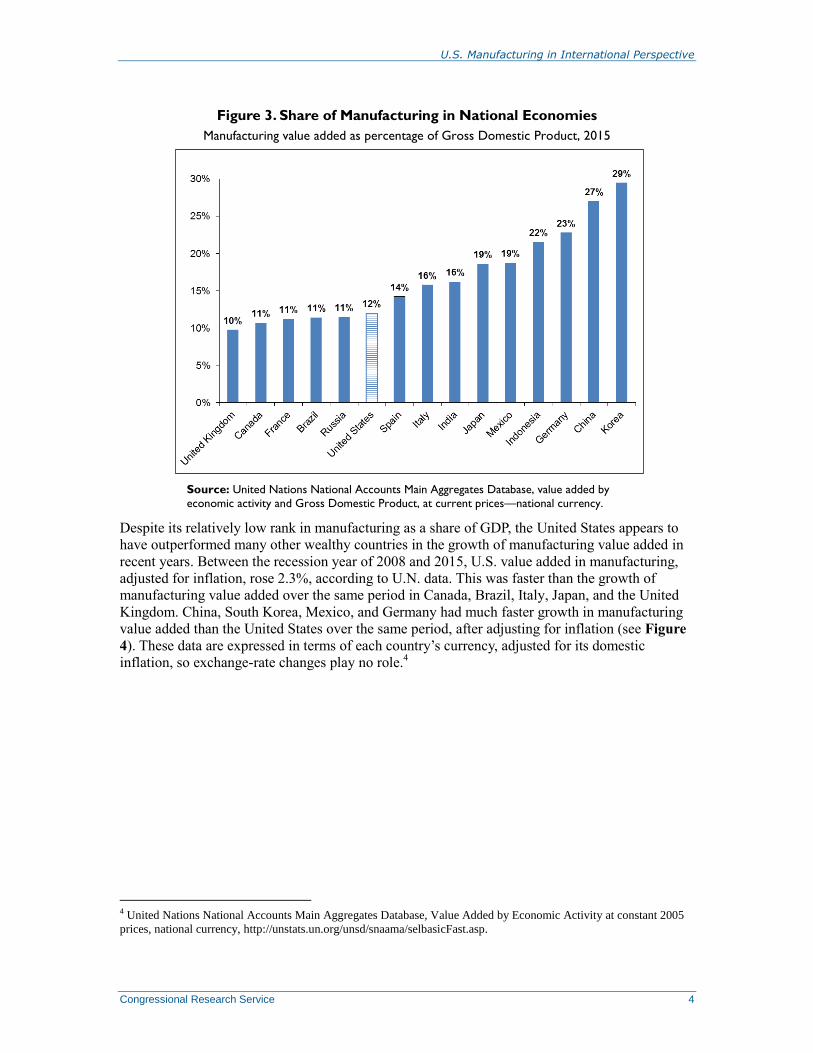
Manufacturing value added amounted to 12% of total U.S. gross domestic product (GDP) in
2015, according to United Nations calculations. Manufacturing is more significant in the United
States, relative to the size of the economy, than in the United Kingdom, France, and Canada, but
much less important than in Japan, Indonesia, Germany, China, and South Korea (see Figure 3).
The manufacturing share of total economic output in China declined from 32% in 2010 to 27% in
2015, while the share of manufacturing in the U.S. economy remained relatively stable.
In this respect, it is important to note that a high ratio of manufacturing value added to GDP is not
necessarily a sign of economic vibrancy. To the contrary, a high ratio may indicate that various
policies or practices, such as labor regulations, credit subsidies, or protection from imports, are
standing in the way of a reallocation of capital and labor from manufacturing to other sectors in
which they might contribute more to economic growth.
3 Bureau of Economic Analysis, real value added by industry (accessed January 13, 2017).
U.S. Manufacturing in International Perspective
Congressional Research Service 4
Figure 3. Share of Manufacturing in National Economies
Manufacturing value added as percentage of Gross Domestic Product, 2015
Source: United Nations National Accounts Main Aggregates Database, value added by
economic activity and Gross Domestic Product, at current prices—national currency.
Despite its relatively low rank in manufacturing as a share of GDP, the United States appears to
have outperformed many other wealthy countries in the growth of manufacturing value added in
recent years. Between the recession year of 2008 and 2015, U.S. value added in manufacturing,
adjusted for inflation, rose 2.3%, according to U.N. data. This was faster than the growth of
manufacturing value added over the same period in Canada, Brazil, Italy, Japan, and the United
Kingdom. China, South Korea, Mexico, and Germany had much faster growth in manufacturing
value added than the United States over the same period, after adjusting for inflation (see Figure
4). These data are expressed in terms of each country’s currency, adjusted for its domestic
inflation, so exchange-rate changes play no role.4
4 United Nations National Accounts Main Aggregates Database, Value Added by Economic Activity at constant 2005
prices, national currency, http://unstats.un.org/unsd/snaama/selbasicFast.asp.

U.S. Manufacturing in International Perspective
Congressional Research Service 5
Figure 4. Change in Value Added in Manufacturing, 2008-2015
Adjusted for inflation in each respective country
Source: United Nations National Accounts Main Aggregates Database, value added by
economic activity at constant 2005 prices, national currency.
Domestic value added accounts for a comparatively high proportion of the value of U.S.
manufactured exports. In other words, U.S. manufacturers use relatively fewer imported inputs
and more domestically produced inputs, compared to manufacturers in other countries, with the
notable exception of Japan. In 2011, the most recent year for which data are available, 78.5% of
the value of U.S. manufactured exports was added in the United States. By contrast, less than
60% of the value of manufactured goods exported by China, South Korea, and Mexico was added
in those countries.5
The proportion of domestic content varies considerably by product, depending mainly on the
extent of international supply chains. For example, 65% of the value of U.S. exports of motor
vehicles in 2011 was added in the United States. This was on a par with France, Germany, and
Italy, but considerably less than Japan (see Figure 5). With respect to exports of electrical and
optical equipment, the share of value added domestically is greater for the United States (85%)
than for any other country. Although China is by far the largest exporter of such products, less
than half the value of its exports is added within the country.6
5 Calculated from Organisation for Economic Co-operation and Development (OECD), Trade in Value Added, Origin
of Value Added in Gross Exports (accessed January 17, 2017). 6 Ibid.

U.S. Manufacturing in International Perspective
Congressional Research Service 6
Figure 5. Domestic Value in Exports of
Transport Equipment
2011
Source: OECD-WTO Trade in Value Added, Value
Added in Gross Exports by Source.
Figure 6. Domestic Value in Exports of
Electrical and Optical Equipment
2011
Source: OECD-WTO Trade in Value Added, Value
Added in Gross Exports by Source.
The United States has performed well in manufacturing, compared to other high-income
economies, when viewed over a longer time period. From 1990 through 2015, the only high-
income countries with faster growth in manufacturing value added were a handful of smaller
economies including Finland, Israel, and Sweden, as well as South Korea.
Additionally, data on inflows of foreign investment suggest that the United States has been an
attractive manufacturing location relative to other high-income countries in recent years. In 2014,
67% of foreign direct investment coming into the United States went into the manufacturing
sector. Of this, some $122 billion, or 43%, involved acquisition of pharmaceutical
manufacturers.7 The limited data on other wealthy countries show much smaller flows of foreign
investment into manufacturing.8 However, it is possible that recent data on foreign investment in
U.S. manufacturing have been affected by “inversions,” in which U.S. corporations become
wholly owned subsidiaries of foreign corporations for tax reasons. If a U.S. manufacturer moves
its headquarters abroad as the result of an inversion, its stock of fixed capital in the United States
is reclassified as foreign-owned, and any future capital investment will be counted as foreign
direct investment rather than domestic investment.9
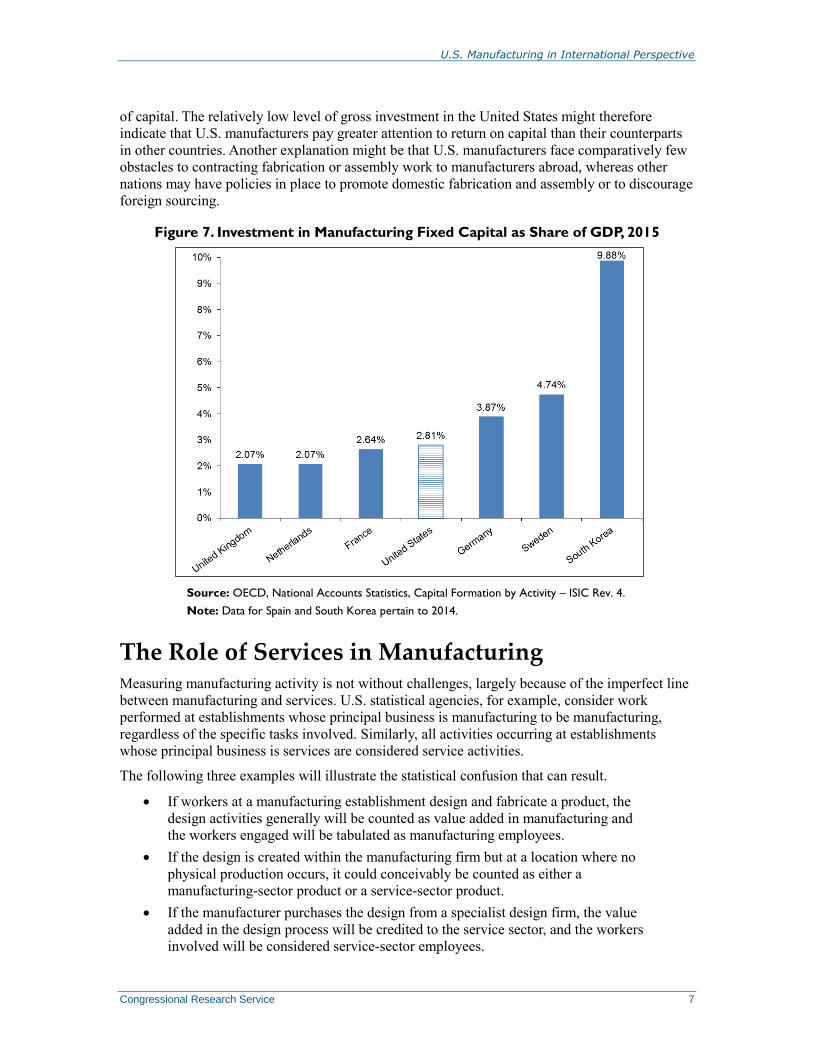
Data permitting international comparisons of capital investment in manufacturing are available
for only a few countries. These indicate that U.S. gross investment in fixed manufacturing capital,
such as factories and equipment, is in about the same range as in West European economies, but
much lower than in South Korea (see Figure 7).10
Interpreting these data on investment in manufacturing is problematic. A high ratio of gross fixed
capital formation to output is not necessarily positive from an economic point of view; if such
investment is generating a low return, then high capital investment could indicate inefficient use
7 U.S. Bureau of Economic Analysis, “New Foreign Direct Investment in the United States, 2014 and 2015,” July 13,
2016, https://www.bea.gov/newsreleases/international/fdi/2016/pdf/fdi0716.pdf, Table 1.2. 8 OECD International Direct Investment Statistics, “Foreign direct investment: financial flows by industry,” accessed
January 17, 2017. 9 Jessica M. Hanson, Howard I. Krakower, Raymond J. Mataloni Jr., and Kate L.S. Pinard, “The Effects of Corporate
Inversions on the International and National Economic Accounts,” Survey of Current Business, February 2015. 10 OECD National Accounts Statistics, Capital formation by activity – ISIC Rev. 4 (accessed January 17, 2017).
U.S. Manufacturing in International Perspective
Congressional Research Service 7
of capital. The relatively low level of gross investment in the United States might therefore
indicate that U.S. manufacturers pay greater attention to return on capital than their counterparts
in other countries. Another explanation might be that U.S. manufacturers face comparatively few
obstacles to contracting fabrication or assembly work to manufacturers abroad, whereas other
nations may have policies in place to promote domestic fabrication and assembly or to discourage
foreign sourcing.
Figure 7. Investment in Manufacturing Fixed Capital as Share of GDP, 2015
Source: OECD, National Accounts Statistics, Capital Formation by Activity – ISIC Rev. 4.
Note: Data for Spain and South Korea pertain to 2014.
The Role of Services in Manufacturing Measuring manufacturing activity is not without challenges, largely because of the imperfect line
between manufacturing and services. U.S. statistical agencies, for example, consider work
performed at establishments whose principal business is manufacturing to be manufacturing,
regardless of the specific tasks involved. Similarly, all activities occurring at establishments
whose principal business is services are considered service activities.
The following three examples will illustrate the statistical confusion that can result.
If workers at a manufacturing establishment design and fabricate a product, the
design activities generally will be counted as value added in manufacturing and
the workers engaged will be tabulated as manufacturing employees.
If the design is created within the manufacturing firm but at a location where no
physical production occurs, it could conceivably be counted as either a
manufacturing-sector product or a service-sector product.
If the manufacturer purchases the design from a specialist design firm, the value
added in the design process will be credited to the service sector, and the workers
involved will be considered service-sector employees.

U.S. Manufacturing in International Perspective
Congressional Research Service 8
In all three cases, total employment and total value added are identical; all that differs is the
economic sector to which the employment and value added are attributed.
Identifying manufacturing work has become even more difficult in recent years for a variety of
reasons. As of May 2015, more than 750,000 people engaged in production occupations typical of
manufacturing, such as assemblers and fabricators, were employed by employment services firms
in the United States; they were likely counted as service-sector workers, as they were not
employed directly by the manufacturing establishments in which they labored. Similarly, more
than 29,000 workers at U.S. warehousing and storage facilities were engaged in manufacturing
production activities such as assembly, fabrication, and packaging in May 2015. Although these
workers were engaging in traditional manufacturing tasks, their output is unlikely to have been
captured as value added in manufacturing.11
Moreover, determining the location at which value is added to a service that is used in a
manufactured product can be all but impossible. Manufacturers frequently procure components
from many suppliers in lengthy international supply chains, and each of those suppliers is likely
to purchase service inputs to at least a limited extent. The service providers themselves may be
international firms, and their involvement in a given production process may involve workers on
several continents.
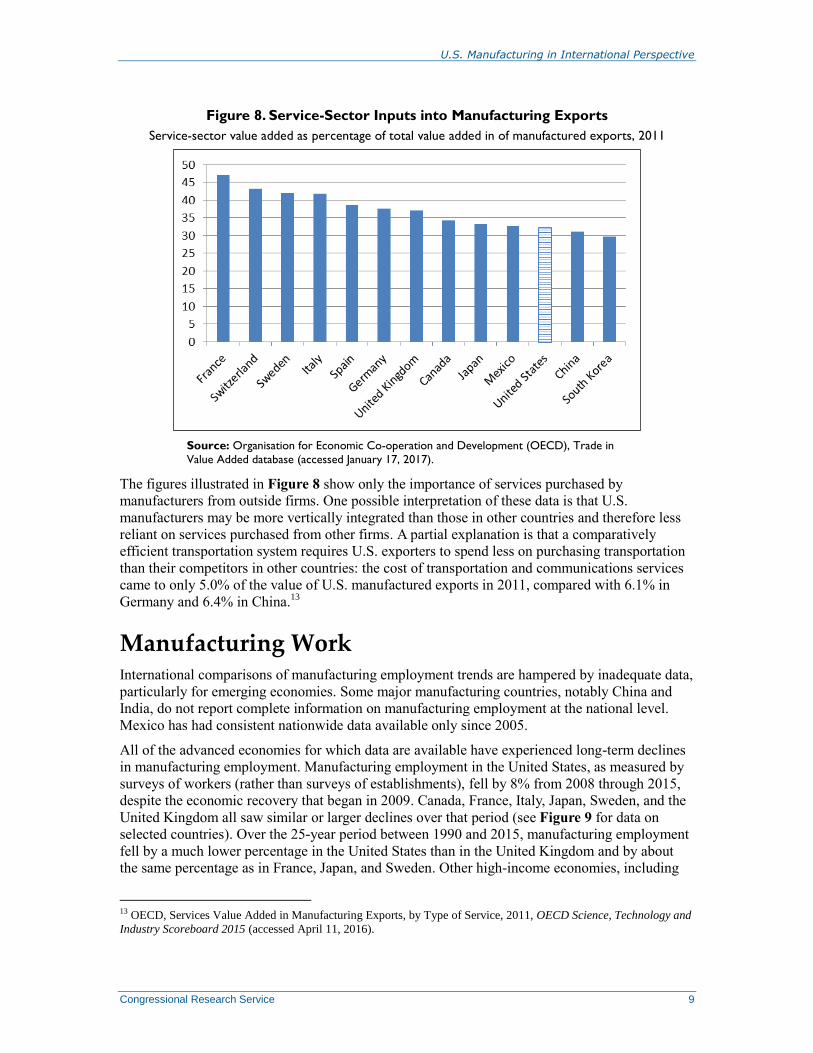
Efforts to measure the value of manufacturing-related services more accurately are still in their
infancy. According to 2011 data, U.S. exports of manufactured products include a lesser
proportion of services content than exports of most other advanced economies (see Figure 8). As
a result, only 5% of U.S. service sector jobs depended on manufacturing exports in 2015,
compared with nearly 8% in Japan and 10%-23% in European Union states.12
However, U.S.
manufacturers made comparatively little use of imported services content in exports. For
example, 17.8% of the value of Chinese manufactured exports and 16.4% of the value of South
Korean manufactured exports in 2011 comprised imported services, according to the Organisation
for Economic Co-operation and Development (OECD), compared with 8.0% of the value of U.S.
manufactured exports.
11 U.S. Bureau of Labor Statistics, Occupational Employment Statistics Query System, data.bls.gov/oes (accessed
January 13, 2017). 12 OECD, Business Sector Service Jobs Sustained by Foreign Final Demand for Manufactured Goods, 2011, OECD
Science, Technology and Industry Scoreboard 2015 (accessed January 17, 2017).
U.S. Manufacturing in International Perspective
Congressional Research Service 9
Figure 8. Service-Sector Inputs into Manufacturing Exports
Service-sector value added as percentage of total value added in of manufactured exports, 2011
Source: Organisation for Economic Co-operation and Development (OECD), Trade in
Value Added database (accessed January 17, 2017).
The figures illustrated in Figure 8 show only the importance of services purchased by
manufacturers from outside firms. One possible interpretation of these data is that U.S.
manufacturers may be more vertically integrated than those in other countries and therefore less
reliant on services purchased from other firms. A partial explanation is that a comparatively
efficient transportation system requires U.S. exporters to spend less on purchasing transportation
than their competitors in other countries: the cost of transportation and communications services
came to only 5.0% of the value of U.S. manufactured exports in 2011, compared with 6.1% in
Germany and 6.4% in China.13
Manufacturing Work International comparisons of manufacturing employment trends are hampered by inadequate data,
particularly for emerging economies. Some major manufacturing countries, notably China and
India, do not report complete information on manufacturing employment at the national level.
Mexico has had consistent nationwide data available only since 2005.
All of the advanced economies for which data are available have experienced long-term declines
in manufacturing employment. Manufacturing employment in the United States, as measured by
surveys of workers (rather than surveys of establishments), fell by 8% from 2008 through 2015,
despite the economic recovery that began in 2009. Canada, France, Italy, Japan, Sweden, and the
United Kingdom all saw similar or larger declines over that period (see Figure 9 for data on
selected countries). Over the 25-year period between 1990 and 2015, manufacturing employment
fell by a much lower percentage in the United States than in the United Kingdom and by about
the same percentage as in France, Japan, and Sweden. Other high-income economies, including
13 OECD, Services Value Added in Manufacturing Exports, by Type of Service, 2011, OECD Science, Technology and
Industry Scoreboard 2015 (accessed April 11, 2016).

U.S. Manufacturing in International Perspective
Congressional Research Service 10
the Netherlands, Italy, and Germany, also saw large declines in manufacturing employment over
that period (see Figure 10). The number of manufacturing workers also has declined in some
countries with less advanced economies, and has declined as a share of the labor force in many
countries, including Mexico and Brazil.14
These figures indicate that the diminished importance
of manufacturing as a source of jobs is not limited to the United States.15
Figure 9. Manufacturing Employment
Percentage change, 2008-2015
Source: The Conference Board, “International
Comparisons of Manufacturing Productivity & Unit
Labor Cost Trends,” June 2016.
Figure 10. Manufacturing Employment
Percentage change, 1990-2015
Source: The Conference Board, “International
Comparisons of Manufacturing Productivity & Unit
Labor Cost Trends,” June 2016.
The international comparison of manufacturing employment is somewhat different if viewed in
terms of hours worked rather than by the number of workers. By this metric, Germany
experienced a similar decline in manufacturing work to that of the United States over the 1990-
2015 period, while the declines in France, Japan, and the United Kingdom were larger. The
timing differed among countries, with manufacturing work hours falling faster in other countries
during the 1990s and the United States experiencing a comparatively steep drop in the 2000-2010
period.16
Even in South Korea and Taiwan, where manufacturing output has expanded far more
rapidly than in the United States, factories require fewer total hours of labor than was formerly
the case.
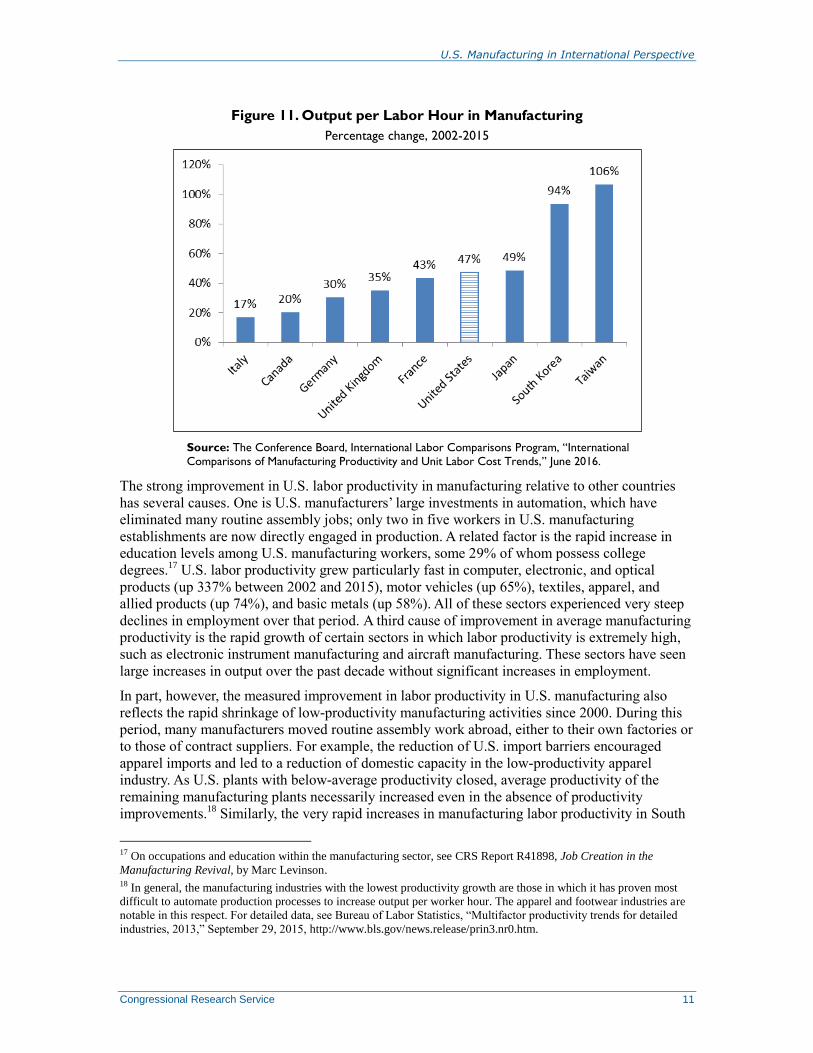
The reduced demand for labor is directly related to improved labor productivity. Manufacturing
labor productivity, measured in terms of output per worker hour, has increased much more rapidly
in the United States than in Canada and some large European economies, and nearly as much as
in Japan (see Figure 11). However, U.S. productivity growth has been much slower than that in
South Korea and Taiwan.
14 International Labour Organization, Key Indicators of the Labour Market 2015, http://www.ilo.org/global/statistics-
and-databases/research-and-databases/kilm/lang--en/index.htm,Tables 4b and 4c. For examples of countries where
manufacturing employment has peaked as a share of total employment, see International Labour Organization, World
Employment and Social Outlook Trends 2015 (Geneva, 2015), p. 63. 15 These data were compiled by the Conference Board International Labor Comparisons Program. 16 Conference Board International Labor Comparisons Program, “International Comparisons of Manufacturing
Productivity & Unit Labor Cost Trends,” June 2016, http://www.conference-board.org/ilcprogram/ (accessed January
17, 2017).
U.S. Manufacturing in International Perspective
Congressional Research Service 11
Figure 11. Output per Labor Hour in Manufacturing
Percentage change, 2002-2015
Source: The Conference Board, International Labor Comparisons Program, “International
Comparisons of Manufacturing Productivity and Unit Labor Cost Trends,” June 2016.
The strong improvement in U.S. labor productivity in manufacturing relative to other countries
has several causes. One is U.S. manufacturers’ large investments in automation, which have
eliminated many routine assembly jobs; only two in five workers in U.S. manufacturing
establishments are now directly engaged in production. A related factor is the rapid increase in
education levels among U.S. manufacturing workers, some 29% of whom possess college
degrees.17
U.S. labor productivity grew particularly fast in computer, electronic, and optical
products (up 337% between 2002 and 2015), motor vehicles (up 65%), textiles, apparel, and
allied products (up 74%), and basic metals (up 58%). All of these sectors experienced very steep
declines in employment over that period. A third cause of improvement in average manufacturing
productivity is the rapid growth of certain sectors in which labor productivity is extremely high,
such as electronic instrument manufacturing and aircraft manufacturing. These sectors have seen
large increases in output over the past decade without significant increases in employment.
In part, however, the measured improvement in labor productivity in U.S. manufacturing also
reflects the rapid shrinkage of low-productivity manufacturing activities since 2000. During this
period, many manufacturers moved routine assembly work abroad, either to their own factories or
to those of contract suppliers. For example, the reduction of U.S. import barriers encouraged
apparel imports and led to a reduction of domestic capacity in the low-productivity apparel
industry. As U.S. plants with below-average productivity closed, average productivity of the
remaining manufacturing plants necessarily increased even in the absence of productivity
improvements.18
Similarly, the very rapid increases in manufacturing labor productivity in South
17 On occupations and education within the manufacturing sector, see CRS Report R41898, Job Creation in the
Manufacturing Revival, by Marc Levinson. 18 In general, the manufacturing industries with the lowest productivity growth are those in which it has proven most
difficult to automate production processes to increase output per worker hour. The apparel and footwear industries are
notable in this respect. For detailed data, see Bureau of Labor Statistics, “Multifactor productivity trends for detailed
industries, 2013,” September 29, 2015, http://www.bls.gov/news.release/prin3.nr0.htm.

U.S. Manufacturing in International Perspective
Congressional Research Service 12
Korea and Taiwan likely reflect the closure of low-productivity manufacturing as well as the
expansion of capital-intensive manufacturing.
At the other extreme, Italy, which has seen a comparatively small drop in manufacturing
employment, experienced by far the smallest increase in output per hour worked of any of the
wealthy countries for which data are available, along with a decline in manufacturing value
added. In combination, these figures suggest that restructuring low-productivity operations has
been a challenge for Italian manufacturers.
Average compensation per employee in U.S. manufacturing was $37.71 per hour in 2015. This
figure was higher than average manufacturing compensation in 26 of 34 other countries for which
the Conference Board, a private research organization, collected data. Due largely to the strength
of the dollar since the second half of 2014, most other countries have seen average compensation
per hour expressed in U.S. dollar terms decline. Over a longer time frame, labor costs in most
European countries have risen relative to those in the United States (see Table 1).
Table 1. Hourly Compensation Costs in Manufacturing
U.S. dollar basis, 2015
Direct Pay
Total Compensation
Costs
Change Relative to
United States, 2000-2015
(percentage points)
Brazil $5.53 $7.97 22
Canada $24.64 $30.94 12
France $26.17 $37.59 17
Germany $33.24 $42.42 12
Italy $22.61 $31.48 25
Japan $19.33 $23.60 -6
South Korea $18.20 $22.68 56
Mexico $4.14 $5.90 -17
Taiwan $8.07 $9.51 -8
United Kingdom $26.87 $31.44 6
United States $28.77 $37.71 NA
Source: The Conference Board, “International Comparisons of Hourly Compensation Costs in Manufacturing
2015,” April 12, 2016, https://www.conference-board.org/ilcprogram/index.cfm?id=38269.
Notes: “Direct Pay” includes vacation pay, bonus payments, and employer contributions to employees’ savings
funds. “Total Compensation Costs” additionally includes pensions, disability insurance, sick leave, health
insurance, severance pay, other social insurance expenditures, and taxes on payrolls or employment. “Change in
Compensation Costs Relative to United States” incorporates the effects of exchange-rate changes.
U.S. Manufacturing in International Perspective
Congressional Research Service 13
Accurate nationwide data on manufacturing compensation costs in China are not available.
Chinese government statistics point to an average wage in urban manufacturing of approximately
$4.20 per hour in 2015.19
This figure is not directly comparable to the direct pay in other
countries shown in Table 1, as it excludes workers in rural areas, where wages generally are
lower than in urban areas. The Economist Intelligence Unit, a consulting firm, estimates Chinese
manufacturing labor costs to have been $4.93 per hour in 2015, including health care and other
social benefits. This is consistent with the official wage figures.20
With respect to India, government data show per capita annual earnings in manufacturing to have
been approximately $1,500 in 2012, or well below $1 per hour. However, this figure may not be
representative of Indian manufacturing wages in general.21
The Economist Intelligence Unit
estimates average manufacturing compensation costs in India, including fringe benefits, to have
been $1.86 per hour in 2015.
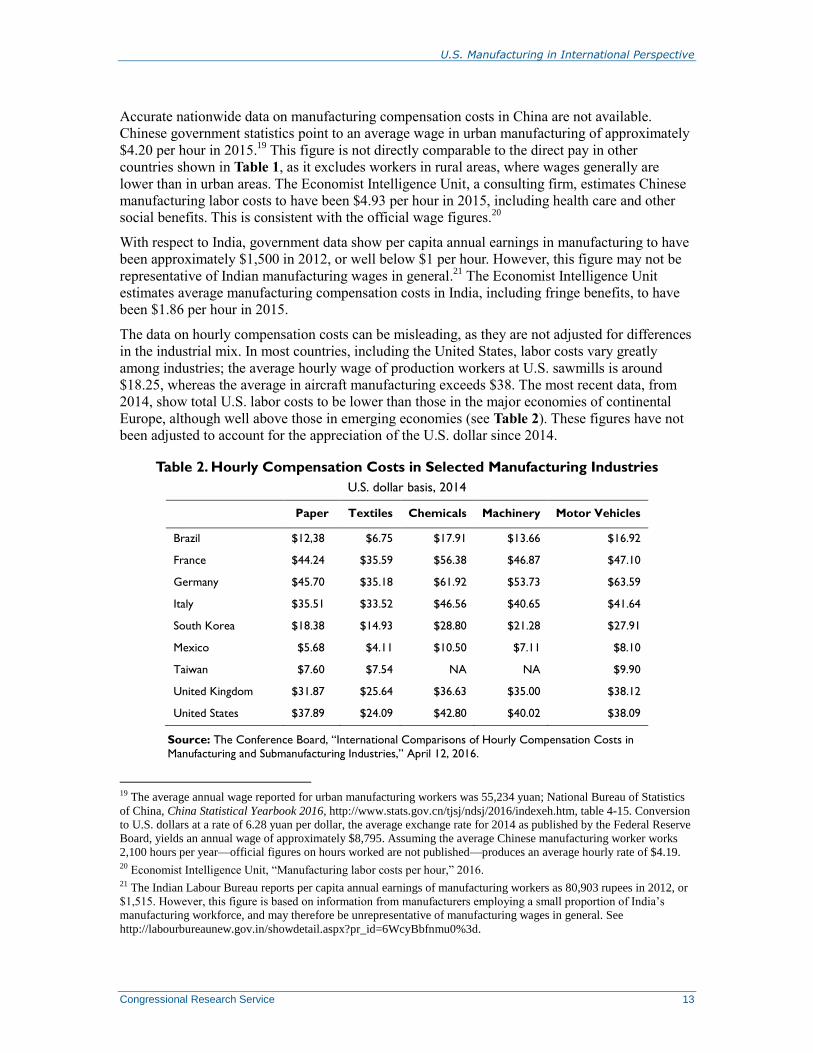
The data on hourly compensation costs can be misleading, as they are not adjusted for differences
in the industrial mix. In most countries, including the United States, labor costs vary greatly
among industries; the average hourly wage of production workers at U.S. sawmills is around
$18.25, whereas the average in aircraft manufacturing exceeds $38. The most recent data, from
2014, show total U.S. labor costs to be lower than those in the major economies of continental
Europe, although well above those in emerging economies (see Table 2). These figures have not
been adjusted to account for the appreciation of the U.S. dollar since 2014.
Table 2. Hourly Compensation Costs in Selected Manufacturing Industries
U.S. dollar basis, 2014
Paper Textiles Chemicals Machinery Motor Vehicles
Brazil $12,38 $6.75 $17.91 $13.66 $16.92
France $44.24 $35.59 $56.38 $46.87 $47.10
Germany $45.70 $35.18 $61.92 $53.73 $63.59
Italy $35.51 $33.52 $46.56 $40.65 $41.64
South Korea $18.38 $14.93 $28.80 $21.28 $27.91
Mexico $5.68 $4.11 $10.50 $7.11 $8.10
Taiwan $7.60 $7.54 NA NA $9.90
United Kingdom $31.87 $25.64 $36.63 $35.00 $38.12
United States $37.89 $24.09 $42.80 $40.02 $38.09
Source: The Conference Board, “International Comparisons of Hourly Compensation Costs in
Manufacturing and Submanufacturing Industries,” April 12, 2016.
19 The average annual wage reported for urban manufacturing workers was 55,234 yuan; National Bureau of Statistics
of China, China Statistical Yearbook 2016, http://www.stats.gov.cn/tjsj/ndsj/2016/indexeh.htm, table 4-15. Conversion
to U.S. dollars at a rate of 6.28 yuan per dollar, the average exchange rate for 2014 as published by the Federal Reserve
Board, yields an annual wage of approximately $8,795. Assuming the average Chinese manufacturing worker works
2,100 hours per year—official figures on hours worked are not published—produces an average hourly rate of $4.19. 20 Economist Intelligence Unit, “Manufacturing labor costs per hour,” 2016. 21 The Indian Labour Bureau reports per capita annual earnings of manufacturing workers as 80,903 rupees in 2012, or
$1,515. However, this figure is based on information from manufacturers employing a small proportion of India’s
manufacturing workforce, and may therefore be unrepresentative of manufacturing wages in general. See
http://labourbureaunew.gov.in/showdetail.aspx?pr_id=6WcyBbfnmu0%3d.
U.S. Manufacturing in International Perspective
Congressional Research Service 14
Technology and Research in Manufacturing High-technology manufacturing has been a particular focus of public-policy concern for many
years. There is no standard definition of high-tech manufacturing, but commentators have long
asserted that high-technology production has especially beneficial economic spillovers.22
Although definitions of “high-tech industry” vary, the OECD considers that manufacturing of
pharmaceuticals; office, accounting, and computing machinery; radio, television, and
communications equipment; medical, precision, and optical instruments; and aircraft and
spacecraft is particularly technology-intensive, based on those industries’ research and
development (R&D) expenditures and on the amount of R&D embodied in their products.23
It is
important to note in this context that some industries that may have a considerable technological
component, such as automobile and machinery manufacturing, are not considered high-
technology industries by the OECD.
The United States derives a greater share of manufacturing value added from high-tech industries
than is the case in most other OECD member countries. Moreover, the share of value added
represented by high-technology sectors has been rising in the United States, whereas it has been
stable or declining in many other countries.24
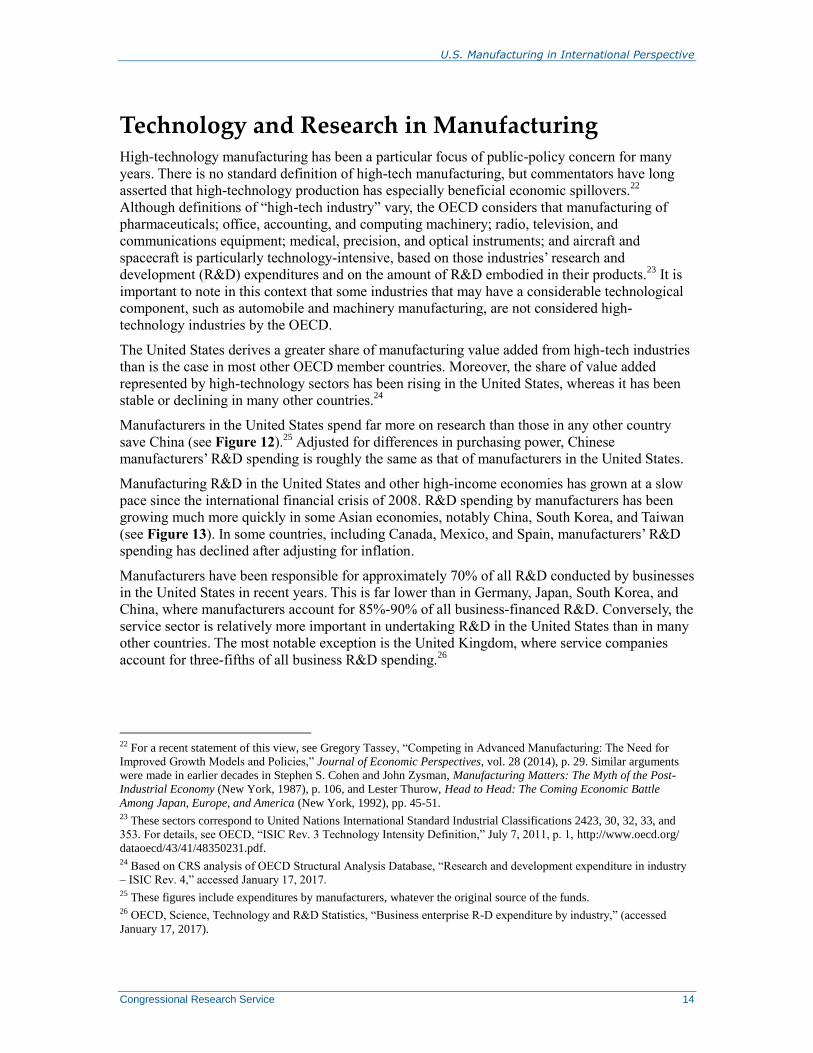
Manufacturers in the United States spend far more on research than those in any other country
save China (see Figure 12).25
Adjusted for differences in purchasing power, Chinese
manufacturers’ R&D spending is roughly the same as that of manufacturers in the United States.
Manufacturing R&D in the United States and other high-income economies has grown at a slow
pace since the international financial crisis of 2008. R&D spending by manufacturers has been
growing much more quickly in some Asian economies, notably China, South Korea, and Taiwan
(see Figure 13). In some countries, including Canada, Mexico, and Spain, manufacturers’ R&D
spending has declined after adjusting for inflation.
Manufacturers have been responsible for approximately 70% of all R&D conducted by businesses
in the United States in recent years. This is far lower than in Germany, Japan, South Korea, and
China, where manufacturers account for 85%-90% of all business-financed R&D. Conversely, the
service sector is relatively more important in undertaking R&D in the United States than in many
other countries. The most notable exception is the United Kingdom, where service companies
account for three-fifths of all business R&D spending.26
22 For a recent statement of this view, see Gregory Tassey, “Competing in Advanced Manufacturing: The Need for
Improved Growth Models and Policies,” Journal of Economic Perspectives, vol. 28 (2014), p. 29. Similar arguments
were made in earlier decades in Stephen S. Cohen and John Zysman, Manufacturing Matters: The Myth of the Post-
Industrial Economy (New York, 1987), p. 106, and Lester Thurow, Head to Head: The Coming Economic Battle
Among Japan, Europe, and America (New York, 1992), pp. 45-51. 23 These sectors correspond to United Nations International Standard Industrial Classifications 2423, 30, 32, 33, and
353. For details, see OECD, “ISIC Rev. 3 Technology Intensity Definition,” July 7, 2011, p. 1, http://www.oecd.org/
dataoecd/43/41/48350231.pdf. 24 Based on CRS analysis of OECD Structural Analysis Database, “Research and development expenditure in industry
– ISIC Rev. 4,” accessed January 17, 2017. 25 These figures include expenditures by manufacturers, whatever the original source of the funds. 26 OECD, Science, Technology and R&D Statistics, “Business enterprise R-D expenditure by industry,” (accessed
January 17, 2017).
U.S. Manufacturing in International Perspective
Congressional Research Service 15
Figure 12. R&D in Manufacturing, 2014
Billions of U.S. dollars at
purchasing power parity
Source: OECD STAN R&D database, “Research and
development expenditures by industry,” Rev. 4.
Note: Data for the United States are for 2013.
Figure 13. Growth in Manufacturing R&D
Change in 2010 dollars at
constant purchasing power parity, 2008-2014
Source: OECD STAN R&D database, “Research and
development expenditures by industry,” Rev. 4.
Note: Data for France are for 2008-2013.
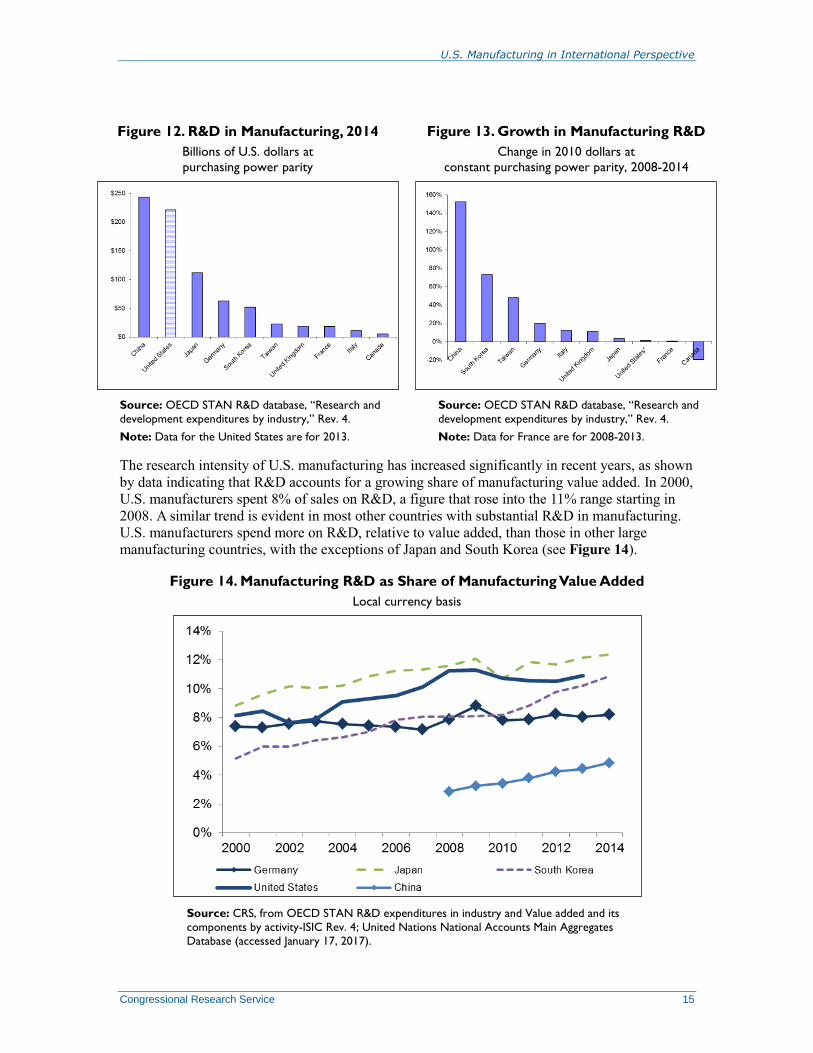
The research intensity of U.S. manufacturing has increased significantly in recent years, as shown
by data indicating that R&D accounts for a growing share of manufacturing value added. In 2000,
U.S. manufacturers spent 8% of sales on R&D, a figure that rose into the 11% range starting in
2008. A similar trend is evident in most other countries with substantial R&D in manufacturing.
U.S. manufacturers spend more on R&D, relative to value added, than those in other large
manufacturing countries, with the exceptions of Japan and South Korea (see Figure 14).
Figure 14. Manufacturing R&D as Share of Manufacturing Value Added
Local currency basis
Source: CRS, from OECD STAN R&D expenditures in industry and Value added and its
components by activity-ISIC Rev. 4; United Nations National Accounts Main Aggregates
Database (accessed January 17, 2017).
U.S. Manufacturing in International Perspective
Congressional Research Service 16
One reason for national differences in R&D intensity is variation in the composition of the
manufacturing sector. Industries such as aircraft, spacecraft, and electronic instrument
manufacturing are among the most research-intensive in every country, and, all other things
equal, countries in which these sectors are relatively large may be expected to have greater R&D
intensity in manufacturing than countries in which they are less important.
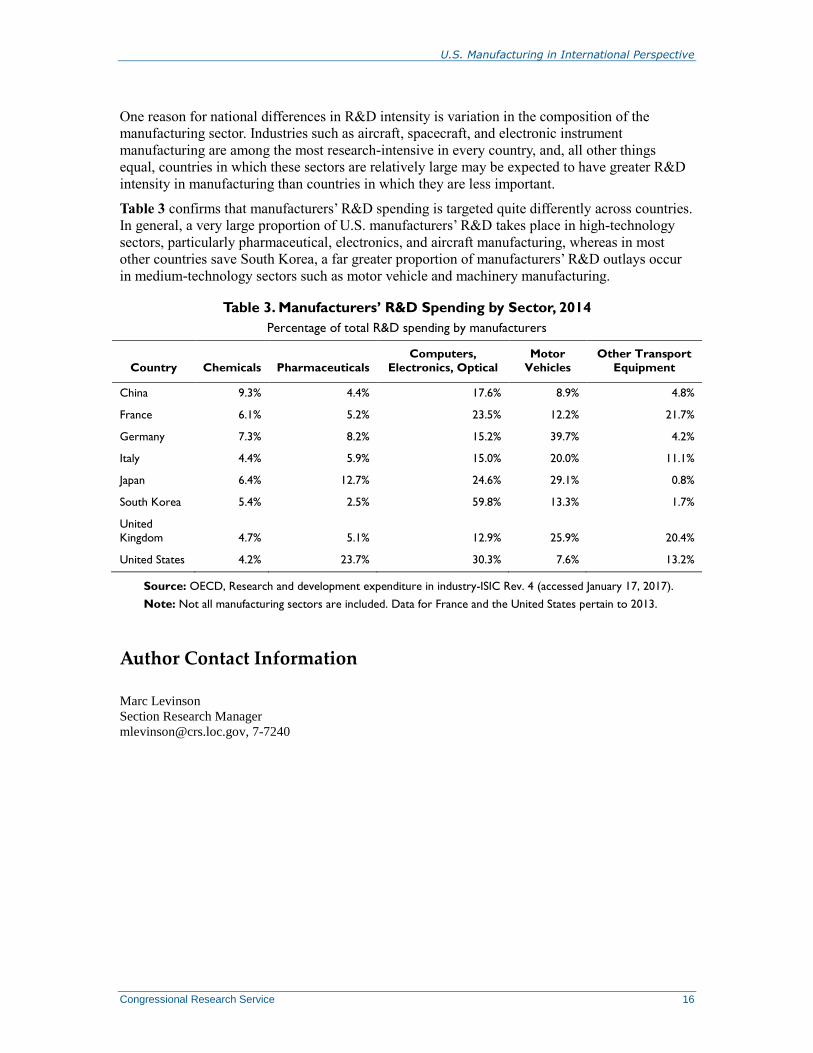
Table 3 confirms that manufacturers’ R&D spending is targeted quite differently across countries.
In general, a very large proportion of U.S. manufacturers’ R&D takes place in high-technology
sectors, particularly pharmaceutical, electronics, and aircraft manufacturing, whereas in most
other countries save South Korea, a far greater proportion of manufacturers’ R&D outlays occur
in medium-technology sectors such as motor vehicle and machinery manufacturing.
Table 3. Manufacturers’ R&D Spending by Sector, 2014
Percentage of total R&D spending by manufacturers
Country Chemicals Pharmaceuticals
Computers,
Electronics, Optical
Motor
Vehicles
Other Transport
Equipment
China 9.3% 4.4% 17.6% 8.9% 4.8%
France 6.1% 5.2% 23.5% 12.2% 21.7%
Germany 7.3% 8.2% 15.2% 39.7% 4.2%
Italy 4.4% 5.9% 15.0% 20.0% 11.1%
Japan 6.4% 12.7% 24.6% 29.1% 0.8%
South Korea 5.4% 2.5% 59.8% 13.3% 1.7%
United
Kingdom 4.7% 5.1% 12.9% 25.9% 20.4%
United States 4.2% 23.7% 30.3% 7.6% 13.2%
Source: OECD, Research and development expenditure in industry-ISIC Rev. 4 (accessed January 17, 2017).
Note: Not all manufacturing sectors are included. Data for France and the United States pertain to 2013.
Author Contact Information
Marc Levinson
Section Research Manager
[email protected], 7-7240