GEOTHERMAL DRILLING PROGRAM FOR BARNWELL GEOTHERMAL CORPORATION
Published by Raymond James Ltd., a Canadian investment dealer. Please see end of INsight for important disclosures. www.raymondjames.ca
AUGUST 26, 2010
U.S. Geothermal GTH-TSX | HTM-AMEX Initiation of Coverage: DOE Funding Approved – Moving Ahead Event We are initiating research coverage of U.S. Geothermal with a $1.25 target price and OUTPERFORM rating for a ~58% expected return over 6‐12 months. Action We recommend investors buy shares of U.S. Geothermal. Analysis Investing in geothermal. We believe there is an energy gap coming as more coal plants are closed down due to tough pollution controls. We consider low all‐in costs (vs. traditional electricity generating technologies), great IRRs (vs. wind and solar) and incentives from a growing public policy momentum make geothermal a highly coveted substitute for base‐load power generation. Experienced management team and locally connected. U.S. Geothermal’s management team has well over 150 years combined experience in oil and gas, mining, infrastructure and geothermal energy with operational experience and relationships in each of its project areas including the U.S. and Guatemala. High quality portfolio. U.S. Geothermal may not have as big a land bank as some of its peers (45,000 acres in the U.S.) but still owns property rights to six properties each with a reservoir under it – which, to us, speaks to Mr. Teplowʹs (U.S. Geothermal’s chief geologist) vast knowledge of different properties. Management expects to grow power capacity from ~14 MWe
currently to ~44 MWe by F2012, ~70 MWe by F2013, and ~124 MWe by F2014. DOE funding approved – moving ahead. U.S. Geothermal has been consistently able to raise funds even in difficult capital market conditions. U.S. Geothermal is also the first geothermal operator in the United States to be awarded a non‐recourse, low‐interest DOE funding for its Neal Hot Springs advanced stage project up to $102.2 mln. With this DOE loan, we estimate U.S. Geothermal’s production growth is fully funded to ~44 MWe (by F2012). At that level of production, we estimate EBITDA approaching $20 mln per year. Given the advanced stage of some of its projects, we also believe U.S. Geothermal could eventually be a take‐out candidate for some of the larger geothermal operators. Valuation Our target price implies ~8.4x C2014E EBITDA discounted back at 12.5% to 2010 and ~0.62x our P/NAV (risked). Ormat (ORA‐NYSE) currently trades at roughly 13.8x C2010E EBITDA. Our un‐risked NAV is C$384 mln or $4.88/share and a risked NAV of $157 mln or $2.00/share. U.S. Geothermal currently trades at 0.40x P/NAV (risked).
ALTERNATIVE ENERGY & CLEAN TECH
Steven Li, [email protected]
Anthony Jin, MBA, P.Eng (Associate)[email protected]
Diane Yu (Associate)[email protected]
RATING & TARGET (C$)RATING *Target Price (6-12 mths) *Closing PriceTotal Return to Target 58%
MARKET DATAMarket Capitalization ($mln) 62Current Net Debt ($mln) (9)Enterprise Value ($mln) 54Shares Outstanding (mln) 79Avg Daily Dollar Volume (3mo, mln) 0.452 Week Range $0.70 - $1.91
KEY FINANCIAL METRICSFY-Mar 31 2010E 2011E 2012EEPS -0.06 -0.08 -0.04P/E n.m. n.m. n.m.EPS - 1Q -0.02 A -0.02 n.aEPS - 2Q -0.02 -0.02 n.aEPS - 3Q -0.02 -0.02 n.aEPS - 4Q -0.01 -0.01 n.aEBITDA -2.9 -3.0 13.0EV/EBITDA n.m. n.m. 4.2xRevenue ($mln) 2.9 3.0 23.4MW(net) Production 14 MW 17 MW 44 MW
Unrisked NAVPS (C$) $4.88Risked NAVPS (C$) $2.00P/NAV (Risked) 0.40xAssumed CADUSD FX $0.97
COMPANY DESCRIPTION
* New target and ratingClosing price as of Aug-24-10All figures in US$, unless otherwise noted.Sources: Raymond James Ltd.,ThomsonOne, CapIQ,Bloomberg and Company Reports
OUTPERFORM 2
U.S. Geothermal Inc. is a geothermal energy pure play with assets in Nevada, Oregon, Idaho and Guatemala. The company currently has two operating plants - San Emidio and Raft River producing ~14 MW - and an advanced pipeline targeting 124 MW by 2014.
1.250.79
Publishing will insert chart here

RJ Equity Research │ Page 2 of 47
Table of Contents
U.S. Geothermal – An Introduction ............................................... 3 Experienced Management Team ................................................. 5 Ownership and Share Structure.................................................... 6 Asset Base................................................................................... 7 Valuation Methodology............................................................... 24 Recommendation and Target..................................................... 25 Investment Risks ........................................................................ 27 Appendix 1: A Brief Refresher on Geothermal Energy ............... 30 Appendix 2: Why Invest in Geothermal?.................................... 34 Appendix 3: Detailed Equity Financing History........................... 42 Appendix 4: U.S. Geothermal's Estimated Resources.............. 43 Appendix 5: Financials............................................................... 44

RJ Equity Research │ Page 3 of 47
U.S. Geothermal – An Introduction
U.S. Geothermal Inc (GTH‐TSX | HTM–AMEX) is engaged in the exploration and development of geothermal resources as well as the management of geothermal power generation facilities. Based out of Idaho, USA, GTH’s operations are primarily based in the western United States with assets in the states of Idaho, Oregon, Nevada, as well as Guatemala in Central America. The company changed its name to U.S. Geothermal Inc. following the completion of the reverse takeover by Geo‐Idaho on December 2003. The Raft River project was the company’s first development. Since then, GTH has acquired additional assets including Neal Hot Springs (Oregon), San Emidio (Idaho), Granite Creek (Nevada), Gerlach (Nevada) as well as recent concession wins in Guatemala. GTH currently operates 2 power plant facilities in Raft River I in Idaho (through a JV with a subsidiary of Goldman Sachs (GS‐NYSE)) and San Emidio in Nevada. Raft River I is currently selling ~9 MWe of power to Idaho Power Company under a net 13 MWe power purchase agreement (PPA) expiring 2032.1 The San Emidio plant generates an average net output of 2.5 MWe sold to Sierra Pacific Power Corporation under a PPA expiring 2017. In addition to further developing these assets, management also has plans to develop the Neal Hot Springs (Oregon) project over the next 3 – 5 years. GTH was recently the first geothermal company in the United States to be awarded a DOE‐backed project financing to the tune of up to $102.2 mln for its Neal Hot Springs Project. Geothermal in our view remains the most economical renewable energy play offering competitive rates to nuclear energy and coal on a levelized basis and IRRs approaching and in some cases exceeding 20% (see Appendix 1 through Appendix 2). Additionally, geothermal power offers the only renewable energy which can provide baseload power – pivotal to ensuring consistent supply for rapidly changing energy demand.
1 In this report, we will only use net power generation numbers in reference to project capacity unless directly specified otherwise.
RJ Equity Research │ Page 4 of 47
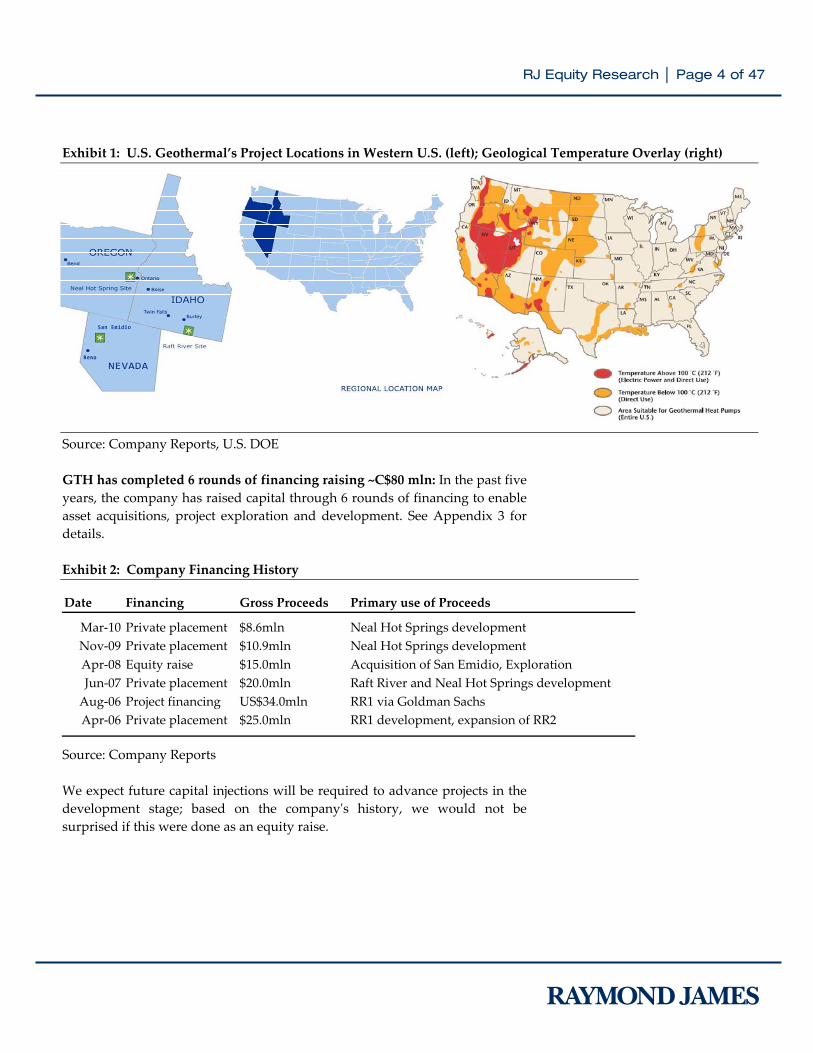
Exhibit 1: U.S. Geothermal’s Project Locations in Western U.S. (left); Geological Temperature Overlay (right) Source: Company Reports, U.S. DOE GTH has completed 6 rounds of financing raising ~C$80 mln: In the past five years, the company has raised capital through 6 rounds of financing to enable asset acquisitions, project exploration and development. See Appendix 3 for details. Exhibit 2: Company Financing History Source: Company Reports We expect future capital injections will be required to advance projects in the development stage; based on the companyʹs history, we would not be surprised if this were done as an equity raise.
Date Financing Gross Proceeds Primary use of Proceeds
Mar‐10 Private placement $8.6mln Neal Hot Springs developmentNov‐09 Private placement $10.9mln Neal Hot Springs developmentApr‐08 Equity raise $15.0mln Acquisition of San Emidio, ExplorationJun‐07 Private placement $20.0mln Raft River and Neal Hot Springs developmentAug‐06 Project financing US$34.0mln RR1 via Goldman SachsApr‐06 Private placement $25.0mln RR1 development, expansion of RR2

RJ Equity Research │ Page 5 of 47
Experienced Management Team
U.S. Geothermal meets a fundamental value, in our view, for investing in geothermal exploration and development companies: a strong management team. In aggregate, management encompasses ~150 years of relevant experience in mining, oil & gas, water resource management, infrastructure development, power generation facility management and the geothermal energy sector. We highlight the profiles of management and the board of directors in Exhibit 3. Exhibit 3: Management and Board of Director Profiles Name Title Background
Management TeamDaniel J. Kunz CEO & President,
DirectorDaniel Kunz is the co‐founder, President and Chief Executive Officer and a director of the Company and thePresident of Geo‐Idaho. He has served as a director of the Company since March 2000, and was Chairman of theBoard of Directors from March 2000 until December 2003. Mr. Kunz has more than 30 years of experience ininternational mining, engineering and construction, including, marketing, business development, management,accounting, finance and operations. Mr. Kunz was a founder of and directed the initial public offering of theNASDAQ listed MK Gold Company (President, Director & CEO) and held executive positions with NYSE listedMorrison Knudsen Corporation (Vice President & Controller, and as CFO to the Mining Group). Mr. Kunz holdsa Masters of Business Administration and a Bachelor of Science in Engineering Science.
Douglas J. Glaspey Chief Operating Officer, Director
Douglas J. Glaspey is the co‐founder, Chief Operating Officer and a director of the Company. He has served as adirector of the company since March 2000, and served from March 2000 until December 2004 as the President andChief Operating Officer for the TSX‐V listed U.S. Cobalt Inc. until the acquisition of Geo‐Idaho. He also served asa director and the Chief Executive Officer of Geo‐Idaho from February 2002 until the acquisition, and continuesto serve as President. Mr. Glaspey has 29 years of operating and management experience. He holds a Bachelor ofScience in Mineral Processing Engineering and an Associate of Science in Engineering Science.
Kerry D. Hawkley Chief Financial Officer & Corporate Secretary
Kerry D. Hawkley serves as the Chief Financial Officer and Corporate Secretary. He has served as the company’scontroller since July 2003, and became CFO as of January 1, 2005. Mr. Hawkley has over 30 years experience in allareas of accounting, finance and administration. He holds Bachelor of Business Administration degrees inAccounting and Finance.
Kevin Kitz VP Development Kevin Kitz joined in April 2003, bringing 19 years of geothermal power plant design, construction and operatingexperience with UNOCAL, with whom he worked until November 2002. A mechanical engineer by training, heholds a Bachelor of Science in Mechanical Engineering and Material Science, is a Professional Engineer inCalifornia.
Robert Cline VP Engineering Robert Cline joined in February 2005, bringing 24 years of experience developing energy and water resources inthe western US. A civil engineer by training, he holds Bachelor of Science degrees in Civil Engineering andPhysics and is a Professional Engineer in Arizona and Oregon. Prior to GTH, he was the manager of engineeringat Ida‐West Energy Company (hydroelectric and gas‐fired generating facilities) and worked nine years for the USBureau of Reclamation in Arizona.
Christopher S. Harriman
President of US Geothermal Services LLC
Christopher Harriman joined in July 2006, bringing over ten years of power management experience andeighteen years of industry experience. Prior experiences include stints at Black Hills generation as the plantmanager in Southern Idaho, eight years with Exxon Shipping and served in the US Coast Guard.
William Teplow VP Exploration Mr. Teplow, Oakland, California is a registered geologist with over 28 years of geothermal exploration anddevelopment experience throughout the western United States and Hawaii, Nicaragua, Hungary and China. Mr.Teplow has been a consulting geologist since 2001 and was formerly Chief Geologist for Ormat International Inc.Prior experiences also include VP Exploration for Trans‐Pacific Geothermal Corporation and Field Manager forPuna Geothermal Venture. Mr. Teplow has been consulting for GTH on Raft River and Neal Hot Springs projectssince June 2005

RJ Equity Research │ Page 6 of 47
(Exhibit 3 continued)
Ownership and Share Structure
Management and the board of directors own 4.5% of the outstanding share float (not including options), providing incentives for management to outperform. Exhibit 4: Shareholder Summary as of June 30, 2010
Total Institutional Holdings35.3%
Other54.9%
Total Insiders9.8%
Independent Board MembersJohn H. Walker Chairman of the
BoardMr. Walker, Oakville, Ontario is Managing Partner of the IMG Aurion Infrastructure Fund, a North Americaninfrastructure fund based in Toronto and Washington D.C. with a focus on mid‐market investment opportunities. He brings over 35 years experience in urban planning, energy security, investment banking and businessdiplomacy. Mr. Walker was a Founding Director of the Greater Toronto Airports Authority and was involved inthe development of a $4.4 billion terminal complex at Toronto Pearson Airport, which was completed in 2005. Hehas held positions at Ontario Hydro, Loewen Ondaatje McCutcheon, Falconbridge, Mihaly International Canada,the Town of Oakville and the City of New Haven. Mr. Walker has a BSc from Springfield College in urbanstudies and a Master of Environmental Studies degree from York University.
Paul A. Larkin Director Paul Larkin serves as a director of the Company, a position he has held since March 2000. He served as Secretaryof GTH until December, 2003, and served as a director and the Secretary‐Treasurer of Geo‐Idaho from February2002 until the acquisition. Since 1983, Mr. Larkin has also been the President of the New Dawn Group, aninvestment and financial consulting firm located in Vancouver, British Columbia, and a Director and Officer ofvarious TSX Venture Exchange listed companies. New Dawn is primarily involved in corporate finance,merchant banking and administrative management of public companies.
Leland L. Mink Director Dr. Leland “Roy” Mink serves as a director of the Company, a position he has held since November 2006 is theformer Program Director for the Geothermal Technologies Program,U.S. Department of Energy (DOE). Prior toworking for the DOE Dr. Mink was the Vice President of Exploration for U.S. Geothermal Inc. He has alsoworked for Morrison‐Knudsen Corporation, Idaho Bureau of Mines and Geology and Idaho Water ResourcesResearch Institute.
Source: Company Reports, Raymond James Ltd.
Shareholder SummaryManagement and Directors Shares Held % o/s Options % o/sDaniel J. Kunz 2,371,026 3.0% 995,000 1.3%Douglas J. Glaspey 519,557 0.7% 820,000 1.0%Kerry D. Hawkley 150,000 0.2% 240,000 0.3%John H. Walker 44,900 0.1% 230,000 0.3%Paul A. Larkin 378,068 0.5% 335,000 0.4%Leland L. Mink 20,000 0.0% 245,000 0.3%Robert A. Cline 0 0.0% 100,000 0.1%
Total Management and Directors 3,483,551 4.4% 2,965,000 56.4%Total Insiders 7,673,551 9.8%Source: IBES, Bloomberg, SEDI
RJ Equity Research │ Page 7 of 47
Asset Base
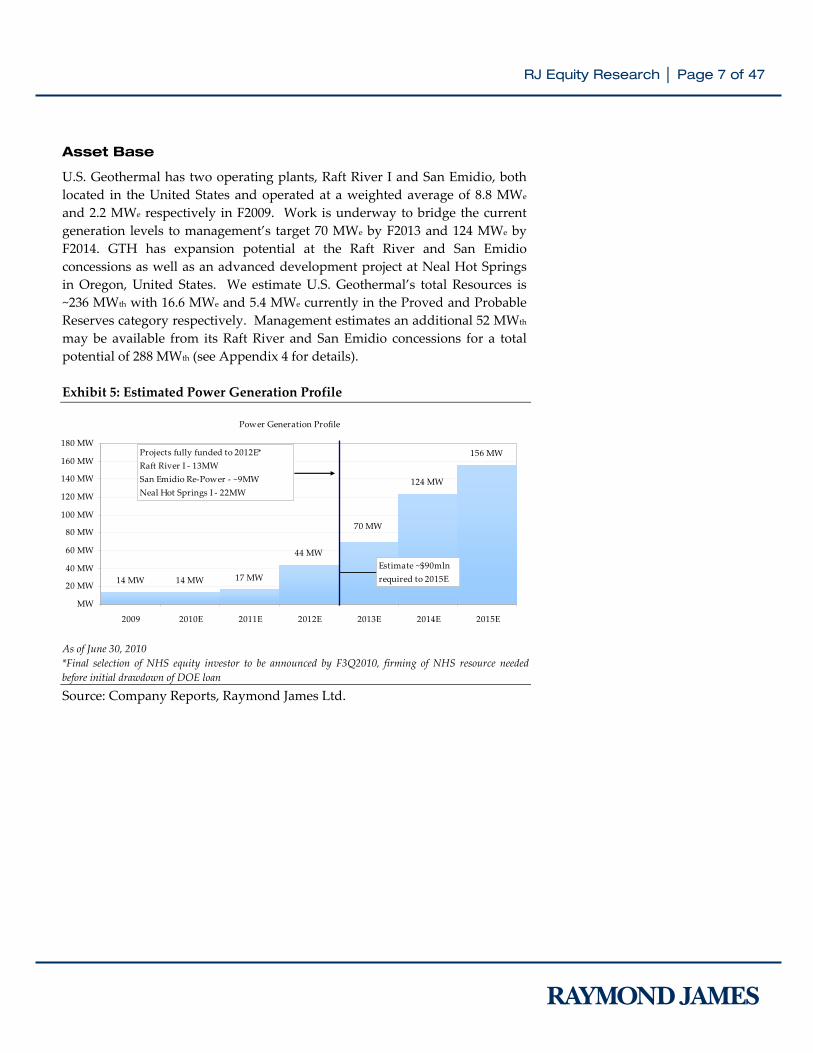
U.S. Geothermal has two operating plants, Raft River I and San Emidio, both located in the United States and operated at a weighted average of 8.8 MWe and 2.2 MWe respectively in F2009. Work is underway to bridge the current generation levels to management’s target 70 MWe by F2013 and 124 MWe by F2014. GTH has expansion potential at the Raft River and San Emidio concessions as well as an advanced development project at Neal Hot Springs in Oregon, United States. We estimate U.S. Geothermal’s total Resources is ~236 MWth with 16.6 MWe and 5.4 MWe currently in the Proved and Probable Reserves category respectively. Management estimates an additional 52 MWth may be available from its Raft River and San Emidio concessions for a total potential of 288 MWth (see Appendix 4 for details). Exhibit 5: Estimated Power Generation Profile As of June 30, 2010 *Final selection of NHS equity investor to be announced by F3Q2010, firming of NHS resource needed before initial drawdown of DOE loan
Source: Company Reports, Raymond James Ltd.
Power Generation Profile
14 MW 14 MW 17 MW
44 MW
124 MW
156 MW
70 MW
MW
20 MW
40 MW
60 MW
80 MW
100 MW
120 MW
140 MW
160 MW
180 MW
2009 2010E 2011E 2012E 2013E 2014E 2015E
Projects fully funded to 2012E*Raft River I ‐ 13MWSan Emidio Re‐Power ‐ ~9MWNeal Hot Springs I ‐ 22MW
Estimate ~$90mln required to 2015E
RJ Equity Research │ Page 8 of 47
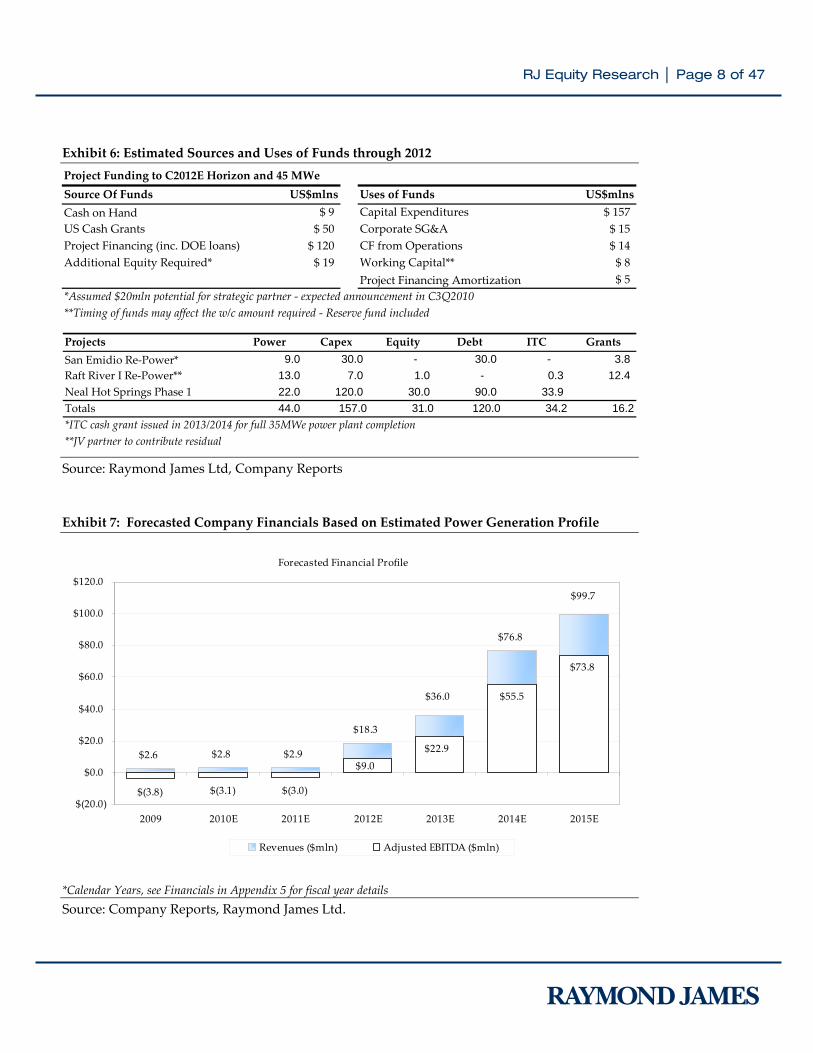
Exhibit 6: Estimated Sources and Uses of Funds through 2012 Source: Raymond James Ltd, Company Reports Exhibit 7: Forecasted Company Financials Based on Estimated Power Generation Profile *Calendar Years, see Financials in Appendix 5 for fiscal year details Source: Company Reports, Raymond James Ltd.
Project Funding to C2012E Horizon and 45 MWeSource Of Funds US$mlns Uses of Funds US$mlnsCash on Hand $ 9 Capital Expenditures $ 157US Cash Grants $ 50 Corporate SG&A $ 15Project Financing (inc. DOE loans) $ 120 CF from Operations $ 14Additional Equity Required* $ 19 Working Capital** $ 8
Project Financing Amortization $ 5*Assumed $20mln potential for strategic partner ‐ expected announcement in C3Q2010**Timing of funds may affect the w/c amount required ‐ Reserve fund included
Projects Power Capex Equity Debt ITC GrantsSan Emidio Re‐Power* 9.0 30.0 - 30.0 - 3.8 Raft River I Re‐Power** 13.0 7.0 1.0 - 0.3 12.4 Neal Hot Springs Phase 1 22.0 120.0 30.0 90.0 33.9 Totals 44.0 157.0 31.0 120.0 34.2 16.2*ITC cash grant issued in 2013/2014 for full 35MWe power plant completion**JV partner to contribute residual
Forecasted Financial Profile
$2.6 $2.8 $2.9
$18.3
$76.8
$(3.8) $(3.1) $(3.0)
$99.7
$36.0
$73.8
$55.5
$22.9
$9.0
$(20.0)
$0.0
$20.0
$40.0
$60.0
$80.0
$100.0
$120.0
2009 2010E 2011E 2012E 2013E 2014E 2015E
Revenues ($mln) Adjusted EBITDA ($mln)
RJ Equity Research │ Page 9 of 47
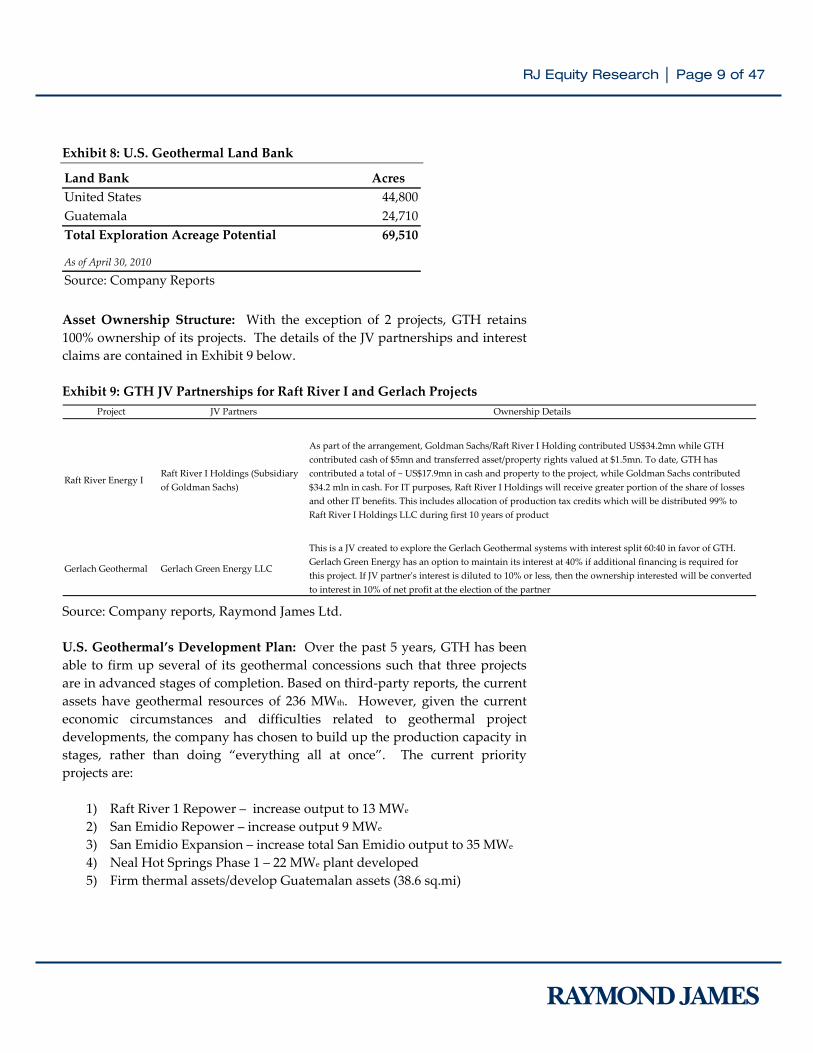
Exhibit 8: U.S. Geothermal Land Bank Asset Ownership Structure: With the exception of 2 projects, GTH retains 100% ownership of its projects. The details of the JV partnerships and interest claims are contained in Exhibit 9 below. Exhibit 9: GTH JV Partnerships for Raft River I and Gerlach Projects Source: Company reports, Raymond James Ltd. U.S. Geothermal’s Development Plan: Over the past 5 years, GTH has been able to firm up several of its geothermal concessions such that three projects are in advanced stages of completion. Based on third‐party reports, the current assets have geothermal resources of 236 MWth. However, given the current economic circumstances and difficulties related to geothermal project developments, the company has chosen to build up the production capacity in stages, rather than doing “everything all at once”. The current priority projects are:
1) Raft River 1 Repower – increase output to 13 MWe 2) San Emidio Repower – increase output 9 MWe 3) San Emidio Expansion – increase total San Emidio output to 35 MWe 4) Neal Hot Springs Phase 1 – 22 MWe plant developed 5) Firm thermal assets/develop Guatemalan assets (38.6 sq.mi)
Project JV Partners Ownership Details
Raft River Energy IRaft River I Holdings (Subsidiary of Goldman Sachs)
As part of the arrangement, Goldman Sachs/Raft River I Holding contributed US$34.2mn while GTH contributed cash of $5mn and transferred asset/property rights valued at $1.5mn. To date, GTH has contributed a total of ~ US$17.9mn in cash and property to the project, while Goldman Sachs contributed $34.2 mln in cash. For IT purposes, Raft River I Holdings will receive greater portion of the share of losses and other IT benefits. This includes allocation of production tax credits which will be distributed 99% to Raft River I Holdings LLC during first 10 years of product
Gerlach Geothermal Gerlach Green Energy LLC
This is a JV created to explore the Gerlach Geothermal systems with interest split 60:40 in favor of GTH. Gerlach Green Energy has an option to maintain its interest at 40% if additional financing is required for this project. If JV partnerʹs interest is diluted to 10% or less, then the ownership interested will be converted to interest in 10% of net profit at the election of the partner
Land Bank AcresUnited States 44,800Guatemala 24,710Total Exploration Acreage Potential 69,510
As of April 30, 2010
Source: Company Reports
RJ Equity Research │ Page 10 of 47
We believe this is a prudent development plan because it allows the company to capitalize on lucrative ITC cash grants, while providing leverage to manage potential deployment delays due to regulatory and/or technical issues. We note project priorities may shift based upon available capital, changes to U.S. ITC cash grant deadlines and exploration developments. We also highlight that the management team has demonstrated its abilities to develop similar projects and this remains one of the key pillars supporting our investment thesis. Based on management’s current development plan, we believe GTH should be well poised to generate ~124 MWe of electricity within the next 5‐years: Raft River Unit I (13.0 MWe by 2011/Capex = $7 mln): Planned capacity is
13 MWe with estimated additional capex investment of $7 mln during C2010. Unit I is currently selling ~7.8 MWe of power to Idaho Power Company due to a failed lap joint in a production well. Repairs for this well are expected to be at a prorated cost of ~$300k. In June 10, 2010, a second production well, RRG‐2, was shut down due to a reduction in flow and increased motor load indicating impending pump failure. A repair program including well stimulation is expected to cost ~$513k. Discussions are currently underway with the JV company to complete repairs with current expectations of a 1Q11 completion date.
Raft River Unit II (26 MWe by 2014/Capex = $134 mln)): GTH is currently
in negotiations with a third party to jointly develop a 26 MWe power plant at Raft River II during C2014, with both JV partners having access to equal portions of the power plant production. The capex for this development is estimated to be $134 mln, with contribution of ~$30 mln from the third party and up to 75% of capital costs through a non‐recourse DOE loan. Effectively, GTH is required to fund less than 7% of the total capex for this project. Based on management commentary during the recent earnings conference call, we understand that the JV negotiations with several parties are at preliminary stages and may be completed during the later half of 2010. This has not precluded management from commencing the DOE application process.
San Emidio (35 MWe by 2014/ Capex = $200 mln): The current capacity of
San Emidio is 2.7 MWe which is supplied to Sierra Pacific Power Corporation pursuant to a PPA which expires in 2017. Management intends to increase power production to approximately 35 MWe over two phases (8.6 MWe re‐power & 26.4 MWe expansion) by increasing the production and injection wells from F2011 onwards. In total management expects to have 7‐8 production and 7 injections wells when development is completed at an estimated capex of $200 mln. On July 19, 2010, GTH

RJ Equity Research │ Page 11 of 47
entered into an agreement with TAS Energy (private) for a $30 mln non‐recourse loan to facilitate construction of the 8.6 MWe phase 1 modular binary cycle power plant. The vendor loan is expected to be supplanted by project finance funding from the DOE and ITC cash grants. San Emidio re‐power is fully financed as of this report date.
Neal Hot Springs (50 MWe by 2014/Capex = $273 mln): Neal Hot Springs
is divided into 2 phases of 22 MWe by 2012 and 28 MWe by late 2013. For phase 1, GTH has drilled 2 production size wells which have resulted in positive heat indications (~7 MWe / well). Management plans to continue exploration activities to determine the potential of this asset and has committed to invest $4.5 mln towards these initiatives. In total management intends to invest $16 mln towards drilling activities during the next 12‐24 months for both phases of the project. As per current estimates, total capex to develop 50MWe power production will be approximately $273 mln with phase 1 budgeted for $120 mln. A significant portion (75%) of capex funding is expected to be met through DOE grants and loans. Phase 1 DOE‐backed project financing was secured on June 10, 2010 covering up to $102.2 mln in costs and can be drawn subsequent to firming of resource estimates. With the expected strategic equity investor by F3Q10, NHS 1 is contingently fully funded for completion in our view.
A summary of assets in operation, in development and exploration are summarized in the following exhibits. Exhibit 10: Assets in Operation (as of March 31, 2010) Source: Company Reports, Raymond James Ltd.
Project Location OwnershipGenerating Capacity (MW) Power Purchaser
Contract Expiration
Raft River (Unit I) Idaho JV 13.0 Idaho Power 2032Company
San Emidio (Existing) Nevada 100% 3.6 Sierra Pacific Power Corp 2017

RJ Equity Research │ Page 12 of 47
Exhibit 11: Assets in Development Source: Company Reports, Raymond James Ltd. Exhibit 12: Exploration Concessions Source: Company Reports, Raymond James Ltd. Exhibit 13: Resource Details Source: Company Reports, Raymond James Ltd. Management expects developments to occur in stages over the next five years which we integrate into our model and summarize in Exhibit 14.
Project Location Ownership
Target Development
(MW)Projected Commercial Operation Date
Capital Required ($mln)
Anticipated Power Purchase
San Emidio (Repower) Nevada 100% 5.4 1st Quarter 2012 $30 NV EnergySan Emidio (Expansion) Nevada 100% 26.0 3rd Quarter 2013 $170 TBDNeal Hot Springs I Oregon 100% 22.0 4th Quarter 2012 $120 Idaho PowerNeal Hot Springs II Oregon 100% 28.0 3rd Quarter 2014 $154 TBDRaft River I (Repower) Idaho JV 3.0 1st Quarter 2011 $7 Idaho Power
Raft River (Unit II) Idaho 100% 26.0 1st Quarter 2014 $134Eugene Water and Electric Board
Raft River (Unit III) Idaho 100% 32.0 2nd Quarter 2015 $166 TBD
Project Location Ownership
Target Development
(MW)Gerlach Nevada 60% TBDGranite Creek Nevada 100% TBDEl Ceibillo Guatemala, S.A. 100% TBD
PropertyProperty Size (square miles) Temperature (°F)
Resource Potential (MW) Depth (Ft) Technology
Raft River 10.8 275‐302 127.0 4,500‐6,000 Binary San Emidio 35.8 289‐305 68.0 1,500‐2,000 Binary Neal Hot Springs 9.6 311‐347 50.0 2,500‐3,000 Binary Gerlach 5.6 338‐352 18.0 TBD Binary Granite Creek 8.5 TBD 25.0 TBD Binary El Ceibillo 38.6 410‐446 TBD TBD Steam

RJ Equity Research │ Page 13 of 47
Exhibit 14: Estimated Project Development Schedule (as of August 10, 2010) Source: Company Reports, Raymond James Ltd. 1. Raft River (Idaho) – Location of Primary Production Plant; 39 MWe Production Planned in 5‐years The Raft River Valley in southeastern Idaho lies adjacent to the Snake River Plain volcanic rift zones, and is one of the well known geothermal hotspots in the U.S. with geothermal exploration activity dating back almost 3 decades. With limited focus on renewal energy sources during that time, the first drilling activity in this region was carried out for agriculture irrigation. This initial geothermal exploration drilling resulted in the discovery of a “moderate” temperature (275°F‐300°F) reservoir at a depth of 5,000 ft (1,525 meters). During the initial phase, 5 wells (exploration/production) were drilled to that depth and 2 injection wells were drilled to 3,500 ft (1,050 meters). Several companies and U.S. government organizations were involved in exploration activities during the initial stages, which led to development of a 7 MWe U.S. Department of Energy (DOE) demonstration plant, which was the world’s first commercial size binary geothermal power plant. Total investment in this asset during this initial phase was ~$40 mln. The project was eventually shut down in the ‘80s due to lack of interest for renewal energy initiatives. GTH acquired the Raft River asset in 2002 and recommenced the exploration and drilling activity in 2004. This assessment enabled management to conclude that this asset could support production capacity up to 10 MWe. Subsequently, the company awarded a contract to Ormat Nevada (ORA–NYSE) to build the
F1Q10 F2Q10 F3Q10 F4Q10 F1Q11 F2Q11 F3Q11 F4Q11 F1Q12 F2Q12 F3Q12 F4Q12 F1Q13 F2Q13 F3Q13 F4Q13 F1Q14 F2Q14 F3Q14 F4Q14
Raft River Unit I Capacity (i) Capex $mln
Raft River Unit II Capacity(ii) Capex $mln
San Emidio ‐ Existing CapacityCapex $mln
San Emidio Capacity Stg I Repower Capex $mln
San Emidio Capacity Stg 2 Expansion Capex $mln
Neal Hotsprings Unit I CapacityCapex $mln
Neal Hotsprings Unit II CapacityCapex $mln $15
Total CapacityCapex $mln
(i) To be jointly funded by GTH and Goldman Sachʹs subsidiary(ii) Potential JV with Aqua Caliente may result in sharing of output split 50:50
$2028MW
$85
Timeline & Capex
$40
$7
22MW$40
26MW (GTH share 13MW)$134
Projects
10MW 13 MW
12.7 MW 15.7 MW 124 MW44 MW 70 MW
$30
$40
TBD$47 $85 $212 $237
26MW$170
2.7MWNIL
9.0 MW

RJ Equity Research │ Page 14 of 47
turnkey power plant. Construction commenced in June 2006, and commercial production started in January 2008. Note that GTH expanded the Raft River asset in June 2007 by acquiring 1,685 additional acres of land, thereby increasing total acreage of the asset to almost 7,000 acres (28 Sq Kms). The company currently has 4 permits in place for the Raft River project deemed necessary for continued operations: (i) Geothermal well permits for production and injection wells issued by the Idaho Department of Water Resources, (ii) a Conditional Use Permit for the first two power plants was issued by the Cassia County Planning and Zoning Commission in April 2005, (iii) Idaho Department of Environmental Quality issued Air Quality Permit to permit construction, and (iv) a Wastewater Reuse Permit issued by the Idaho Department of Environmental Quality in February 2007. Exhibit 15: Raft River Details Source: U.S. Geothermal, Raymond James Ltd.
Project Description Project LocationDetails ‐ 1723.93 acres (10 parcels, collectively referred to as the US Geothermal
Property ‐ Idaho)‐ 13 MWe gross capacity for the plant at RR1, well RRP‐7 underwent temperature decline which requires repower, currently generating an average of 7.8MWe net due to lap joint failure and pump issue on two wells ‐ expect repairs completed by 1Q2011
‐ RR2 to begin construction in 1Q2012 target 1Q2014 start date, 26MWe target‐ RR3 to begin construction in 3Q2013; target 2Q2015 start date, 32MWe target
Transmission Line Notes
‐ Transmission line connected to RR1
Exploration Notes ‐ Actual production temperature for existing wells: 274‐302°F‐ Resource potential: 127MW‐ 4 production and 3 injection wells‐ Depth: 4,500‐6,000 ft
Production Notes ‐ RR1: GTH investment of $17.9mln in cash and property‐ Construction cost estimated at $7mln for RR1, $134mln for RR2 and $154mln for RR3‐ Expect to receive DOE loan for 75% of the capex‐ Variable 13MW PPA existing for RR1 at ~$53.6/MWh base rate escalating 2.1% p.a. until yr 15, increasing 0.6% thereafter, expiring in 2032. 16MW 25 yr‐PPA for RR2 in place since February 2008, but entire concessions is being renegotiated for 45.5MW PPA be
Location Notes: ‐ Commercial airport 90 miles away ‐ 55 miles southeast of Burley, Cassia County‐ 138k line is located adjacent to RR Unit I
Other Notes: ‐ Commercial operation for RR1 started on Jan 3, 2008‐ RR1 structure as JV with Goldman Sachs at 50% interest: GTH gets 35% of net profit/losses‐ Property assigned to GTH includes seven production and injection wells, seven monitoring wells, the Stewart lease, the Crank lease, the Newbold lease, the Doman lease and the Glover lease. All permits and contracts have also been assigned to Raft River En

RJ Equity Research │ Page 15 of 47
Raft River I Operational since January 3, 2008 ‐ JV with Goldman Sachs Until July 2006, GTH financed the entire development of the Raft River project through capital raised via equity financing. However, in August 2006 management revised its construction financing strategy for the Raft River project by establishing a JV with Raft River I Holdings LLC (a subsidiary of Goldman Sachs) towards monetizing its tax assets (50:50 interest). As part of the arrangement, Goldman Sachs/Raft River I Holding contributed $34.2 mln while GTH contributed cash of $5 mln and transferred asset/property rights valued at $1.5 mln. To date, GTH has contributed a total of ~ $17.9 mln in cash and property to the project, while Goldman Sachs contributed $34.2 mln in cash. In September 2007, Idaho Power Company and GTH signed a new, 13 MWe, full output power purchase agreement (PPA). Idaho Power submitted the new PPA to the IPUC for their final approval, which was granted in January 2008. The new PPA replaced an existing 10 MWe, 20 year PPA and is part of Idaho Power’s 2006 formal request for geothermal electricity under which GTH was named the sole successful bidder in March 2007. The new 20‐year term PPA is for electricity sales of an annual average of 13 MWe, and is the first contract signed as part of ongoing negotiations between GTH and with Idaho Power for a total of 45.5 MWe. Idaho Power and GTH expect to use the first contract as a template for advancing negotiations for the output from the planned Raft River III plant and 26 MWe of planned production from the Neal Hot Springs (Oregon) project. Raft River I currently generates between 8.5‐9.5 MWe of power (net capacity of 13 MWe), which is sold to Idaho Power Company under a PPA expiring 2032. We note that management is still evaluating options to increase the power generation by testing potential for additional wells towards increasing the output to the nameplate capacity of 13 MWe.

RJ Equity Research │ Page 16 of 47
Exhibit 16: Raft River I Details Source: Company Reports, Raymond James Ltd. Raft River Unit II & III Details: Commercial operations for Unit II and Unit III are expected during C2014 onwards. Currently, management has ascertained the scope only for Unit II (operational in C2013‐C2014), while plans for Unit III have been discussed without any commitment to a time‐line. Raft River II is expected to have a nameplate capacity of 26 MWe, and the company is negotiating an agreement with a potential partner for development of the project which is expected to cost ~$134 mln to develop. Management has already undertaken several measures to complete the power plan development within the scheduled time frame. GTH and Eugene Water and Electric Board (EWEB), Oregon have already signed a PPA for the full 26 MWe annual output of Raft River II. With the execution of the EWEB PPA, and the increase of Unit I under the new Idaho Power PPA, the total planned output from the Raft River I, II and III power plants is expected to be 71 MWe,
according to management. The ongoing negotiations with Idaho Power relating to Raft River Unit III and Neal Hot Springs and the signed EWEB PPA recognize that the PPAs are contingent upon extension of the federal Production Tax Credit, successful resource drilling and an economically feasible resource discovery at Raft River and Neal Hot Springs.
Location ‐ IdahoCommercial Operations ‐ Since Jan 2008Nameplate Capacity ‐ Gross 15.8MW, Net 13MWCurrent Status ‐ 9.65MW‐11.7 MW Number of Wells ‐ 4 production and 3 injection wellsPPA ‐ Idaho Power for 13MW for 20 yrsTransmission capacity ‐ 138kv line is located adjacent to RR Unit I
JV with Goldman Sachs ‐ GTH gets 35% of net profit/lossesConstruction cost ‐ $7mlnRevenue from Idaho Power ‐ Price is split into 3 seasons: power produced at peak periods sold @120%of set price
Power produced in 3 month low season sold @ 75% of set pricePPA set price is $53.60 per MW/hr, escalating at 2.1% until yr‐15, and 0.6% after
PTC ‐ Available to Goldman SachsRevenue from RECs ‐ Sold to Holy Cross Energy, Colorado @ $7.50 for 1st 10 MW per yr.
Price decreases by $0.50 per MW until contract ends 2017
Additional revenue ‐ Cash payment from RR I to GTH for 1st 4‐yrs of operations incldwater lease (900K), management fee ($250K) and cash distributions ($100K)Total including RECs, GTH gains $1.6mln per year for 1st 4‐years
Financial Details

RJ Equity Research │ Page 17 of 47
The Raft River project was awarded a $10 mln grant by the US DOE in 2009 for Enhanced Geothermal System development work. Work began in February 2010, with ~4.7 mln proceeds being allotted in the first phase. 2. San Emidio (Nevada) In May 2008, GTH acquired the geothermal assets of Empire Geothermal Power LLC and Michael B. Stewart (collectively referred to as the Empire Acquisition) for $16.6 mln. The acquisition included an operational 3.6 MWe (nameplate capacity) geothermal power plant with production and injection wells and a transmission line. Additionally, the transaction also transferred rights to 2 assets: the San Emidio assets and the Granite Creek assets. The San Emidio assets cover an area of ~ 22,944 acres (92 sq. kms) of geothermal leases and ground water rights used for cooling water. The Granite Creek asset covers ~5,414 acres (22 sq.kms) of geothermal leases, and is extremely close to a geologic structure known to host geothermal features including the Great Boiling Spring and the Fly Ranch Geyser. The San Emidio project has 6 permits in place necessary for continued operations: (i) Geothermal well permits for production and injection wells issued by the Nevada Division of Minerals, (ii) a Special Use Permit issued by the Washoe County Board of Commissioners in July 1987, (iii) an Air Quality Permit to Operate from Washoe County renewed in January 2008, (iv) a Surface Discharge Permit from Nevada Division of Environmental Protection issued in June 2001, (v) an Underground Injection Permit from Nevada Division of Environmental Protection issued in August 2000, and (vi) construction permit granted on August 2010. The company expects construction to begin in 3Q10 ensuring San Emidio will qualify for the ITC cash grant.
RJ Equity Research │ Page 18 of 47
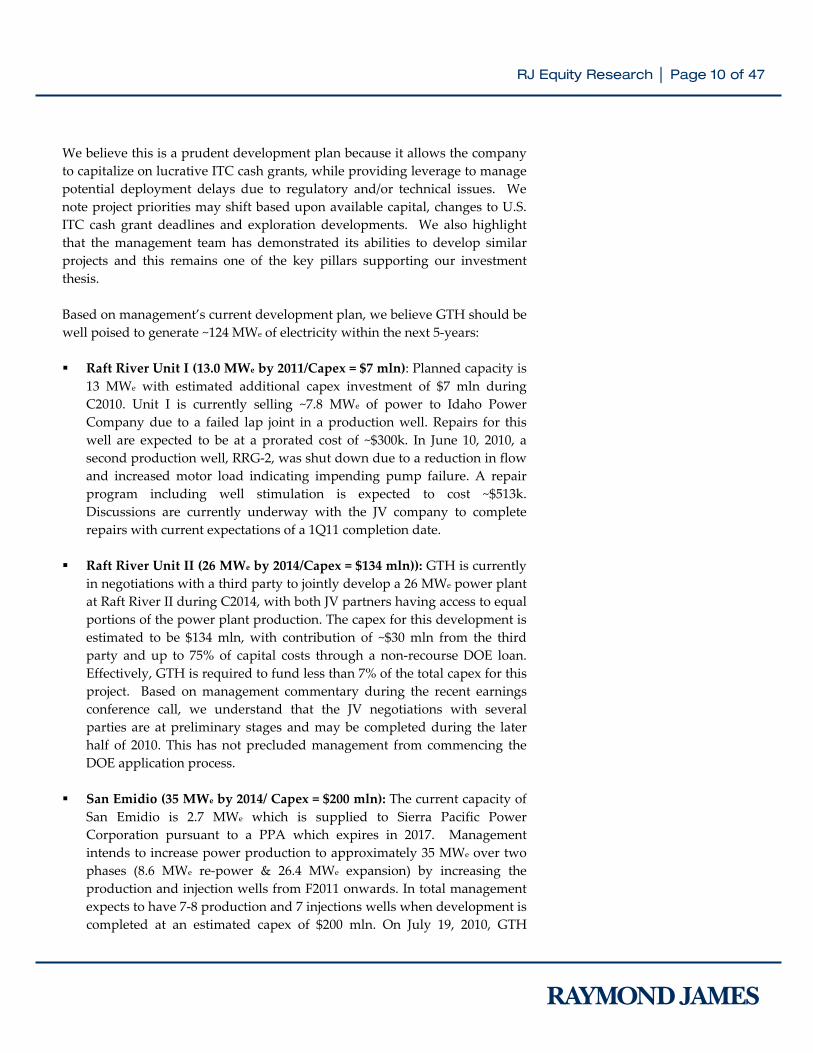
Exhibit 17: San Emidio Summary Source: U.S. Geothermal, Raymond James Ltd. Several studies highlight the potential for this asset. Based on an internal review, the company contends that the existing production wells can provide 4,500 to 5,000 gallons per minute of 290 to 300°F fluid to the current power plant which has the potential to generate 10 MWe using a modern binary cycle power plant. Additionally, an independent report prepared by Black Mountain Technology in 2008 contends that these assets have a potential for 44 MWe of power generation per year for the next 30 years. To date, 80% of the geologic mapping is complete and a seismic survey is scheduled to start in mid‐September. In 2009, due to economic uncertainties and potential lack of access to capital, management suspended development plans for the San Emidio asset which involved an increase in production to 27 MWe. The current power plant underway involves construction of a single 9 MWe plant (similar to Raft River Unit I), which is estimated to cost $26 mln – $30 mln.
Project Description Project LocationDetails ‐ Located in San Emidio Desert, Washoe County, Nevada, USA
‐ 22,944 acres of geothermal leases and ground water rights acquired
‐ 3.6 MW currently generated‐ Approx. 22 years old, currently selling approximately 2.5 MW (net)
‐ Repower phase to begin construction in 2Q2010, with commercial operations to commence in C1Q2012‐ Expansion phase to begin construction in 3Q2010, with commercial operations to commence in 3Q2013
Transmission Notes ‐ Currently in the third phase study for 45 MW option
‐ a draft interconnection agreement is expected from Sierra Pacific Power by 2Q2010, and completed by year end
Production Notes ‐ Repower phase cost estimated at $30mln ‐ modernization of equipment, expansion phase cost estimated at $170mln‐ 75% of cost expected to be funded by DOE loan, remainder funded through equity‐ $30mln vendor financed non‐recourse loan secured with TAS Energy on July 19, 2010, which will be replaced with DOE backed loans upon qualification‐ Investment Tax Credits may be used in connection with both phases ‐ $60mln expected.‐ Currently uses 4 1.2MW (gross) Ormat Energy Converters, five production wells (2 in use, 3 in standby) and four injection wells (3 in use, 1 on standby) with a cooling tower‐ Existing production wells can provide 4,000‐5,000 gallons/min of 280 to 300°F fluid to the plant‐ Current 30‐yr expires in 2017, new PPA expected by C4Q2010
Location Notes: ‐ Plant is connected to transmission grid via 60 kV intertie
Other Notes: ‐ Awarded $3.8mln in Recovery Act funding under ʺInnovative Exploration and Drilling Projectsʺ

RJ Equity Research │ Page 19 of 47
The 21‐year old power plant at San Emidio which employs 4 binary cycle units is the company’s second operating geothermal power plant. Currently the power plant sells an average of ~2.5 MWe per year to Sierra Pacific Power Corporation pursuant to a PPA which expires in 2017. Management’s development plan for San Emidio includes the construction of three modular binary plants, which is based on the estimation that 7‐8 production wells will need to be drilled to support this additional capacity generation. Total capex cost for this development is estimated to be $200 mln over two phases with up to 75% of the financing expected to be funded from DOE grants and loans and from ITC cash grants. On July 19, 2010, GTH secured a $30 mln non‐recourse vendor financing from TAS Energy who will construct the phase 1 binary cycle power plant. TAS Energy provided price and performance guarantees and posted a bond to secure the contract – thereby mitigating construction risk in our view. The vendor loan will be replaced with the DOE loan upon qualification. Phase 1 as a result is fully financed as of this reporting date. San Emidio was also awarded $3.77 mln in grant funding from the U.S. DOE in late 2009 to aid in advanced geophysical exploration techniques being utilized on the site. Under the terms of the grant provisions, proceeds will be disbursed on an in‐progress billing format. Exhibit 18: San Emidio Project Status Source: Company Reports, Raymond James Ltd.
San Emidio Project Details Ownership Interest 100%Location ‐ NevadaCommercial Operations ‐ 1987, Acquired by GTH in April 2008Nameplate Capacity ‐ 3.6MWCurrent Status ‐ Net 2.7MWNumber of Wells ‐ 7 including 2 current producing, 2 on standby PPA ‐ Sierra Power Corp (upto 2017)Construction cost ‐ N.A ‐ Completex
Plan to bring total from San Emidio to 10.8MWCommercial Operations ‐ Expected 2012‐2013Number of Wells ‐ Uses current wellsPPA ‐ In discussionsConstruction cost ‐ $30mln expected during C2011 and C2012
Plan to bring total from San Emidio to 36.8MWCommercial Operations ‐ Expected 2013‐2014Number of Wells ‐ 7‐8 wells in totalPPA ‐ In discussionsConstruction cost ‐ $170mln expected during C2011 to C2013
San Emidio Expansion
San Emidio Re‐Power I

RJ Equity Research │ Page 20 of 47
3. Neal Hot Springs (Oregon) In September 2006, GTH acquired 5,409 acres (10 sq. kms) of property at Neal Hot Springs in Oregon, and expanded its rights to another ~ 758 acres (3 sq kms) in February 2007 through a lease agreement with a subsidiary of Phelps Dodge – Chevron Resources. The initial plan was to develop the Neal Hot Springs asset into a 25+ MWe facility, however, based on revised studies the company expects to produce ~22 MWe of net power utilizing 3 modular units, with commercial operation scheduled for 2011. Drilling of the first well was completed in June 2008 adjacent to the discovery well drilled by Chevron Resources in l979, and the company has applied for the permits for 3 more drilling locations that include 2 production wells and 1 injection well. To meet the 22 MWe target, management believes that 3‐4 production and 4‐5 injection wells with an average depth of 2,500‐ 4,000 feet will be required. The drill program for all 7‐9 wells is expected to be completed during 2H11. The construction cost of the project is estimated to be ~ $120 mln. This includes the cost of a 10.3 mile transmission line with a capacity of 36 MWe at a cost of $3.2 mln. Exhibit 19: Neal Hotsprings Overview Source: U.S. Geothermal, Raymond James Ltd.
Project Description Project LocationDetails ‐ Geothermal resource located in Eastern Oregon
‐ 50 MW of target development ‐ 22MW for phase I to be completed by 4Q2012, 28MW for phase II to be completed by 4Q2013.
Transmission Line Notes
‐ Adjacent to transmission line ‐ transmission line right‐of‐ways acquired
Exploration Notes ‐ First production well completed in Jun, 2008‐ Step‐rate flow test resulted in a flowing production temp of 286.5°F
‐ 11 temperature gradient holes ranging in depth from 500 to 1,060 feet have been completed, 7 of which are being deepened‐ Another 3‐5 temperature gradient holes expected to be drilled with planned depth of 2,000 feet‐ Probable reservoir temperature as measure with a geothermometer is 311‐347°F
Production Notes ‐ expect up to 8 wells (4 production, 4 injection) need to be drilled, but mgmt estimates peg it at 2‐3 production and injection wells each, budget of 16mln total ‐ ~20 days to drill‐ drilling to begin after equity investor finalized in July‐ 2 production wells completed hosting 286°F (141°C) temperatures at ~2900 ft‐ 25 yr‐PPA secured at base rate of $96/MWh, escalating at a variable rate ‐levelized cost of $117.65/MWh
Other Notes: ‐ permitting completed for 15 temperature gradient drill holes and 9 geothermal wells‐ Expect DOE loan to provide up to 75% of the $120mln capex up to a maximum loan amount of $102.2mln, 7mln equity already spent, conditional DOE loan approved.‐ Expected $6‐7mln equity investment by GTH and residual by third party under mezzanine‐type agreement‐ expect ~10mln US govʹt grant and modular builds of power plants using TAS 7.5‐8MW (net) power turbines

RJ Equity Research │ Page 21 of 47
Exhibit 20: Neal Hot Springs Unit I and II Project Details Source: Company Reports, Raymond James Ltd. GTH has received the Conditional Use Permit for construction of its proposed net 22 MWe power plan at Neal Hot Springs in October 2009. Neal Hot Springs was recently awarded a $102.2 mln non‐recourse low‐interest loan by the U.S. DOE which may cover up to 75% of the capital costs. In addition, the project qualifies for the new investment tax credit of 30% of total project costs which can be converted into a cash grant from the U.S. Treasury upon completion. Construction of a binary cycle plant is expected commence in mid‐2010. The new plan, designed to deliver 22 MWe of net power to the grid is scheduled to commence operations in late 2011. Management is currently in advanced negotiations with a strategic partner to provide a portion of the remaining equity required to complete the project and draw down the project finance loans. Current front‐runners were indicated to be a “green” focused fortune 500 energy corporation as well as a utility. We estimate the amount is ~$22‐$23 mln, with GTH injecting $7‐8 mln into the project. Once finalized, NHS phase 1 will be fully funded. NHS phase 2 has become a lower priority for the company given the looming December 31, 2010 construction start deadline to qualify for the ITC cash grant. We believe NHS 2 may still come online late 2014, however depending on cash flows from operations, developments in Guatemala and financing possibilities, NHS 2 online date may be pushed out to 2015. Management has also indicated they are open to strategic partnerships to accelerate NHS project developments however.
Neal Hotsprings I & II ProjectLocation ‐ OregonOwnership Interest ‐ 100%Commercial Operations ‐ Expected in C2012‐C2013Nameplate Capacity ‐ Expected 26MW with three binary modulesNumber of Wells ‐ 7‐8 Wells in totalConstruction cost ‐ $273mln (Unit I ‐ $119mln, Unit II, $154mln)PPA ‐ Idaho Power signed

RJ Equity Research │ Page 22 of 47
4. Other properties with current asset portfolio Gerlach (Nevada) With initial exploration/development plans completed, slim hole drilling is slated to begin in 2H10 on this site to firm up resource estimates. Drilling will likely be completed mid‐2011. GTH purchased rights to 1,252 acres BLM (Bureau of Land Management) geothermal lease for $0.3 mln in October 2007, and in May 2008, entered into a JV agreement with Gerlach Green Energy LLC (60:40 interest split) to form Gerlach Geothermal LLC to explore the Gerlach geothermal system in north‐western Nevada. The JV owns geothermal rights for 3,615 acres (14 sq. kms) of BLM leases located near GTH’s Granite Creek leases which were acquired as part of the San Emidio geothermal power plan acquisition. This geothermal area is well known with an extensive database from previous studies and exploration drilling. Gerlach was ranked as the No. 3 top resources in Nevada by the U.S. Geological Survey, and has an estimated potential resource of 18 MWth and temperatures of 338◦F – 352◦F. GTH contributed $2 mln toward the project and BLM geothermal leases valued at approximately $0.3 mln for its 60% stake, while GGE contributed one BLM geothermal lease and one private geothermal lease. Granite Creek (Nevada) GTH acquired the Granite Creek assets as part of the San Emidio acquisition in May 2008. These assets are comprised of 5,414 acres of BLM geothermal leases situated roughly six miles north of Gerlach, Nevada. GTH completed the initial testing phase in December 2008 and intends to have additional temperature‐gradient exploration wells. Current estimates peg Granite Creek at 25 MWth. GTH had attributed $1 mln of the San Emidio purchase price to Granite Creek. We understand that further development of the Granite Creek assets does not form part of the current development emphasis Guatemala GTH acquired the Guatemala assets in April 2010 and is 247,710 acres (100 sq. km) in size. A key asset is the El Ceibillo geothermal project which currently has nine existing geothermal wells of depths ranging from 560 ft to 2,000 ft drilled in the 1990s and a significant amount of relevant geophysical and other technical data. Key indicators such as fumeroles and hot steam are readily detected in the region. Six of the wells have measured temperatures in the range of 365 to 400°F (185‐204°C) with suggestions that this reservoir contains higher permeability reservoirs and temperatures. Two are currently used for steam water industrial uses, which are relatively minimal in energy value – i.e. can be provided with residual energy subsequent to geothermal power

RJ Equity Research │ Page 23 of 47
generation. The concession is located near major transmission lines, and is 14 miles southwest of Guatemala City, the capital of the Republic of Guatemala and the largest city in Central America and the Caribbean. This project has been pushed forward on project priority list despite its relative early stage because the other U.S. projects would not necessarily qualify for the U.S. ITC cash grants and the project has displayed high expected geothermal potential. Guatemala now ranks ~4th in project priority after San Emidio Repower & Expansion, NHS unit 1 and RR1 repairs. Management is fast‐tracking exploration and development plans on this project, including initiating preliminary discussions with potential financing providers, construction personnel and utilities. Third party studies indicate Guatemala may have untapped geothermal potentials up to 4GW, as evidenced by recent volcanic activity in the region. Management has previous in‐country operating experience with strong ties to the local geothermal industry. Guatemala is also a democratic nation supported by the United States government which allows for the purchase of political risk insurance and increases project financing availability. Exhibit 21: Guatemala Summary Source: U.S. Geothermal, Raymond James Ltd.
Project Description Project LocationDetails ‐ 24,710 acres, located 14 miles southwest of Guatemala City
‐ Regional geothermal attributes include fumeroles, active volcanic activity
Transmission ‐ Near major transmission lines
Location Notes ‐ 14 miles south of a major city‐ Guatemala is directly supported by US government, allowing for political risk insurance to be purchased‐ democratic region with tremendous geological endowments‐ several mining coʹs are active in the region‐ area predominantly steam dominated wells expected
Production Notes ‐ 9 wells with depths ranging from 560‐2,000 ft drilled in the El Ceibillo area within the concession during the 1990s.‐ 6 wells have measured reservoir temperature in the range of 365‐400°F, fluid sample suggests temperature potential of 410‐446°F‐ development plans starting in 2010
Other Notes ‐ 2 operating wells are used for a local steam water plant requiring minimal energy investment‐ GTH management has long history with Guatemala including close relationships with local geothermal industry founders

RJ Equity Research │ Page 24 of 47
Valuation Methodology
Comparables We evaluate U.S. Geothermal based on EV/EBITDA multiples given the long lives of geothermal power generation facilities. Our comparable companies’ analysis includes geothermal players who are still tracking in the exploration / construction phase with few generating assets, aside from Ormat. Excluding Ormat (which has historically traded more on an EBITDA multiple because of its more stable nature), the group trades at an EV/Resources of $0.47 mln/MWth and EV/Reserves of $3.78 mln/MWe. U.S. Geothermal trades at an EV/Resources of $0.23 mln/MWth and EV/Reserves of $2.46 mln/MWe. Ormat trades at C2010E EV/EBITDA of 13.8x. Exhibit 22: Comparable Companies Source: Company Reports, IBES, Raymond James Ltd.
U.S. Geothermal, Inc.All values in C$ mlns, except per share data or otherwise stated.
Ticker Price Mkt. Cap. EV/EBITDA P/E EV (C$mln/MW) Company Symbol FYE 24‐Aug‐10 ($ mlns) C09A C10E C11E C09A C10E C11E Resources Reserves
Ormat Technologies ORA Dec US$26.21 US$1,191 13.1x 13.8x 9.5x 17.4x 72.4x 26.7x $2.48 $3.83 Raser Technologies RZ Dec US$0.36 US$29 n.a. n.m. n.m. n.m. n.m. n.m. $0.72 $13.48 Sierra Geothermal (1) SRA Dec C$0.19 C$17 n.a. n.a. n.a. n.a. n.a. n.a. $0.10 n.m Nevada Geothermal NGP Jun C$0.56 C$53 n.m. 12.1x 8.4x n.m. n.m. n.a. $0.91 $3.47 Ram Power, Corp.* RPG Dec C$2.36 R R R R R R R R R Magma Energy Corp* MXY Jun C$1.22 $383 n.m. n.m. n.m. n.m. n.m. n.m. $0.48 $3.34
Wtd. Group Average n.m. 13.7x 9.4x n.m. n.m. n.m. $2.19 $3.81 Wtd. Group Average ex. Ormat n.m. n.m. n.m. n.m. n.m. n.m. $0.47 $3.78 U.S. Geothermal, Inc. GTH Mar C$0.79 $62 n.m. n.m. n.m. n.m. n.m. n.m. $0.23 $2.46 Note (1): LOI signed with Ram Power for takeover ‐‐ Ongoing Note *: Raymond James Covered Company
RJ Equity Research │ Page 25 of 47
Recommendation and Target
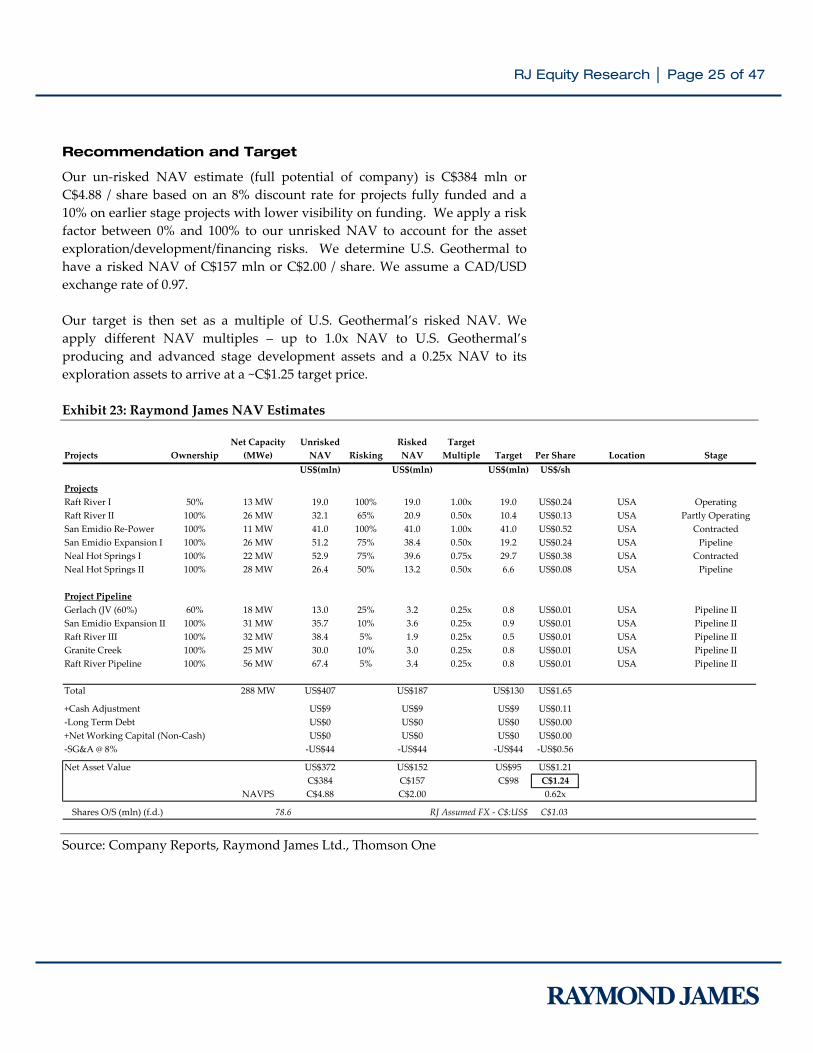
Our un‐risked NAV estimate (full potential of company) is C$384 mln or C$4.88 / share based on an 8% discount rate for projects fully funded and a 10% on earlier stage projects with lower visibility on funding. We apply a risk factor between 0% and 100% to our unrisked NAV to account for the asset exploration/development/financing risks. We determine U.S. Geothermal to have a risked NAV of C$157 mln or C$2.00 / share. We assume a CAD/USD exchange rate of 0.97. Our target is then set as a multiple of U.S. Geothermal’s risked NAV. We apply different NAV multiples – up to 1.0x NAV to U.S. Geothermal’s producing and advanced stage development assets and a 0.25x NAV to its exploration assets to arrive at a ~C$1.25 target price. Exhibit 23: Raymond James NAV Estimates Source: Company Reports, Raymond James Ltd., Thomson One
Net Capacity Unrisked Risked TargetProjects Ownership (MWe) NAV Risking NAV Multiple Target Per Share Location Stage
US$(mln) US$(mln) US$(mln) US$/sh
ProjectsRaft River I 50% 13 MW 19.0 100% 19.0 1.00x 19.0 US$0.24 USA OperatingRaft River II 100% 26 MW 32.1 65% 20.9 0.50x 10.4 US$0.13 USA Partly OperatingSan Emidio Re‐Power 100% 11 MW 41.0 100% 41.0 1.00x 41.0 US$0.52 USA ContractedSan Emidio Expansion I 100% 26 MW 51.2 75% 38.4 0.50x 19.2 US$0.24 USA PipelineNeal Hot Springs I 100% 22 MW 52.9 75% 39.6 0.75x 29.7 US$0.38 USA ContractedNeal Hot Springs II 100% 28 MW 26.4 50% 13.2 0.50x 6.6 US$0.08 USA Pipeline
Project PipelineGerlach (JV (60%) 60% 18 MW 13.0 25% 3.2 0.25x 0.8 US$0.01 USA Pipeline IISan Emidio Expansion II 100% 31 MW 35.7 10% 3.6 0.25x 0.9 US$0.01 USA Pipeline IIRaft River III 100% 32 MW 38.4 5% 1.9 0.25x 0.5 US$0.01 USA Pipeline IIGranite Creek 100% 25 MW 30.0 10% 3.0 0.25x 0.8 US$0.01 USA Pipeline IIRaft River Pipeline 100% 56 MW 67.4 5% 3.4 0.25x 0.8 US$0.01 USA Pipeline II
Total 288 MW US$407 US$187 US$130 US$1.65
+Cash Adjustment US$9 US$9 US$9 US$0.11‐Long Term Debt US$0 US$0 US$0 US$0.00+Net Working Capital (Non‐Cash) US$0 US$0 US$0 US$0.00‐SG&A @ 8% ‐US$44 ‐US$44 ‐US$44 ‐US$0.56
Net Asset Value US$372 US$152 US$95 US$1.21C$384 C$157 C$98 C$1.24
NAVPS C$4.88 C$2.00 0.62x
Shares O/S (mln) (f.d.) 78.6 RJ Assumed FX ‐ C$:US$ C$1.03

RJ Equity Research │ Page 26 of 47
With a ~58% implied return to target, we initiate coverage on U.S. Geothermal with an OUTPERFORM rating. As geothermal developers graduate into power producing companies, we expect their share prices to eventually start to trade off projected EBITDA (like Ormat). As a sanity check, we calculate what our current target price implies in terms of an EV/EBITDA multiple looking out into the future. We determine that our 2010 target price implies ~8.4x C2014E EBITDA discounted back at 12.5% to 2010. Ormat currently trades at roughly 13.8x C2010E EBITDA. Note for this analysis we include future expected dilution of $70 mln over the next three years priced at an average $1.00 per share. We also adjust for the equity value of the Raft River 1 JV to arrive at our target price of $1.25. Exhibit 24: Raymond James Comparables Estimates Source: Company Reports, Raymond James Ltd., Thomson One
Using a 8.4x Multiple C2014E EBITDA exc. Raft River 1 65.3 Sensitivity of Implied 2010 Share PriceC2013E Debt 293.4 Forward EBITDA MultipleC2013E Cash 4.6 1.25$ 8.0x 8.4x 9.0x 10.0x 11.0x
10.0% $1.23 $1.35 $1.54 $1.85 $2.16Multiples 12.5% $1.13 $1.25 $1.42 $1.70 $1.98Forward Multiple Target 8.4x 15.0% $1.05 $1.15 $1.31 $1.57 $1.832013 Enterprise Value 548.5 17.5% $0.97 $1.07 $1.21 $1.45 $1.682013 Equity Value 259.7 20.0% $0.90 $0.99 $1.12 $1.34 $1.56
Current Share o/s 78.6 Sensitivity of Implied 2010 Share Price ReturnsAssumed Equity Raise (# shares) 70.0 Forward EBITDA Multiple
148.6 58% 8.0x 8.4x 9.0x 10.0x 11.0x10.0% 55.5% 71.2% 94.7% 133.9% 173.0%
2012 Implied Share Price 1.80$ 12.5% 43.5% 57.8% 79.3% 115.1% 150.9%15.0% 32.7% 45.8% 65.5% 98.3% 131.1%
Discount Rate 12.5% 17.5% 23.1% 35.1% 53.1% 83.2% 113.3%1.60$ 20.0% 14.4% 25.4% 42.0% 69.7% 97.3%
2011 Implied Share Price 1.42$ Implied Share Price inc. RR Equity 1.25$ Raft River 1 2010 Equity Value 18.2 Implied % Above Current Share Price 58% RJ Assumed FX ‐ C$:US$ 1.03
Discount Rate
Discount Rate

RJ Equity Research │ Page 27 of 47
Investment Risks
Given the infancy of the industry, the vast number of regulatory aspects which govern and impact each project and vulnerability of project developments to financing commitments, we believe the following summarizes the key risks and should be read in conjunction with a broader understanding of the industry and the operations of GTH: Exploration/Development Risk: Establishing a resource and developing
the capacity to economically extract the geothermal resource is a multi‐year project (upwards of 5+ years). At every stage of the project, there are risks which may significantly alter the project economics. E.g. Successful exploration holes may not necessarily lead to production wells. Furthermore, shifts in tectonic plates, seismic anomalies and other natural events may negatively impact company operations. Of particular note, GTH requires successful firming of NHS 1 resources to facilitate the drawdown of the U.S. DOE loan, failing which may lead to material delays in project timeframes.
Environmental/Regulatory Risk: Exploration and development of geothermal properties require environmental and other related approvals. Requirements to comply with federal and local environmental regulations may result in additional expenditure. Similarly, failure to receive necessary permits on a timely basis may delay operation schedules (e.g. federal permitting processes may take up to 2‐3 years to complete). We highlight that permits are needed at every stage of a project (commercial drilling, construction, water permits etc.), and delays can usually add a few months to a project’s timeline. Additionally, geothermal companies operate in active geothermal plateaus where natural disasters including but not exclusive of unexpected rock/mineral formations, earthquakes, volcanic eruptions, etc. may be encountered.
Government Incentives: The PTC and ITC credits play a critical role in driving investment towards alternative energy sources. The U.S. government has allowed the PTC to expire on three separate occasions (1999, 2001 and 2003) which coincided with a noticeable drop off in newly installed geothermal capacity across North America. The cancellation or non‐renewal of any existing incentives can significantly alter the economic viability of current and future projects. Currently, the U.S. ITC / PTC deadlines are for plant operations to begin by 2013, after which they will cease.
Financing: Development of geothermal plants require significant upfront capital costs (~$4 mln per MWe). Failure or delays in securing appropriate financing may impact the economic feasibility of projects. Although recent awards of non‐recourse, low‐interest DOE loans have been made for NHS

RJ Equity Research │ Page 28 of 47
1, it is contingent upon certain conditions, failing which, the loans can not be accessed. Additionally, we estimate GTH will require an additional $70 mln (either through an equity raise or strategic investor) to develop its 124 MWe through to 2015.
Geothermal Resource/Reserve Risk: Geothermal resource estimates are categorized by inferred, indicated, measured, probable and proved resources and based on RJ’s best estimates of status, i.e. third party P90 estimates are categorized as inferred resources. The Canadian Geothermal Energy Association (CanGEA) standards were recently introduced as a measure to standardize the reporting of geothermal resources. However, as a result of the relatively short integration period for the CanGEA codes and the lack of full public disclosure of technical reports for each project as required by the code, resource estimates may not fully portray current standing according to CanGEA and may change subsequent to the publishing of this report.
Power Generation Capacity Estimates: The assigned power generation capacities of geothermal reservoirs are estimates based upon scientific analysis and planning for economic feasibility which heavily rely on probabilities. Multiple variables are required to be in‐line in order to realize the full potential, failing which, operational results, project economics and financial results may be impacted.
Electricity Pricing: Although long term PPA’s shelter geothermal projects from electricity pricing volatility, fluctuations in the spot market can be severe until they are secured. The volatility exposes GTH to re‐pricing risk subsequent to contract end.
Transmission Infrastructure: According to the Pew Center for Climate Change, costs for constructing transmission lines are estimated to be $2 mln‐$4 mln per mile and can take between 6‐10 years. Proximity to existing power lines can improve project economics. In the U.S., transmission lines can only be constructed once multiple approvals and permits have been obtained at municipal, state and federal levels. The process is largely driven by the need to satisfy the National Environmental Policy Act or comparable state environmental legislation. Geothermal companies may be challenged by individuals or groups opposed to the construction of facilities, which could further hinder operations. The proposed Clean Renewable Energy and Economic Development Act of 2009, currently under consideration, is expected to promote investments in transmission infrastructure and establish a streamlined planning and sitting process for transmission line projects.

RJ Equity Research │ Page 29 of 47
Political risk. GTH’s Guatemalan concession is fast becoming a priority to management. Guatemala, although a member of CAFTA (Central American Free Trade Agreement) with the United States, is subject to political, civil, military and other turmoil prevalent in emerging market economies. Although management has close ties to the geothermal space in Guatemala and Guatemala remains a relatively insignificant asset (investment‐wise), at this time, political risks remain a factor to materially impact GTH’s future financials and growth profile.
Please refer to company MD&A for full briefing on risk factors.

RJ Equity Research │ Page 30 of 47
Appendix 1: A Brief Refresher on Geothermal Energy
Overview: Geothermal energy refers to the power generated using heat from the Earth’s core. It is considered renewable energy because the energy is essentially capturing emitted heat which otherwise would be radiated into space. According to the Geothermal Energy Association, the heat continuously flowing from the Earth’s core is estimated to be equivalent to 42,000 GW of power (20+ times today’s global electricity generation). If harnessed properly, geothermal could become a material contributor to global electricity generation. The Earth’s natural heat produces molten rock (magma) which heats/creates reservoirs of superheated fluids (hot water or brine) within short distances of the Earthʹs surface. Geothermal electricity generation is possible by drilling wells to bring to the surface these superheated fluids or steam to drive turbines.
Exhibit 25: Geothermal Reservoir Source: U.S. DOE – NREL white paper report (http://www1.eere.energy.gov/geothermal/pdfs/40665.pdf) Four major factors must align together to ensure geothermal power generation occurs. The combination of factors can impact the economic viability in a more general sense through industry measured cost / MWe of well productivity and $ cost / MWe of power.

RJ Equity Research │ Page 31 of 47
1. Heat source and temperature. The economics of geothermal plants are based on temperatures – higher temperatures increase the resource size.
2. Fluid flow. The resource must contain water / fluids / steam which act as a heat transfer medium.
3. Rock permeability. Fluids must be able to flow underground through the rock bed. Without permeability, any (if at all) fluids siphoned from the resource would not be replenished – resource viability suffers.
4. Depth. The greater the well depth, the greater the cost to access the resources. Proximity to the surface can become a major hindrance in the early exploration and development stages.
In addition to these factors, two major economic factors must be considered as well:
1. PPA pricing. PPA pricing in the United States varies, but premium prices are those above $100/MWh of electricity generated. Existing PPA’s may be significantly under the market price, lowering its economic value over the life of the PPA.
2. Proximity to transmission lines and demand. Costs can be excessive to build, thus the proximity to existing high power transmission lines and right of way permits can hinder the overall levelized costs.
Incentives Support by the U.S. Government for geothermal technology dates back to 1970 when the geothermal Steam Act was enacted to promote geothermal exploration and development. Since then, periods of rising oil and gas prices and an increasing awareness of environmental damage caused by fossil fuel usage has prompted government administrations to expand incentive programs and funding of alternative energy projects. The U.S. House of Representatives recently passed the American Clean Energy and Security Act (ACES). The acts sets tangible goals for greenhouse gas emission reductions (17% reduction from 2005 levels by 2020) through a cap and trade system. The bill calls for companies selling over 4 MWe/year to increase the proportion of electricity sourced from renewable energy to 15% by 2039 in a graduated fashion. The bill also calls for the establishment of a national Renewable Portfolio Standard (RPS) and the creation of an independent agency to promote clean energy investment. Government support for clean energy initiatives has traditionally come in the form of tax credits and accelerated depreciation deductions for tax purposes. The Production Tax Credit (ʺPTCʺ), first implemented in 1992 to support wind and bioenergy resources and recently renewed provides geothermal energy

RJ Equity Research │ Page 32 of 47
producers with an inflation‐adjusted $21/MWh tax credit for ten years for projects placed into service before 2014. The American Recovery and Reinvestment Act of 2009 (H.R.1) has revised credit by extending the in‐service deadline for geothermal energy producers to December 31, 2010. Projects eligible for the PTC are also eligible to instead receive an Investment Tax Credit (ʺITCʺ) equal to 30% (formerly 10%) of a project’s qualifying cost with no expiration date, although projects which do avail of the ITC are required to reduce the base for depreciation by 50% of the ITC. In addition, the ʺbonus depreciationʺ (i.e. the ability to depreciate 50% of the depreciable base in the first year of operation) for qualified renewable energy projects has been extended to include new projects placed into service by the end of 2009. Alternatively, projects completed or begun by December 31, 2010 can receive a government grant equal to 30% of the project cost (and forego the PTC or ITC). The grant is a cash payment of 30% of eligible costs that qualified developers can receive. The important aspect is that the cash grant can also be claimed on all of the intangible drilling costs at a geothermal project, meaning that between 90% and 95% of the project costs will be qualified for cash grant. The application of the grant can be applied once the project is placed in service (a certain level of electricity is being generated). According to the IRS press release (which can be viewed at http://www.irs.gov/newsroom/article/0,,id=206871,00.html): Extension of Renewable Energy Production Tax Credit (Section 1101): The new law generally extends the “eligibility dates” of a tax credit for facilities producing electricity from wind, closed‐loop biomass, open‐loop biomass, geothermal energy, municipal solid waste, qualified hydropower and marine and hydrokinetic renewable energy. The new law extends the ʺplaced in service dateʺ for wind facilities to Dec. 31, 2012. For the other facilities, the placed‐in‐service date was extended from December 31, 2010 (December 31, 2011 in the case of marine and hydrokinetic renewable energy facilities) to Dec. 31, 2013.
Election of Investment Credit in Lieu of Production Credit (Section 1102): Businesses who place in service facilities that produce electricity from wind and some other renewable resources after Dec 31, 2008 can choose either the energy investment tax credit, which generally provides a 30 percent tax credit for investments in energy projects or the production tax credit, which can provide a credit of up to 2.1 cents per kilowatt‐hour for electricity produced from renewable sources. A business may not claim both credits for the same facility.
The Recovery Act, signed in February‐2009, also provides the U.S. Department of Energy with the authority to issue loan guarantees totaling $6.0 bln up until
RJ Equity Research │ Page 33 of 47
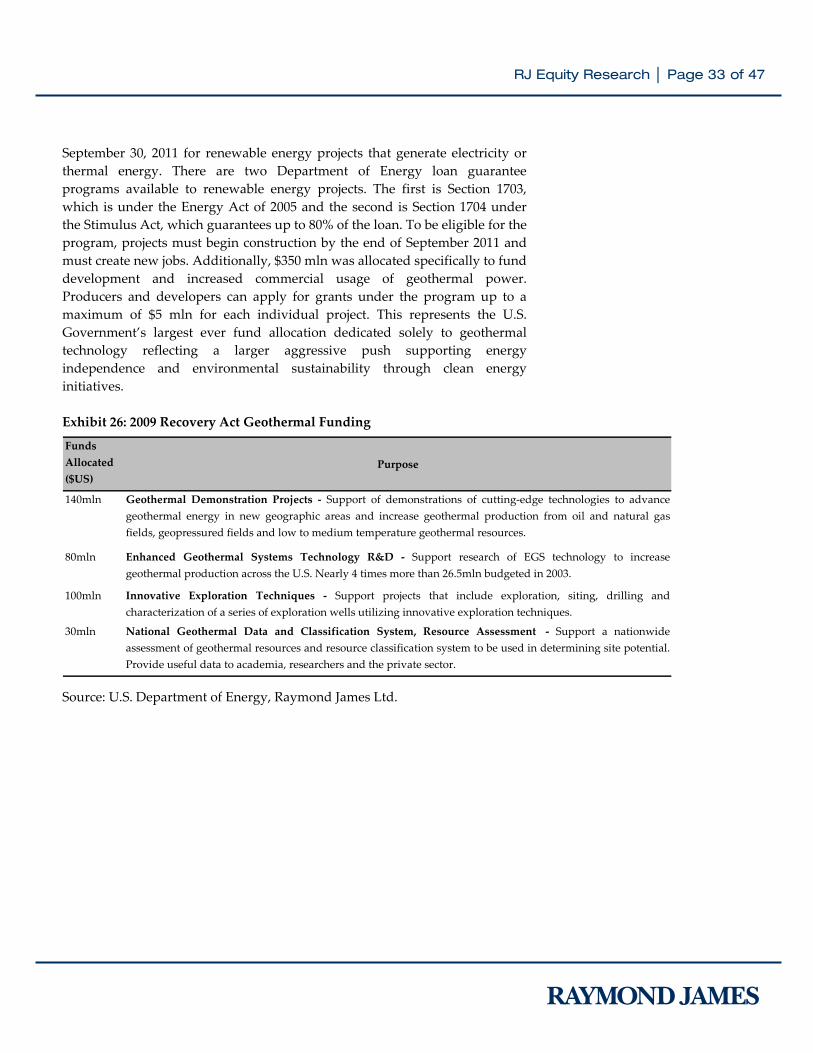
September 30, 2011 for renewable energy projects that generate electricity or thermal energy. There are two Department of Energy loan guarantee programs available to renewable energy projects. The first is Section 1703, which is under the Energy Act of 2005 and the second is Section 1704 under the Stimulus Act, which guarantees up to 80% of the loan. To be eligible for the program, projects must begin construction by the end of September 2011 and must create new jobs. Additionally, $350 mln was allocated specifically to fund development and increased commercial usage of geothermal power. Producers and developers can apply for grants under the program up to a maximum of $5 mln for each individual project. This represents the U.S. Government’s largest ever fund allocation dedicated solely to geothermal technology reflecting a larger aggressive push supporting energy independence and environmental sustainability through clean energy initiatives. Exhibit 26: 2009 Recovery Act Geothermal Funding Source: U.S. Department of Energy, Raymond James Ltd.
Funds Allocated ($US)
Purpose
140mln Geothermal Demonstration Projects ‐ Support of demonstrations of cutting‐edge technologies to advancegeothermal energy in new geographic areas and increase geothermal production from oil and natural gasfields, geopressured fields and low to medium temperature geothermal resources.
80mln Enhanced Geothermal Systems Technology R&D ‐ Support research of EGS technology to increasegeothermal production across the U.S. Nearly 4 times more than 26.5mln budgeted in 2003.
100mln Innovative Exploration Techniques ‐ Support projects that include exploration, siting, drilling andcharacterization of a series of exploration wells utilizing innovative exploration techniques.
30mln National Geothermal Data and Classification System, Resource Assessment ‐ Support a nationwideassessment of geothermal resources and resource classification system to be used in determining site potential.Provide useful data to academia, researchers and the private sector.

RJ Equity Research │ Page 34 of 47
Appendix 2: Why Invest in Geothermal?
Coveted base‐load power With rising electricity consumption, it is expected that by 2015 there will be a shortage of base‐load capacity in the world energy market. The energy gap will come as coal plants are closed down (coal plants generate roughly 50% of U.S. electricity; about 22% globally) due to toughening pollution controls. Since 2007, 95 proposed coal plants in the U.S. have been cancelled or postponed, which represents nearly half of the 200 plants proposed for construction since 2000. The Energy Information Administration (EIA) reports that more than 600 coal‐fired plants still produce about half of the power in the U.S. The government has pledged to reduce greenhouse gas emissions by 80% by 2050 – coal‐fired plants currently represent a good portion of those emissions. Exhibit 27: GHG Emissions Output Based on Power Plant Type Source: U.S. EPA
994
758
550
27.2 40.3 0
631.6
0
200
400
600
800
1000
1200
Coal‐fired Oil‐fired Gas‐fired Hydrothermal‐flash‐steam,
liquiddominated
Hydrothermal ‐The Geysers
dry steam fie ld
Hydrothermal ‐closed‐loop
binary
EPA average,all U.S. plants
CO2 (kg/MWh)
4.71 5.44
0.09
98
0.15
88
0.00
01
0
2.73
4
1.95
5
1.81
4
1.34
3
0 0.00
05
0
1.34
3
0.0001.0002.0003.0004.0005.0006.000
Coal‐fired Oil‐fired Gas‐fired Hydrothermal‐flash‐steam,
liquiddominated
Hydrothermal‐ The Geysersdry steam field
Hydrothermal‐ closed‐loop
binary
EPA average,all U.S. plants
kg/M
Wh
SO2 NO2

RJ Equity Research │ Page 35 of 47
There are ambitious alternative energy investment plans but not all renewable sources of energy can meet base‐load demand. Base‐load power is considered the minimum power that must be made available to consumers, and represents a stable and steady source of power. While the output of a wind or solar plant varies with climatic conditions, geothermal power plants boast average operating rates of 95% (i.e. the plant is producing electricity for 95% of a day’s duration), making geothermal a potential substitute for coal and nuclear plants and a highly coveted source of base‐load power. Exhibit 28: % of U.S. Electricity Generation from Coal Source: U.S. Department of Energy
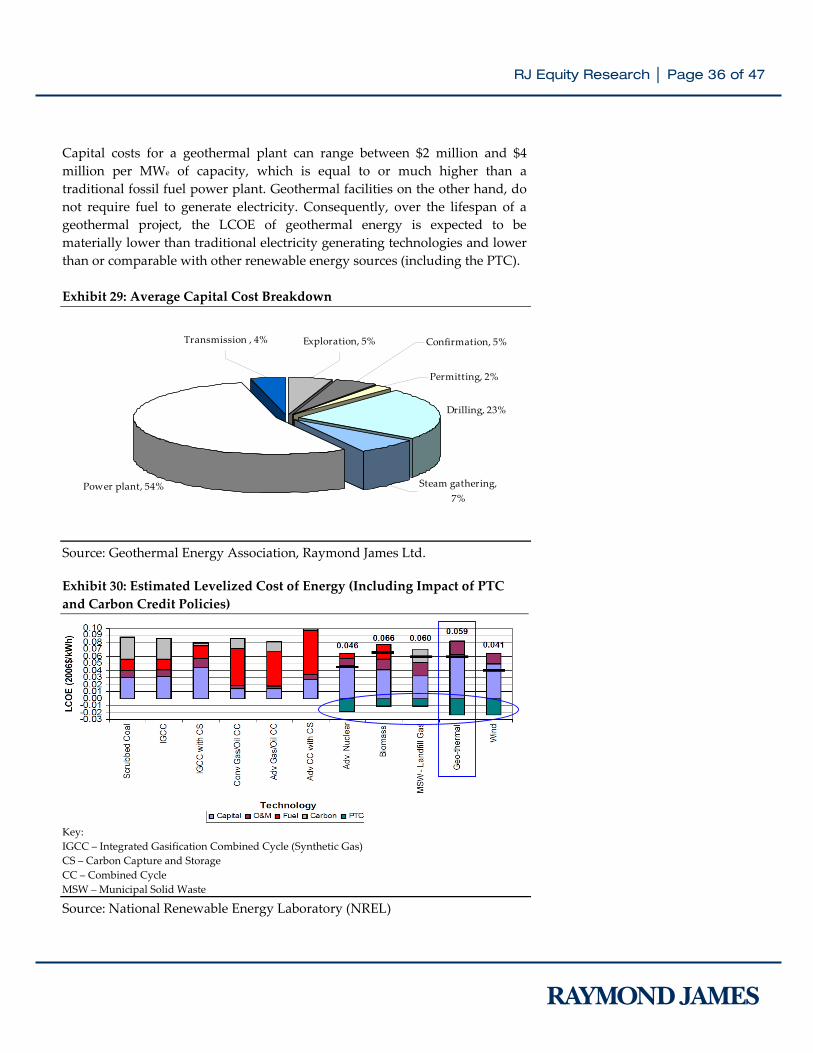
Attractive all‐in costs
Levelized Cost of Energy (“LCOE”) represents the “all‐in” cost of generating electricity for a particular system. It is usually represented as $/MWh or ¢/kWh and is a normalized value based on all costs over the lifetime of a project including the initial investment, O&M, fuel and financing expenses. According to the National Renewable Energy Laboratory, the LCOE for a geothermal plant, when including the value attributable to PTCs, is approximately $0.059/kWh ($59.00/MWh) versus $0.0875/kWh for a coal plant and $0.085/kWh for a conventional gas plant. The PTC, in isolation, reduces the LCOE for a geothermal plant by approximately $0.02/kWh. Conversely, carbon credit costs increases the LCOE for a coal plant by roughly $0.035/kWh.
40%
43%
45%
48%
50%
53%
55%
1995 1996 1997 1998 1999 2000 2001 2002 2003 2004 2005 2006 2007 2008 2009
RJ Equity Research │ Page 36 of 47
Capital costs for a geothermal plant can range between $2 million and $4 million per MWe of capacity, which is equal to or much higher than a traditional fossil fuel power plant. Geothermal facilities on the other hand, do not require fuel to generate electricity. Consequently, over the lifespan of a geothermal project, the LCOE of geothermal energy is expected to be materially lower than traditional electricity generating technologies and lower than or comparable with other renewable energy sources (including the PTC). Exhibit 29: Average Capital Cost Breakdown Source: Geothermal Energy Association, Raymond James Ltd. Exhibit 30: Estimated Levelized Cost of Energy (Including Impact of PTC and Carbon Credit Policies) Key: IGCC – Integrated Gasification Combined Cycle (Synthetic Gas) CS – Carbon Capture and Storage CC – Combined Cycle MSW – Municipal Solid Waste
Source: National Renewable Energy Laboratory (NREL)
Drilling, 23%
Permitting, 2%
Confirmation, 5%
Power plant, 54% Steam gathering, 7%
Exploration, 5%Transmission , 4%

RJ Equity Research │ Page 37 of 47
Geothermal may pale in awareness but IRRs are better
While geothermal awareness and development currently pales in comparison to other ‘green’ technologies (i.e. solar, wind), we find geothermal projects, on average, carry higher IRRs compared to wind projects and much higher IRRs compared to solar projects. Exhibit 31: Comparing Estimated Internal Rate of Returns (IRRs) Source: Raymond James Ltd. Attractive Incentives
The economics of geothermal plants make it a realistic alternative to traditional power plants. However, cash grants and other incentives only make the attractiveness that much greater, in our view. Exhibit 32: Estimated Impact of 30% Cash Grant on a 50MWe Project Source: Raymond James Ltd.
Geothermal Wind Solar
Capex $4mln/MW $2mln/MW $5mln/MWLoad Factor 95% 35% 25%Opex $25mln/MW 20% of revenues MinimalIncentives 30% cash grant 30% cash grant 30% cash grantPPA price @ start $105/MWh $105/MWh $105/MWh
IRR 19.2% 17.7% 6.0%
Development Equity (US$mln) $60 Development Equity (US$mln) $60Construction & Financing Costs (US$mln) $140 Construction & Financing Costs (US$mln) $140Total Cost (US$mln) $200 Total Cost (US$mln) $200
Project EBITDA (US$mln) $26 Project EBITDA (US$mln) $26EBITDA Multiple 12.0x EBITDA Multiple 12.0xProject Value (US$mln) $312 Project Value (US$mln) $312Less: Project Debt (70%) $140 Less: Project Debt (70%) $140Equity Value $172 Equity Value $172
Total Equity Invested $60 Total Equity Invested $6030% Cash Grant (95% eligible) $57Total Equity Invested Post Grant $41Total Debt Post Grant $102Assume 1/3 Equity Gain, 2/3 debt repayment
Development Equity Multiple 2.9x Development Equity Multiple 4.2x
50 MW Example 50 MW Example (30% Cash grant)

RJ Equity Research │ Page 38 of 47
Renewable Portfolio Standards (RPS) boost
In addition to incentives, we believe policy support at the state and federal levels in the form of Renewable Portfolio Standards (“RPS”), will propel growth in renewable energy in the U.S. RPS requires utilities and other retail electricity suppliers to produce or purchase a minimum quantity or percentage of their power supply from renewable sources. Currently, 30 states and the District of Columbia have mandatory RPS requirements. Mandatory RPS policies are backed by compliance enforcement mechanisms. Most states have a cost containment provision (a cost cap) limiting renewable energy procurement to those below the benchmark price2. This could arguably turn RPS compliance into a “best effort” basis. However, based on our conversations with consultants and utilities, we believe the utilities are taking their RPS targets seriously. Exhibit 33: Renewable Portfolio Standards by State Source: U.S. DOE, Raymond James Ltd.
2 U.S. Department of Energy – Geothermal Tomorrow 2008
Mandatory RPSState Geothermal % Deadline State Geothermal % Deadline
Arizona Y 15% 2025 New Jersey Y 23% 2021California Y 20% 2010 New Mexico Y 20% 2020Colorado Y 30% 2020 New York N 25% 2013Connecticut N 27% 2020 North Carolina Y 13% 2021DC Y 11% 2022 Ohio Y 25% 2025Delaware Y 20% 2019 Oregon Y 25% 2025Hawaii Y 40% 2030 Pennsylvania Y 18% 2020Illinois N 25% 2025 Rhode Island Y 16% 2019Iowa N 105MW 1983 Texas Y 5880MW 2015Kansas N 20% 2020 Washington Y 15% 2020Maine N 30% 2000 Wisconsin Y 10% 2015Maryland Y 20% 2022 Voluntary GoalsMassachusetts N 25% 2030 State Geothermal % DeadlineMichigan N 10% 2015 Missouri N 11% 2020Minnesota N 25% 2025 North Dakota Y 10% 2015Missouri N 15% 2021 South Dakota Y 10% 2015Montana Y 15% 2015 Utah Y 20% 2025Nevada Y 25% 2025 Vermont N 25% 2025New Hampshire Y 25% 2025 Virginia Y 12% 2022
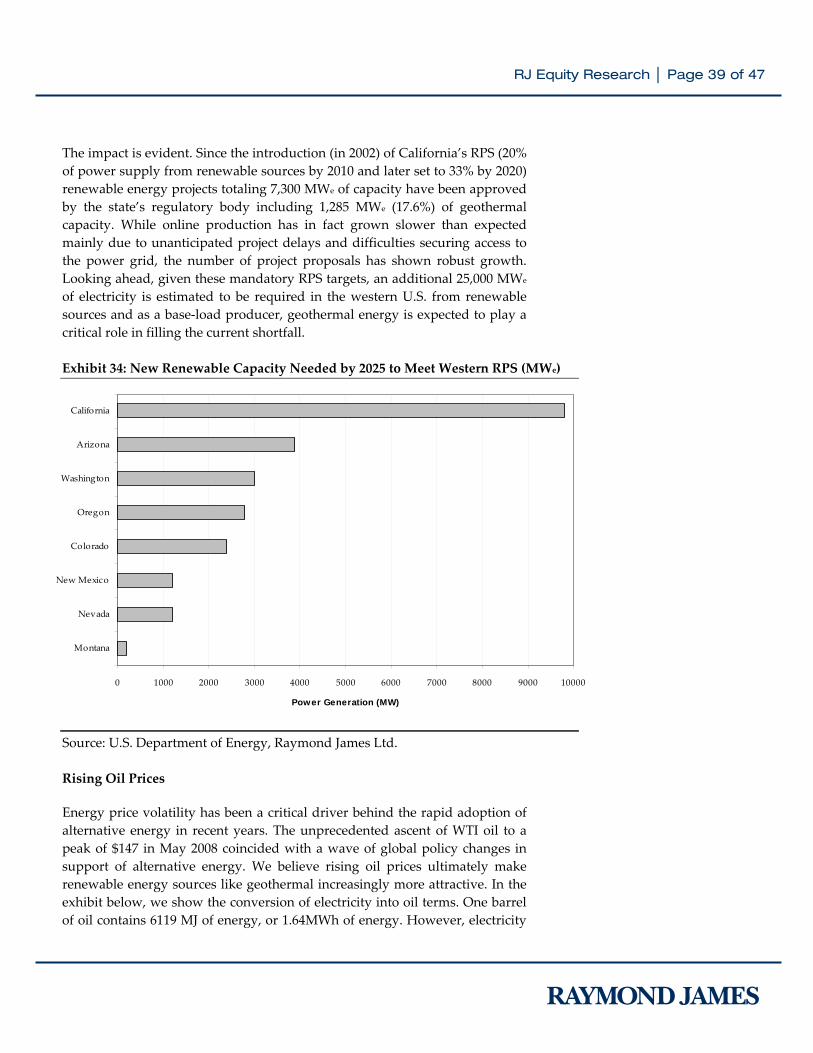
RJ Equity Research │ Page 39 of 47
The impact is evident. Since the introduction (in 2002) of California’s RPS (20% of power supply from renewable sources by 2010 and later set to 33% by 2020) renewable energy projects totaling 7,300 MWe of capacity have been approved by the state’s regulatory body including 1,285 MWe (17.6%) of geothermal capacity. While online production has in fact grown slower than expected mainly due to unanticipated project delays and difficulties securing access to the power grid, the number of project proposals has shown robust growth. Looking ahead, given these mandatory RPS targets, an additional 25,000 MWe of electricity is estimated to be required in the western U.S. from renewable sources and as a base‐load producer, geothermal energy is expected to play a critical role in filling the current shortfall. Exhibit 34: New Renewable Capacity Needed by 2025 to Meet Western RPS (MWe) Source: U.S. Department of Energy, Raymond James Ltd. Rising Oil Prices
Energy price volatility has been a critical driver behind the rapid adoption of alternative energy in recent years. The unprecedented ascent of WTI oil to a peak of $147 in May 2008 coincided with a wave of global policy changes in support of alternative energy. We believe rising oil prices ultimately make renewable energy sources like geothermal increasingly more attractive. In the exhibit below, we show the conversion of electricity into oil terms. One barrel of oil contains 6119 MJ of energy, or 1.64MWh of energy. However, electricity
0 1000 2000 3000 4000 5000 6000 7000 8000 9000 10000
California
Arizona
Washington
Oregon
Colorado
New Mexico
Nevada
Montana
Power Generation (MW)

RJ Equity Research │ Page 40 of 47
is highly refined energy and therefore we have to assume a conversion rate (efficiency of conversion) as well. Assuming a 30% conversion rate, a barrel of oil becomes “equal” to 0.49MWh of energy. We believe that this kind of analysis is simplistic, only accounts for the cost of oil as a raw material, and does not include other capex and opex costs. As we discussed previously, the LCOE of a geothermal plant (which is an all‐in cost and includes capex) is about $0.08/kWh – which based on our matrix equates to about a $40 oil price at a 30% efficiency. Production Tax Credits (PTCs) make it even more compelling as the LCOE of a geothermal plant decreases to $0.059/kWh – equivalent to about a $30 oil price at a 30% efficiency. Oil prices are trading much higher than that level – and we have not even discussed the environmental impact associated with traditional (fossil fuel) generation. Exhibit 35: Electricity Price vs. Oil Price Source: Raymond James Ltd. PPA Pricing Trends Looking Up A shortage of base‐load capacity in the world energy market should bode well for PPA pricing in general, in our view. We note that California’s Market Price Reference (MPR) is currently $100.2/MWh (or $1.002 /kWh) for contracts starting in 2010. The MPR represents the cost of a long‐term contract with a Combined Cycle Gas Turbine (CCGT) plant and represents the avoided cost. If the purchase price in a power contract does not exceed the MPR, it may be accepted as a reasonable price by the CPUC. In other words, the MPR can be thought of as representing a ceiling for the power purchase price. The California Public Utilities Commission (CPUC) sets its MPR annually and applies to each RPS purchase. Granted, this is for the state of California and the example does not apply to Nevada. We expect over the next five years however, an increasing amount of electricity transmission across state borders which should help normalize market prices for electricity.
$20 $40 $60 $80 $100 $12020% 6.1 12.2 18.3 24.4 30.5 36.625% 4.9 9.8 14.6 19.5 24.4 29.330% 4.1 8.1 12.2 16.3 20.3 24.435% 3.5 7.0 10.5 13.9 17.4 20.940% 3.0 6.1 9.1 12.2 15.2 18.3
Efficiency
Oil price ($/Barrel)¢/kWh vs. Oil price and efficiency

RJ Equity Research │ Page 41 of 47
California’s MPR is based on a CCGT design and natural gas futures can account for as much as 70% of the MPR level. With the decline in natural gas futures, we expect that the next MPR (based on 2009 inputs) to come in lower all else being equal. Based on our preliminary calculations, we estimate 2011 MPR (25 year base‐load contract commencing in 2011) at ~$104/MWh. This does not assume any incremental Green House Gas (GHG) adders to offset natural gas price declines. Legislation in California could see the MPR being dropped in favour of a new “benchmark” price and while exact details are still somewhat unclear, industry players we have spoken to do not expect the benchmark price to be significantly different from the corresponding MPR. Exhibit 36: 2010 MPR vs. 2011 MPR Source: California Public Utilities Commission, Raymond James Ltd.
100.2 104
0
20
40
60
80
100
120
140
2010 MPR CPUC 2011 MPR RJ est.
MPR ($
/MWh) RJ assumed PPA
price in 2013 = $105/MWh

RJ Equity Research │ Page 42 of 47
Appendix 3: Detailed Equity Financing History
March 2010: Private placement of $8.2 mln subscription receipts at $1.05
consisting of 1 common share and ½ common share warrant. These funds were designated for the advancement of the Neal Hot Springs project and for general working capital purposes.
November 2009: Private placement of 8.1 mln subscription receipts at C$1.35 raising gross proceeds of C$10.9 mln. These funds were designated for drilling additional wells at the Neal Hot Springs project.
April 2008: Equity raise of 4.26 mln units, consisting of 1 share at $2.35 and 1 warrant equal to 1.5 shares that can be executed prior to April 29, 2010 at C$3.00 per share. In total, the private placement resulted in issuance of 6.4 mln shares for gross proceeds of C$15 mln. These funds were designated for the acquisition of San Emidio assets and the exploration of Raft River and Neal Hot Springs projects.
June 2007: Completed a private placement of ~ 9.1 mln shares at C$2.20 for gross proceeds of ~ C$20 mln. These proceeds were to be utilized to develop the Raft River and Neal Hot Springs assets.
August 2006: Completed Raft River I project financing with Goldman Sachs. As per the terms of this agreement, GTH set up a subsidiary ‐ Raft River I LLC ‐ and contributed ~ $5 mln in cash and $1.5 mln in property while Goldman Sachs contributed $34 mln. To date, GTH has contributed $17.9 mln in cash and property to Raft River Holdings LLC. GTH was also required to fund the completion of a 10 MWe facility.
April 2006: Private placement of 25.0 mln shares for C$1.00 per share, raising C$25 mln. The funds were to be utilized for development of Raft River I, drilling for the expansion of Raft River II and for acquisitions.

RJ Equity Research │ Page 43 of 47
Appendix 4: U.S. Geothermal's Estimated Resources
Management indicated their intentions on joining the Canadian Geothermal Energy Association (CanGEA) and adopting the geothermal reporting codes. CanGEA geothermal reporting codes are relatively new to the industry and as yet have not been fully adopted by most geothermal companies. Magma Energy remains the only company to fully denote their resource potential under these reporting codes. As a result we have provided our estimates of U.S. Geothermal’s project resources. Please refer to the CanGEA reporting codes for full details on the categorization and the aforementioned risk sections regarding these categorized resources. Exhibit 37: Estimated Categorization of U.S. Geothermal Resources by Project
Resource Classification by Project Targeted Uncategorized Resources ReservesNet MWe Mgmt Est. Inferred Indicated Measured Probable Proven
Raft River Unit 1 13.0 MW 13.0 MWRaft River Unit 2 & 3 58.0 MW 58.0 MWRaft River Exploration 23.0 MW 23.0 MWRaft River Internal Estimate 33.0 MW 33.0 MWSan Emidio Unit 1 3.6 MW 3.6 MWSan Emidio Repower 5.4 MW 5.4 MWSan Emidio Expansion 26.0 MW 26.0 MWSan Emidio Exploration 14.0 MW 14.0 MWSan Emidio Internal Estimate 19.0 MW 19.0 MWNeal Hot Springs #1 22.0 MW 22.0 MWNeal Hot Springs #2 28.0 MW 28.0 MWGerlach (60% JV) 18.0 MW 18.0 MWGranite Creek 25.0 MW 25.0 MW
Totals 288.0 MW 52.0 MW 214.0 MW 0.0 MW 0.0 MW 5.4 MW 16.6 MWSource: Company Reports, Raymond James Ltd.
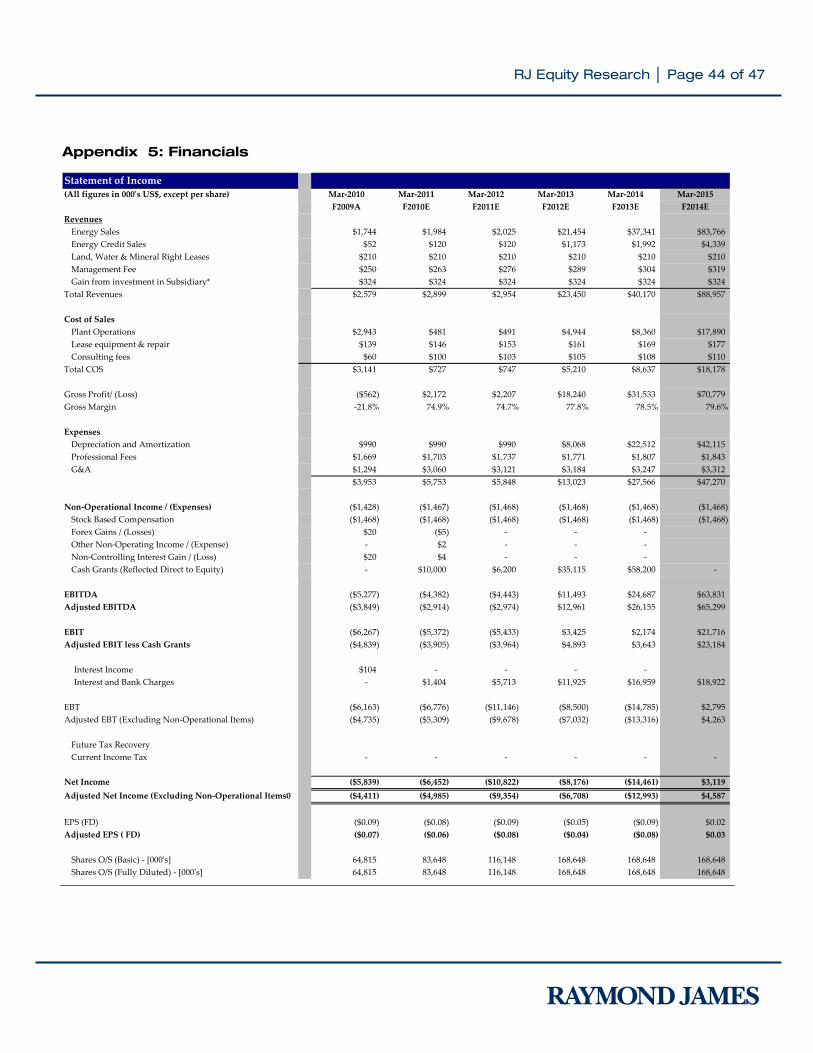
RJ Equity Research │ Page 44 of 47
Appendix 5: Financials
Statement of Income(All figures in 000ʹs US$, except per share) Mar‐2010 Mar‐2011 Mar‐2012 Mar‐2013 Mar‐2014 Mar‐2015
F2009A F2010E F2011E F2012E F2013E F2014ERevenuesEnergy Sales $1,744 $1,984 $2,025 $21,454 $37,341 $83,766Energy Credit Sales $52 $120 $120 $1,173 $1,992 $4,339Land, Water & Mineral Right Leases $210 $210 $210 $210 $210 $210Management Fee $250 $263 $276 $289 $304 $319Gain from investment in Subsidiary* $324 $324 $324 $324 $324 $324
Total Revenues $2,579 $2,899 $2,954 $23,450 $40,170 $88,957
Cost of SalesPlant Operations $2,943 $481 $491 $4,944 $8,360 $17,890Lease equipment & repair $139 $146 $153 $161 $169 $177Consulting fees $60 $100 $103 $105 $108 $110
Total COS $3,141 $727 $747 $5,210 $8,637 $18,178
Gross Profit/ (Loss) ($562) $2,172 $2,207 $18,240 $31,533 $70,779Gross Margin ‐21.8% 74.9% 74.7% 77.8% 78.5% 79.6%
ExpensesDepreciation and Amortization $990 $990 $990 $8,068 $22,512 $42,115Professional Fees $1,669 $1,703 $1,737 $1,771 $1,807 $1,843G&A $1,294 $3,060 $3,121 $3,184 $3,247 $3,312
$3,953 $5,753 $5,848 $13,023 $27,566 $47,270
Non‐Operational Income / (Expenses) ($1,428) ($1,467) ($1,468) ($1,468) ($1,468) ($1,468) Stock Based Compensation ($1,468) ($1,468) ($1,468) ($1,468) ($1,468) ($1,468) Forex Gains / (Losses) $20 ($5) ‐ ‐ ‐ Other Non‐Operating Income / (Expense) ‐ $2 ‐ ‐ ‐ Non‐Controlling Interest Gain / (Loss) $20 $4 ‐ ‐ ‐ Cash Grants (Reflected Direct to Equity) ‐ $10,000 $6,200 $35,115 $58,200 ‐
EBITDA ($5,277) ($4,382) ($4,443) $11,493 $24,687 $63,831Adjusted EBITDA ($3,849) ($2,914) ($2,974) $12,961 $26,155 $65,299
EBIT ($6,267) ($5,372) ($5,433) $3,425 $2,174 $21,716Adjusted EBIT less Cash Grants ($4,839) ($3,905) ($3,964) $4,893 $3,643 $23,184
Interest Income $104 ‐ ‐ ‐ ‐ Interest and Bank Charges ‐ $1,404 $5,713 $11,925 $16,959 $18,922
EBT ($6,163) ($6,776) ($11,146) ($8,500) ($14,785) $2,795Adjusted EBT (Excluding Non‐Operational Items) ($4,735) ($5,309) ($9,678) ($7,032) ($13,316) $4,263
Future Tax Recovery Current Income Tax ‐ ‐ ‐ ‐ ‐ ‐
Net Income ($5,839) ($6,452) ($10,822) ($8,176) ($14,461) $3,119Adjusted Net Income (Excluding Non‐Operational Items0 ($4,411) ($4,985) ($9,354) ($6,708) ($12,993) $4,587
EPS (FD) ($0.09) ($0.08) ($0.09) ($0.05) ($0.09) $0.02Adjusted EPS ( FD) ($0.07) ($0.06) ($0.08) ($0.04) ($0.08) $0.03
Shares O/S (Basic) ‐ [000ʹs] 64,815 83,648 116,148 168,648 168,648 168,648 Shares O/S (Fully Diluted) ‐ [000ʹs] 64,815 83,648 116,148 168,648 168,648 168,648

RJ Equity Research │ Page 45 of 47
Appendix 5 (continued) Note: Assumed $70mln equity raise in F2011 – includes ~$20 capital infusion from strategic partnership.
Statement of Cash FlowsMar‐2010 Mar‐2011 Mar‐2012 Mar‐2013 Mar‐2014 Mar‐2015F2009A F2010E F2011E F2012E F2013E F2014E
OperationsNet Income (5,839) (6,452) (10,822) (8,176) (14,461) 3,119 Depreciation and Amortization 990 990 990 8,068 22,512 42,115 Stock Comps 1,468 1,468 1,468 1,468 1,468 1,468 Non‐controlling interest loss (20) (77) ‐ ‐ ‐ ‐ Other (344) (241) (324) (324) (324) (324) Net Changes to Working Capital (246) (633) (3) (1,415) (1,181) (3,502) (Increases) / Decreases to Restricted Cash ‐ ‐ ‐ ‐ ‐ ‐ (Increases) / Decreases to Receivables from Subs. ‐ (28) ‐ ‐ ‐ ‐ (Increases) / Decreases to Accounts Receivables (127) (303) (5) (1,965) (1,603) (4,678) (Increases) / Decreases to Prepaid and Other Assets (17) 288 (1) (245) (188) (523) Increases / (Decreases) to Accounts Payable (102) (591) 3 795 610 1,699
Cash Provided by /(Used by) Operations (3,990) (4,945) (8,690) (379) 8,015 42,876
InvestmentsAsset Sales 1 ‐ ‐ ‐ ‐ ‐ Capital Expenditures (4,828) (52,000) (108,000) (177,333) (150,667) (119,000) Acquisition Expenditures ‐ (200) ‐ ‐ ‐ ‐ Distribution/Invst in Subsidiaries 722 ‐ ‐ ‐ ‐ Other (100) ‐ ‐ ‐ ‐
Cash Provided by /(Used by) Investments (4,205) (52,200) (108,000) (177,333) (150,667) (119,000)
Cash Flow from Operations and Investments (8,196) (57,145) (116,690) (177,713) (142,652) (76,124) Cash on Hand (Beginning) 3,452 12,971 27,426 59,858 25,915 4,642
FinancingCash Grant Funding ‐ 10,000 6,200 35,115 58,200 ‐ Equity Raise 17,495 20,000 63,147 ‐ ‐ ‐ Increases / (Decreases) to Current Portion of LT Debt (11) ‐ ‐ ‐ ‐ ‐ LT Debt Raise / (Repayment) 230 41,600 79,776 108,655 63,179 75,776 Revolver ‐ ‐ ‐ ‐ ‐ ‐
Cash Provided by /(Used by) Investments 17,714 71,600 149,123 143,770 121,379 75,776
Cash Generated / (Used) 9,518 14,455 32,433 (33,943) (21,273) (348) Cash and Equivalents End of Period 12,971 27,426 59,858 25,915 4,642 4,294
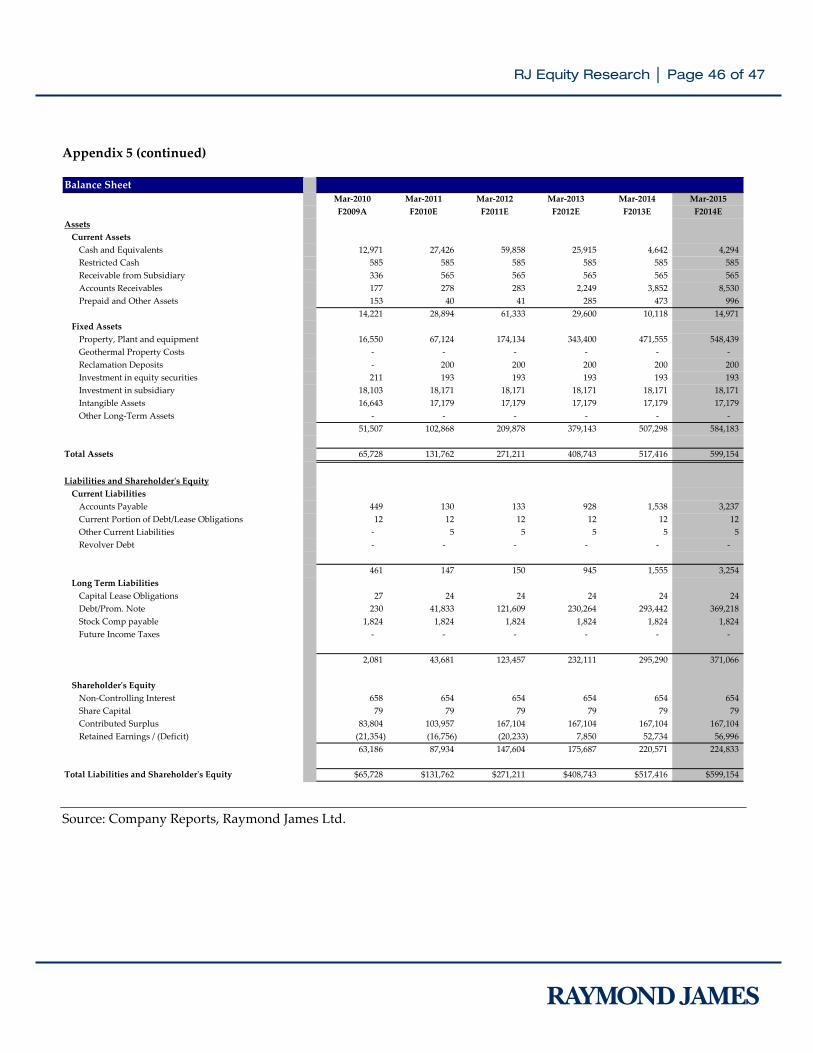
RJ Equity Research │ Page 46 of 47
Appendix 5 (continued) Source: Company Reports, Raymond James Ltd.
Balance SheetMar‐2010 Mar‐2011 Mar‐2012 Mar‐2013 Mar‐2014 Mar‐2015F2009A F2010E F2011E F2012E F2013E F2014E
AssetsCurrent AssetsCash and Equivalents 12,971 27,426 59,858 25,915 4,642 4,294 Restricted Cash 585 585 585 585 585 585 Receivable from Subsidiary 336 565 565 565 565 565 Accounts Receivables 177 278 283 2,249 3,852 8,530 Prepaid and Other Assets 153 40 41 285 473 996
14,221 28,894 61,333 29,600 10,118 14,971 Fixed AssetsProperty, Plant and equipment 16,550 67,124 174,134 343,400 471,555 548,439 Geothermal Property Costs ‐ ‐ ‐ ‐ ‐ ‐ Reclamation Deposits ‐ 200 200 200 200 200 Investment in equity securities 211 193 193 193 193 193 Investment in subsidiary 18,103 18,171 18,171 18,171 18,171 18,171 Intangible Assets 16,643 17,179 17,179 17,179 17,179 17,179 Other Long‐Term Assets ‐ ‐ ‐ ‐ ‐ ‐
51,507 102,868 209,878 379,143 507,298 584,183
Total Assets 65,728 131,762 271,211 408,743 517,416 599,154
Liabilities and Shareholderʹs EquityCurrent LiabilitiesAccounts Payable 449 130 133 928 1,538 3,237 Current Portion of Debt/Lease Obligations 12 12 12 12 12 12 Other Current Liabilities ‐ 5 5 5 5 5 Revolver Debt ‐ ‐ ‐ ‐ ‐ ‐
461 147 150 945 1,555 3,254 Long Term LiabilitiesCapital Lease Obligations 27 24 24 24 24 24 Debt/Prom. Note 230 41,833 121,609 230,264 293,442 369,218 Stock Comp payable 1,824 1,824 1,824 1,824 1,824 1,824 Future Income Taxes ‐ ‐ ‐ ‐ ‐ ‐
2,081 43,681 123,457 232,111 295,290 371,066
Shareholderʹs EquityNon‐Controlling Interest 658 654 654 654 654 654 Share Capital 79 79 79 79 79 79 Contributed Surplus 83,804 103,957 167,104 167,104 167,104 167,104 Retained Earnings / (Deficit) (21,354) (16,756) (20,233) 7,850 52,734 56,996
63,186 87,934 147,604 175,687 220,571 224,833
Total Liabilities and Shareholderʹs Equity $65,728 $131,762 $271,211 $408,743 $517,416 $599,154

RJ Equity Research │ Page 47 of 47
Companies cited in this report:
COMPANY NAME TICKER EXCHANGE RATING RECENT PRICE
Chevron CVX NYSEEmpire Geothermal LLC PVTEugene Water and Electric Board PVTExxon Shipping XOM NYSEFalconbridge N/AGerlach Green Energy LLC PVTGoldman Sachs GS NYSEIdaho Power Company PVTIda‐West Energy Company IDA NYSEIMG Aurion Infrastructure Fund PVTLoewen Ondaatje McCuthcheon PVTMagma Energy MXY TSX OUTPERFORM $1.22Mihaly International N/AMK Gold Company N/AMorrison Knudsen Corporation N/ANew Dawn Group PVTNV Energy NVE NYSEOntario Hydro PVTOrmat Technologies ORA NYSEPhelps Dodge N/APuna Geothermal Ventures PVTRam Power RPG TSX RESTRICTED $2.36Sierra Pacific Power Corporation PVTSouthern Idaho PVTTAS Energy PVTTrans‐Pacific Geothermal Corporation PVTUNOCAL N/A
Closing price as of Aug‐24‐10

RJ Disclosures
Analyst Certification
The views expressed in this report (which include the actual rating assigned to the company as well as the analytical substance and tone of the report) accurately reflect the personal views of the analyst(s) covering the subject securities. No part of said personʹs compensation was, is, or will be directly or indirectly related to the specific recommendations or views contained in this research report.
Stock Ratings
STRONG BUY 1: the stock is expected to appreciate and produce a total return of at least 15% and outperform the S&P/TSX Composite Index over the next six months. OUTPERFORM 2: the stock is expected to appreciate and outperform the S&P/TSX Composite Index over the next twelve months. MARKET PERFORM 3: the stock is expected to perform generally in line with the S&P/TSX Composite Index over the next twelve months and is potentially a source of funds for more highly rated securities. UNDERPERFORM 4: the stock is expected to underperform the S&P/TSX Composite Index or its sector over the next six to twelve months and should be sold.
Distribution of Ratings
Out of 239 stocks in the Raymond James Ltd. (Canada) coverage universe, the ratings distribution is as follows: Strong Buy and Outperform (Buy, 75%); Market Perform (Hold, 23%); Underperform (Sell, 2%). Within those rating categories, the percentage of rated companies that currently are or have been investment‐banking clients of Raymond James Ltd. or its affiliates over the past 12 months is as follows: Strong Buy and Outperform (Buy, 52%); Market Perform (Hold, 22%); Underperform, (Sell, 0%). Note: Data updated monthly.
Risk Factors
Some of the general risk factors that pertain to the projected 6‐12 month stock price targets included with our research are as follows: i) changes in industry fundamentals with respect to customer demand or product/service pricing could adversely impact expected revenues and earnings, ii) issues relating to major competitors, customers, suppliers and new product expectations could change investor attitudes toward the sector or this stock, iii) unforeseen developments with respect to the management, financial condition or accounting policies or practices could alter the prospective valuation, or iv) external factors that affect global and/or regional economies, interest rates, exchange rates or major segments of the economy could alter investor confidence and investment prospects.
Analyst Compensation
Equity research analysts and associates at Raymond James Ltd. are compensated on a salary and bonus system. Several factors enter into the compensation determination for an analyst, including i) research quality and overall productivity, including success in rating stocks on an absolute basis and relative to the S&P/TSX Composite Index and/or a sector index, ii) recognition from institutional investors, iii) support effectiveness to the institutional and retail sales forces and traders, iv) commissions generated in stocks under coverage that are attributable to the analyst’s efforts, v) net revenues of the overall Equity Capital Markets Group, and vi) compensation levels for analysts at competing investment dealers.
Analyst Stock Holdings
Effective September 2002, Raymond James Ltd. equity research analysts and associates or members of their households are forbidden from investing in securities of companies covered by them. Analysts and associates are permitted to hold long positions in the securities of companies they cover which were in place prior to September 2002 but are only permitted to sell those positions five days after the rating has been lowered to Underperform.

RJ Disclosures
Review of Material Operations
The Analyst and/or Associate are required to conduct due diligence on, and where deemed appropriate visit, the material operations of a subject company before initiating research coverage. The scope of the review may vary depending on the complexity of the subject companyʹs business operations.
Raymond James Relationships
Raymond James Ltd. or its affiliates expects to receive or intends to seek compensation for investment banking services from all companies under research coverage within the next three months.
Raymond James Ltd. or its officers, employees or affiliates may execute transactions in securities mentioned in this report that may not be consistent with the report’s conclusions.
Additional information is available upon request. This document may not be reprinted without permission.
All Raymond James Ltd. research reports are distributed electronically and are available to clients at the same time via the firm’s website (http://www.raymondjames.ca). Immediately upon being posted to the firm’s website, the research reports are then distributed electronically to clients via email upon request and to clients with access to Bloomberg (home page: RJLC), First Call Research Direct and Reuters. Selected research reports are also printed and mailed at the same time to clients upon request. Requests for Raymond James Ltd. research may be made by contacting the Raymond James Product Group during market hours at (604) 659‐8000.
In the event that this is a compendium report (i.e., covers 6 or more subject companies), Raymond James Ltd. may choose to provide specific disclosures for the subject companies by reference. To access these disclosures, clients should refer to: http://www.raymondjames.ca (click on Equity Capital Markets / Equity Research / Research Disclosures) or call toll‐free at 1‐800‐667‐2899.
All expressions of opinion reflect the judgment of the Research Department of Raymond James Ltd. or its affiliates (RJL), at this date and are subject to change. Information has been obtained from sources considered reliable, but we do not guarantee that the foregoing report is accurate or complete. Other departments of RJL may have information which is not available to the Research Department about companies mentioned in this report. RJL may execute transactions in the securities mentioned in this report which may not be consistent with the report’s conclusions. RJL may perform investment banking or other services for, or solicit investment banking business from, any company mentioned in this report. This information is not an offer or solicitation for the sale or purchase of securities. Information in this report should not be construed as advice designed to meet the individual objectives of every investor. Consultation with your investment advisor is recommended. For institutional clients of the European Economic Area (EEA): This document (and any attachments or exhibits hereto) is intended only for EEA Institutional Clients or others to whom it may lawfully be submitted. RJL is a member of CIPF. ©2010 Raymond James Ltd.
Raymond James Ltd. is not a U.S. broker‐dealer and therefore is not governed by U.S. laws, rules or regulations applicable to U.S. broker‐dealers. Consequently, the persons responsible for the content of this publication are not licensed in the U.S. as research analysts in accordance with applicable rules promulgated by the U.S. Self Regulatory Organizations.
Any U.S. Institutional Investor wishing to effect trades in any security should contact Raymond James (USA) Ltd., a U.S. broker‐dealer affiliate of Raymond James Ltd.
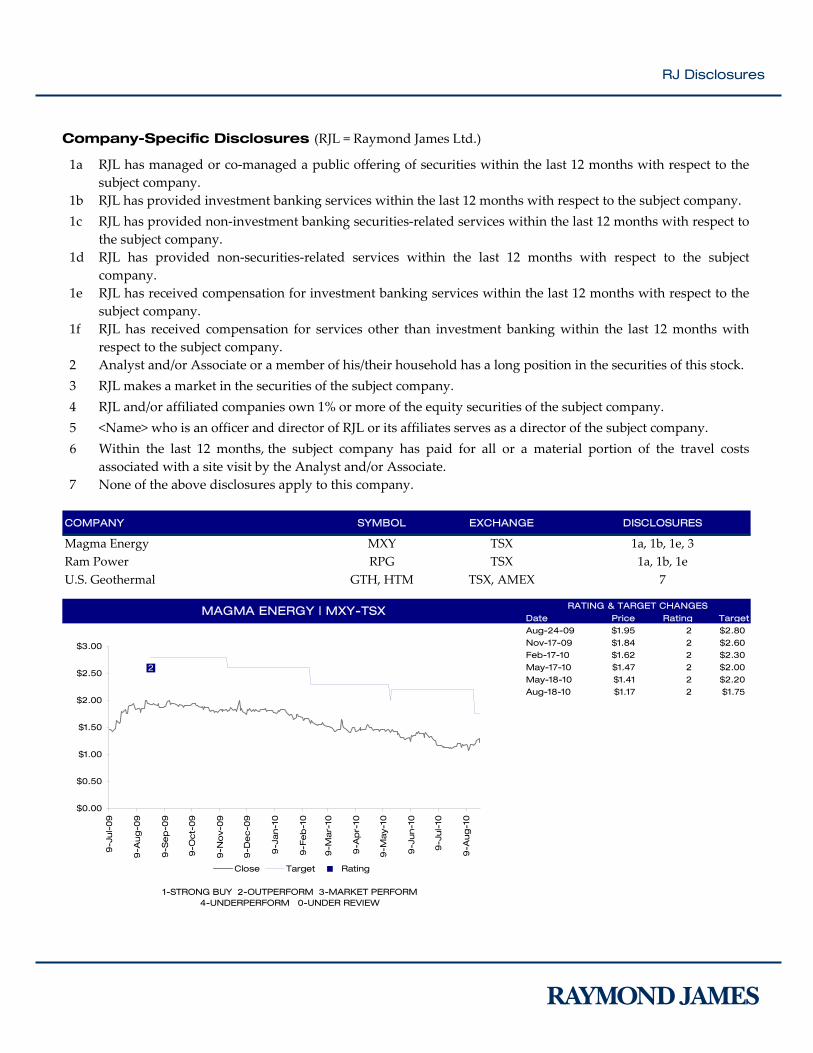
RJ Disclosures
Company-Specific Disclosures (RJL = Raymond James Ltd.)
1a RJL has managed or co‐managed a public offering of securities within the last 12 months with respect to the subject company.
1b RJL has provided investment banking services within the last 12 months with respect to the subject company. 1c RJL has provided non‐investment banking securities‐related services within the last 12 months with respect to
the subject company. 1d RJL has provided non‐securities‐related services within the last 12 months with respect to the subject
company. 1e RJL has received compensation for investment banking services within the last 12 months with respect to the
subject company. 1f RJL has received compensation for services other than investment banking within the last 12 months with
respect to the subject company. 2 Analyst and/or Associate or a member of his/their household has a long position in the securities of this stock. 3 RJL makes a market in the securities of the subject company. 4 RJL and/or affiliated companies own 1% or more of the equity securities of the subject company. 5 <Name> who is an officer and director of RJL or its affiliates serves as a director of the subject company. 6 Within the last 12 months, the subject company has paid for all or a material portion of the travel costs
associated with a site visit by the Analyst and/or Associate. 7 None of the above disclosures apply to this company.
COMPANY SYMBOL EXCHANGE DISCLOSURES
Magma Energy MXY TSX 1a, 1b, 1e, 3Ram Power RPG TSX 1a, 1b, 1eU.S. Geothermal GTH, HTM TSX, AMEX 7
Date Price Rating TargetAug-24-09 $1.95 2 $2.80Nov-17-09 $1.84 2 $2.60Feb-17-10 $1.62 2 $2.30May-17-10 $1.47 2 $2.00May-18-10 $1.41 2 $2.20Aug-18-10 $1.17 2 $1.75
MAGMA ENERGY | MXY-TSX RATING & TARGET CHANGES
1-STRONG BUY 2-OUTPERFORM 3-MARKET PERFORM 4-UNDERPERFORM 0-UNDER REVIEW
2
$0.00
$0.50
$1.00
$1.50
$2.00
$2.50
$3.00
9-J
ul-
09
9-A
ug
-09
9-S
ep
-09
9-O
ct-
09
9-N
ov-
09
9-D
ec-0
9
9-J
an-1
0
9-F
eb
-10
9-M
ar-
10
9-A
pr-
10
9-M
ay-
10
9-J
un-1
0
9-J
ul-
10
9-A
ug
-10
Close Target Rating

RJ Disclosures
Date Price Rating TargetAug-26-10 $0.79 2 $1.25
U.S. GEOTHERMAL | GTH-TSX RATING & TARGET CHANGES
1-STRONG BUY 2-OUTPERFORM 3-MARKET PERFORM 4-UNDERPERFORM 0-UNDER REVIEW
$0.00
$0.50
$1.00
$1.50
$2.00
$2.50
$3.00
$3.50
$4.00
$4.50
$5.00
Aug
-07
Oct-
07
De
c-0
7
Feb
-08
Ap
r-0
8
Jun-0
8
Aug
-08
Oct-
08
De
c-0
8
Feb
-09
Ap
r-0
9
Jun-0
9
Aug
-09
Oct-
09
De
c-0
9
Feb
-10
Ap
r-10
Jun-1
0
Aug
-10
Close Target Rating
Date Price Rating TargetDec-11-09 $3.19 2 $4.70May-05-10 $2.84 2 $4.35
RAM POWER | RPG-TSX RATING & TARGET CHANGES
1-STRONG BUY 2-OUTPERFORM 3-MARKET PERFORM 4-UNDERPERFORM 0-UNDER REVIEW
2
$0.00
$0.50
$1.00
$1.50
$2.00
$2.50
$3.00
$3.50
$4.00
$4.50
$5.00
Oct-
22
-09
No
v-05-
No
v-19
-09
De
c-0
3-
De
c-1
7-0
9
De
c-3
1-0
9
Jan-1
4-1
0
Jan-2
8-1
0
Feb
-11-
10
Fe
b-2
5-1
0
Mar-
11-1
0
Mar-
25-1
0
Ap
r-0
8-1
0
Ap
r-2
2-1
0
May-
06
-10
May-
20
-10
Jun-0
3-1
0
Jun-1
7-1
0
Jul-
01-
10
Jul-
15-1
0
Jul-
29
-10
Aug
-12
-10
Close Target Rating
R A Y M O N D J A M E S LT D . CA N A D I A N IN S T I T U T I O N A L E Q U I T Y T E A M W W W . R A Y M O N D J A M E S . C A
EQUITY RESEARCH HE A D O F EQ U I T Y RE S E A R C H
Daryl Swetlishoff, CFA 604.659.8246
C O N S U M E R P R O D U C T S & R E T A I L
CO N S U M E R PR O D U C T S & RE T A I L Kenric Tyghe, MBA 416.777.7188 Sara Kohbodi (Associate) 416.777.4916
E N E R G Y
OI L & GA S SE R V I C E S , HE A D O F EN E R G Y RE S E A R C H Andrew Bradford, CFA 403.509.0503 Nick Heffernan (Associate) 403.509.0511 Nikki Kondra (Associate) 403.509.0507
I N T E R N A T I O N A L O I L & GA S Rafi Khouri, B.Sc, MBA 403.509.0560 Braden Purkis (Associate) 403.509.0534
O I L & GA S RO Y A L T Y TR U S T S / O I L & GA S PR O D U C E R S Kristopher Zack, CA, CFA 403.221.0414 Gordon Steppan (Associate) 403.221.0411
O I L SA N D S / O I L & GA S PR O D U C E R S Justin Bouchard, P.Eng. 403.509.0523 Christopher Cox (Associate) 403.509.0562
O I L & GA S PR O D U C E R S Luc Mageau, CFA 403.509.0505
I N D U S T R I A L S P E C I A L S I T U A T I O N S
AE R O S P A C E & AV I A T I O N / IN D U S T R I A L PR O D U C T S & SE R V I C E S HE A D O F I N D U S T R I A L RE S E A R C H
Ben Cherniavsky 604.659.8244 Theoni Pilarinos, CFA (Associate) 604.659.8234 Greg Jackson (Associate) 604.659.8262
IN D U S T R I A L PR O D U C T S & SE R V I C E S Frederic Bastien, CFA 604.659.8232 Jamil Murji, CFA (Associate) 604.659.8261
I N D U S T R I A L PR O D U C T S & SE R V I C E S Steve Hansen, CMA, CFA 604.659.8208 Arash Yazdani, MBA (Associate) 604.659.8280
M I N I N G
BA S E ME T A L S & MI N E R A L S , HE A D O F MI N I N G RE S E A R C H Tom Meyer, P.Eng., CFA 416.777.4912 Adam Low, CFA (Associate) 416.777.4943 Miroslav Vukomanovic (Associate) 416.777.7144
GO L D S Brad Humphrey 416.777.4917 Afjal Mohammad (Associate) 416.777.7084
UR A N I U M / JU N I O R EX P L O R A T I O N Bart Jaworski, P.Geo. 604.659.8282 David Sadowski (Associate) 604.659.8255 Graham Morrison (Associate) 604.659.8238
P A P E R & F O R E S T P R O D U C T S
PA P E R & FO R E S T PR O D U C T S Daryl Swetlishoff, CFA 604.659.8246 David Quezada (Associate) 604.659.8257
R E A L E S T A T E
RE A L ES T A T E & REITS Mandy Samols, CA, CFA 416.777.7175 Tracy Reynolds (Associate) 416.777.7042
T E C H N O L O G Y
TE C H N O L O G Y, AL T E R N A T I V E EN E R G Y & CL E A N TE C H Steven Li, CFA 416.777.4918 Anthony Jin, MBA, P.Eng (Associate) 416.777.6414 Diane Yu (Associate) 416.777.7150
EQUITY RESEARCH PUBLISHING SE N I O R SU P E R V I S O R Y AN A L Y S T
Heather Herron 403.509.0509 AC T I N G HE A D O F PU B L I S H I N G
Cynthia Lui 604.659.8210 Diego Marconato (Supervisory Analyst) 604.659.8236 Ashley Ramsay (Research Editor) 604.659.8226 Inder Gill (Research Editor) 604.659.8202 Deborah Cheetham (Publishing Assistant) 604.659.8200 Christine Marte (Research Publisher) 604.659.8200
INST ITUT IONAL EQUITY SALES HE A D O F SA L E S
Mike Westcott 416.777.4935 Michelle Baldry (Marketing Coordinator) 416.777.4951
T O R O N T O (CAN 1.888.601.6105 | USA 1.800.290.4847)
Laura Arrell (U.S. Equities) 416.777.4920 Sean Boyle 416.777.4927 Jeff Carruthers, CFA 416.777.4929 Jon De Vos (London) 0.207.426.5632 Richard Eakins 416.777.4926 Jonathan Greer 416.777.4930 Michael Horowitz 416.777.4946 Aman Jain 416.777.4949 Dave MacLennan 416.777.4934 Robert Mills 416.777.4945 Doug Owen 416.777.4925 Nicole Svec-Griffis, CFA (U.S. Equities) 416.777.4942 Lakshmi Thurai (London) 0.207.426.5626 Neil Weber 416.777.4931 Carmela Avella (Assistant) 416.777.4915 Ornella Burns (Assistant) 416.777.4928
V A N C O U V E R (1.800.667.2899)
Scot Atkinson, CFA 604.659.8225 Doug Bell 604.659.8220 Terri McEwan (Assistant) 604.659.8228
M O N T R E A L (514.350.4450 | 1.866.350.4455)
John Hart 514.350.4462 David Maislin, CFA 514.350.4460 Tanya Hatcher (Assistant) 514.350.4458
INST ITUT IONAL EQUITY TRADING CO-HE A D O F TR A D I N G
Bob McDonald, CFA 604.659.8222 Andrew Foote, CFA 416.777.4924
T O R O N T O (CANADA 1.888.601.6105 | USA 1.800.290.4847)
Pam Banks 416.777.4923 Anthony Cox 416.777.4922 Ross Davidson 416.777.4981 Oliver Herbst 416.777.4947 Andy Herrmann 416.777.4937 Rebecca Joseph 416.777.4938 Eric Munro, CFA 416.777.4983 James Shields 416.777.4941 Bob Standing 416.777.4921 Peter Mason (Assistant) 416.777.7195
V A N C O U V E R (1.800.667.2899)
Nav Cheema 604.659.8224 Fraser Jefferson 604.659.8218 Derek Oram 604.659.8223
M O N T R E A L (514.350.4450 | 1.866.350.4455)
Sebastien Benoit 514.350.4466 Joe Clement 514.350.4470
RETA IL RESEARCH & D ISTR IBUT ION Don Ogden, CFA 604.659.8227 Samantha Barrett, CFA 604.659.8235 Arno Richter (Associate) 604.659.8243
INST ITUT IONAL EQUITY OFF ICES Calgary Suite 2500 707 8th Avenue SW Calgary, AB T2P 1H5 403.509.0500
Montreal Suite 1420 1002 Sherbrooke St W Montreal, PQ H3A 3L6 514.350.4450 Toll Free: 1.866.350.4455
Vancouver Suite 2200 925 West Georgia Street Vancouver, BC V6C 3L2 604.659.8200 Toll Free: 1.800.667.2899
Toronto Suite 5400, Scotia Plaza 40 King Street West Toronto, ON M5H 3Y2 416.777.4900 Toll Free Canada: 1.888.601.6105 Toll Free USA: 1.800.290.4847
International Headquarters The Raymond James Financial Center 880 Carillon Parkway St.Petersburg, FL USA 33716 727.567.1000