U.S. Fish & Wildlife Service · U.S. Fish and Wildlife Service ... dry summers and cool, wet...
27
Arcata Fisheries Data Series Report DS 2017-49 Klamath and Trinity River Intra-Gravel Water Temperatures, 2015 and 2016 Aaron T. David U.S. Fish and Wildlife Service Arcata Fish and Wildlife Office 1655 Heindon Road Arcata, California 95521 (707) 822-7201 April 2017 U.S. Fish & Wildlife Service
-
Upload
trinhthuan -
Category
Documents
-
view
216 -
download
0
Transcript of U.S. Fish & Wildlife Service · U.S. Fish and Wildlife Service ... dry summers and cool, wet...

Arcata Fisheries Data Series Report DS 2017-49
Klamath and Trinity River Intra-Gravel Water Temperatures, 2015 and 2016
Aaron T. David
U.S. Fish and Wildlife Service
Arcata Fish and Wildlife Office
1655 Heindon Road
Arcata, California 95521
(707) 822-7201
April 2017
U.S. Fish & Wildlife Service

ii
Disclaimer: The mention of trade names or commercial products in this report does not
constitute endorsement or recommendation for use by the Federal Government.
Key words: Intra-Gravel, Klamath River, Trinity River, Chinook Salmon,
Water Temperature
The correct citation for this report is:
David, A. T. 2017. Klamath and Trinity River intra-gravel water temperatures, 2015 and
2016. U.S. Fish and Wildlife Service. Arcata Fish and Wildlife Office, Arcata Fisheries
Data Series Report Number DS 2017-49, Arcata, California.
The Arcata Fish and Wildlife Office Fisheries Program reports its study findings through
two publication series. The Arcata Fisheries Data Series was established to provide
timely dissemination of data to local managers and for inclusion in agency databases. The
Arcata Fisheries Technical Reports publishes scientific findings from single and multi-
year studies that have undergone more extensive peer review and statistical testing.
Additionally, some study results are published in a variety of professional fisheries
journals.
Funding for this study was provided by the Arcata Fish and Wildlife Office’s
Klamath River Fish Habitat Assessment Program and its on-going Trinity River
Water Temperature Monitoring Study.

iii
Table of Contents
page
Introduction .......................................................................................................................... 1
Study Area ............................................................................................................................ 2
Methods ................................................................................................................................ 4
Results .................................................................................................................................. 6
Klamath River .................................................................................................................... 6
R Ranch (rkm 304.7) ......................................................................................................... 6
Klamath Community Hall (rkm 258.4) .............................................................................. 6
Trinity River ....................................................................................................................... 6
Cemetery Side Channel (rkm 178.5) .................................................................................. 6
Sheridan Riffle (rkm 133.3) ............................................................................................... 7
Big Bar (rkm 104.2) .......................................................................................................... 7
Discussion .......................................................................................................................... 14
Acknowledgements ............................................................................................................. 16
Literature Cited................................................................................................................... 16
List of Tables
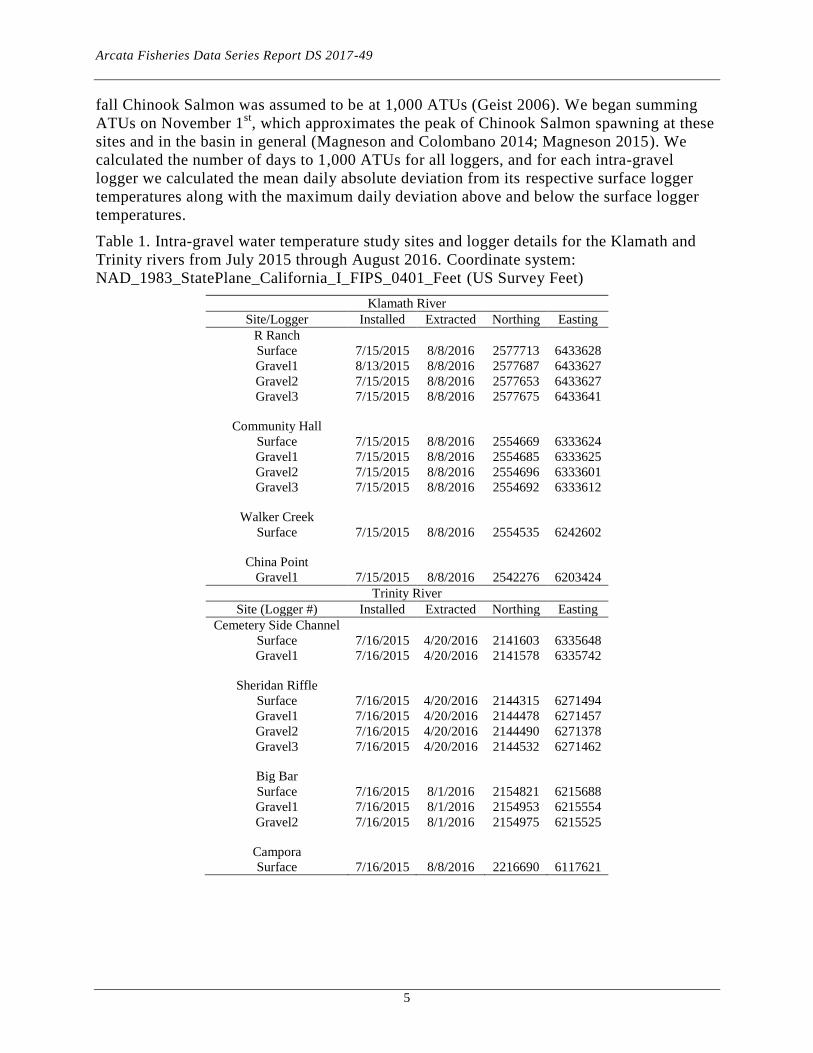
Table 1. Intra-gravel water temperature study sites and logger details for the Klamath and
Trinity rivers from July 2015 through August 2016. ....................................................... 5
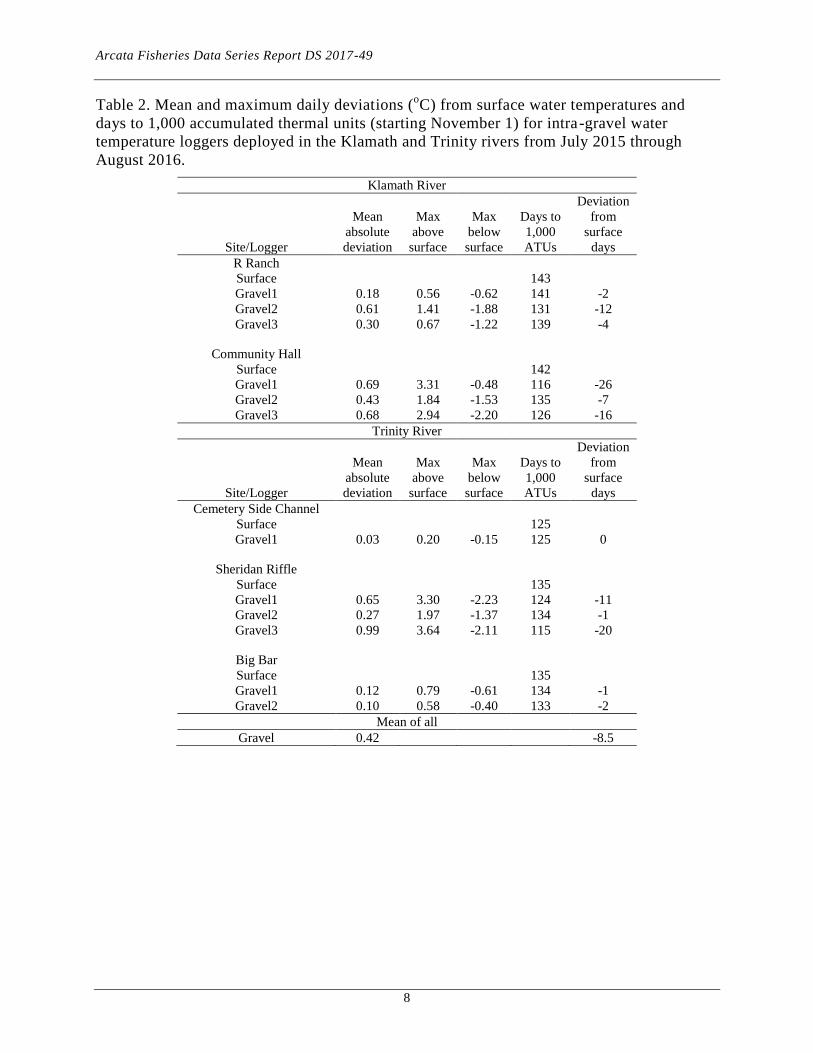
Table 2. Mean and maximum daily deviations (oC) from surface water temperatures and
days to 1,000 accumulated thermal units (starting November 1) for intra-gravel water
temperature loggers deployed in the Klamath and Trinity rivers from July 2015 through
August 2016. ................................................................................................................... 8
List of Figures
Figure 1. Klamath and Trinity River intra-gravel and surface water temperature monitoring
sites from summer 2015 to summer 2016. ....................................................................... 3
Figure 2. Daily-mean intra-gravel and surface water temperatures in the mainstem Klamath
River at R Ranch (rkm 304.7) from July 2015 to August 2016 (top), and daily mean
deviations of intra-gravel water temperatures from surface water temperatures for the
same period (bottom). ..................................................................................................... 9
Figure 3. Daily-mean intra-gravel and surface water temperatures in the mainstem Klamath
River at Klamath River Community Hall (rkm 258.4) from July 2015 to August 2016
(top), and daily mean deviations of intra-gravel water temperatures from surface water
temperatures for the same period (bottom). ................................................................... 10

iv
Figure 4. Daily-mean intra-gravel and surface water temperatures in the mainstem Trinity
River at Cemetery Side Channel (rkm 178.5) from July 2015 to April 2016 (top), and
daily mean deviations of intra-gravel water temperatures from surface water
temperatures for the same period (bottom). ................................................................... 11
Figure 5. Daily-mean intra-gravel and surface water temperatures in the mainstem Trinity
River at Sheridan Riffle (rkm 133.3) from July 2015 to April 2016 (top), and daily mean
deviations of intra-gravel water temperatures from surface water temperatures for the
same period (bottom). ................................................................................................... 12
Figure 6. Daily-mean intra-gravel and surface water temperatures in the mainstem Trinity
River at Big Bar (rkm 104.2) from July 2015 to August 2016 (top), and daily mean
deviations of intra-gravel water temperatures from surface temperatures for the same
period (bottom). ............................................................................................................ 13
List of Appendices
Appendix A. Map of intra-gravel and surface (ambient) water temperature loggers at R
Ranch on the Klamath River for both study years. ........................................................ 19
Appendix B. Map of intra-gravel and surface (ambient) water temperature loggers at
Klamath Community Hall on the Klamath River for both study years. .......................... 20
Appendix C. Map of intra-gravel and surface (ambient) water temperature loggers at
Cemetery Side Channel on the Trinity River for both study years. ................................ 21
Appendix D. Map of intra-gravel and surface (ambient) water temperature loggers at
Sheridan Riffle on the Trinity River for both study years. ............................................. 22
Appendix E. Map of intra-gravel and surface (ambient) water temperature loggers at Big
Bar on the Trinity River for the 2015-2016 study. ......................................................... 23

Arcata Fisheries Data Series Report DS 2017-49
Klamath and Trinity River Intra-Gravel Water Temperatures, 2015 and 2016
Aaron T. David
U.S. Fish and Wildlife Service, Arcata Fish and Wildlife Office
1655 Heindon Road, Arcata, California
Abstract. Digital loggers were used to monitor water temperatures in spawning
gravels and in the surface water column adjacent to spawning gravels in the Klamath
and Trinity rivers from July 2015 to April or August 2016. Loggers were installed in
areas with high densities of Chinook Salmon redds to assess potential differences in
predicted embryo incubation and subsequent emergence timing calculated using
intra-gravel versus surface water temperatures. In general, intra-gravel water
temperatures were warmer in the fall and winter and cooler in the spring and summer
than surface water temperatures. However, both within- and among-site variation in
the magnitude of deviation from surface temperatures was observed. Some of this
variation was not easily explained and was beyond the resolution of this study.
Estimated emergence timing based on intra-gravel water temperatures ranged from 0
to 26 days earlier than what would be expected based on surface water temperatures.
These findings are important given the influence of intra-gravel temperatures on the
development of salmonid embryos and the resulting influence on emergence timing.
Introduction
Like other aquatic ectotherms, Pacific salmon (Oncorhynchus spp) are highly sensitive to
variation in water temperature, which influences their development, growth, foraging,
spawning, and survival (Brett 1971; Beschta et al. 1987; McCullough 1999). In many
watersheds along the Pacific Coast of North America, including the Klamath River basin,
water temperatures have increased due to habitat alteration, water withdrawals, and climate
change (NRC 1996; Bartholow 2005; Isaak et al. 2011), resulting in deleterious impacts to
salmon populations (NRC 1996; McCullough 1999; NRC 2004). Monitoring water
temperatures is an important component of assessing the status of salmon-supporting
ecosystems and the effects of management actions and other human activities on salmon
development, growth, and survival. However, the common practice of placing temperature
loggers longitudinally along a river or river network may not capture important fine-scale
temperature variation within a river channel, such as that between surface flow and
hyporheic (intra-gravel) flow.
Salmon often select spawning sites with down-welling (Chapman 1988), up-welling (Geist
and Dauble 1998; Geist 2000; Malcolm et al. 2002), or both types (Neumann and Curtis
2016) of intra-gravel flow. Surface water (water column) temperatures can differ from intra-

Arcata Fisheries Data Series Report DS 2017-49
2
gravel temperatures (Crisp 1990; Geist 2000; Hanrahan 2007) and these differences may be
important when describing the thermal environment experienced by developing eggs and
embryos (Shepherd et al. 1986). In contrast, a difference was not observed between surface
and intra-gravel water temperatures for artificial redds (Groves et al. 2008). Given the lack
of intra-gravel water temperature data in the Klamath and Trinity rivers, the Arcata Fish and
Wildlife Office (AFWO) set out to evaluate potential differences between intra-gravel and
surface water temperatures in the Klamath basin. In particular, this information was needed
to inform a Chinook Salmon (O. tshawytscha) production model that is being developed for
the Klamath River basin (Stream Salmonid Simulator or S3 Model).
The Stream Salmonid Simulator uses water temperatures, estimated by the sub-model
RBM10 (Jones et al. 2016), to determine timing of egg development and emergence as free-
swimming fry. However, RBM10 estimates spatially-specific temperatures in the surface
water column, which may not accurately reflect temperatures experienced by eggs within a
redd. The purpose of this study was to determine if there were differences between
intra-gravel and water-column water temperatures in the Klamath basin. If differences exist,
they will influence the S3 model’s estimates of emergence timing of free-swimming
Chinook Salmon fry. This report describes results from the second and final year of
monitoring of intra-gravel water temperatures. The results from the first year of monitoring
are found in Magneson (2015).
Study Area
The Klamath River basin is the third largest watershed (41,000 km2) draining to the Pacific
Ocean in the conterminous USA and has an atypical structure compared to most watersheds.
The Klamath River originates in the Cascade Mountains of southern Oregon and then flows
into the upper Klamath basin, a large, low relief plateau that historically contained extensive
shallow lakes and wetlands (NRC 2004; VanderKooi et al. 2011). The Klamath River then
cuts through the southern end of the Cascade Mountains and is impounded by a series of six
dams. These dams mark the transition from upper to lower basin and divide the watershed
by preventing fish passage and altering flows and sediment transport. Below the dams, the
Klamath River enters the Klamath-Siskiyou Mountains and flows for approximately 235
river kilometers (rkm) to its confluence with the Trinity River. In contrast to the upper
basin, the lower basin is high relief and the Klamath River and its tributaries primarily flow
through confined canyons (NRC 2004; VanderKooi et al. 2011). Overall the watershed has a
Mediterranean climate with warm, dry summers and cool, wet winters. However, the climate
changes dramatically from east to west and also at finer scales according to elevation,
topography, and aspect. The upper basin is generally semi-arid and river flows are primarily
driven by snowmelt and groundwater, while the lower basin is more mesic and river flows
are primary driven by rainfall and snowmelt (NRC 2004; Williams and Curry 2011). All
water temperature sampling sites were located in the lower Klamath basin.
The Trinity River, the Klamath River’s largest tributary, flows through mountainous terrain
in a northwesterly direction to the Klamath River. The Trinity River has two reservoirs
made by Trinity and Lewiston dams. From the lower most dam the Trinity River flows for
180 rkm before joining the Klamath River at Weitchpec, California. From Weitchpec, the
Klamath River flows for 70 rkm before entering the Pacific Ocean (Figure 1).

Arcata Fisheries Data Series Report DS 2017-49
3
Figure 1. Klamath and Trinity River intra-gravel and surface water temperature monitoring
sites from summer 2015 to summer 2016. The red diamonds represent the sampling sites.

Arcata Fisheries Data Series Report DS 2017-49
4
Methods
Data loggers (HOBO Water Temp Pro v2 Model Number U22 001; Onset Computer
Corporation, Bourne, Massachusetts) were used to record water temperatures and were set
to record at 30-min intervals. Prior to and after deployment, each logger was tested to verify
operation within the manufacturer’s accuracy specification of ± 0.2 ˚C. The loggers proved
accurate and reliable for all tests conducted during the study and no “logger drift”
adjustments to temperature data were necessary.
Surface water temperatures were monitored by attaching a temperature logger to an end of a
piece of chain with the other end attached to the river bank. These loggers were placed
along the river margin in water < 1.0 m deep during late-summer, low-flow conditions and
in the vicinity (< 100 m) of the intra-gravel temperature loggers. Intra-gravel temperature
loggers were placed within the river bed at various locations at sites known to have high
densities of Chinook Salmon spawning. Temperature loggers were attached to one end of a
plastic cable tie with stainless steel wire threaded through a hole in the end of each logger
(Zimmerman and Finn 2012). A green stake whisker was attached to the upper end of the
cable tie to assist in re-locating the temperature logger. The sensor end of the temperature
logger was placed approximately 28 cm into the substrate, leaving the stake whiskers just
above the substrate surface. The depth of 28 cm was based on the range of egg pocket
depths observed by Evenson (2001) for Chinook Salmon redds in the Trinity River.
To install intra-gravel loggers, a steel probe nested inside an aluminum pipe was pounded
vertically into the substrate with a sledge hammer (Zimmerman and Finn 2012). The steel
probe was then removed from the pipe and a wooden dowel was used to push the logger into
the bottom of the pipe. The pipe was then carefully lifted out of the substrate, with pressure
applied on the dowel to hold the temperature logger in place. The dowel was then carefully
removed from the substrate, leaving the temperature logger buried in the substrate.
Four water temperature monitoring sites were selected on both the Klamath and Trinity
rivers (Figure 1). Sites were selected based on having high redd densities in recent years,
being readily accessible, and to ensure distribution throughout the primary extent of
mainstem river spawning. Water temperature loggers were deployed in mid-July 2015 and
retrieved in late April or early August 2016 (Table 1). One surface and four intra-gravel
loggers were installed at each site. The location of each logger was recorded using a Pro XH
GPS, Zephyr Geodetic™ antenna, and TerraSync™ survey software (Trimble Navigation
Limited, Sunnyvale, CA, USA) on a tablet computer. For extraction, the GPS was used to
navigate to each logger’s location, and loggers were visual identified by the stake whiskers.
A clamming shovel was used to clear substrate away from the water temperature logger so
that it could be more easily extracted.
Logger data were downloaded using HOBOware Pro by Onset®
and imported into Microsoft
Excel and the R software for statistical computing for analysis and visualization. Only sites
retaining both functional surface and intra-gravel water temperature loggers were analyzed.
Accumulated thermal units (ATUs) were used to convert intra-gravel and surface daily
mean water temperatures into a biologically-relevant metric: fry emergence time. Incubation
times for fall Chinook Salmon eggs can be estimated by starting at the peak spawning
survey week (approximately when 50% of spawning has occurred; Shepherd et al. 1986),
and summing ATUs using daily mean temperatures. The peak emergence time for juvenile
Arcata Fisheries Data Series Report DS 2017-49
5
fall Chinook Salmon was assumed to be at 1,000 ATUs (Geist 2006). We began summing
ATUs on November 1st, which approximates the peak of Chinook Salmon spawning at these
sites and in the basin in general (Magneson and Colombano 2014; Magneson 2015). We
calculated the number of days to 1,000 ATUs for all loggers, and for each intra-gravel
logger we calculated the mean daily absolute deviation from its respective surface logger
temperatures along with the maximum daily deviation above and below the surface logger
temperatures.
Table 1. Intra-gravel water temperature study sites and logger details for the Klamath and
Trinity rivers from July 2015 through August 2016. Coordinate system:
NAD_1983_StatePlane_California_I_FIPS_0401_Feet (US Survey Feet)
Klamath River
Site/Logger Installed Extracted Northing Easting
R Ranch
Surface 7/15/2015 8/8/2016 2577713 6433628
Gravel1 8/13/2015 8/8/2016 2577687 6433627
Gravel2 7/15/2015 8/8/2016 2577653 6433627
Gravel3 7/15/2015 8/8/2016 2577675 6433641
Community Hall
Surface 7/15/2015 8/8/2016 2554669 6333624
Gravel1 7/15/2015 8/8/2016 2554685 6333625
Gravel2 7/15/2015 8/8/2016 2554696 6333601
Gravel3 7/15/2015 8/8/2016 2554692 6333612
Walker Creek
Surface 7/15/2015 8/8/2016 2554535 6242602
China Point
Gravel1 7/15/2015 8/8/2016 2542276 6203424
Trinity River
Site (Logger #) Installed Extracted Northing Easting
Cemetery Side Channel
Surface 7/16/2015 4/20/2016 2141603 6335648
Gravel1 7/16/2015 4/20/2016 2141578 6335742
Sheridan Riffle
Surface 7/16/2015 4/20/2016 2144315 6271494
Gravel1 7/16/2015 4/20/2016 2144478 6271457
Gravel2 7/16/2015 4/20/2016 2144490 6271378
Gravel3 7/16/2015 4/20/2016 2144532 6271462
Big Bar
Surface 7/16/2015 8/1/2016 2154821 6215688
Gravel1 7/16/2015 8/1/2016 2154953 6215554
Gravel2 7/16/2015 8/1/2016 2154975 6215525
Campora
Surface 7/16/2015 8/8/2016 2216690 6117621

Arcata Fisheries Data Series Report DS 2017-49
6
Results
Out of 40 temperature loggers deployed in July 2015, 20 were re-located and retrieved in
April or August 2016 (Table 1). On the Klamath River, both surface and intra-gravel
temperature loggers were retrieved at two of four sites (R Ranch and Klamath Community
Hall). On the Trinity River, both surface and intra-gravel temperature loggers were retrieved
at three of four sites (Cemetery Side Channel, Sheridan Riffle, and Big Bar). Loggers we
were unable to re-locate were likely washed away during winter high-flow events or were
excavated by spawning salmon. At all five sites, daily-mean water temperatures exhibited
typical seasonal patterns, with minimum temperatures occurring in December or January
and maximum temperatures occurring in July or August. Across all intra-gravel loggers, the
mean deviation from surface water temperatures was 0.42 oC (Table 2). The mean estimated
emergence timing based on intra-gravel water temperatures ranged from 0 to 26 days
(mean = 8.5 days) earlier than what would be expected based on surface water temperatures.
Klamath River
R Ranch (rkm 304.7)
Three intra-gravel loggers were retrieved at R Ranch. Intra-gravel water temperatures were
typically slightly warmer than surface water temperatures during fall and winter and were
typically slightly cooler than surface water temperatures during spring and summer (Figure
2). Mean deviations from surface water temperatures across the sampling period ranged
from 0.18 oC to 0.61
oC among the three intra-gravel loggers. Daily-mean intra-gravel water
temperatures were up to 1.41 oC warmer than surface water temperatures and as low as 1.88
oC cooler than surface water temperatures. The threshold of 1,000 ATUs was reached by the
intra-gravel loggers between 2 and 12 days before the surface logger. Summary statistics for
each logger are found in Table 2. Appendix A has a map of logger placements at R Ranch,
with logger placements from the previous year included for comparison.
Klamath Community Hall (rkm 258.4)
Three intra-gravel loggers were retrieved at Klamath Community Hall. Seasonal patterns in
differences between intra-gravel and surface water temperatures at Klamath Community
Hall were similar to those at R Ranch (Figure 3). Mean deviations from surface water
temperatures across the sampling period ranged from 0.43 oC to 0.69
oC among the three
intra-gravel loggers. Daily-mean intra-gravel water temperatures were up to 3.31 oC warmer
than surface water temperatures and as low as 2.20 oC cooler than surface water
temperatures. The threshold of 1,000 ATUs was reached by the intra-gravel loggers between
7 and 26 days before the surface logger. Summary statistics for each logger are found in
Table 2. Appendix B has a map of logger placements at Klamath Community Hall, with
logger placements from the previous year included for comparison.
Trinity River
Cemetery Side Channel (rkm 178.5)
Only a single intra-gravel logger was retrieved at Cemetery Side Channel. Intra-gravel water
temperatures deviated only slightly from surface water temperatures and there was little

Arcata Fisheries Data Series Report DS 2017-49
7
evidence of a seasonal pattern in the deviations (Figure 4). The mean deviation from surface
water temperatures across the sampling period was 0.03 oC for the lone intra-gravel logger.
Daily-mean intra-gravel water temperatures were up to 0.20 oC warmer than surface water
temperatures and as low as 0.15 oC cooler than surface water temperatures. The threshold of
1,000 ATUs was reached by the intra-gravel and surface loggers on the same day. Summary
statistics for each logger are found in Table 2. Appendix C has a map of logger placements
at Cemetery Side Channel, with logger placements from the previous year included for
comparison.
Sheridan Riffle (rkm 133.3)
Three intra-gravel loggers were retrieved at Sheridan Riffle. Intra-gravel water temperatures
were typically warmer than surface water temperatures during fall and winter and were
typically cooler than surface water temperatures during early spring, although there were
exceptions (Figure 5). Mean deviations from surface water temperatures across the sampling
period ranged from 0.27 oC to 0.99
oC among the three intra-gravel loggers. Daily-mean
intra-gravel water temperatures were up to 3.64 oC warmer than surface water temperatures
and as low as 2.23 oC cooler than surface water temperatures. The threshold of 1,000 ATUs
was reached by the intra-gravel loggers between 1 and 20 days before the surface logger.
Summary statistics for each logger are found in Table 2. Appendix D has a map of logger
placements at Sheridan Riffle, with logger placements from the previous year included for
comparison.
Big Bar (rkm 104.2)
Two intra-gravel loggers were retrieved at Big Bar. Intra-gravel water temperatures were
typically slightly warmer than surface water temperatures during late summer through fall,
and varied between being warmer and cooler than surface water temperatures for the
remainder of the sampling period (Figure 6). Mean deviations from surface water
temperatures across the sampling period ranged from 0.10 oC to 0.12
oC between the two
intra-gravel loggers. Daily-mean intra-gravel water temperatures were up to 0.79 oC warmer
than surface water temperatures and as low as 0.61 oC cooler than surface water
temperatures. The threshold of 1,000 ATUs was reached by the intra-gravel loggers between
1 and 2 days before the surface logger. Summary statistics for each logger are found in
Table 2. Appendix E has a map of logger placements at Big Bar.
Arcata Fisheries Data Series Report DS 2017-49
8
Table 2. Mean and maximum daily deviations (oC) from surface water temperatures and
days to 1,000 accumulated thermal units (starting November 1) for intra-gravel water
temperature loggers deployed in the Klamath and Trinity rivers from July 2015 through
August 2016.
Klamath River
Site/Logger
Mean
absolute
deviation
Max
above
surface
Max
below
surface
Days to
1,000
ATUs
Deviation
from
surface
days
R Ranch
Surface
143
Gravel1 0.18 0.56 -0.62 141 -2
Gravel2 0.61 1.41 -1.88 131 -12
Gravel3 0.30 0.67 -1.22 139 -4
Community Hall
Surface
142
Gravel1 0.69 3.31 -0.48 116 -26
Gravel2 0.43 1.84 -1.53 135 -7
Gravel3 0.68 2.94 -2.20 126 -16
Trinity River
Site/Logger
Mean
absolute
deviation
Max
above
surface
Max
below
surface
Days to
1,000
ATUs
Deviation
from
surface
days
Cemetery Side Channel
Surface
125
Gravel1 0.03 0.20 -0.15 125 0
Sheridan Riffle
Surface
135
Gravel1 0.65 3.30 -2.23 124 -11
Gravel2 0.27 1.97 -1.37 134 -1
Gravel3 0.99 3.64 -2.11 115 -20
Big Bar
Surface
135
Gravel1 0.12 0.79 -0.61 134 -1
Gravel2 0.10 0.58 -0.40 133 -2
Mean of all
Gravel 0.42 -8.5

Arcata Fisheries Data Series Report DS 2017-49
9
Figure 2. Daily-mean intra-gravel and surface water temperatures in the mainstem
Klamath River at R Ranch (rkm 304.7) from July 2015 to August 2016 (top), and
daily mean deviations of intra-gravel water temperatures from surface water
temperatures for the same period (bottom).

Arcata Fisheries Data Series Report DS 2017-49
10
Figure 3. Daily-mean intra-gravel and surface water temperatures in the mainstem Klamath
River at Klamath River Community Hall (rkm 258.4) from July 2015 to August 2016 (top),
and daily mean deviations of intra-gravel water temperatures from surface water
temperatures for the same period (bottom).

Arcata Fisheries Data Series Report DS 2017-49
11
Figure 4. Daily-mean intra-gravel and surface water temperatures in the mainstem
Trinity River at Cemetery Side Channel (rkm 178.5) from July 2015 to April 2016
(top), and daily mean deviations of intra-gravel water temperatures from surface
water temperatures for the same period (bottom).

Arcata Fisheries Data Series Report DS 2017-49
12
Figure 5. Daily-mean intra-gravel and surface water temperatures in the mainstem
Trinity River at Sheridan Riffle (rkm 133.3) from July 2015 to April 2016 (top), and
daily mean deviations of intra-gravel water temperatures from surface water
temperatures for the same period (bottom).

Arcata Fisheries Data Series Report DS 2017-49
13
Figure 6. Daily-mean intra-gravel and surface water temperatures in the mainstem
Trinity River at Big Bar (rkm 104.2) from July 2015 to August 2016 (top), and daily
mean deviations of intra-gravel water temperatures from surface temperatures for the
same period (bottom).

Arcata Fisheries Data Series Report DS 2017-49
14
Discussion
Intra-gravel water temperatures were generally warmer than surface water temperatures
during fall and winter and cooler during spring and summer at our sampling sites in the
lower Klamath basin. Most pertinent to our focus, the period from mid-October to early
March, when most Chinook Salmon spawning and egg incubation occurs in the Klamath
basin, intra-gravel water temperatures were usually, though not exclusively, warmer than
surface water temperatures. This observation suggests that incubating Chinook Salmon eggs
experience warmer temperatures than would be predicted from surface water temperatures
alone, and will develop and emerge faster than expected given surface water temperatures.
In the first year of this study, Magneson (2015) observed a similar pattern. Our observations
also align with research in other rivers, demonstrating that intra-gravel water temperatures
are often more thermally stable than surface water temperatures (i.e., warmer in winter and
cooler in summer relative to surface temperatures; Shepherd et al. 1986; Crisp 1990;
Hanrahan 2007; Hannah et al. 2009).
The degree of deviation between intra-gravel and surface water temperatures did vary,
however, among individual loggers within a site and among sites in the Klamath and Trinity
rivers. Broadly, the relationship between intra-gravel and surface water temperatures is
regulated by river channel bedform, substrate size and grading, and the relative amount of
upwelling hyporheic flow vs. downwelling surface flow (Burkholder et al. 2008; Hannah et
al. 2009 and references therein; C. Shea, USFWS, personal communication). Coarse
substrates with large interstitial spaces tend to promote hydraulic connectivity between
surface and intra-gravel flow, resulting in smaller temperature differences. Fine substrates
with small interstitial spaces tend to reduce hydraulic connectivity and slow intra-gravel
flow rates, resulting in divergence between surface and intra-gravel water temperatures.
Channel bedforms and other geomorphic features which promote surface downwelling (e.g.,
riffle heads) tend to minimize differences between intra-gravel and surface water
temperatures. In contrast, channel bedforms and other geomorphic features which promote
hyporheic upwelling (e.g., riffle tails), tend to increase differences between intra-gravel and
surface temperatures.
Intra-gravel loggers at three sites had generally small deviations from surface water
temperatures (R Ranch on the Klamath River and Cemetery Side Channel and Big Bar on
the Trinity River), while intra-gravel loggers at two sites had generally moderate deviations
from surface temperatures (Community Hall on the Klamath River and Sheridan Riffle on
the Trinity River). This result was also evident in the 2014-2015 study (excluding Big Bar,
where loggers were not recovered), suggesting a consistent pattern.
Notably, R Ranch and Cemetery Side Channel are the sites closest to the downstream most
dams on their respective rivers. Dams often trap fine sediment, resulting in coarsened
sediment downstream (Kondolf 1997) and thus potentially increased connectivity between
surface and hyporheic waters, which could explain the small differences between surface
and intra-gravel water temperatures at these two sites. However, Big Bar is the furthest
downstream of the three sites on the Trinity River considered in this report, which doesn’t
support this explanation. As a partial alternative explanation, Cemetery Side Channel, which
had the smallest surface – intra-gravel temperature differences of any site, was part of a
constructed channel rehabilitation site. Rehabilitation activities included the addition of
Arcata Fisheries Data Series Report DS 2017-49
15
gravels containing no fines (sediments less than 2 mm), which could increase connectivity
between surface and intra-gravel flow and thus potentially dampen temperature differences.
In both study years, the largest deviations from surface temperatures were observed at the
Community Hall site on the Klamath River and the Sheridan Riffle site on the Trinity River.
At Sheridan Riffle, a small tributary (Sheridan Creek) flows subsurface and enters the
Trinity River on river right. Upwelling hyporheic flow from Sheridan Creek may moderate
intra-gravel water temperatures at this site (D. Rupert and C. Shea, USFWS, personal
communication). However, I am not aware of a similar input of hyporheic flow at the
Klamath Community Hall site. Examination of maps of logger distribution at each site did
not suggest obvious explanations for the variation in the amount of deviation from surface
water temperatures among intra-gravel loggers within a site. Interestingly, at the Big Bar
and Cemetery Side Channel sites on the Trinity River there was less of a clear seasonal
pattern of deviations from surface temperatures than at Sheridan Riffle or the Klamath River
sites, although again it is unclear what is driving these differences. These inferences are
speculative, however, as this study did not seek to explain variation in surface – intra-gravel
water temperature relationships among or within sampling sites.
While the observed variation in surface – intra-gravel water temperature relationships poses
a challenge to predicting the emergence timing of salmon fry, it may be a potentially
important facet of river ecosystem diversity. Within the Klamath Community Hall and
Sheridan Riffle sites there was almost a three-week range in the number of days needed to
reach 1,000 ATUs by different intra-gravel loggers. This fine-scale variation in intra-gravel
temperatures may translate to variation in the emergence timing of Chinook Salmon fry.
Habitat-mediated life-history diversity, such as temperature-driven differences in emergence
timing, can increase salmon population resilience and reduce temporal variation in
abundance (Hilborn et al. 2003; Moore et al. 2014).
In summary, intra-gravel water temperatures on both the Klamath and Trinity rivers were
generally warmer than surface water temperatures during fall and winter and cooler during
spring and summer. Because of these differences, Chinook Salmon fry likely emerge from
the gravel earlier than would be predicted by surface water temperatures alone. The S3
model development should attempt to incorporate these differences in temperature to more
accurately portray the rate of development of Chinook Salmon embryos and the emergence
timing of fry. However, considerable variation in the magnitude of deviation between
surface and intra-gravel water temperatures existed both within and among sites. To
understand this fine-scale variation will likely necessitate a more detailed, intensive effort to
map intra-gravel water temperatures. If future studies of intra-gravel water temperatures are
undertaken, I suggest that a greater number of loggers be deployed at each site to increase
the probability that multiple intra-gravel loggers are retrieved at each site. I also suggest
that additional information be collected for each deployed logger, such as distance to shore,
distance to the riffle crest, or surrounding substrate size, to be used as potential covariates in
an analysis of deviations from surface water temperatures.

Arcata Fisheries Data Series Report DS 2017-49
16
Acknowledgements
I would like to thank Mark Magneson for initiating this study, and Derek Rupert and
Savannah Bell for assistance deploying and retrieving loggers. Dr. Nicholas Som, Derek
Rupert, Damon Goodman, and Nicholas Hetrick provided helpful feedback on earlier drafts
of this report and Dr. Todd Buxton and Dr. Conor Shea helped interpret the results. I would
also like to thank R Ranch for allowing river access through their property.
Literature Cited
Bartholow, J. M. 2005. Recent water temperature trends in the lower Klamath River,
California. North American Journal of Fisheries Management 25:152–162.
Beschta, R., R. Bilby, G. Brown, L. Holtby, and T. Hofstra. 1987. Stream temperature and
aquatic habitat: fisheries and forestry interactions. Pages 191–232 in E. Salo and T.
Cundy, editors. Streamside management: forestry and fishery interactions. Institue of
Forest Resources, University of Washington, Seattle, Washington.
Brett, J. R. Energetic responses of salmon to temperature. A study of some thermal relations
in the physiology and freshwater ecology of sockeye salmon (Oncorhynchus nerka).
American Zoologist 11:99–113.
Burkholder, B. K., G. E. Grant, R. Haggerty, T. Khangaonkar, and P. J. Wampler. 2008.
Influence of hyporheic flow and geomorphology on temperature of a large, gravel-bed
river, Clackamas River, Oregon, USA. Hydrological Processes 22:941–953.
Chapman, D. W. 1988. Critical review of variables used to define effects of fines in redds of
large salmonids. Transactions of the American Fisheries Society 117:1–21.
Crisp, D. T. 1988. Prediction, from temperature, of eyeing, hatching and ‘swim-up’ times
for salmonid embryos. Freshwater Biology 19:41–48.
Crisp, D. T. 1990. Water temperature in a stream gravel bed and implications for salmonid
incubation. Freshwater Biology 23:601–612.
Evenson, D. F. 2001. Egg pocket depth and particle size composition within Chinook
salmon redds in the Trinity River, California. Master’s thesis. Department of Fisheries,
Humboldt State University, Arcata, California.
Geist, D. R., and D. D. Dauble. 1998. Redd site selection and spawning habitat use by fall
Chinook salmon: the importance of geomorphic features in large rivers. Environmental
Management 22:655–669.
Geist, D. R. 2000. Hyporheic discharge of river water into fall Chinook salmon
(Oncorhynchus tshawytscha) spawning areas in the Hanford Reach, Columbia River.
Canadian Journal of Fisheries and Aquatic Sciences 57:1647–1656.
Geist, D. R., C. S. Abernathy, K. D. Hand, V. I. Cullinan, J. A. Handler, and P. A. Groves.
2006. Survival, development, and growth of fall Chinook salmon embryos, alevins, and
fry exposed to variable thermal and dissolved oxygen regimes. Transactions of the
American Fisheries Society 135:1462–1477.

Arcata Fisheries Data Series Report DS 2017-49
17
Groves, P. A., J. A. Chandler, and T. J. Richter. 2008. Comparison of temperature data
collected from artificial Chinook salmon redds and surface water in the Snake River.
North American Journal of Fisheries Management 28:766–780.
Hannah, D. M., I. A. Malcolm, and C. Bradley. 2009. Seasonal hyporheic temperature
dynamics over riffle bedforms. Hydrological Processes 23: 2178–2194.
Hanrahan, T. P. 2007. Large-scale spatial variability of riverbed temperature gradients in
Snake River fall Chinook salmon spawning areas. River Research and Applications
23:323–341.
Hilborn, R., T. P. Quinn, D. E. Schindler, and D. E. Rogers. 2003. Biocomplexity and
fisheries sustainability. Proceedings of the National Academy of Sciences 100:6564–
6568.
Isaak, D. J., S. Wollrab, D. Horan, and G. Chandler. 2012. Climate change effects on stream
and river temperatures across the northwest U.S. from 1980-2009 and implications for
salmonid fishes. Climatic Change 113:499–524.
Jones, E. C., R. W. Perry, J. C. Risley, N. A. Som, and N. J. Hetrick. 2016. Construction,
calibration, and validation of the RBM10 water temperature model for the Trinity River,
northern California. U.S. Geological Survey Open-File Report 2016–1056.
Kondolf, G. M. 1997. Hungry water: effects of dams and gravel mining on river channels.
Environmental Management. 21:533–551.
Magneson, M. D. 2015. Klamath and Trinity River intra-gravel water temperatures, 2014
and 2015. U.S. Fish and Wildlife Service. Arcata Fish and Wildlife Office, Arcata
Fisheries Data Series Report Number DS 2015-45, Arcata, California.
Magneson, M. D., and P. Colombano. 2014. Mainstem Klamath River fall Chinook Salmon
redd survey 2013. U.S. Fish and Wildlife Service. Arcata Fish and Wildlife Office,
Arcata Fisheries Data Series Report Number DS 2014-40, Arcata, California.
Malcolm, I. A., C. Soulsby, and A. F. Youngson. 2002. Thermal regime in the hyporheic
zone of two contrasting salmon spawning streams: ecological and hydrological
implications. Fisheries Management and ecology 9:1–10.
McCullough, D. A. 1999. A review and synthesis of effects of alterations to the water
temperature regime on freshwater life stages of salmonids, with special reference to
Chinook salmon. Environmental Protection Agency, Region 10, Seattle, Washington.
Moore, J. W., J. D. Yeakel, D. Peard, J. Lough, and M. Beere. 2014. Life-history diversity
and its importance to population stability and persistence of a migratory fish: steelhead
in two large North American watersheds. Journal of Animal Ecology 83:1035–1046.
Murray, C. B., and T. D. Beacham. 1987. The development of Chinook (Oncorhynchus
tshawytscha) and chum (O. keta) embryos and alevins under varying temperature.
Canadian Journal of Zoology 65:2672–2681.
Neumann, N. N., and P. J. Curtis. 2016. River–groundwater interactions in salmon spawning
habitat: riverbed flow dynamics and non-stationarity in an end member mixing model.
Ecohydrology 9:1410–1423.

Arcata Fisheries Data Series Report DS 2017-49
18
NRC (National Research Council). 1996. Upstream: salmon and society in the Pacific
Northwest. National Academies Press, Washington, D.C.
NRC (National Research Council). 2004. Endangered and threatened fishes in the Klamath
River basin: causes of decline and strategies for recovery. National Academies Press,
Washington, D.C.
Shepherd, B. G., G. F. Hartman, and W. J. Wilson. 1986. Relationships between stream and
intragravel water temperatures in coastal drainages, and some implications for fisheries
workers. Canadian Journal of Fisheries and Aquatic Sciences 43:1818–1822.
VanderKooi, S., L. Thorsteinson, and M. Clark. 2011. Environmental and historical setting.
Pages 31–36 in L. Thorsteinson, S. VanderKooi, and W. Duffy, editors. Proceedings of
the Klamath Basin Science Conference, Medford, Oregon, February 1-5, 2010. U.S.
Geological Survey Open-File Report 2011-1196.
Williams, J., and D. Curry. 2011. Watershed characterization. Pages 37–74 in L.
Thorsteinson, S. VanderKooi, and W. Duffy, editors. Proceedings of the Klamath Basin
Science Conference, Medford, Oregon, February 1-5, 2010. U.S. Geological Survey
Open-File Report 2011-1196.
Zimmerman, C. E., and J. E. Finn. 2012. A simple method for in situ monitoring of water
temperature in substrates used by spawning salmonids. Journal of Fish and Wildlife
Management 3:288–295.

Arcata Fisheries Data Series Report DS 2017-49
19
Appendix A. Map of intra-gravel and surface (ambient) water temperature loggers at R
Ranch on the Klamath River for both study years. The size of intra-gravel logger symbols is
proportional to the mean daily absolute deviation (in degrees C) of intra-gravel temperatures
from surface temperatures. The blue arrow indicates the direction of river flow.

Arcata Fisheries Data Series Report DS 2017-49
20
Appendix B. Map of intra-gravel and surface (ambient) water temperature loggers at
Klamath Community Hall on the Klamath River for both study years. The size of intra-
gravel logger symbols is proportional to the mean daily absolute deviation (in degrees C) of
intra-gravel temperatures from surface temperatures. The blue arrow indicates the direction
of river flow.

Arcata Fisheries Data Series Report DS 2017-49
21
Appendix C. Map of intra-gravel and surface (ambient) water temperature loggers at
Cemetery Side Channel on the Trinity River for both study years. The size of intra-gravel
logger symbols is proportional to the mean daily absolute deviation (in degrees C) of intra-
gravel temperatures from surface temperatures. The blue arrow indicates the direction of
river flow.
Arcata Fisheries Data Series Report DS 2017-49
22
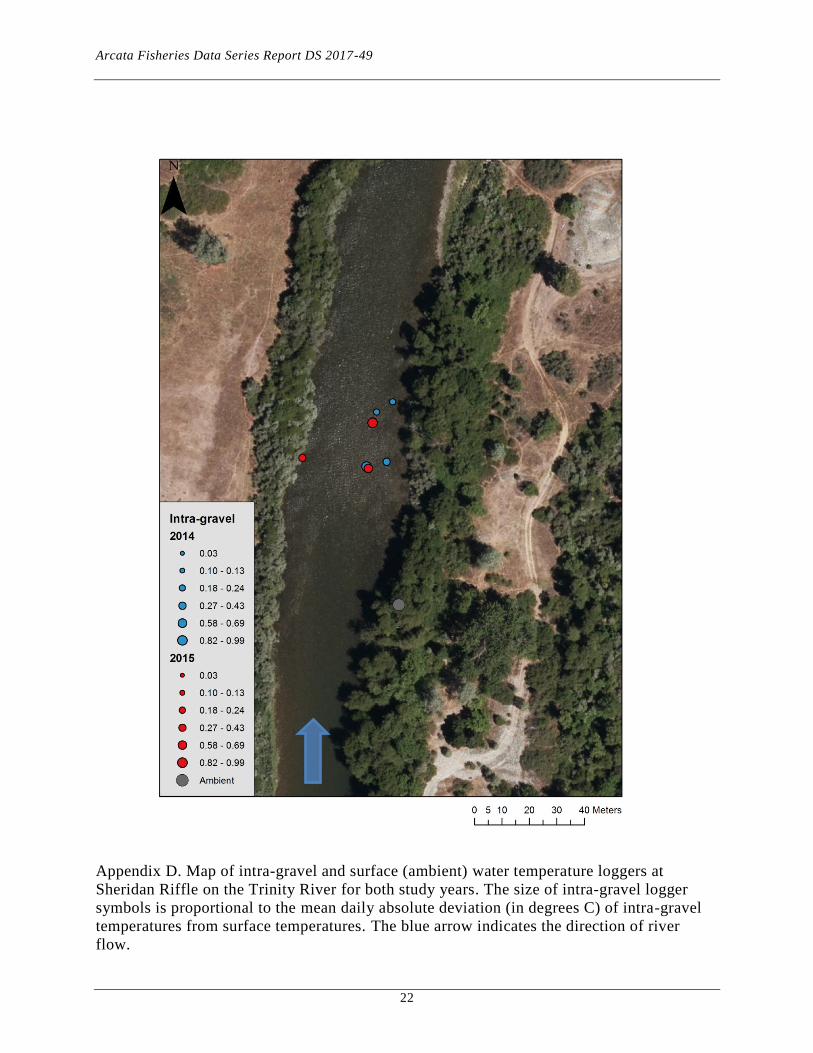
Appendix D. Map of intra-gravel and surface (ambient) water temperature loggers at
Sheridan Riffle on the Trinity River for both study years. The size of intra-gravel logger
symbols is proportional to the mean daily absolute deviation (in degrees C) of intra-gravel
temperatures from surface temperatures. The blue arrow indicates the direction of river
flow.

Arcata Fisheries Data Series Report DS 2017-49
23
Appendix E. Map of intra-gravel and surface (ambient) water temperature loggers at Big
Bar on the Trinity River for the 2015-2016 study. The size of intra-gravel logger symbols is
proportional to the mean daily absolute deviation (in degrees C) of intra-gravel temperatures
from surface temperatures. The blue arrow indicates the direction of river flow.