U.S. Economic Outlook€¦ · BBVA Research –U.S. Economic Outlook February 2019 / 10 Labor...
33
BBVA Research – U.S. Economic Outlook February 2019 / 1 U.S. Economic Outlook February 2019
Transcript of U.S. Economic Outlook€¦ · BBVA Research –U.S. Economic Outlook February 2019 / 10 Labor...

BBVA Research – U.S. Economic Outlook February 2019 / 1
U.S.
Economic OutlookFebruary 2019

GDP growth to slow to 2.5% in 2019, and 2.0% in 2020
Risk of recession remains elevated
Fed to delay raising rates until 4Q19; operational framework and
balance sheet strategy adjusted
Labor market conditions remain auspicious
Core inflation to remain stable, modest rebound in energy prices to lift
headline
10-year Treasury to follow shallower path
Oil prices converging with long-term equilibrium around $60/b
Economic Outlook

BBVA Research – U.S. Economic Outlook February 2019 / 3
Economic activity
Real-Time Economic Momentum Heat Map
Source BBVA ResearchBelow Average Above Average
Improving manufacturing
sentiment on less negative views
on domestic demand and thawing
trade tensions
Small business optimism
continues declining on concerns
about future economic growth
Home prices appreciation strong
despite weaker demand side
conditions
Consumer confidence is lowest
since 2017
Steady productivity growth amidst
strong labor force inflows and
modest wage increases
3-months
ago
2-months
ago
1-month
agoCurrent
ISM Manufacturing
Small Business Optimism
Industrial Production
IP-Manufacturing
IP-Mining
IP- Nonenergy High-Tech
Capital Goods ex Aircraft
Private Construction
Building Permits
Core Logic Home Prices
Consumer Confidence
Private Nonfarm Payrolls
Prime-Age Participation
Marginally Attached (PA)
Average Hourly Earnings
Real Disposable Income
Personal Savings Rate
Productivity

BBVA Research – U.S. Economic Outlook February 2019 / 4
Industrial Production(Year-over-year %)
Retail Sales(Year-over-year %)
Economic trends: Industrial production moderates while
retail sales plummet in December
Source: BBVA Research, FRB & BEA
-6%
-4%
-2%
0%
2%
4%
6%
8%
2010 2011 2012 2013 2014 2015 2016 2017 2018
Oil & Gas High-Tech Motor Vechicles
Consumer Gds Biz Equip Headline (lhs)
0%
1%
2%
3%
4%
5%
6%
7%
8%
9%
20
10
20
11
20
12
20
13
20
14
20
15
20
16
20
17
20
18
Autos Health & P. Care Gas
Clothing Nonstore Food Servc
Headline (lhs)

BBVA Research – U.S. Economic Outlook February 2019 / 5
Economic trends: FX and slower global growth weigh
on exports
Real Exchange Rate and Exports(Year-over-year %)
Real Exports(Contribution to year-over-year %)
Source: BBVA Research, FRB & Census
-6
-4
-2
0
2
4
6
8
10
No
v-2
018
Sep-2
018
Jul-2
018
Ma
y-2
018
Ma
r-2
018
Ja
n-2
01
8
No
v-2
017
Sep-2
017
Jul-2
017
Ma
y-2
017
Ma
r-2
017
Jan-2
017
No
v-2
016
Sep-2
016
Jul-2
016
Ma
y-2
016
Ma
r-2
016
Jan-2
016
No
v-2
015
Sep-2
015
Jul-2
015
Ma
y-2
015
Consumer Goods ex Food Food & Bev.
Industrial Supplies Autos
Other Cap Goods ex Autos
-10%
-5%
0%
5%
10%
15%
Ma
y-1
5
Aug-1
5
No
v-1
5
Feb
-16
Ma
y-1
6
Aug-1
6
No
v-1
6
Feb
-17
Ma
y-1
7
Aug-1
7
No
v-1
7
Feb
-18
Ma
y-1
8
Aug-1
8
No
v-1
8
Real Trade Weighted FX Real Exports

BBVA Research – U.S. Economic Outlook February 2019 / 6
Economic trends: Modest impact from government shutdown in 1Q19.
Recession probability 16% in next 12-months, 65% in 24 months
Real GDP(QoQ SAAR, %)
Probability of Recession in 12 Months(%)
Source: BBVA Research, and ATL & NY Fed
0
10
20
30
40
50
60
70
80
90
100
83 86 88 91 94 97 00 03 06 09 12 15 18
12-months ahead 24-months ahead
0.00%
0.50%
1.00%
1.50%
2.00%
2.50%
3.00%
3.50%
4.00%
4.50%
Q1-1
8
Q2-1
8
Q3-1
8
Atl F
ed
NY
Fed
20
19
20
19-2
021
Forecast4Q18
Baseline

BBVA Research – U.S. Economic Outlook February 2019 / 7
Consumer credit cycle: Consumer fundamentals remain
strong, but leverage increasing in rising rate environment
Personal Interest Expense
Year-over-year %
New 90+ Day Consumer Delinquencies Rates
%
Personal Interest Expense to Disp. Income
Ratio, %
Senior Loan Officers Lending Standards
+ tightening / - loosening
Source: BBVA Research, FRB, NY Fed & BEA
-20.0
-15.0
-10.0
-5.0
0.0
5.0
10.0
15.0
20.0
25.0
30.0
1961 1966 1971 1976 1981 1986 1991 1996 2001 2006 2011 2016
1.5
1.7
1.9
2.1
2.3
2.5
2.7
2.9
3.1
Ma
r-6
1
Oct-
63
Ma
y-6
6
De
c-6
8
Jul-7
1
Feb
-74
Sep-7
6
Apr-
79
No
v-8
1
Jun-8
4
Jan-8
7
Aug-8
9
Ma
r-9
2
Oct-
94
Ma
y-9
7
De
c-9
9
Jul-0
2
Feb
-05
Sep-0
7
Apr-
10
No
v-1
2
Jun-1
5
Jan-1
8
0
2
4
6
8
10
99 01 03 05 07 09 11 13 15 17
Mortgage HELOC Auto CC
Student Other Total
-20.0
-15.0
-10.0
-5.0
0.0
5.0
10.0
15.0
2012 2013 2014 2015 2016 2017 2018
Credit card Autos Consumer excl. credit cards

Labor Market
In January, nonfarm payroll employment grew 304,000
up from 222,000 in December
The unemployment rate (UR) increased to 4.0%, as the government shutdown
pushed a large number of workers out of the labor force or caused them to be
reported as unemployed
Major industry gains: leisure and hospitality (74K), construction (52K), health
care (42K), and transportation and warehousing (27K)
The labor force participation rate and employment-to-population increased 10bp
to 63.2% and 60.7%, respectively
We expect the UR to reach its low point in this business cycle in 3Q19 (3.6%),
and job growth to continue to decelerate

BBVA Research – U.S. Economic Outlook February 2019 / 9
Labor market: Strong job growth to start 2019
Nonfarm Payrolls(Monthly Change, K)
Industry Employment (Annualized % change)
Source: BBVA Research & BLS
-1000
-800
-600
-400
-200
0
200
400
600
800
20
00
20
02
20
04
20
06
20
08
20
10
20
12
20
14
20
16
20
18
Actual Forecast
-5 0 5 10 15
Retail Trade
Federal Government
Information Services
Local Government
State Government
Other Services
Wholesale Trade
Financial Activities
Manufacturing
Education & Health Services
Leisure & Hospitality
Professional & Business Services
Transportation & Warehousing
Construction
Mining
Monthly Change Year-over-year

BBVA Research – U.S. Economic Outlook February 2019 / 10
Labor market: Wage pressures rising while hours
worked holds steady
Average Weekly Hours(number & 5mcma)
Average Hourly Earnings(YoY% & 5mcma)
Source: BBVA Research & BLS
Prime Age Labor Force Participation(%)
Prime Age Employment-to-Population(%)
33.233.433.633.834.034.234.434.634.8
Dec-0
7
Jul-
08
Fe
b-0
9
Se
p-0
9
Ap
r-10
Nov-1
0
Jun
-11
Jan
-12
Au
g-1
2
Ma
r-1
3
Oct-
13
Ma
y-1
4
De
c-1
4
Jul-
15
Fe
b-1
6
Se
p-1
6
Ap
r-17
Nov-1
7
Jun
-18
Jan
-19 0.0%
0.5%
1.0%
1.5%
2.0%
2.5%
3.0%
3.5%
4.0%
Dec-0
7
Jul-
08
Fe
b-0
9
Se
p-0
9
Ap
r-10
Nov-1
0
Jun
-11
Jan
-12
Au
g-1
2
Ma
r-1
3
Oct-
13
Ma
y-1
4
Dec-1
4
Jul-
15
Fe
b-1
6
Se
p-1
6
Ap
r-17
Nov-1
7
Jun
-18
Jan
-19
79.079.580.080.581.081.582.082.583.083.5
Dec-0
8
Jun
-09
Dec-0
9
Jun
-10
Dec-1
0
Jun
-11
Dec-1
1
Jun
-12
Dec-1
2
Jun
-13
Dec-1
3
Jun
-14
Dec-1
4
Jun
-15
Dec-1
5
Jun
-16
Dec-1
6
Jun
-17
Dec-1
7
Jun
-18
Dec-1
8
Pre-Crisis Avg.
72.073.074.075.076.077.078.079.080.081.0
Dec-0
8
Jun
-09
Dec-0
9
Jun
-10
Dec-1
0
Jun
-11
Dec-1
1
Jun
-12
Dec-1
2
Jun
-13
Dec-1
3
Jun
-14
Dec-1
4
Jun
-15
Dec-1
5
Jun
-16
Dec-1
6
Jun
-17
Dec-1
7
Jun
-18
Dec-1
8
Pre-Crisis Avg.
BBVA Research – U.S. Economic Outlook February 2019 / 11
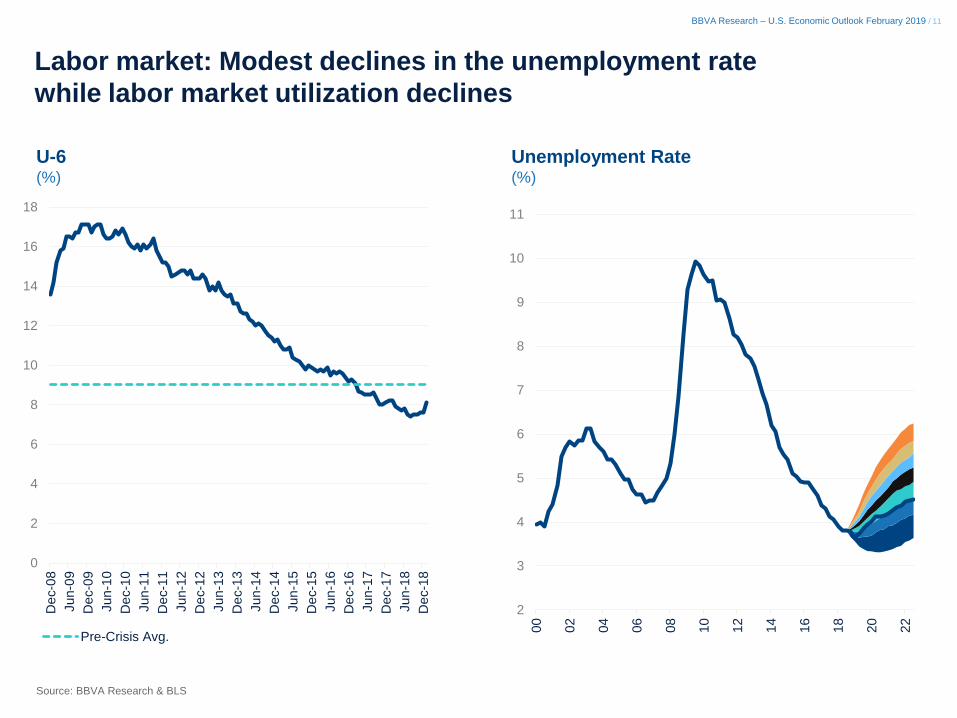
Labor market: Modest declines in the unemployment rate
while labor market utilization declines
U-6(%)
Unemployment Rate(%)
Source: BBVA Research & BLS
2
3
4
5
6
7
8
9
10
11
00
02
04
06
08
10
12
14
16
18
20
22
0
2
4
6
8
10
12
14
16
18
De
c-0
8
Jun-0
9
De
c-0
9
Ju
n-1
0
De
c-1
0
Jun-1
1
De
c-1
1
Jun-1
2
De
c-1
2
Jun-1
3
De
c-1
3
Jun-1
4
De
c-1
4
Jun-1
5
De
c-1
5
Jun-1
6
De
c-1
6
Jun-1
7
De
c-1
7
Jun-1
8
De
c-1
8
Pre-Crisis Avg.

Inflation
Headline consumer price index (CPI) was unchanged in
January, as declines in energy prices offset increases
in food prices and core inflation
On a year-over-year basis, headline CPI decelerated to 1.5% while core
remained stable at 2.1%
Recovery in oil prices should limit pass-through to energy prices going
forward
The probability of entering high-inflation regime is nonexistent; deflation risks
are also low
Implied 5-year and 10-year inflation expectations have edged up with energy
prices rising and demand-side fears fading
Pass-through from low energy prices to bring headline CPI below 2% for
year; core CPI to remain close 2.2%

BBVA Research – U.S. Economic Outlook February 2019 / 13
Inflation: Although core prices remains stable,
headline dropping due to declines in energy prices
Consumer Price Inflation(12m change)
Core Inflation Measures(12m change)
Source: BBVA Research, BLS & BEA
0.0%
0.5%
1.0%
1.5%
2.0%
2.5%
3.0%
3.5%
4.0%
Oct-
00
Sep-0
1
Aug-0
2
Jul-0
3
Jun-0
4
Ma
y-0
5
Apr-
06
Ma
r-0
7
Feb
-08
Jan-0
9
De
c-0
9
No
v-1
0
Oct-
11
Sep-1
2
Aug-1
3
Jul-1
4
Jun-1
5
Ma
y-1
6
Apr-
17
Ma
r-1
8
Core CPI Core PCE Weighted Median
-6%
-5%
-4%
-3%
-2%
-1%
0%
1%
2%
3%
4%
0 10 20 30 40 50 60 70 80 90 100
Relative Importance
Comm. ex
Food/
Energy
Food
Rent
Energy
Med
Services
Edu &
Comm.
Services
Trans.
Serv.
Other
ServicesOER

BBVA Research – U.S. Economic Outlook February 2019 / 14
Inflation: Probability of high inflation regime
extremely low
Core PCE Price Index & Inflation RegimesMonth-over-month %
Inflation Regime Change Probability%
Source: BBVA Research & BLS
0.00
0.10
0.20
0.30
0.40
0.50
0.60
0.70
0.80
0.90
1.00
Jan-7
0
Jul-7
2
Jan-7
5
Jul-7
7
Jan-8
0
Jul-8
2
Jan-8
5
Jul-8
7
Jan-9
0
Jul-9
2
Jan-9
5
Jul-9
7
Jan-0
0
Jul-0
2
Jan-0
5
Jul-0
7
Jan-1
0
Jul-1
2
Jan-1
5
Jul-1
7
-0.2
0
0.2
0.4
0.6
0.8
1
70 74 78 82 86 90 94 98 02 06 10 14 18
Core PCE Low Inflaiton Regime
High Inflaiton Regime

BBVA Research – U.S. Economic Outlook February 2019 / 15
Inflation: Baseline for modest undershoot in 2019
Inflation Expectations(%)
Headline & Core CPI(Year-over-year %)
Source: BBVA Research & Haver Analytics
0.0%
0.5%
1.0%
1.5%
2.0%
2.5%
3.0%
3.5%
10 11 12 13 14 15 16 17 18
5Y Implicit 5Y Forward
-2
-1
0
1
2
3
4
5
6
Ma
r-0
0
Ma
y-0
1
Jul-0
2
Sep-0
3
No
v-0
4
Jan-0
6
Ma
r-0
7
Ma
y-0
8
Jul-0
9
Sep-1
0
No
v-1
1
Jan-1
3
Ma
r-1
4
Ma
y-1
5
Jul-1
6
Sep-1
7
No
v-1
8
Jan-2
0
Ma
r-2
1
Ma
y-2
2
Core Headline

The FOMC left the target range of the Fed Funds rate
unchanged at their January 29-30th meeting
FOMC shifting tone saying, “[i]n light of global economic and financial
developments and muted inflation pressures, the Committee will be patient”
The FOMC has not reached a consensus on what conditions would be needed
to continuing raising rates, but several members felt higher inflation or a more
benign risk outlook would be sufficient for the Fed to raise later this year
Terminal level of the balance sheet will be significantly higher (1-1.5Tr) than
previously estimated and the normalization cycle will end sooner (EOY)
With conditions similar to 2016—elevated uncertainty, financial tensions and
weaker growth fundamentals— and with actual and expected inflation likely to
undershoot the Fed’s target in the 1H19, we believe that this means the Fed will
wait until the 4Q19 before raising rates again.
Monetary Policy: Federal Reserve

BBVA Research – U.S. Economic Outlook February 2019 / 17
Fed: Patience is name of the game; rate increases on hold until 4Q19
BBVA & Dealers Projections of Fed Funds(%, Effective)
FOMC Projections of Fed Funds(Year-over-year %, Mid-point)
Source: BBVA Research & FRB
1
1.5
2
2.5
3
3.5
4
2018 2019 2020 2021 L-Term
Sep-18 Current
0
1
2
3
4
5
6
BBVA-Baseline Median 75th Percentile
25th Percentile BBVA-Upside BBVA-Downside

BBVA Research – U.S. Economic Outlook February 2019 / 18
Monetary policy: Markets discounting prolonged pause,
possible rate cut in 2020
Fed Funds Implied Probability(Number of rate increases through 2019, %)
Fed Funds Futures & BBVA Baseline(%)
Source: BBVA Research & Bloomberg
0
10
20
30
40
50
60
70
80
90
100
<2.25% 2.25-2.5 2.5-2.75 2.75-3.0 3.0+
Cut Zero One Two Three
Last 1M Ago 2M Ago
0.5
0.75
1
1.25
1.5
1.75
2
2.25
2.5
2.75
3
3.25
Oct-
16
Jan-1
7
Apr-
17
Jul-1
7
Oct-
17
Jan-1
8
Apr-
18
Jul-1
8
Oct-
18
Jan-1
9
Apr-
19
Jul-1
9
Oct-
19
Jan-2
0
Apr-
20
Jul-2
0
Oct-
20
FFR + BBVA Forecast 8/8/2018
10/3/2018 12/26/2018
2/20/2019

BBVA Research – U.S. Economic Outlook February 2019 / 19
Monetary Policy: New balance sheet strategy to be unveiled
shortly, larger terminal level and shorter wind down
Fed Funds & Repo Rates(%)
Balance Sheet Attrition(US$bn, Cumulative)
Source: BBVA Research & FRB
0.00
0.25
0.50
0.75
1.00
1.25
1.50
1.75
2.00
2.25
2.50
2.75
3.00
3.25
3.50
May-15 Jan-16 Sep-16 May-17 Jan-18 Sep-18
Upper Bound Lower Bound
Effective SOFR
0
50
100
150
200
250
300
350
400
U.S Govt Securities MBS

10-yr Treasury at 2.69%, 70bp below 4Q18 peak,
2-yr Treasury 50bp below peak at 2.53%
Dramatic shift in Fed’s balance sheet strategy and the U-turn on their
guidance for policy rates suggests further compression in the term
premium in medium-term and shift in the level
Rising global uncertainty and dovish monetary policy abroad could add to
the compression on the term premium, meaning a flatter-for-longer
scenario for the yield curve
Ample domestic demand for U.S. government debt from domestic sectors
contain upside pressures on yields
10-yr Treasury to reach 2.9% by end of 2019 and 3.1% by year end 2020
Interest Rates

BBVA Research – U.S. Economic Outlook February 2019 / 21
Interest rates: Drop in inflation expectations and negative
term premium push 10-year Treasury below 2.7%
10-Year Treasury Yield Decomposition(%)
Source: BBVA Research, ACM & Haver Analytics
-1.0
-0.5
0.0
0.5
1.0
1.5
2.0
2.5
3.0
3.5
12 13 14 15 16 17 18
Real Rate Term Premium Inflation Expectations Yield

BBVA Research – U.S. Economic Outlook February 2019 / 22
Interest rates: Nontrivial downward revisions to 10-year,
risks now more balanced
10-Year Treasury Yield(%)
Source: BBVA Research, ACM & Haver Analytics
0
1
2
3
4
5
6
7
Jan-0
7
Ma
y-0
7
Sep-0
7
Jan-0
8
Ma
y-0
8
Sep-0
8
Jan-0
9
Ma
y-0
9
Sep-0
9
Jan-1
0
Ma
y-1
0
Sep-1
0
Jan-1
1
Ma
y-1
1
Sep-1
1
Jan-1
2
Ma
y-1
2
Sep-1
2
Jan-1
3
Ma
y-1
3
Sep-1
3
Jan-1
4
Ma
y-1
4
Sep-1
4
Jan-1
5
Ma
y-1
5
Sep-1
5
Jan-1
6
Ma
y-1
6
Sep-1
6
Jan-1
7
Ma
y-1
7
Sep-1
7
Jan-1
8
Ma
y-1
8
Sep-1
8
Jan-1
9
Ma
y-1
9
Sep-1
9
Jan-2
0
Ma
y-2
0
Sep-2
0
Jan-2
1
Ma
y-2
1
Sep-2
1
Jan-2
2
Ma
y-2
2
Sep-2
2
Historic Baseline upside Downside Risk NABE (EOP)
SPF(EOP) Blue Chip(Yr. Avg) OMB (Yr.Avg) CBO(Yr. Avg)

BBVA Research – U.S. Economic Outlook February 2019 / 23
Interest rates: Yield curve slope to remain low, but positive
0.5
1.0
1.5
2.0
2.5
3.0
3.5
4.0
4.5
1Y 2Y 3Y 5Y 7Y 10Y 20Y 30Y
10-Year Average 2016 2017
2018 2019 (f) 2020 (f)
Yield Curve Slope(Bp)
Yield Curve(%, eop)
Source: BBVA Research
0.0
0.5
1.0
1.5
2.0
2.5
Jan-1
5
Jul-1
5
Jan-1
6
Jul-1
6
Jan-1
7
Jul-1
7
Jan-1
8
Jul-1
8
Jan-1
9
Jul-1
9
Jan-2
0
Jul-2
0
Jan-2
1
Jul-2
1
Jan-2
2
Jul-2
2
30Yr-10yr 10Yr-1Yr

OPEC+ cuts, a pause in U.S. interest rate increases, and
signals of a trade deal between U.S. and China resulted
in higher prices
Going forward, the expiration of import waivers of Iranian oil could add an extra
boost
U.S. production is expected to remain robust through the year, more
transportation infrastructure will facilitate exports
Demand is projected to slow down as global economic growth weakens
We maintain our forecasts of convergence to long-term equilibrium around $60/b
Elevated uncertainty around long-term equilibrium: CAPEX, protectionism,
transportation infrastructure, alternative energy sources, EM convergence, EVs,
climate change, efficiency and technology
Oil Prices

BBVA Research – U.S. Economic Outlook February 2019 / 25
Improving sentiment on the global economy, plus OPEC+ commitment
to adjust supply led to higher prices
Source: BBVA Research and Haver Analytics
Crude oil prices August 2018 to February 2019($ per barrel)
40
45
50
55
60
65
70
75
80
85
90
Sep Oct Nov Dec Jan Feb
WTI Brent
September 23
OPEC and allies
agree not to further
increase oil
production
September 25
India may cut imports of
Iranian oil to zero in
November
October 8-12
Stock market chaos.
Concerns on weaker
demand emerge
November 2
U.S. issue waivers to
Iran’s oil buyers
November 6
EIA expects U.S. crude oil
production to surpass 12
million b/d by 2019
November 12
OPEC lowers oil
demand growth
forecasts and
anticipates
oversupply
December 6
OPEC hints a lower than
expected cut
December 7
OPEC+ decide to cut
output by 1.2 Mb/d
Jan 4-19
U.S–China trade
talks, expectation of
OPEC+ cuts
Jan 20
China post slowest
economic growth
since 1990
Feb 13
Fears of market
disruptions from
political crisis in
Venezuela
Feb 18
U.S. and China
signal a deal or
extend talks to end
their trade war

BBVA Research – U.S. Economic Outlook February 2019 / 26
Demand supported by China, India and the U.S.
Source: BBVA Research and Haver Analytics
Oil product demand: total world (Thousand barrels per day, yoy change)
Oil product demand (Million barrels per day)
43
44
45
46
47
48
49
50
30
35
40
45
50
55
Sep-0
8
Ma
r-0
9
Sep-0
9
Ma
r-1
0
Sep-1
0
Ma
r-1
1
Sep-1
1
Ma
r-1
2
Sep-1
2
Ma
r-1
3
Sep-1
3
Ma
r-1
4
Sep-1
4
Ma
r-1
5
Sep-1
5
Ma
r-1
6
Sep-1
6
Ma
r-1
7
Sep-1
7
Ma
r-1
8
Sep-1
8
non-OECD OECD (rhs)
60
70
80
90
100
110
120
130
140
3.4
3.5
3.6
3.7
3.8
3.9
4.0
4.1
4.2
4.3
4.4
2014 2015 2016 2017 2018
Milla
res
Production (lhs) Imports (rhs)
China: imports and production of crude oil (Million metric tons SA, and million b/d)
Sharp increase induced
by Iranian sanctions and
expiration of small
refineries import quotas
-500
0
500
1000
1500
2000
2500
-500
0
500
1000
1500
2000
2500
3000
1Q
14
2Q
14
3Q
14
4Q
14
1Q
15
2Q
15
3Q
15
4Q
15
1Q
16
2Q
16
3Q
16
4Q
16
1Q
17
2Q
17
3Q
17
4Q
17
1Q
18
2Q
18
3Q
18
4Q
18
Western Europe United States China
India Total World (rhs)

BBVA Research – U.S. Economic Outlook February 2019 / 27
OPEC+ supply adjustments and the expiration of waivers to importers
of Iranian oil will tight supply thought 1H19
Source: BBVA Research, Haver Analytics, and Bloomberg
Crude oil production(Million barrels per day)
11.5
11.2
10.8
10.4
8.5
9.0
9.5
10.0
10.5
11.0
11.5
12.0
Ma
r-1
7
Ma
y-1
7
Jul-1
7
Sep-1
7
No
v-1
7
Jan-1
8
Ma
r-1
8
Ma
y-1
8
Jul-1
8
Sep-1
8
No
v-1
8
Jan-1
9
Ma
r-1
9
Ma
y-1
9
Wellhead Production: Non OPEC: Russia (Ths b/d)
Wellhead Production: OPEC: Saudi Arabia (Ths b/d)
Iran: exports of crude oil(million barrels per day)
0.0
0.5
1.0
1.5
2.0
2.5
2015 2016 2017 2018
Other China India Turkey South Korea Japan Europe

BBVA Research – U.S. Economic Outlook February 2019 / 28
U.S. production to remain solid. No signs of domestic oversupply
Source: BBVA Research and Haver Analytics
WTI Midland-Cushing differential ($/b)
U.S. Estimated crude oil production (Thousand barrels/day)
U.S. Crude oil inventories (Excluding SPR, million barrels)
U.S. Real private investment in E&P (yoy $billion )
-150
-100
-50
0
50
100
150
0
20
40
60
80
100
120
140
20
07
20
08
20
09
20
10
20
11
20
12
20
13
20
14
20
15
20
16
20
17
20
18
Milla
res
WTI (lhs) Investment (rhs)
-20.0
-15.0
-10.0
-5.0
0.0
5.0
Jan-1
7
Ma
r-1
7
Ma
y-1
7
Jul-1
7
Sep-1
7
No
v-1
7
Jan-1
8
Ma
r-1
8
Ma
y-1
8
Jul-1
8
Sep-1
8
No
v-1
8
Jan-1
90
100
200
300
400
500
600
Jan Feb Mar Apr May Jun Jul Aug Sep Oct Nov Dec
2018 Average 5-yr high 5-yr low
6
7
8
9
10
11
12
13
2015 2016 2017 2018 2019

BBVA Research – U.S. Economic Outlook February 2019 / 29
WTI prices could move between higher $50s and lower $60s in 2019, but may
decelerate further in 2020. We maintain our forecasts of convergence to long-
term equilibrium around $60/b
Source: BBVA Research and Bloomberg
WTI prices forecast ($ per barrel)WTI Futures
($ per barrel)
40
45
50
55
60
65
70
1 3 5 7 9 11131517192123252729313335373941434547
$U
SD
/bb
l
Months Ahead
02/21/19 01/22/19 3 months ago 6 months ago
65.0
56.2
52.7
58.0 57.7
48
53
58
63
68
73
78
2018 2019 2020 2021 2022
BBVA Research
Bloomberg Survey (as of Feb 22)
EIA (STEO, Feb 12.)
BBVA ResearchBloomberg Survey
(as of Feb 22) EIA (STEO, Feb 12.)
2017 50.8 50.9 50.9
2018 65.0 65.0 65.0
2019 56.2 60.0 54.8
2020 52.7 63.0 58.0
2021 58.0 64.8
2022 57.7 64.5

BBVA Research – U.S. Economic Outlook February 2019 / 30
Macroeconomic Outlook
Source: BBVA Research
*Forecasts subject to change
2011 2012 2013 2014 2015 2016 2017 2018 (e) 2019 (f) 2020 (f) 2021 (f) 2022 (f)
Real GDP (% SAAR) 1.6 2.2 1.8 2.5 2.9 1.6 2.2 2.9 2.5 2.0 1.9 1.8
Real GDP (Contribution, pp)
PCE 1.3 1.0 1.0 2.0 2.5 1.9 1.8 1.9 1.9 1.3 1.3 1.3
Gross Investment 0.9 1.6 1.1 0.9 0.8 -0.2 0.8 1.0 1.0 0.9 0.8 0.8
Non Residential 1.0 1.2 0.5 0.9 0.3 0.1 0.7 1.0 0.8 0.8 0.7 0.8
Residential 0.0 0.3 0.3 0.1 0.3 0.2 0.1 0.0 0.0 0.0 0.0 0.0
Exports 0.9 0.5 0.5 0.6 0.1 0.0 0.4 0.6 0.5 0.6 0.7 0.7
Imports -0.9 -0.5 -0.3 -0.9 -1.0 -0.3 -0.8 -0.9 -1.0 -0.9 -0.9 -1.0
Government -0.7 -0.4 -0.5 -0.2 0.3 0.3 0.0 0.3 0.3 0.1 0.0 0.0
Unemployment Rate (%, average) 8.9 8.1 7.4 6.2 5.3 4.9 4.4 3.9 3.8 4.1 4.2 4.5
Avg. Monthly Nonfarm Payroll (K) 173 181 192 251 227 193 179 223 188 159 135 121
CPI (YoY %) 3.1 2.1 1.5 1.6 0.1 1.3 2.1 2.4 1.7 2.2 2.0 2.1
Core CPI (YoY %) 1.7 2.1 1.8 1.8 1.8 2.2 1.8 2.1 2.2 2.0 2.1 2.0
Fiscal Balance (% GDP, FY) -8.4 -6.8 -4.1 -2.8 -2.4 -3.2 -3.5 -3.9 -4.2 -4.1 -4.2 -4.7
Current Account (bop, % GDP) -2.9 -2.6 -2.1 -2.1 -2.2 -2.3 -2.3 -2.4 -2.8 -2.9 -3.0 -3.1
Fed Target Rate (%, eop) 0.25 0.25 0.25 0.25 0.50 0.75 1.50 2.50 2.75 2.75 2.75 2.75
Core Logic National HPI (YoY %) -2.9 4.0 9.7 6.8 5.3 5.5 5.9 5.8 4.9 4.2 3.9 3.6
10-Yr Treasury (% Yield, eop) 1.98 1.72 2.90 2.21 2.24 2.49 2.40 2.83 2.87 3.09 3.23 3.37
West Texas Intermediate
Oil Prices (dpb, average)94.9 94.1 97.9 93.3 48.7 43.2 50.9 65.0 56.3 52.7 58.0 57.7

BBVA Research – U.S. Economic Outlook February 2019 / 31
Economic Scenarios Probability (%) Current Previous
Upside 5 5
Baseline 55 55
Downside 40 40
Subject to revision without notice
Macro Scenarios
2014 2015 2016 2017 2018 2019 2020 2021 2022 2023
GDP 2.5 2.9 1.6 2.2 2.9 2.5 2.0 1.9 1.8 1.8
Upside 3.0 3.0 3.2 3.1 2.7 2.7
Downside 2.8 0.7 -0.9 1.9 2.1 2.3
UR 6.2 5.3 4.9 4.4 3.9 3.8 4.1 4.2 4.5 4.5
Upside 3.1 2.9 2.9 3.0 3.0
Downside 4.3 6.2 6.6 5.7 5.0
CPI 1.6 0.1 1.3 2.1 2.4 1.7 2.2 2.0 2.1 2.0
Upside 1.6 3.8 3.5 3.8 3.8
Downside 0.7 1.1 1.1 1.3 1.4
Fed [eop] 0.25 0.50 0.75 1.50 2.50 2.75 2.75 2.75 2.75 2.75
Upside 3.50 5.00 5.00 5.00 5.00
Downside 1.50 0.25 0.25 0.25 0.25
10-Yr [eop] 2.21 2.24 2.49 2.4 2.83 2.87 3.09 3.23 3.37 3.46
Upside 3.90 5.10 5.90 5.90 5.90
Downside 2.40 1.60 1.90 2.10 2.10

BBVA Research – U.S. Economic Outlook February 2019 / 32
DISCLAIMER
This document was prepared by Banco Bilbao Vizcaya Argentaria’s (BBVA) BBVA Research U.S. on behalf of itself and its
affiliated companies (each BBVA Group Company) for distribution in the United States and the rest of the world and is
provided for information purposes only. Within the US, BBVA operates primarily through its subsidiary Compass Bank.
The information, opinions, estimates and forecasts contained herein refer to the specific date and are subject to changes
without notice due to market fluctuations. The information, opinions, estimates and forecasts contained in this document
have been gathered or obtained from public sources, believed to be correct by the Company concerning their accuracy,
completeness, and/or correctness. This document is not an offer to sell or a solicitation to acquire or dispose of an interest in
securities.

BBVA Research – U.S. Economic Outlook February 2019 / 33
U.S.
Economic OutlookFebruary 2019