
U.S. Department of Energy-Funded Performance Validation … · • Distribution Centers/Warehouses...
18
NREL is a national laboratory of the U.S. Department of Energy, Office of Energy Efficiency and Renewable Energy, operated by the Alliance for Sustainable Energy, LLC. U.S. Department of Energy-Funded Performance Validation of Fuel Cell Material Handling Equipment UK Hydrogen and Fuel Cell Association Webinar Jennifer Kurtz, Sam Sprik, Todd Ramsden, Genevieve Saur, Chris Ainscough, Matt Post, Mike Peters November 27, 2013 NREL/PR-5400-60951
Transcript of U.S. Department of Energy-Funded Performance Validation … · • Distribution Centers/Warehouses...
NREL is a national laboratory of the U.S. Department of Energy, Office of Energy Efficiency and Renewable Energy, operated by the Alliance for Sustainable Energy, LLC.
U.S. Department of Energy-Funded Performance Validation of Fuel Cell Material Handling Equipment
UK Hydrogen and Fuel Cell Association Webinar
Jennifer Kurtz, Sam Sprik, Todd Ramsden, Genevieve Saur, Chris Ainscough, Matt Post, Mike Peters
November 27, 2013 NREL/PR-5400-60951
2
FCMHE Validation Overview
• U.S. DOE enabling early fuel cell markets • National Fuel Cell Technology Evaluation
Center objectives • FCMHE performance status

3 | Fuel Cell Technologies Office eere.energy.gov
Enabling Early Markets Deployments help catalyze market penetration and ensure continued technology
utilization growth while providing data and lessons learned.
Leveraging DOE Funds: Government as “catalyst” for market success of emerging technologies.
0
1,000
2,000
3,000
4,000
5,000
6,000
7,000
8,000
9,000
10,000
Cost ShareDeployments ~1,600
Additional Purchaseswithout DOE Funding
~9,000
Lift Trucks BU Power
Backup Power
Lift Trucks
DOE cost-shared deployments led to >5X additional purchases and orders.
~9,000 ADDITIONAL FUEL CELL LIFT TRUCKS AND BACKUP POWER UNITS PLANNED OR INSTALLED with NO DOE funding Examples of industry* sectors in DOE ARRA projects • Telecommunications (e.g., AT&T, PG&E, Sprint, etc.) • Distribution Centers/Warehouses (e.g., FedEx, Genco,
Sysco, Wegmans, Whole Foods, etc.)
*Provided as examples and not intended as endorsement
DOE FCTO Fall 2013 http://www1.eere.energy.gov/hydrogenandfuelcells/presentations.html

4 | Fuel Cell Technologies Office eere.energy.gov
The Case for Fuel Cell Forklifts Fuel cell forklifts offer several advantages compared to conventional fork lift
technology
Preliminary Analysis • Compared to conventional forklifts, fuel
cell forklifts have: • 1.5 X lower maintenance cost • 8 X lower refueling/recharging labor
cost • 2 X lower net present value of total
system cost
Preliminary Analysis: Comparison of PEM Fuel Cell- and Battery-Powered Forklifts
Time for Refueling/ Changing Batteries
4-8 min/day 45-60 min/day (for battery change-outs) 8 hours (for battery recharging & cooling)
Labor Cost of Refueling/Recharging
$1,100/year $8,750/year
NPV of Capital Costs $12,600 ($18,000 w/o incentives)
$14,000
NPV of O&M Costs (including fuel)
$52,000 $128,000
Published Fact Sheets & Case Studies
DOE FCTO Fall 2013 http://www1.eere.energy.gov/hydrogenandfuelcells/presentations.html

5
www.nrel.gov/hydrogen/proj_tech_validation.html
NFCTEC Analysis Approach
National Fuel Cell Technology Evaluation Center
NFCTEC
Analysis and reporting of real-world operation data
6
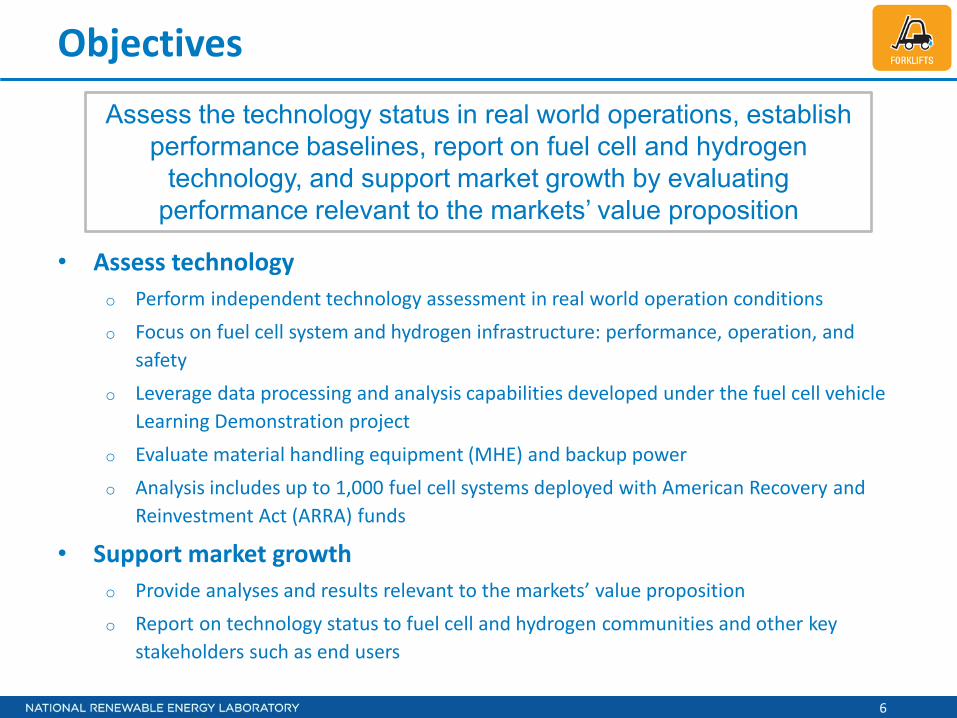
Objectives
• Assess technology o Perform independent technology assessment in real world operation conditions o Focus on fuel cell system and hydrogen infrastructure: performance, operation, and
safety o Leverage data processing and analysis capabilities developed under the fuel cell vehicle
Learning Demonstration project o Evaluate material handling equipment (MHE) and backup power o Analysis includes up to 1,000 fuel cell systems deployed with American Recovery and
Reinvestment Act (ARRA) funds
• Support market growth o Provide analyses and results relevant to the markets’ value proposition o Report on technology status to fuel cell and hydrogen communities and other key
stakeholders such as end users
Assess the technology status in real world operations, establish performance baselines, report on fuel cell and hydrogen
technology, and support market growth by evaluating performance relevant to the markets’ value proposition

7
74 MHE CDPs—Count and Category Deployment & Site
Overview (1, 40)
Fuel Cell Operation (2, 7, 8, 11, 15,
16, 17, 23, 24, 63) Fuel Cell Reliability (28, 29, 30, 31)
Fuel Cell Safety (26, 27, 53, 56, 57)
Infra. Safety (25, 41, 46, 51, 55)
Infra. Reliability (45, 48, 49, 50)
FC Maintenance (12, 13, 14, 43, 54, 61)
(1) Total cost represents the annualized cost of ownership of Class I, II, and III forklifts on a net present value basis, accounting for capital, operating, and maintenance costs of forklifts, power packs, and infrastructure (labor costs for maintenance and for charging or fueling are included, but labor costs of forklift material handling operations are excluded). Costs are calculated assuming that the material handling operations are ongoing, with equipment replacements made as necessary. Capital, operating, and maintenance costs are assumed toremain constant in real-dollar terms, and capital purchases are discounted using a discount rate representing the time value of money. Fuel cell system costs reflect the current fuel cell tax credit of $3,000/kW or 30% of purchase price. Analysis does not consider the potential productivity increases resulting from the constant power output of fuel cell systems, which may be significant. Costs of ownership of Class II forklifts are expected to be similar for Class I forklifts, though the cost of the lift itself is expected to be higher.
Costs are based on information provided by deployment host partners (end-users) based on a questionnaire developed by NREL, supplemented with data provided by project partners, and are reflective of the material handling operations of these deployments. Where appropriate, fuel cell deployment data were used in place of end-user questionnaire data; in particular, data from CDPs 1, 6, 8, 14, and 22 were used. Cost assessment will be further refined as additional data are available.
Total Cost of Ownership for Class I, II & III Forklifts1
Cost of Ownership (58, 59, 60,64)
Total Cost of Ownership Sensitivity Analysis1
(1) Total cost represents the annualized cost of ownership of Class I, II, and III forklifts on a net present value basis. Fuel cell system costs reflect the current fuel cell tax credit of $3,000/kW or 30% of purchase price. Costs are based on information provided by deployment host partners based on a questionnaire developed by NREL, supplemented with additional data provided by project partners, and are reflective of the material handling operations of these deployments. Where appropriate, fuel cell deployment data were used in place of end-user questionnaire data; in particular, data from CDPs 1, 6, 8, 14, and 22 were used.
Sensitivity analysis shows the ranges in annual per lift cost of ownership resulting from varying key parameters affecting battery and fuel cell forklift cost.
Fuel Cell Durability (32, 33, 34, 38, 39, 73)
< 10000 hours > 10000 hours 0%
10%
20%
30%
40%
50%
60%
70%
80%
90%
100%Fuel Cell Stacks Projected Hours to 10% Voltage Degradation
Projected Hours to 10% Voltage Degradation 1,3
FC S
tack
s [%
]
In ServiceNot In Service2
NREL cdp_mhe_97
Created: Apr-02-13 9:36 AM | Data Range: 2009Q1-2012Q4
1) Projection using field data, calculated at high stack current, from operation hour 0. Projected hours may differ from an OEM's end-of-life criterion and does not address "catastrophic" failure modes.2) Indicates stacks that are no longer accumulating hours either a) temporarily or b) have been retired for non- stack performance related issues or c) removed from DOE program.3) Projected hours limited based on demonstrated hours.
0 10 20 30 40 50 600
1
2
3
4
5
6
7
8
9
10
Amount Fueled in an Hour [kg]
Freq
uenc
y [%
of t
otal
]
Hydrogen Dispensed Per Hour - ARRA
NREL cdparra_mhe_69
Created: Apr-02-13 8:41 AM | Data Range: 2010Q1-2012Q4
Average: 4.8 kgs per hourMedian: 3.5 kgs per hourMax: 52.5 kgs per hour
Infra. Operation (3, 4, 5, 6, 9, 10, 21, 22, 35,
37, 42, 62, 65, 68, 69, 70, 71)
1 2 3 4 5 6 7 80
10
20
30
40
50
60
70
80
90
100
Station (Sorted By Increasing Max Daily Amount)
Cap
acity
Util
izat
ion
2 [%]
Station Capacity Utilization
Max Daily20 kg
Max Daily25 kg
Max Daily64 kg
Max Daily99 kg
Max Daily102 kg
Max Daily135 kg
Max Daily293 kg
Max Daily358 kg
42.9%
Average Daily Utilization1
Maximum Daily Utilization
NREL cdparra_mhe_71NREL cdparra_mhe_71
Created: Apr-02-13 10:48 AM | Data Range: 2009Q4-2012Q4
1Maximum quarterly utilization considers all days; average daily utilization considers only days when at least one filling occurred2100% represents maximum daily amount dispensed for each individual site
1 2 3 4 5 6 7 80
50
100
150
200
250
Station (Sorted By Increasing Max Daily Amount)
Fills
Per
Day
Station Usage
Maximum Daily Fills
Average Daily Fills1
NREL cdparra_mhe_70
Created: Apr-02-13 8:52 AM | Data Range: 2010Q1-2012Q4
1Average daily fills considers only days when at least one fill occurred
0 5 10 15 20 25 30 35 40 450
2
4
6
8
10
12
Number of Fuelings in an Hour
Freq
uenc
y [%
of t
otal
]
Number of Fuelings Per Hour - ARRA
NREL cdparra_mhe_68
Created: Apr-02-13 8:25 AM | Data Range: 2010Q1-2012Q4
Average: 7.3 per hourMedian: 5.0 per hourMax: 39.0 per hour
<0 0 2 4 6 8 10 12 14 16 18 200
5
10
15
20
25
30
Sim
ulta
neou
s Fi
lls
Back-to-Back Fills
36 % of fills are within 0-5 minutes of each other23 % of fills have more than 20 minutes between them228912 Total Fills
Time Between Fuelings* [min]
# of
Fue
lings
[% o
f tot
al]
Histogram of Time Between Fuelings
All Sites CombinedIndividual Sites
200 225 250 275 300 325 350 375 400 425 4500
1
2
3
4
5x 10⁴ Final Pressures for Fills with <5 Minutes in Between
# of
Fue
lings
Final Pressure [bar]
Previous FillNext Fill
NREL cdparra_mhe_65
Created: Apr-02-13 8:12 AM | Data Range: 2010Q1-2012Q4 *Time is from end of fill to start of next fill.
Infra. Maintenance (18, 19, 20, 44, 47, 52,
66, 67, 72,76,77)
0
50
100
150
200
250
AIR SYSTEM
CONTROL ELECTRONICS
DISPENSER
FITTINGS&PIPIN
G
HYDROGEN COMPRESSOR
VALVES
MTB
F (D
ays)
MTBF by Equipment Category: Infrastructure (Delivered H2 Only)
Median SiteLowest Site
NREL cdparra_mhe_72
Created: Apr-02-13 11:01 AM | Data Range: 2010Q1-2012Q4
Jan Feb Mar Apr May Jun Jul Aug Sep Oct Nov Dec0
20
40
60
80
100
120
140
160
Month
Cou
nt o
f Mai
nten
ance
Eve
nts
Infrastructure Maintenance by Month
UnscheduledScheduled
NREL cdp_mhe_67
Created: Apr-02-13 9:36 AM | Data Range: 2009Q1-2012Q4
8%
19%
23%
50%
Total Events = 1,0581
64% unscheduled
entiresystem 46
misc 124
multiplesystems 221
classifiedevents1 667
Event Count
8%
19%
17%
56%
Total Hours = 7,08062% unscheduled
hydrogen compressor
control electronics
dispenser
air system
NREL cdp_mhe_66
Created: Apr-02-13 9:35 AM | Data Range: 2009Q1-2012Q4
Delivered Hydrogen Infrastructure Maintenance By Equipment Type
MISC includes the following failure modes: seal, fuel system, safety,thermal management, storage, electrical, software, fittings&piping, valves,
sensors, other
0
10
20
30
40
50
60
70
80
90
100
Apr-201
0
Jul-2
010
Oct-20
10
Jan-20
11
Apr-201
1
Jul-2
011
Oct-20
11
Jan-20
12
Apr-201
2
Jul-2
012
Oct-20
12
Jan-20
13
Apr-201
3
% o
f Tot
al M
onth
ly M
aint
enan
ce L
abor
Hou
rs
Equipment Percentage of Repair Labor Hours Over Time*
HYDROGEN COMPRESSORCONTROL ELECTRONICSDISPENSERAIR SYSTEMNREL cdparra_mhe_77
Created: Sep-30-13 12:56 PM | Data Range: 2010Q10-2013Q2
*Calculated as a percentageof all maintenance each month; bars maynot total to 100% if other maintenancecategories were present.
0123456789
101112
AIR SYSTEM
CONTROL ELECTRONICS
DISPENSER
ELECTRICAL
ENTIRE SYSTEM
FITTINGS&PIPIN
G
FUEL SYSTEM
HYDROGEN COMPRESSOR
MULTIPLE SYSTEMS
OTHER
SAFETY
SENSORS
SOFTWARE
STORAGE
THERMAL MANAGEMENT
VALVES
Rep
air L
abor
Tim
e (H
ours
)
Equipment Category Repair Time: Infrastructure (Delivered H2 Only)
NREL cdparra_mhe_76
Created: Sep-28-13 10:08 AM | Data Range: 2010Q10-2013Q2
75% Percentile
Median
25% Percentile
Mean

8
MHE Operation Summary 2009 Q4–2013 Q2
Units in operation*
Hydrogen fills
Hydrogen dispensed in kg
Operation hours
Average operation hours between fills
Average fill amount in kg
Average fill time in minutes *One project has completed
Validation of MHE is based on real-world operation data from high-use facilities

9
Study of FC Voltage Degradation Against 10,000 Hours
< 10000 hours > 10000 hours 0%
10%
20%
30%
40%
50%
60%
70%
80%
90%
100%Fuel Cell Stacks Projected Hours to 10% Voltage Degradation
Projected Hours to 10% Voltage Degradation 1,3
FC S
tack
s [%
]
In ServiceNot In Service2
NREL cdp_mhe_97
Created: Sep-28-13 12:46 PM | Data Range: 2009Q1-2013Q2
1) Projection using field data, calculated at high stack current, from operation hour 0. Projected hours may differ from an OEM's end-of-life criterion and does not address "catastrophic" failure modes.2) Indicates stacks that are no longer accumulating hours either a) temporarily or b) have been retired for non- stack performance related issues or c) removed from DOE program.3) Projected hours limited based on demonstrated hours.
More than 50% of stacks have projected hours to 10% voltage degradation >10,000 hours

10
Published MHE Cost of Ownership Report
Key Findings • Cost advantages dependent on
deployment size and use (i.e., multi-shift operation per day)
• H2 fuel cell cost advantages in maintenance, warehouse infrastructure space, and refueling labor cost
• H2 fuel cell cost disadvantages in infrastructure and fuel cell cost and hydrogen cost
Report Sections • Inputs, assumptions, and results for
Class I/II and Class III • Sensitivity study • Intensive deployment scenario
Cost advantage per unit is ~$2,000/year for the average high-use facility with Class I and II fuel cell lift trucks analyzed by NREL

11
Study of Infrastructure Usage by Daily Fills
1 2 3 4 5 6 7 80
50
100
150
200
250
Station (Sorted By Increasing Max Daily Amount)
Fills
Per
Day
Station Usage
Maximum Daily Fills
Average Daily Fills1
NREL cdparra_mhe_70
Created: Sep-26-13 10:20 AM | Data Range: 2009Q4-2013Q2
1Average daily fills considers only days when at least one fill occurred
The maximum daily fill count for two sites was >200 fills. Those two sites average nearly 100 fills per day.

12
0 25 50 75 100 125 150 175 200 225 250 275 3000
1
2
3
4
5
6
7
8
9
10
Site MTBF1 (Days)
Cou
nt o
f Site
sSite MTBF (Calendar Days In Operation): Infrastructure
NREL cdp_mhe_48
Created: Sep-28-13 12:45 PM | Data Range: 2009Q1-2013Q21. Cumulative Mean Time Between Failure
Infrastructure Reliability Analysis
Infrastructure consistently delivering 250 and 350 bar fills even though the majority of the sites have a MTBF of 25 days or less
Compressor 51%
Control Electronics 20%
Dispenser 19%
Air System 10%
Delivered H2 Maintenance Count by Category 1,330 Maintenance Events
63% unscheduled

13
Equipment Percentage of Monthly Repair Labor Hours
0
10
20
30
40
50
60
70
80
90
100
Apr-201
0
Jul-2
010
Oct-20
10
Jan-20
11
Apr-201
1
Jul-2
011
Oct-20
11
Jan-20
12
Apr-201
2
Jul-2
012
Oct-20
12
Jan-20
13
Apr-201
3
% o
f Tot
al M
onth
ly M
aint
enan
ce L
abor
Hou
rs
Equipment Percentage of Repair Labor Hours Over Time*
HYDROGEN COMPRESSORCONTROL ELECTRONICSDISPENSERAIR SYSTEMNREL cdparra_mhe_77
Created: Sep-30-13 12:56 PM | Data Range: 2010Q10-2013Q2
*Calculated as a percentageof all maintenance each month; bars maynot total to 100% if other maintenancecategories were present.
Compressor and dispenser repairs consistent over evaluation period

14
0
50
100
150
200
250
AIR SYSTEM
CONTROL ELECTRONICS
DISPENSER
FITTINGS&PIPIN
G
HYDROGEN COMPRESSOR
SENSORS
VALVES
MTB
F (D
ays)
MTBF by Equipment Category: Infrastructure (Delivered H2 Only)
Median SiteLowest Site
NREL cdparra_mhe_72
Created: Sep-26-13 10:24 AM | Data Range: 2010Q1-2013Q2
Breakdown of MTBF by Key Delivered Hydrogen Infrastructure Categories
Consistent across all sites are failures with control electronics and hydrogen compressors. These two categories have low MTBF.

15
Breakdown of Failure Modes for Top Four Maintenance Categories for Infrastructure
0 100 200 300 400
HYDROGEN COMPRESSOR
DISPENSER
CONTROL ELECTRONICS
AIR SYSTEM
Event Count
51%*
20%*
19%*
10%*
DATA ERROR
DRIVE OFF
EXCESSIVE NOISE
FAILED CLOSED
HYDROGEN LEAK
INSPECT TROUBLE ALARM OR REPORT
LIGHTNING STRIKE
METAL FATIGUE
MOISTURE INFILTRATION
OUT OF CALIBRATION
PRESSURE LOW
REPLACE FAILED PARTS
TEMPERATURE HIGH
MISC
0 500 1000 1500 2000 2500 3000 3500
HYDROGEN COMPRESSOR
DISPENSER
CONTROL ELECTRONICS
AIR SYSTEM
Labor Hours
58%*
18%*
14%*
9%*
NREL cdp_mhe_52
Created: Sep-26-13 9:51 AM | Data Range: 2009Q1-2013Q2
Failure Modes for Top Four Infrastructure Equipment Categories
* Percentage of total events or hours, reference CDP 66.
MISC includes the following failure modes: ambient temperature too low, broken wire,cavitation, data error, debris infiltration, electrical short, failed closed, false alarm, flow
high, flow low, fluid leak non-hydrogen, fluid leak non_hydrogen, fluidleak_non_hydrogen, inspect trouble alarm or report, maintenance error, manufacturing
defect, metal fatigue, moisture infiltration, network malfunction, operator protocol, other,power outage, pressure high, pressure low, replace failed parts, software bug,
unspecified electronics failure, vandalism, voltage low, other
There are many different failure modes for the top four categories and these modes provide insight for RD&D needs

16
MHE and Infrastructure Safety Report Analyses
14%
14%
14%
14%
14%
29%
By Number of IncidentsTotal Incidents = 7
Control Electronics
Operator Protocol
Fuel System
Fittings & Piping
FC Stack
Electrical
Majority of MHE safety reports (217) are minor hydrogen leaks
(4,480 stack hours per report)
Majority of infrastructure safety reports (82) are hydrogen leaks primarily from the hydrogen compressor and plumbing
(2,879 kg dispensed per report)
5%5%
90%
By Number of IncidentsTotal Incidents = 21
Dispenser
Compressor
Valves
17
Technical Summary—What We’ve Learned
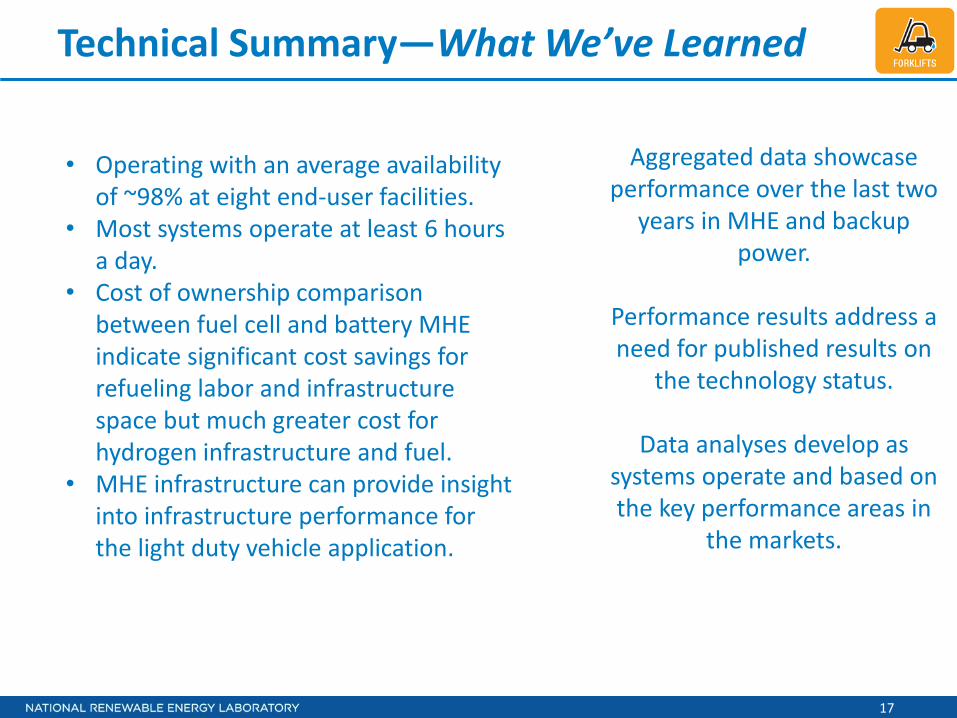
• Operating with an average availability of ~98% at eight end-user facilities.
• Most systems operate at least 6 hours a day.
• Cost of ownership comparison between fuel cell and battery MHE indicate significant cost savings for refueling labor and infrastructure space but much greater cost for hydrogen infrastructure and fuel.
• MHE infrastructure can provide insight into infrastructure performance for the light duty vehicle application.
Aggregated data showcase performance over the last two
years in MHE and backup power.
Performance results address a need for published results on
the technology status.
Data analyses develop as systems operate and based on the key performance areas in
the markets.

18
This project is supported by the U.S. Department of Energy Fuel Cell Technologies Office EERE, Jason Marcinkoski, Sara Dillich,
and Pete Devlin
Jennifer Kurtz [email protected]
Photo by Jennifer Kurtz, NREL 18347