U.S. Department of Education September 2003 2003 … turnover, or mobility rate ... Specify...
24
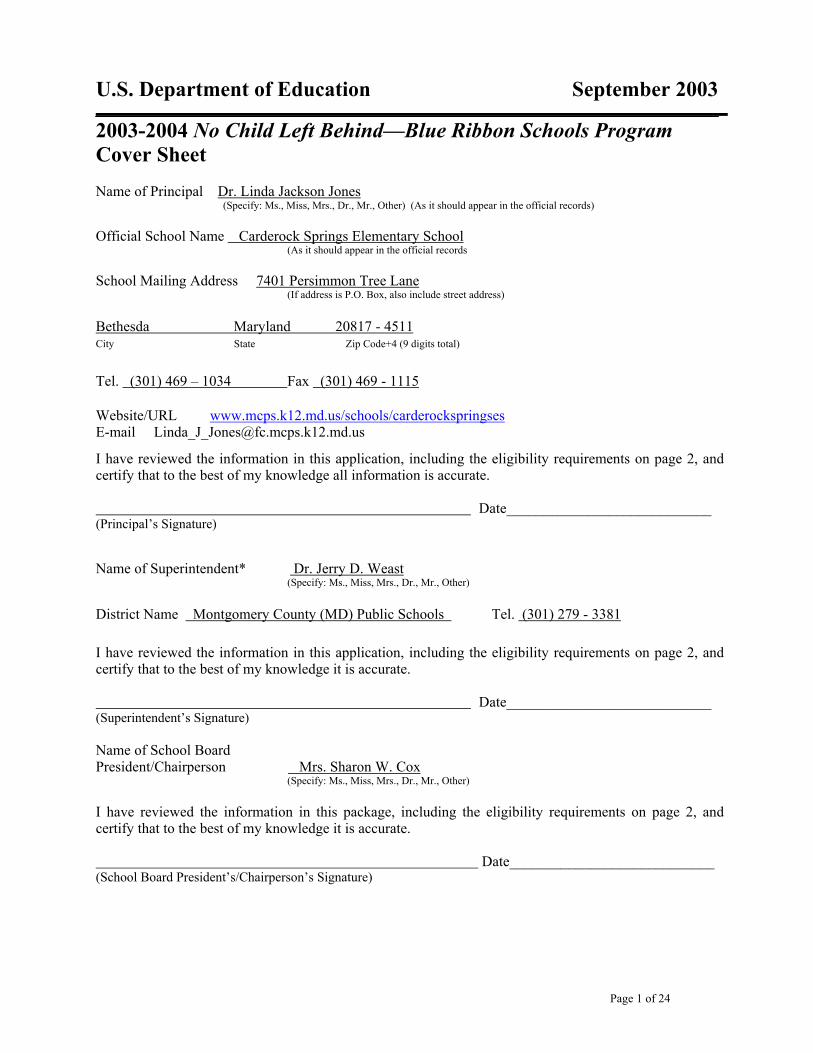
Page 1 of 24 U.S. Department of Education September 2003 2003-2004 No Child Left Behind—Blue Ribbon Schools Program Cover Sheet Name of Principal Dr. Linda Jackson Jones (Specify: Ms., Miss, Mrs., Dr., Mr., Other) (As it should appear in the official records) Official School Name Carderock Springs Elementary School (As it should appear in the official records School Mailing Address 7401 Persimmon Tree Lane (If address is P.O. Box, also include street address) Bethesda Maryland 20817 - 4511 City State Zip Code+4 (9 digits total) Tel. (301) 469 – 1034 Fax (301) 469 - 1115 Website/URL www.mcps.k12.md.us/schools/carderockspringses E-mail [email protected] I have reviewed the information in this application, including the eligibility requirements on page 2, and certify that to the best of my knowledge all information is accurate. Date____________________________ (Principal’s Signature) Name of Superintendent* Dr. Jerry D. Weast (Specify: Ms., Miss, Mrs., Dr., Mr., Other) District Name Montgomery County (MD) Public Schools Tel. (301) 279 - 3381 I have reviewed the information in this application, including the eligibility requirements on page 2, and certify that to the best of my knowledge it is accurate. Date____________________________ (Superintendent’s Signature) Name of School Board President/Chairperson Mrs. Sharon W. Cox (Specify: Ms., Miss, Mrs., Dr., Mr., Other) I have reviewed the information in this package, including the eligibility requirements on page 2, and certify that to the best of my knowledge it is accurate. Date____________________________ (School Board President’s/Chairperson’s Signature)
-
Upload
truongquynh -
Category
Documents
-
view
216 -
download
0
Transcript of U.S. Department of Education September 2003 2003 … turnover, or mobility rate ... Specify...
Page 1 of 24
U.S. Department of Education September 2003 2003-2004 No Child Left Behind—Blue Ribbon Schools Program Cover Sheet Name of Principal Dr. Linda Jackson Jones
(Specify: Ms., Miss, Mrs., Dr., Mr., Other) (As it should appear in the official records) Official School Name Carderock Springs Elementary School
(As it should appear in the official records School Mailing Address 7401 Persimmon Tree Lane (If address is P.O. Box, also include street address)
Bethesda Maryland 20817 - 4511 City State Zip Code+4 (9 digits total)
Tel. (301) 469 – 1034 Fax (301) 469 - 1115
Website/URL www.mcps.k12.md.us/schools/carderockspringses E-mail [email protected] I have reviewed the information in this application, including the eligibility requirements on page 2, and certify that to the best of my knowledge all information is accurate. Date____________________________ (Principal’s Signature) Name of Superintendent* Dr. Jerry D. Weast
(Specify: Ms., Miss, Mrs., Dr., Mr., Other)
District Name Montgomery County (MD) Public Schools Tel. (301) 279 - 3381 I have reviewed the information in this application, including the eligibility requirements on page 2, and certify that to the best of my knowledge it is accurate. Date____________________________ (Superintendent’s Signature) Name of School Board President/Chairperson Mrs. Sharon W. Cox
(Specify: Ms., Miss, Mrs., Dr., Mr., Other) I have reviewed the information in this package, including the eligibility requirements on page 2, and certify that to the best of my knowledge it is accurate. Date____________________________ (School Board President’s/Chairperson’s Signature)

Page 2 of 24
PART I - ELIGIBILITY CERTIFICATION [Include this page in the school’s application as page 2.] The signatures on the first page of this application certify that each of the statements below concerning the school's eligibility and compliance with U.S. Department of Education, Office of Civil Rights (OCR) requirements is true and correct.
1. The school has some configuration that includes grades K-12. (Schools with one principal, even K-12 schools, must apply as an entire school.)
2. The school has not been in school improvement status or been identified by the state as "persistently dangerous" within the last two years. To meet final eligibility, the school must meet the state’s adequate yearly progress requirement in the 2003-2004 school year.
3. If the school includes grades 7 or higher, it has foreign language as a part of its core curriculum.
4. The school has been in existence for five full years, that is, from at least September 1998.
5. The nominated school or district is not refusing the OCR access to information necessary to investigate a civil rights complaint or to conduct a district-wide compliance review.
6. The OCR has not issued a violation letter of findings to the school district concluding that the nominated school or the district as a whole has violated one or more of the civil rights statutes. A violation letter of findings will not be considered outstanding if the OCR has accepted a corrective action plan from the district to remedy the violation.
7. The U.S. Department of Justice does not have a pending suit alleging that the nominated school, or the school district as a whole, has violated one or more of the civil rights statutes or the Constitution's equal protection clause.
8. There are no findings of violations of the Individuals with Disabilities Education Act in a U.S. Department of Education monitoring report that apply to the school or school district in question; or if there are such findings, the state or district has corrected, or agreed to correct, the findings.

Page 3 of 24
PART II - DEMOGRAPHIC DATA All data are the most recent year available. DISTRICT (Questions 1-2 not applicable to private schools) 1. Number of schools in the district: __125___ Elementary schools
__36___ Middle schools ___0__ Junior high schools ___23__ High schools ___7 __ Other (Briefly explain) MCPS has 6 Special Education or Alternative Schools and 1 Career/Technology Center
___191__ TOTAL
2. District Per Pupil Expenditure: ___$9,475.00__________ Average State Per Pupil Expenditure: ___$8,351.00__________ SCHOOL (To be completed by all schools) 3. Category that best describes the area where the school is located:
[ ] Urban or large central city [ ] Suburban school with characteristics typical of an urban area [ X ] Suburban [ ] Small city or town in a rural area [ ] Rural
4. 4 Number of years the principal has been in her/his position at this school.
If fewer than three years, how long was the previous principal at this school? 5. Number of students enrolled at each grade level or its equivalent in applying school:
Grade # of Males # of Females Grade Total
K 12 23 35 1 27 25 52 2 25 27 52 3 30 29 59 4 27 27 54 5 39 29 68 6
Total Students in the Applying School 320
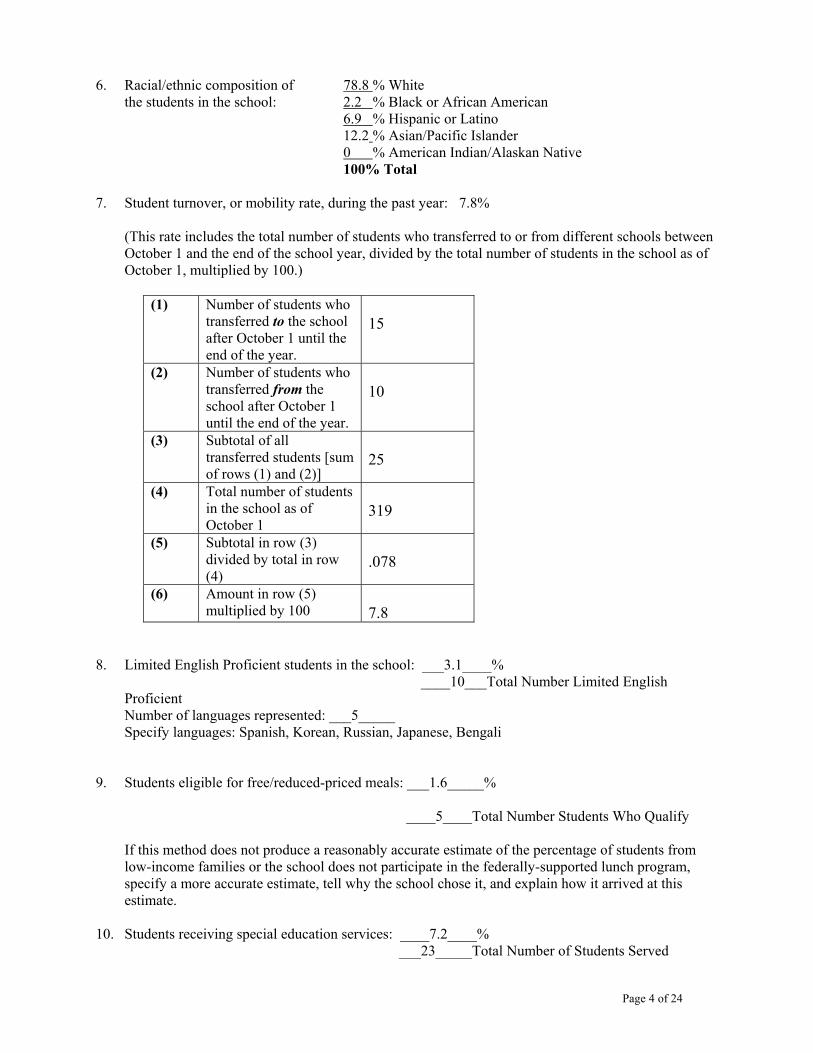
Page 4 of 24
6. Racial/ethnic composition of 78.8 % White the students in the school: 2.2 % Black or African American
6.9 % Hispanic or Latino 12.2 % Asian/Pacific Islander 0 % American Indian/Alaskan Native 100% Total 7. Student turnover, or mobility rate, during the past year: 7.8%
(This rate includes the total number of students who transferred to or from different schools between October 1 and the end of the school year, divided by the total number of students in the school as of October 1, multiplied by 100.)
(1) Number of students who transferred to the school after October 1 until the end of the year.
15
(2) Number of students who transferred from the school after October 1 until the end of the year.
10
(3) Subtotal of all transferred students [sum of rows (1) and (2)]
25
(4) Total number of students in the school as of October 1
319
(5) Subtotal in row (3) divided by total in row (4)
.078
(6) Amount in row (5) multiplied by 100
7.8
8. Limited English Proficient students in the school: ___3.1____% ____10___Total Number Limited English
Proficient Number of languages represented: ___5_____ Specify languages: Spanish, Korean, Russian, Japanese, Bengali 9. Students eligible for free/reduced-priced meals: ___1.6_____% ____5____Total Number Students Who Qualify
If this method does not produce a reasonably accurate estimate of the percentage of students from low-income families or the school does not participate in the federally-supported lunch program, specify a more accurate estimate, tell why the school chose it, and explain how it arrived at this estimate.
10. Students receiving special education services: ____7.2____% ___23_____Total Number of Students Served

Page 5 of 24
Indicate below the number of students with disabilities according to conditions designated in the Individuals with Disabilities Education Act.
__1__Autism ____Orthopedic Impairment ____Deafness _1__Other Health Impaired ____Deaf-Blindness _4__Specific Learning Disability ____Hearing Impairment _17_Speech or Language Impairment (many of these
students receive Specific Learning Disability support as well)
____Mental Retardation ____Traumatic Brain Injury ____Multiple Disabilities ____Visual Impairment Including Blindness 11. Indicate number of full-time and part-time staff members in each of the categories below:
Number of Staff
Full-time Part-Time
Administrator(s) ____1___ ________
Classroom teachers ___12____ ____1____
Special resource teachers/specialists ____6___ ____6____
Paraprofessionals ____2___ ____3____
Support staff ____4___ ____8____
Total number ____25___ ___18____
12. Average school student-“classroom teacher” ratio: K= 17:1 Gr. 1 to 2 = 25.8 :1 Gr. 3 to 5 = 22.6:1 13. Show the attendance patterns of teachers and students as a percentage. The student dropout rate is
defined by the state. The student drop-off rate is the difference between the number of entering students and the number of exiting students from the same cohort. (From the same cohort, subtract the number of exiting students from the number of entering students; divide that number by the number of entering students; multiply by 100 to get the percentage drop-off rate.) Briefly explain in 100 words or fewer any major discrepancy between the dropout rate and the drop-off rate. (Only middle and high schools need to supply dropout rates and only high schools need to supply drop-off rates.)
2002-2003 2001-2002 2000-2001 1999-2000 1998-1999
Daily student attendance 96.3% 96.5% 95.8% 96.5% 96.2% Daily teacher attendance 93% 96% 94% 97% 94% Teacher turnover rate 10% 10% 14% 14% 10% Student dropout rate NA NA NA NA NA Student drop-off rate NA NA NA NA NA

Page 6 of 24
PART III - SUMMARY Provide a brief, coherent narrative snapshot of the school in one page (approximately 475 words). Include at least a summary of the school’s mission or vision in the statement.
Carderock Springs Elementary School is nestled in the far southwest corner of Montgomery County, Maryland with a physical address of Bethesda. The children who attend Carderock Springs come from the suburban communities of Bethesda and Potomac, just outside of our nation’s Capitol. Our families represent a variety of backgrounds, professions and nationalities including many international families with bilingual students. Although not participants in the English for Speakers of Other Languages program, the international community inside our school brings to our school a rich mosaic from which we all learn and grow. All students find a warm, caring and secure environment inside our walls with a staff that demonstrates daily their belief that high quality teaching and learning is a basic right of all children. We pride ourselves at Carderock Springs on being a community of learners. This is typified in our motto: “We Love to Learn” where this “we” includes staff, parents and community members as well as our students. We envision a school where we promote the development of successful lifelong learners who contribute to their changing global society. We believe that respected students will be encouraged to reach their full potential through a cooperative partnership between home and school. We strive to provide learning experiences that build on students’ successes, foster independence in learning, promote responsibility for self and others, nurture self-esteem, and enhance critical and divergent thinking skills.
Our students are taught the value of ethical citizenship daily through our participation in the Whitman cluster of schools Pillars of Ethics program. In our school students give one another “heartprints” for demonstrating one of the seven pillars which include: responsibility, moral courage, cooperation, honesty, respect, caring and empathy and fairness. Student ethical behavior is celebrated with ethics pep rally assemblies twice a year where students from the cluster high school often come over to cheer with the elementary school students. Part of the assembly is the introduction of the upcoming community service project run jointly by our student government and the Parent Teacher Association. Carderock students have been recognized for a number of community service efforts including the money they have raised for the Humane Society, Lymphoma Research, Bethesda Cares, and their ongoing partnership to assist the residents of the Stepping Stones Homeless Shelter.
Students participate actively in their academic, artistic as well as in their ethical education. Learning is a “minds on -- hands on” experience where students are expected to become thinkers and problem solvers. In this vein they are thoroughly involved through class projects and organizations such as student government, safety patrols and the yearly musical production in planning and decision -making related to the topic or project under study. For example, the fifth grade each year runs an in-school mail system. The students are divided into committees and each committee organizes a part of the larger enterprise from designing the postal station, designing stamps for the in-house mail, and researching worthy organizations to receive the proceeds from their project. By the time students leave Carderock they have had significant experience in working with others and understand the value of effective effort in producing successful outcomes. Active parental support through activities such as the Welcome Back-to-school Picnic, International Night, Muffins with Mom & Donuts with Dad Breakfast and Open House, Book Fairs, the annual Teacher Appreciation Raffle, Monthly Cultural Arts Assemblies, New Parent Packets and Informational Parent Forums on topics of interest like Gifted Programs, Special Education Programs and the Educational Management Team Process plays a significant role in the success we enjoy at our school.
Carderock Springs is a remarkable learning community. In spite of a cramped physical plant, every student at our school is afforded a first class elementary education that has taken our students to the most respected institutions of higher education worldwide. The start students receive at Carderock allows them to matriculate forward still saying “We Love To Learn” and that makes all the difference.

Page 7 of 24
PART IV – INDICATORS OF ACADEMIC SUCCESS
1. Describe in one page the meaning of the school’s assessment results in reading (language arts or English) and mathematics in such a way that someone not intimately familiar with the tests can easily understand them.
Over the past three years, the state of Maryland has made major transitions in its school performance accountability system. The Maryland School Performance Assessment Program (MSPAP) was in place from 1993 through 2002 for grades 3 and 5. The Maryland School Assessment (MSA) began in 2003 for grades 3 and 5. Both assessments measure the Maryland Learning Outcomes in reading and math. The MSPAP provided performance measurement at the school level, while the MSA provides performance measurement at both the school and student levels. Satisfactory and excellent performance standards for the MSPAP were set such that 70% of student scores were expected to meet the satisfactory standard, and 25% of student scores were expected to meet the excellent standard. Proficient and advanced performance standards were set for the MSA with the expectation that 100% of students will meet the proficient standard by 2014. No expectations have been set for the percentage of students attaining the advanced standard at this writing. Carderock Spring’s results for grade 3 Reading moved from about 50% satisfactory to over 95% proficient, for grade 3 Math moved from about 70% satisfactory to 100% proficient, for Grade 5 Reading moved from 67% satisfactory to over 95% proficient, and for Grade 5 Math moved from 92% satisfactory to 94% proficient. Our current state ranking on proficiency percentiles is 99% proficient for Grade 3 Reading and Math combined and 98.5% proficient for Grade 5 Reading and Math combined.
To supplement the school-level performance measurement of the MSPAP, the state of Maryland also required the Comprehensive Test of Basic Skills (CTBS) for grades 2 and 4 through 2002. Our school district also administered the CTBS to grades 2 and 4 in 2003. The CTBS provides performance scores for students and schools. Maryland reports the median national percentile (MNP) rank for each school. Thus the CTBS can provide a more stable comparison of our school’s performance scores across years. Carderock Springs’ results from 2001 to 2003 showed an increase in the MNP rank from 82 to 90 for Grade 2 Reading, an increase in the MNP rank from 82 to 94 for Grade 2 Math, changes in the MNP rank from 84 to 92 to 84 for Grade 4 Reading, and an increase in the MNP rank from 85 to 94 for Grade 4 Math.
Over time our results demonstrate the strength of the instructional program as well as
reflect the dedication of our teachers to continuously challenge and move our students forward. The performance-based tasks of the assessments in Maryland led to a real culture change in instructional practice at Carderock Springs, requiring more authenticity in the daily tasks required of students. Considering the small size of our testing cohorts at each grade level, student performance is consistently high and moving forward, keeping pace with the increased rigor of the curriculum. Our students, staff and parent community are proud of the record of achievement that their daily efforts produce.

Page 8 of 24
2. Show in one-half page (approximately 200 words) how the school uses assessment data to understand
and improve student and school performance. The administration, staff and parent community have consistently used all student performance data available including standardized test program results, daily class tasks, performance on homework and other independent assignments as well as periodic grade reports to analyze and respond appropriately to student performance at the level of the individual student as well as the class, grade level and school. Recent improvements in the Montgomery County Public Schools Instructional Management System have facilitated this effort tremendously as we are now able to produce color graphic representations of student progress on a number of measures with a few mouse clicks. This technology allows the critical links between curriculum, instruction and assessment to be managed at the individual teacher level. Individual teachers monitor multiple sources of student data, both formative and summative, with interpretation assistance, as needed from the staff development teacher, reading specialist, special education resource teacher and principal to fashion academic interventions for individual students or groups of students. For example, a recent review of our Maryland School Assessment data pointed up a weakness in our third grade word study program. Both the third grade team and the fourth grade team planned a specific series of lessons to erase this gap in the knowledge base of a specific group of students. The staff development teacher coordinated the effort with the reading specialist to ensure we targeted the appropriate skills and did not sacrifice other needed curriculum in the process. Consistent monitoring of our assessment data allows our school to plan thoughtfully for the success of every student. While the emphasis for student instructional goal attainment remains formative assessments and quality planning and adjustment for instruction, our emphasis in the school level analysis begins with summative data over time and then moves into finding appropriate formative assessments to measure cohort progress on the goal. 3. Describe in one-half page how the school communicates student performance, including assessment
data, to parents, students, and the community. Recognizing that parents are our partners in the success of each student, performance is communicated to parents on an ongoing basis through a variety of means. Teachers send graded student performance tasks home to parents in a weekly work folder. In addition, every parent is invited to a face-to-face conference in November each year. The goal of the conference is to review student progress up to that point in the school year, including a review of relevant student standardized assessment results. This is a follow up to the beginning of the school year parent meetings grade levels hold to establish instructional goals for students at the grade level. At any point in the school year parents or teachers may initiate additional phone, or in-person conferences to share progress updates, negotiate current challenges, or for any other reason that makes the contact profitable in the course of the child’s education. Parents receive a home report of their child’s standardized assessment results and the principal invites parents at the tested grades to a meeting for general questions and answers about the assessment. All of the school level assessment results are shared with parents in writing through the principal’s monthly newsletter as well as through a general Parent Teacher Association meeting presentation. Assessment results as well as other school level data are maintained on the website of the school system in a “Schools at a Glance” feature that is also available in hardcopy at the school and in public libraries. Local newspapers publish information about school performance to the general community and the Maryland State Department of Education maintains a website that also publishes individual school performance data. Perhaps the most powerful communication of progress occurs between teacher and child. Through an individual conference feature of our program student and teacher look at student work and the student suggests ways to improve and with teacher guidance a plan is put in place. This is particularly true in our writing program, which is the priority target of our school-wide improvement plan.
Page 9 of 24
4. Describe in one-half page how the school will share its successes with other schools.
Several venues allow our school to share its successes with other schools including: • We maintain a school website through which a virtually limitless audience can access
information about activities at Carderock, including our school improvement plan and contact information.
• Teachers from our school have contributed lessons to the school system website to share best practice in integrating technology in relevant ways that match our curriculum.
• The cluster model in our school system allows “job-alike” sharing in a pre-kindergarten through grade twelve cross articulation. In this venue the principal, staff development teacher, reading specialist, special educators, and counselor can share ideas and strategies. Our quad-cluster staff development specialists have also arranged lesson sharing sessions among teachers where each brings a “best lesson” to share with others. Carderock’s staff has been an active contributor to these sessions.
• Our technology teacher and third grade teacher have presented to other educators at state and national level conferences and this type of venue allows a wide cross section of educators to benefit from lessons we have learned as we work with children.
• Our kindergarten teacher has served on a county level task force designed to document “best practice” in working with young children.
The accomplished staff of Carderock Springs willingly shares its expertise with local, state and national audiences. We will continue to seek and welcome opportunities to share what we know as well as to learn from other generous educators. We have found over time that in every opportunity and venue through which we share with other educators, we gain as much as we have given. PART V – CURRICULUM AND INSTRUCTION 1. Describe in one page the school’s curriculum. Outline in several sentences the core of each curriculum
area and show how all students are engaged with significant content based on high standards Teaching and learning at Carderock Springs is organized around implementing the Montgomery County Public Schools (MCPS) curriculum with the particular need, interests and abilities of our students in mind. MCPS asks four essential questions that guide the conduct of any instructional program in the district:
• What do students need to know and be able to do? • How will we know they have learned it? • What will we do when they haven’t? • What will we do when they already know it?
Over the last three years the MCPS curriculum has been revised to ensure that it incorporates the state-mandated framework with the Maryland Content Standards and Maryland Learning Outcomes, as required by law. MCPS has worked to incorporate recognized world-class standards in addition to what is required by our state. All students receive instruction in Reading, Mathematics, Social Studies, Science, Art, Music and Physical Education weekly. All students in the school are working on the diploma requirements of our state, including those who receive specialized services based on their individualized education plan, section 504 plan for accommodations or their plan for students with limited English proficiency. Because all of our students are therefore expected to master the curriculum at their grade level indicators or above, all of our students are engaged in the MCPS curriculum, which is based on world-class standards. Many areas of our curriculum incorporate a variety of interdisciplinary principles. Students read non-fiction text about science, they write in math class to making their thinking visible to others, they experiment in Social Studies to better understand how land features affect the decisions groups of people make about where to settle and they infuse technology throughout their studies to enhance their learning experiences.

Page 10 of 24
In Social Studies the goal of the curriculum is to engage students in a comprehensive study that begins in kindergarten with themselves and their family, moves to the community of their classroom and school then finally expands as they move through the grades to include a larger definition of our community. The study of community, then our nation and world offers students the skills and knowledge they will need to thrive in an increasingly complex society. Our school’s implementation of the science curriculum has as its goal to develop and utilize curiosity and achieve scientific literacy by developing a balanced understanding of the concepts of life science, chemistry, physics, earth/space, and environmental science. In addition students engage rigorously in the process skills of science through real-world applications. Every child is afforded the opportunity, working in cooperative groups, to participate in hands-on science learning. MCPS provides stocked science kits and active engagement lessons which teachers adapt for their students. The process of open-ended scientific inquiry is stressed from kindergarten through grade five and students excel at making qualitative and quantitative observations and drawing conclusions based on their observations. The development of sound reasoning skills are emphasized. Reading is based on the rigorous MCPS revised curriculum. Students are exposed to a reading program that equips students with a variety of before, during and after reading strategies that allow them to unlock text and make meaning from print. A variety of genres and a wide selection of material are resources from which teachers and students make strategic decisions to help every child become an accomplished reader, as well as writer, by the end of their elementary years. The mathematics program has been revised to increase the rigor available to every child. The emphasis of the program is to develop mathematical thinking and problem solving abilities that will both foster a lifelong love of mathematics but also facilitate decision-making ability. Art, music and physical education programs are based on Maryland’s Essential Learner Outcomes for the Fine Arts and are a significant part of our interdisciplinary focus. Students have additional opportunities to respond to the content of other disciplines in an artistic form or through the design of skill development activities in physical education. The overall goal of our curriculum in the content described here as well as in the significant effort ethic developed along the way, is to have children experience an elementary program that provides enriching, multicultural, interdisciplinary learning that both inform and enhance decisions they make throughout their lives. 2. (Elementary Schools) Describe in one-half page the school’s reading curriculum, including a
description of why the school chose this particular approach to reading. Carderock Springs implements a balanced reading approach as defined by MCPS curriculum, which incorporates the following components into daily reading instruction:
• Read aloud by the teacher or another individual of a variety of text to model fluent reading behaviors, expose children to a variety of genre, and help develop a love of reading.
• Shared reading during which teacher and students read chorally from big books, poems, and songs to develop concepts about print and phonemic connections as well as to provide a supportive group environment for fluency development.
• Guided reading and writing instruction in small group settings, which allow for the development and refinement of explicit reading and writing instruction by the teacher at the student’s reading level. Students receive direct instruction in phonics, vocabulary and comprehension strategies
• Paired/cooperative reading and writing during which students have opportunities for reading and writing without the teacher’s participation which allows students to use the reading and writing strategies they have learned in a social setting with opportunities for practice with the support of peers. Students have a chance to model, share and extend their comprehension and ideas.
• Independent reading and writing allows students to select their own text and to write for their own purpose. Students have an opportunity to process information at their own pace matched to their own interest and ability.

Page 11 of 24
Using the curriculum blueprints and instructional guides developed over the last three years in MCPS, student instruction in reading at Carderock Springs is based on best practice research in reading including information contained in works such as the report of The National Reading Panel (NRP) which reviewed more than 100,000 studies on reading and identified five components essential to a child's ability to learn to read: phonics, phonemic awareness, fluency, vocabulary, and comprehension. Each of these components as well as the Maryland content standards embedded within the MCPS curriculum guide the planning of Carderock teachers for the delivery of quality reading instruction. 3. Describe in one-half page one other curriculum area of the school’s choice and show how it relates to
essential skills and knowledge based on the school’s mission. The general music program of Carderock Springs is an integral part of our goal to wholly develop our children. In addition to exposing students to the artistry and aesthetic appreciation of music as required by the Maryland Essential Learner Outcomes in the Fine Arts, we also pride ourselves on a music program that provides opportunities to strengthen the academic understanding of concepts from other disciplines. For example, our talented music teacher incorporates African rhythms and instruments into a supportive unit on folk tales that students study in their reading class. Students learn how music and speech work together through rhythm. Because rhythm is inherent in the language we speak, rhymes, poems, and riddles offer endless possibilities for exploring musical elements. Often in music class, materials are chosen that are rhythmic, repetitive and rhyme. The students are often intrigued by the rhythmical phrases and remember the decoding of some of the words because of the nature of the rhythm, rhyme and repetition. Through music, a child at Carderock Springs has an additional learning approach to reading. Orff techniques are also used in music classes. Carl Orff wanted children to play with the sound of their words. For example a word like "dark" or "deep" could be in a poem. The student would then think of ways to pronounce the words with its meaning in mind and afterwards find an instrument whose tone color matched the words. This playing with words gives students strategies for memorizing beginning, middle and ending sounds while helping them look for patterns. Music classes at Carderock also have a strong connection with math through concepts such as meter and note value. Our music teacher has demonstrated musical connections to other disciplines for parents in workshops, which were very well received, as are the numerous performances of our school chorus, third grade recorder concert, and the annual fifth grade musical. 4. Describe in one-half page the different instructional methods the school uses to improve student
learning. Because each learner is unique and possesses varied learning styles the staff at Carderock works to present an eclectic mix of teaching strategies that will meet the needs of our diverse learners. Considerable effort is expended to utilize research-based instructional strategies that have proven to be effective in their impact on student achievement. Most recently the staff is incorporating the work Classroom Instruction That Works: Research Strategies for Increasing Student Achievement (Marzano, Pickering, & Pollock, 2001; ASCD) into our repertoire of strategies. Other instructional strategy development have included works such as Mosaic of Thought: Teaching Comprehension in a Reader's Workshop (Ellin Keene and Susan Zimmermann, 1997 Heinneman) and The Skillful Teacher: Building your teaching skills (by Jon Saphier & Robert Gower, 1997 5th Edition). Examples of strategies in use at Carderock include:
• Using specific activities to activate student background knowledge prior to new instruction, as well as the use of other specifically designed activities at the conclusion of the instructional episode to summarize the experience, helping the student to integrate and retain the learning
• Helping students visualize as an aid to comprehension • Helping students make connections to their own life, other texts read and to the larger world • Using a variety of graphic organizers to assist students with the organization of their learning • Using authentic tasks and authentic purposes to stimulate student motivation and interest in their
Page 12 of 24
learning • Using instructional approaches which engage students actively in their learning through the use of
manipulatives, role plays, games, and choice activities which allow their selection of project alternatives or text selection with appeals to their learning style or interest
• Encouraging multiple representations of data or answers • Comparing and contrasting information to identify similarities and differences.
Our school works with students in a variety of instructional settings including small group instruction, individual projects, cooperative groupings and whole class instruction as needed to differentiate instruction based on the needs of the students. 5. Describe in one-half page the school’s professional development program and its impact on improving
student achievement. The four critical questions mentioned above in question one demand clarity of instructional purpose and significant investment in developing the capacity of staff to differentiate instruction appropriately for all learners. To this end the instructional capacity of the Carderock Springs staff is developed in a number of ways. On a personal level, each staff member develops an individual professional growth plan that is tied into the goals of the school improvement plan. These goals take into account the individual differences in staff experience, personal professional goals and previous professional training. Staff members identify human and material resources they need to accomplish their goals which can range from taking a traditional graduate course, participation in a peer classroom visit with reflection, using the internet to research an instructional topic, or presenting to other educators at a national conference. The staff development teacher and principal work with individual staff members to monitor progress and adjust the personal plan as needed. At each grade level the team meets monthly to plan the upcoming unit of instruction with whichever specialists might be needed to assist the team in accomplishing the objectives of instruction. We use these monthly meeting opportunities to provide grade specific staff development. Groups of teachers also work together across grade levels on topics of mutual interest. For example, we currently have five teachers working together as they pursue certification from the National Board of Professional Teaching Standards. Finally at the whole school level we work on instructional strategy development relevant to the staff development plan of our school improvement plan. The overall effect of our staff development coordination is the consistent development of increased instructional capacity of our staff.

Page 13 of 24
PART VII - ASSESSMENT RESULTS
MARYLAND SCHOOL PERFORMANCE ASSESSMENT PROGRAM (MSPAP) Carderock Springs Elementary School 2001 & 2002 Assessment Results
Content: Reading Testing month: May Grade: 3 2001-2002 2000-2001 SCHOOL SCORES % Below Satisfactory 48.0 55.0 % At or Above Satisfactory 52.0 45.0 % At Excellent 2.0 5.0 Number of students tested 50 50 Percent of total students tested 92.6% 96.8% Number of students excluded 4 2 Percent of students excluded 7.4% 3.2% SUBGROUP SCORES 1. _White, not Hispanic_ (specify subgroup) % Below Satisfactory 52.8 56.0 % At or Above Satisfactory 47.2 44.0 % At Excellent 0.0 4.0 Number of students tested 36 50 2. Asian/Pacific Islander (specify subgroup) % Below Satisfactory 42.9 50.0 % At or Above Satisfactory 57.1 50.0 % At Excellent 0.0 16.7 Number of students tested 7 6 3. Hispanic (specify subgroup) % Below Satisfactory 16.7 * % At or Above Satisfactory 83.3 * % At Excellent 16.7 * Number of students tested 6 <5 4. Males % Below Satisfactory 57.7 61.3 % At or Above Satisfactory 42.3 38.7 % At Excellent 0.0 3.2 Number of students tested 26 31 5. Females % Below Satisfactory 37.5 48.3 % At or Above Satisfactory 62.5 51.7 % At Excellent 4.2 6.9 Number of students tested 24 29 6. Special Education % Below Satisfactory 57.1 * % At or Above Satisfactory 42.9 * % At Excellent 0.0 * Number of students tested 7 <5 STATE SCORES % Below Satisfactory 65.6% 58.2% % At or Above Satisfactory 34.4% 41.8% % At Excellent 3.7% 5.3%
*Results are not reported in the state of Maryland in any cell containing fewer than 5 students.

Page 14 of 24
MARYLAND SCHOOL PERFORMANCE ASSESSMENT PROGRAM (MSPAP) Carderock Springs Elementary School 2001 & 2002 Assessment Results
Content: Mathematics Testing month: May Grade: 3 2001-2002 2000-2001 SCHOOL SCORES % Below Satisfactory 31.4 23.0 % At or Above Satisfactory 68.6 77.0 % At Excellent 2.0 18.0 Number of students tested 51 61 Percent of total students tested 94.4% 98.4% Number of students excluded 3 1 Percent of students excluded 5.6% 1.6% SUBGROUP SCORES 1. White, not Hispanic (specify subgroup) % Below Satisfactory 32.4 21.6 % At or Above Satisfactory 67.6 78.4 % At Excellent 2.7 15.7 Number of students tested 37 51 2. Asian/Pacific Islander (specify subgroup) % Below Satisfactory 28.6 16.7 % At or Above Satisfactory 71.4 83.3 % At Excellent 0.0 50.0 Number of students tested 7 6 3. Hispanic (specify subgroup) % Below Satisfactory 16.7 * % At or Above Satisfactory 83.3 * % At Excellent 0.0 * Number of students tested 6 <5 4. Males (specify subgroup) % Below Satisfactory 29.6 25.0 % At or Above Satisfactory 70.4 75.0 % At Excellent 3.7 12.5 Number of students tested 27 32 5. Females (specify subgroup) % Below Satisfactory 33.3 20.7 % At or Above Satisfactory 66.7 79.3 % At Excellent 0.0 24.1 Number of students tested 24 29 6. Special Education (specify subgroup) % Below Satisfactory 37.5 * % At or Above Satisfactory 62.5 * % At Excellent 0.0 * Number of students tested 8 <5 STATE SCORES % Below Satisfactory 69.2% 57.6% % At or Above Satisfactory 30.8% 42.4% % At Excellent 2.1% 4.6%
* Results are not reported in the state of Maryland in any cell containing fewer than 5 students

Page 15 of 24
MARYLAND SCHOOL PERFORMANCE ASSESSMENT PROGRAM (MSPAP) Carderock Springs Elementary 2001 & 2002 Assessment Results
Content: Reading Testing month: May Grade: 5 2001-2002 2000-2001 SCHOOL SCORES % Below Satisfactory 32.1 32.8 % At or Above Satisfactory 67.9 67.2 % At Excellent 15.1 29.3 Number of students tested 53 58 Percent of total students tested 98.1% 100% Number of students excluded 1 0 Percent of students excluded 1.9% 0% SUBGROUP SCORES 1. White, not Hispanic (specify subgroup) % Below Satisfactory 31.6 28.6 % At or Above Satisfactory 68.4 71.4 % At Excellent 13.2 30.6 Number of students tested 38 49 2. Asian/Pacific Islander (specify subgroup) % Below Satisfactory 30.0 * % At or Above Satisfactory 70.0 * % At Excellent 30.0 * Number of students tested 10 <5 3. Hispanic (specify subgroup) % Below Satisfactory * * % At or Above Satisfactory * * % At Excellent * * Number of students tested <5 <5 4. Males (specify subgroup) % Below Satisfactory 40.9 50.0 % At or Above Satisfactory 59.1 50.0 % At Excellent 13.6 21.9 Number of students tested 22 32 5. Females (specify subgroup) % Below Satisfactory 25.8 11.5 % At or Above Satisfactory 74.2 88.5 % At Excellent 16.1 38.5 Number of students tested 31 26 6. Special Education (specify subgroup) % Below Satisfactory 42.9 62.5 % At or Above Satisfactory 57.1 37.5 % At Excellent 0.0 0.0 Number of students tested 7 8 STATE SCORES % Below Satisfactory 46.6% 43.1% % At or Above Satisfactory 53.4% 56.9% % At Excellent 11.2% 12.3% * Results are not reported in the state of Maryland in any cell containing fewer than five students

Page 16 of 24
MARYLAND SCHOOL PERFORMANCE ASSESSMENT PROGRAM (MSPAP) Carderock Springs Elementary School 2001 & 2002 Assessment Results
Content: Mathematics Testing month: May Grade: 5 2001-2002 2000-2001 SCHOOL SCORES % Below Satisfactory 7.5 8.6 % At or Above Satisfactory 92.5 91.4 % At Excellent 32.1 43.1 Number of students tested 53 58 Percent of total students tested 98.1% 100% Number of students excluded 1 0 Percent of students excluded 1.9% 0% SUBGROUP SCORES 1. White, not Hispanic (specify subgroup) % Below Satisfactory 7.9 8.2 % At or Above Satisfactory 92.1 91.8 % At Excellent 34.2 44.9 Number of students tested 38 49 2. Asian, Pacific Islander (specify subgroup) % Below Satisfactory 0.0 * % At or Above Satisfactory 100.0 * % At Excellent 40.0 * Number of students tested 10 <5 3. Hispanic (specify subgroup) % Below Satisfactory * * % At or Above Satisfactory * * % At Excellent * * Number of students tested <5 <5 4. Males (specify subgroup) % Below Satisfactory 9.1 12.5 % At or Above Satisfactory 90.9 87.5 % At Excellent 36.4 37.5 Number of students tested 22 32 5. Females (specify subgroup) % Below Satisfactory 6.5 3.8 % At or Above Satisfactory 93.5 96.2 % At Excellent 29.0 50.0 Number of students tested 31 26 6. Special Education (specify subgroup) % Below Satisfactory 28.6 37.5 % At or Above Satisfactory 71.4 62.5 % At Excellent 0.0 0.0 Number of students tested 7 8 STATE SCORES % Below Satisfactory 50.6% 45.7% % At or Above Satisfactory 49.4% 54.3% % At Excellent 9.6% 11.7%
*Results are not reported in the state of Maryland for any cell containing fewer than five students.

Page 17 of 24
MARYLAND SCHOOL ASSESSMENT (MSA) Carderock Springs Elementary 2003 Assessment Results
Content: Reading Testing month: March Grade: 3 2002-2003 SCHOOL SCORES % At Basic 3.5 % At or Above Proficient 96.5 % At Advanced 38.6 Number of students tested 57 Percent of total students tested 100% Number of students excluded 0 Percent of students excluded 0% SUBGROUP SCORES 1. White, Not Hispanic (specify subgroup) % At Basic 2.2 % At or Above Proficient 97.8 % At Advanced 44.4 Number of students tested 45 2. Asian/Pacific Islander (specify subgroup) % At Basic 14.3 % At or Above Proficient 85.7 % At Advanced 14.3 Number of students tested 7 3. Hispanic (specify subgroup) % At Basic * % At or Above Proficient * % At Advanced * Number of students tested <5 4. Males (specify subgroup) % At Basic 0.0 % At or Above Proficient 100.0 % At Advanced 33.3 Number of students tested 30 5. Females (specify subgroup) % At Basic 7.4 % At or Above Proficient 92.6 % At Advanced 44.4 Number of students tested 27 6. Special Education (specify subgroup) % At Basic * % At or Above Proficient * % At Advanced * Number of students tested <5 STATE SCORES % At Basic 41.9% % At or Above Proficient 58.1% % At Advanced 8.6%
*Results are not reported in the state of Maryland for any cell containing fewer than five students.

Page 18 of 24
MARYLAND SCHOOL ASSESSMENT (MSA) Carderock Springs 2003 Assessment Results
Content: Mathematics Testing month: March Grade: 3 2002-2003 SCHOOL SCORES % At Basic 0.0 % At or Above Proficient 100 % At Advanced 49.1 Number of students tested 57 Percent of total students tested 100% Number of students excluded 0 Percent of students excluded 0% SUBGROUP SCORES 1. White, Not Hispanic (specify subgroup) % At Basic 0.0 % At or Above Proficient 100.0 % At Advanced 55.6 Number of students tested 45 2. Asian/Pacific Islander (specify subgroup) % At Basic 0.0 % At or Above Proficient 100.0 % At Advanced 28.6 Number of students tested 7 3. Hispanic (specify subgroup) % At Basic * % At or Above Proficient * % At Advanced * Number of students tested <5 4. Males (specify subgroup) % At Basic 0.0 % At or Above Proficient 100 % At Advanced 50.0 Number of students tested 30 5. Females (specify subgroup) % At Basic 0 % At or Above Proficient 100.0 % At Advanced 48.1 Number of students tested 27 6. Special Education (specify subgroup) % At Basic * % At or Above Proficient * % At Advanced * Number of students tested <5 STATE SCORES % At Basic 34.9% % At or Above Proficient 65.1% % At Advanced 14.8%
*Results are not reported in the state of Maryland for any cell containing fewer than five students.
Page 19 of 24
MARYLAND SCHOOL ASSESSMENT (MSA) Carderock Springs 2003 Assessment Results
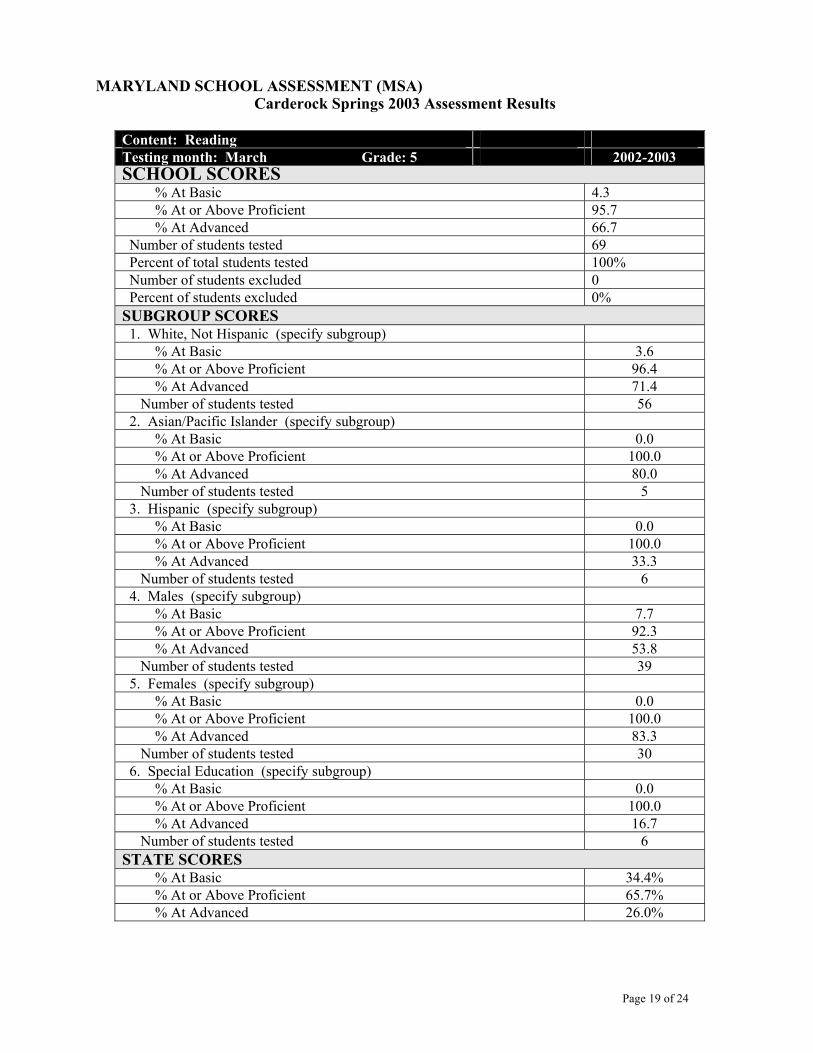
Content: Reading Testing month: March Grade: 5 2002-2003 SCHOOL SCORES % At Basic 4.3 % At or Above Proficient 95.7 % At Advanced 66.7 Number of students tested 69 Percent of total students tested 100% Number of students excluded 0 Percent of students excluded 0% SUBGROUP SCORES 1. White, Not Hispanic (specify subgroup) % At Basic 3.6 % At or Above Proficient 96.4 % At Advanced 71.4 Number of students tested 56 2. Asian/Pacific Islander (specify subgroup) % At Basic 0.0 % At or Above Proficient 100.0 % At Advanced 80.0 Number of students tested 5 3. Hispanic (specify subgroup) % At Basic 0.0 % At or Above Proficient 100.0 % At Advanced 33.3 Number of students tested 6 4. Males (specify subgroup) % At Basic 7.7 % At or Above Proficient 92.3 % At Advanced 53.8 Number of students tested 39 5. Females (specify subgroup) % At Basic 0.0 % At or Above Proficient 100.0 % At Advanced 83.3 Number of students tested 30 6. Special Education (specify subgroup) % At Basic 0.0 % At or Above Proficient 100.0 % At Advanced 16.7 Number of students tested 6 STATE SCORES % At Basic 34.4% % At or Above Proficient 65.7% % At Advanced 26.0%

Page 20 of 24
MARYLAND SCHOOL ASSESSMENT (MSA) Carderock Springs 2003 Assessment Results
Content: Mathematics Testing month: March Grade: 5 2002-2003 SCHOOL SCORES % At Basic 5.8 % At or Above Proficient 94.2 % At Advanced 44.9 Number of students tested 69 Percent of total students tested 100% Number of students excluded 0 Percent of students excluded 0% SUBGROUP SCORES 1. White, Not Hispanic (specify subgroup) % At Basic 5.4 % At or Above Proficient 94.6 % At Advanced 46.4 Number of students tested 56 2. Asian/Pacific Islander (specify subgroup) % At Basic 0.0 % At or Above Proficient 100.0 % At Advanced 40.0 Number of students tested 5 3. Hispanic (specify subgroup) % At Basic 16.7 % At or Above Proficient 83.3 % At Advanced 50.0 Number of students tested 6 4. Males (specify subgroup) % At Basic 7.7 % At or Above Proficient 92.3 % At Advanced 35.9 Number of students tested 39 5. Females (specify subgroup) % At Basic 3.3 % At or Above Proficient 96.7 % At Advanced 56.7 Number of students tested 30 6. Special Education (specify subgroup) % At Basic 16.7 % At or Above Proficient 83.3 % At Advanced 16.7 Number of students tested 6 STATE SCORES % At Basic 45.0% % At or Above Proficient 55.0% % At Advanced 9.5%
Page 21 of 24
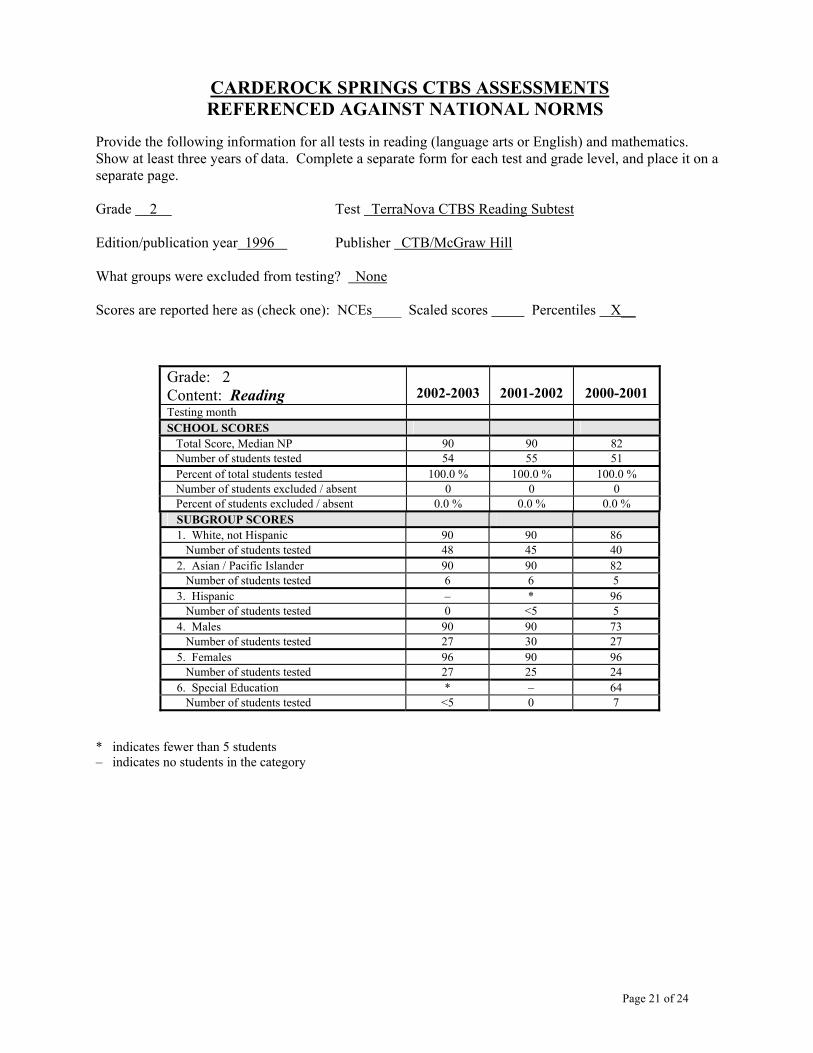
CARDEROCK SPRINGS CTBS ASSESSMENTS REFERENCED AGAINST NATIONAL NORMS
Provide the following information for all tests in reading (language arts or English) and mathematics. Show at least three years of data. Complete a separate form for each test and grade level, and place it on a separate page. Grade 2 Test TerraNova CTBS Reading Subtest Edition/publication year 1996 Publisher CTB/McGraw Hill What groups were excluded from testing? None Scores are reported here as (check one): NCEs____ Scaled scores Percentiles X__
Grade: 2 Content: Reading
2002-2003
2001-2002
2000-2001
Testing month SCHOOL SCORES Total Score, Median NP 90 90 82 Number of students tested 54 55 51 Percent of total students tested 100.0 % 100.0 % 100.0 % Number of students excluded / absent 0 0 0 Percent of students excluded / absent 0.0 % 0.0 % 0.0 % SUBGROUP SCORES 1. White, not Hispanic 90 90 86 Number of students tested 48 45 40 2. Asian / Pacific Islander 90 90 82 Number of students tested 6 6 5 3. Hispanic – * 96 Number of students tested 0 <5 5 4. Males 90 90 73 Number of students tested 27 30 27 5. Females 96 90 96 Number of students tested 27 25 24 6. Special Education * – 64 Number of students tested <5 0 7
* indicates fewer than 5 students – indicates no students in the category

Page 22 of 24
CARDEROCK SPRINGS CTBS ASSESSMENTS REFERENCED AGAINST NATIONAL NORMS
Provide the following information for all tests in reading (language arts or English) and mathematics. Show at least three years of data. Complete a separate form for each test and grade level, and place it on a separate page. Grade 4 Test TerraNova CTBS Reading Subtest Edition/publication year 1996 Publisher CTB/McGraw Hill What groups were excluded from testing? None Scores are reported here as (check one): NCEs____ Scaled scores Percentiles X__
Grade: 4 Content: Reading
2002-2003
2001-2002
2000-2001
Testing month SCHOOL SCORES Total Score, Median NP 84 92 84 Number of students tested 50 60 54 Percent of total students tested 100.0 % 98.4 % 100.0 % Number of students excluded / absent 0 1 0 Percent of students excluded / absent 0.0 % 1.6 % 0.0 % SUBGROUP SCORES 1. White, not Hispanic 84 92 84 Number of students tested 37 51 40 2. Asian / Pacific Islander 80 92 92 Number of students tested 6 5 9 3. Hispanic 88 * * Number of students tested 6 <5 <5 4. Males 84 84 84 Number of students tested 24 32 23 5. Females 84 92 84 Number of students tested 26 28 31 6. Special Education 54 80 75 Number of students tested 7 6 5
* indicates fewer than 5 students – indicates no students in the category

Page 23 of 24
CARDEROCK SPRINGS CTBS ASSESSMENTS REFERENCED AGAINST NATIONAL NORMS
Provide the following information for all tests in reading (language arts or English) and mathematics. Show at least three years of data. Complete a separate form for each test and grade level, and place it on a separate page. Grade 2 Test TerraNova CTBS Mathematics Subtest Edition/publication year 1996 Publisher CTB/McGraw Hill What groups were excluded from testing? None Scores are reported here as (check one): NCEs____ Scaled scores Percentiles X__
Grade: 2 Content: Mathematics
2002-2003
2001-2002
2000-2001
Testing month SCHOOL SCORES Total Score, Median NP 94 90 82 Number of students tested 54 54 51 Percent of total students tested 100.0 % 98.2 % 100.0 % Number of students excluded / absent 0 1 0 Percent of students excluded / absent 0.0 % 1.8 % 0.0 % SUBGROUP SCORES 1. White, not Hispanic 94 94 70 Number of students tested 48 45 40 2. Asian / Pacific Islander 94 94 87 Number of students tested 6 6 5 3. Hispanic – * 87 Number of students tested 0 <5 5 4. Males 94 98 70 Number of students tested 27 30 27 5. Females 87 87 75 Number of students tested 27 24 24 6. Special Education * – 52 Number of students tested <5 0 7
* indicates fewer than 5 students – indicates no students in the category

Page 24 of 24
CARDEROCK SPRINGS CTBS ASSESSMENTS REFERENCED AGAINST NATIONAL NORMS
Provide the following information for all tests in reading (language arts or English) and mathematics. Show at least three years of data. Complete a separate form for each test and grade level, and place it on a separate page. Grade 4 Test TerraNova CTBS Mathematics Subtest Edition/publication year 1996 Publisher CTB/McGraw Hill What groups were excluded from testing? None Scores are reported here as (check one): NCEs____ Scaled scores Percentiles X__
Grade: 4 Content: Mathematics
2002-2003
2001-2002
2000-2001
Testing month SCHOOL SCORES Total Score, Median NP 94 91 85 Number of students tested 50 60 54 Percent of total students tested 100.0 % 98.4 % 100.0 % Number of students excluded / absent 0 1 0 Percent of students excluded / absent 0.0 % 1.6 % 0.0 % SUBGROUP SCORES 1. White, not Hispanic 91 91 85 Number of students tested 37 51 40 2. Asian / Pacific Islander 98 97 97 Number of students tested 6 5 9 3. Hispanic 91 * * Number of students tested 6 <5 <5 4. Males 97 91 91 Number of students tested 24 32 23 5. Females 91 97 85 Number of students tested 26 28 31 6. Special Education 78 91 82 Number of students tested 7 6 5
* indicates fewer than 5 students – indicates no students in the category