U.S.-China Clean Energy Research Center Buildings Energy ... · U.S. DEPARTMENT OF ENERGY OFFICE OF...
18
1 U.S. DEPARTMENT OF ENERGY OFFICE OF ENERGY EFFICIENCY & RENEWABLE ENERGY U.S.-China Clean Energy Research Center Buildings Energy Efficiency (CERC-BEE) Direct Current (DC) Buildings & Smart Grid Lawrence Berkeley National Laboratory Wei Feng, Bruce Nordman, Rich Brown [email protected] 510-486-5156 Tsinghua University Xiamen University Beijing University of Civil Engineering and Architecture
Transcript of U.S.-China Clean Energy Research Center Buildings Energy ... · U.S. DEPARTMENT OF ENERGY OFFICE OF...

1U.S. DEPARTMENT OF ENERGY OFFICE OF ENERGY EFFICIENCY & RENEWABLE ENERGY
U.S.-China Clean Energy Research Center Buildings Energy Efficiency (CERC-BEE)
Direct Current (DC) Buildings & Smart Grid
Lawrence Berkeley National LaboratoryWei Feng, Bruce Nordman, Rich [email protected] 510-486-5156
Tsinghua University
XiamenUniversity
Beijing University of Civil Engineering
and Architecture

2U.S. DEPARTMENT OF ENERGY OFFICE OF ENERGY EFFICIENCY & RENEWABLE ENERGY
Project SummaryTimeline:Start date: April 1, 2016Planned end date: March 31, 2021Key Milestones1. Simulated savings estimate for large office;
2017 Q32. Apply power simulation model to CERC demo
building; 2018 Q43. Controls simulation model applied to 10
buildings; 2020 Q4
Budget:
Total Project $ to Date: • DOE: $500,000• Cost Share: $1,325,000
Total Project $:• DOE: $1,350,000 (funded annually)• Cost Share: $3,525,000
Key Partners:
U.S. China
Nextek Power Systems Tsinghua University
Saint-Gobain BUCEA University
Johnson Controls Shenzhen IBR
Lumencache Xiamen University
Legrand/Wattstopper Singyes Solar
NextEnergy
ForestCity
CA CEC EPIC program
Project Outcome: • Validated models of energy savings for DC
power distribution in buildings• Technologies for digitally managing power
distribution using network principles• Contribute to BTO MYPP goals:
Efficiency, Resilience, Grid interaction

3U.S. DEPARTMENT OF ENERGY OFFICE OF ENERGY EFFICIENCY & RENEWABLE ENERGY
LBNL Staff:
TeamManagement
Efficiency Analysis
Communications / Control
Wei Feng Rich Brown Bruce Nordman
Vagelis Vossos
Daniel Gerber
Aditya Khandekar
Tsinghua University
XiamenUniversity
Beijing University of Civil Engineering
and Architecture
Chris Marnay

4U.S. DEPARTMENT OF ENERGY OFFICE OF ENERGY EFFICIENCY & RENEWABLE ENERGY
Challenge
• We increasingly live in a DC world (generation, storage, end use)– Very low (zero-net) energy buildings becoming common and encouraged by policies– Distributed Energy Resources (DER) becoming common in many states
• Integrating native-DC DERs into legacy AC system requires AC-DC conversions– Adds capital cost and wastes energy
• AC has other limitations– Power quality, grid reliability, safety, lacks integrated power control capability
• Direct DC distribution can solve these problems, but need to:– Identify right applications for DC in buildings
– Quantify benefits (efficiency and other)
– Develop ”smart” technologies to manage DC distribution using modern communication and control
5U.S. DEPARTMENT OF ENERGY OFFICE OF ENERGY EFFICIENCY & RENEWABLE ENERGY
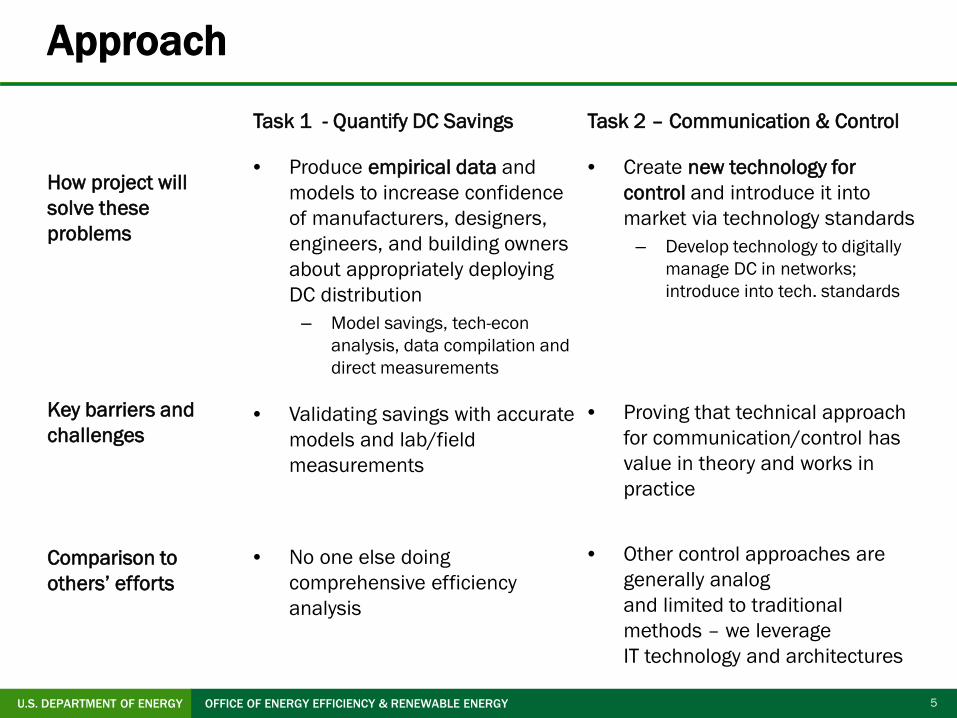
Approach
How project will solve these problems
Key barriers and challenges
Comparison to others’ efforts
Task 1 - Quantify DC Savings
• Produce empirical data and models to increase confidence of manufacturers, designers, engineers, and building owners about appropriately deploying DC distribution
– Model savings, tech-econ analysis, data compilation and direct measurements
• Validating savings with accurate models and lab/field measurements
• No one else doing comprehensive efficiency analysis
Task 2 – Communication & Control
• Create new technology for control and introduce it into market via technology standards
– Develop technology to digitally manage DC in networks; introduce into tech. standards
• Proving that technical approach for communication/control has value in theory and works in practice
• Other control approaches are generally analog and limited to traditional methods – we leverage IT technology and architectures

6U.S. DEPARTMENT OF ENERGY OFFICE OF ENERGY EFFICIENCY & RENEWABLE ENERGY
Approach: Task 1 - Energy Savings Modeling
• Review and analyze previous results from the literature• Model and measure energy savings from DC, to compare to AC baseline, for
efficient buildings with direct DC distribution, on-site solar and storage, • Conduct techno-economic analysis of AC & DC system life-cycle performance
AC DC
For modeling purposes, we assumed all-DC buildings, but expect all buildings to be hybrid AC/DC for near- to mid-term
1: Solar Converter2: Battery Converter3: Load Converter4: Grid-tie Inverter
1 1
2 2
3
3
3
4
ACDC

7U.S. DEPARTMENT OF ENERGY OFFICE OF ENERGY EFFICIENCY & RENEWABLE ENERGY
Approach: Task 2 - Local Power Distribution
What• “Network model of power” - requires DC power• Organized bottom-up, into “nanogrids”, w/local price• All power exchange peer-to-peer, digitally managed
Why• Enable local storage and generation to be truly plug-and-play• Inherently safe; simple, flexible; inter-building power links• Create better value proposition for Direct DC – efficiency gains• Enable inexpensive microgrids - inexpensive local reliability
Overall Plan• System architecture → Communication model• Simulation model → Quantitative benefits• Hardware → It really works
• Communication model → Technology standards
Market Impact:• Technology standards → Products• Simulation code → Sample algorithms for industry

8U.S. DEPARTMENT OF ENERGY OFFICE OF ENERGY EFFICIENCY & RENEWABLE ENERGY
Progress: Task 1 - Energy Savings Modeling
Model Inputs:• Converters largest contributor to power loss• Simulation model uses efficiency curves to
account for larger losses at low load levels• Also account for wiring losses
Results*: Major sources of loss –• AC: load converters, solar
inverter, battery converter• DC: grid-tie inverter• Battery chemical loss
• Savings from DC: 5% – 15%
Direct DC savings large enough to merit pursuingNeed better input data and validation using lab/field measurements
*Gerber et al. 2018. “A simulation-based efficiency comparison of AC and DC power distribution networks in commercial buildings.” Applied Energy. January.
Sample Efficiency Curve – Solar Inverter
% Max Power
Effic
ienc
y (%
)
100
80
85
90
95

9U.S. DEPARTMENT OF ENERGY OFFICE OF ENERGY EFFICIENCY & RENEWABLE ENERGY
Progress: Task 1 - Techno-Economic Analysis
Monte Carlo Analysis: 96% of cases have positive life-cycle cost (LCC) savings for medium office building with PV and battery; small savings in scenarios without battery
Compile key AC & DC component cost data, analyze mature market life-cycle cost
Positive LCC Savings
AC & DCAC onlyDC only

10U.S. DEPARTMENT OF ENERGY OFFICE OF ENERGY EFFICIENCY & RENEWABLE ENERGY
Progress: Task 2 - Local Power Distribution
• Created simulation model of devices & power infrastructure– Defined architecture /mechanisms for networked power– Connections to utility grids, local renewables– Price-responsive end-use devices– User interfaces/tools for easy exploration of results
• Initial results– Modeled single, simple nanogrid with 3 tariffs– Cost and energy significantly different from base
case operation– Tariffs drive local price, causing different:
• Use of battery• End–use device operation
– Large shift of load among price periods– Dynamic local prices reduce total energy cost
Established basic principles of networked powerPublished findings in two conference papers
Sample load shapes by scenario
Results include energy and cost at meter

11U.S. DEPARTMENT OF ENERGY OFFICE OF ENERGY EFFICIENCY & RENEWABLE ENERGY
Impact
DC distribution has unique comparative advantages & value proposition• DC can save energy and reduce costs for integrating local generation and storage• DC powering provides non-energy benefits like power quality, safety, and resiliencyProject Impact• Efficiency analysis provides better information about DC system benefits to:
– Document the 5-15% whole-building efficiency gains from Direct DC• Max 2025 savings: 0.7 Quads U.S., 1.5 Q China – Substantial contribution to BTO’s goal
– Encourage manufacturers to introduce new, high-efficiency direct-DC products– Help building owners and designers find the best applications of DC in projects
• Networked DC enables new capabilities that consumers value and improve grid-responsiveness of buildings
• Collaboration between U.S. and China to drive common solutionsHow will impact be realized• Design Tools: Apply models to DC Design Tool (joint project with NREL)• Technology Standards: Incorporate project approach for communications, e.g.
Ethernet (done), USB, new higher-capacity power links (e.g. 380V)• Market Trends: Increasing interest in coupling storage to PV with Direct DC
– Next logical step is coupling end uses to the same DC network
12U.S. DEPARTMENT OF ENERGY OFFICE OF ENERGY EFFICIENCY & RENEWABLE ENERGY
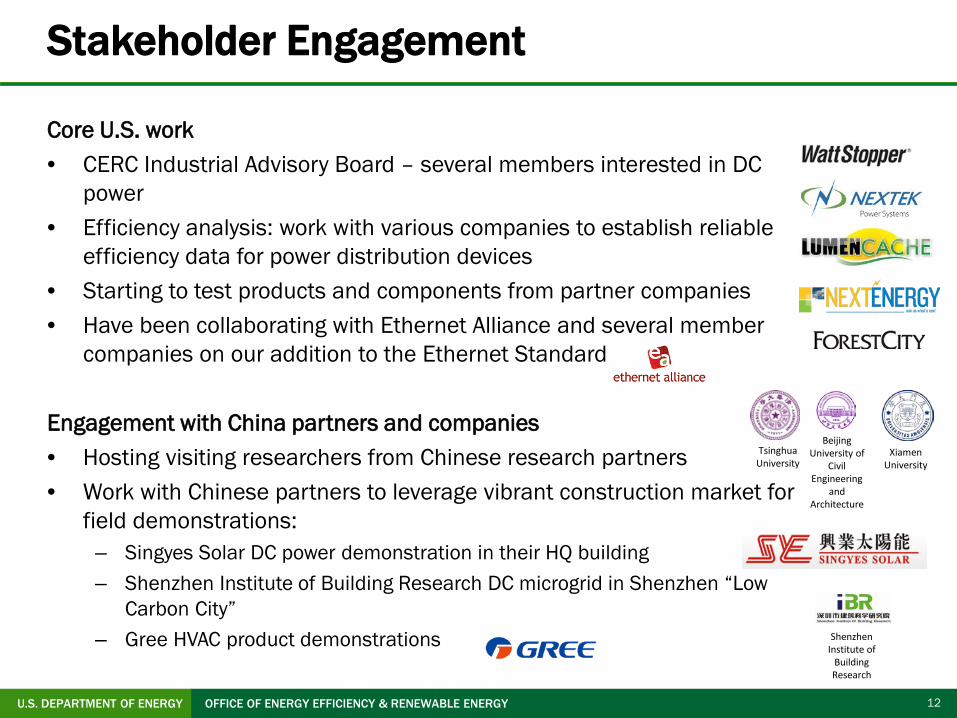
Stakeholder Engagement
Core U.S. work• CERC Industrial Advisory Board – several members interested in DC
power• Efficiency analysis: work with various companies to establish reliable
efficiency data for power distribution devices• Starting to test products and components from partner companies• Have been collaborating with Ethernet Alliance and several member
companies on our addition to the Ethernet Standard
Engagement with China partners and companies• Hosting visiting researchers from Chinese research partners• Work with Chinese partners to leverage vibrant construction market for
field demonstrations:– Singyes Solar DC power demonstration in their HQ building– Shenzhen Institute of Building Research DC microgrid in Shenzhen “Low
Carbon City”– Gree HVAC product demonstrations
Tsinghua University
Beijing University of
Civil Engineering
and Architecture
XiamenUniversity
Shenzhen Institute of
Building Research

13U.S. DEPARTMENT OF ENERGY OFFICE OF ENERGY EFFICIENCY & RENEWABLE ENERGY
Remaining Project Work: Task 1
Validate model through lab measurements of components, devices, and systems
Advise and assist with field demonstrations in China
Seek field test opportunities in U.S.
IIT Chicago AC/DC Microgrid
Gree PhoenixMart DC air conditioning
FlexGrid
Singyes Solar HQ building

14U.S. DEPARTMENT OF ENERGY OFFICE OF ENERGY EFFICIENCY & RENEWABLE ENERGY
Remaining Project Work: Task 2
Use simulation model• Test / improve algorithms
– Grid controllers and end-use devices (& add more)
• Create example scenarios that demonstrate new functionality– Ordinary operation plus utility grid outages– Multiple link technologies (e.g. Ethernet, USB, 380V)– Scale to complex networks
• Quantify energy and other benefits• Begin building hardware to demonstrate concept working in practice
– First, “device simulators” to model any end-use device in electrical consumption– Year 4, nanogrid controller with internal battery
• Work with IEEE and Ethernet Alliance to create awareness of local pricing feature of new Ethernet standard and contribute to development of new Ethernet technologies with buildings and efficiency as primary
– New “Single-pair Ethernet” will be more optimized for power delivery

15U.S. DEPARTMENT OF ENERGY OFFICE OF ENERGY EFFICIENCY & RENEWABLE ENERGY
Thank YouLawrence Berkeley National Laboratory
Wei Feng, Scientist510-486-5156 - [email protected]
Rich Brown, Scientist510-486-5896 – [email protected]
Bruce Nordman, Scientist510-486-7089 – [email protected]

16U.S. DEPARTMENT OF ENERGY OFFICE OF ENERGY EFFICIENCY & RENEWABLE ENERGY
REFERENCE SLIDES

17U.S. DEPARTMENT OF ENERGY OFFICE OF ENERGY EFFICIENCY & RENEWABLE ENERGY
Variances: No variances from original planned budgetCost to Date: 40% of DOE-funded costs have been expended to dateAdditional Funding: No other funding for LBNL, but substantial cost share
Budget History
April 1, 2016– FY 2017(past) FY 2018 (current) FY 2019 – March 31,2021
(planned)
DOE Cost-share DOE Cost-share DOE Cost-share$500,000 $1,325,000 $250,000 $825,000 $500,000 $1,450,000
Project Budget

18U.S. DEPARTMENT OF ENERGY OFFICE OF ENERGY EFFICIENCY & RENEWABLE ENERGY
Project Plan and Schedule• Duration: April 1, 2016 – March 31, 2021• Schedule and Milestones on schedule below• Project is on schedule and on budget