U.S. BARE PRINTED CIRCUIT BOARD INDUSTRY ASSESSMENT
284
BIS/OTE U.S. Bare Printed Circuit Board Industry Assessment Source: U.S. Department of Commerce, Bureau of Industry and Security U.S. Bare Printed Circuit Board Industry Assessment – 2017 U.S. Department of Commerce Bureau of Industry and Security Office of Technology Evaluation U.S. BARE PRINTED CIRCUIT BOARD INDUSTRY ASSESSMENT : For further information about this report, contact: Mark Crawford, Senior Trade & Industry Analyst, (202) 482-8239, [email protected] Stamen Borisson, Trade & Industry Analyst, (202) 482-3893, [email protected] Brad Botwin Director, Industrial Studies Office of Technology Evaluation [email protected] Phone: (202) 482-4060 For more information about the Office of Technology Evaluation, Industrial Base Studies and Section 232 Investigations, please visit: http://www.bis.doc.gov/dib and http://www.bis.doc.gov/232
Transcript of U.S. BARE PRINTED CIRCUIT BOARD INDUSTRY ASSESSMENT

BIS/OTE U.S. Bare Printed Circuit Board Industry Assessment
Source: U.S. Department of Commerce, Bureau of Industry and Security
U.S. Bare Printed Circuit Board Industry Assessment – 2017
U.S. Department of Commerce
Bureau of Industry and Security
Office of Technology Evaluation
U.S. BARE PRINTED CIRCUIT BOARD
INDUSTRY ASSESSMENT:
For further information about this report, contact:
Mark Crawford, Senior Trade & Industry Analyst, (202) 482-8239, [email protected]
Stamen Borisson, Trade & Industry Analyst, (202) 482-3893, [email protected]
Brad Botwin
Director, Industrial Studies
Office of Technology Evaluation
Phone: (202) 482-4060
For more information about the Office of Technology Evaluation, Industrial Base Studies and Section 232 Investigations, please visit:
http://www.bis.doc.gov/dib and http://www.bis.doc.gov/232

BIS/OTE U.S. Bare Printed Circuit Board Industry Assessment
Source: U.S. Department of Commerce, Bureau of Industry and Security
U.S. Bare Printed Circuit Board Industry Assessment – 2017
Table of Contents
Introduction
Chapter 1: Respondent Profile and Organization Information
Chapter 2: Customers and Competitors
Chapter 3: Participation in U.S. Government Programs and U.S. Government
Interactions
Chapter 4: Bare PCB Manufacturing
Chapter 5: Materials and Equipment
Chapter 6: Sales
Chapter 7: Financials
Chapter 8: Research and Development (R&D)
and Capital Expenditures (CAPEX)
Chapter 9: Employment
Chapter 10: Competitive Factors
Chapter 11: Cyber Security
Chapter 12: Challenges and Outreach
2
Page
3
10
27
43
63
114
140
157
168
194
205
229
240

BIS/OTE U.S. Bare Printed Circuit Board Industry Assessment
Source: U.S. Department of Commerce, Bureau of Industry and Security
U.S. Bare Printed Circuit Board Industry Assessment – 2017
Bureau of Industry and Security (BIS)
• BIS Mission:
Advance U.S. national security, foreign policy, and economic
objectives by ensuring an effective export control and treaty
compliance system and promoting continued U.S. strategic
technology leadership
BIS also develops and implements policies and programs that
ensure a strong, technologically superior defense industrial base
• The Office of Technology Evaluation (OTE) is the focal
point within BIS for analyzing the capabilities of the U.S.
industrial base to support the national defense
3

BIS/OTE U.S. Bare Printed Circuit Board Industry Assessment
Source: U.S. Department of Commerce, Bureau of Industry and Security
U.S. Bare Printed Circuit Board Industry Assessment – 2017
4
BIS Industry Surveys & AssessmentsBackground and Authority
• Under Section 705 of the Defense Production Act of 1950 and Executive
Order 13603, ability to survey and assess:
Economic health and competitiveness
Defense capabilities and readiness
• Mandatory data collection authority under Section 705 of the DPA with
data exempt from Freedom of Information Act (FOIA) requests
• Enable industry and government agencies to:
Share data and collaborate in order to ensure a healthy and competitive
industrial base
Monitor trends and benchmark industry performance
Raise awareness of diminishing manufacturing and technological capabilities

BIS/OTE U.S. Bare Printed Circuit Board Industry Assessment
Source: U.S. Department of Commerce, Bureau of Industry and Security
U.S. Bare Printed Circuit Board Industry Assessment – 2017
5
Bare Printed Circuit Board Assessment Sponsor
BIS/OTE, in coordination with the U.S. Department of the
Navy, Naval Surface Warfare Center, Crane Division
(NSWC Crane) conducted an assessment of the U.S. Bare
Printed Circuit Board (PCB) industrial base.

BIS/OTE U.S. Bare Printed Circuit Board Industry Assessment
Source: U.S. Department of Commerce, Bureau of Industry and Security
U.S. Bare Printed Circuit Board Industry Assessment – 2017
Project Background
• BIS/OTE entered in an agreement with the Naval Surface Warfare Center, Crane Division of Naval Sea Systems Command (NAVSEA) in December 2014 to perform an industrial assessment of the U.S. Bare Printed Circuit Board industrial base.
NSWC Crane is the DoD Executive Agent (EA) for printed circuit board technology.
Provides acquisition engineering, in-service, engineering and technical support for sensors, electronics, electronic warfare and special warfare weapons.
NSWC Crane also works to apply component and system-level product and industrial engineering to surface sensors, strategic systems, special warfare devices and electronic warfare/information operations systems.
6

BIS/OTE U.S. Bare Printed Circuit Board Industry Assessment
Source: U.S. Department of Commerce, Bureau of Industry and Security
U.S. Bare Printed Circuit Board Industry Assessment – 2017
Assessment Objectives
7
• To combine NSWC Crane’s technical capabilities with OTE’s survey expertise to
assess the health and competitiveness of U.S. Bare Printed Circuit Board
manufacturers and their supply chain, leverage industry best practices where
applicable, and coordinate development and communication of issues across the
DoD community.
• The following issues were examined, covering the period from 2012 to 2015:
Economic health, competitiveness, and financial performance
Production capabilities and constraints
Participation in U.S. Government programs
Supply chain network, customers and suppliers
Foreign competition, sourcing, and dependencies
Sales and exports
Investment and R&D
Employment and core competencies
Cyber security and counterfeits
Other topics as needed

BIS/OTE U.S. Bare Printed Circuit Board Industry Assessment
Source: U.S. Department of Commerce, Bureau of Industry and Security
U.S. Bare Printed Circuit Board Industry Assessment – 2017
BIS Survey Development
8
• BIS undertook a number of steps to better understand the industry and to design
a survey instrument that captured the programmatic needs of NSWC Crane.
• Specifically, BIS held discussions with NSWC Crane, industry groups and
government organizations to define the scope of technical information beneficial
to the objectives of the assessment.
• Conducted site visits in order to obtain first hand knowledge of the operational
and business practices particular to the Bare PCB industry.
• Additional information was gathered via field testing of the survey instrument with
industry, government, and university experts via telephone and email.
BIS/OTE U.S. Bare Printed Circuit Board Industry Assessment
Source: U.S. Department of Commerce, Bureau of Industry and Security
U.S. Bare Printed Circuit Board Industry Assessment – 2017
9
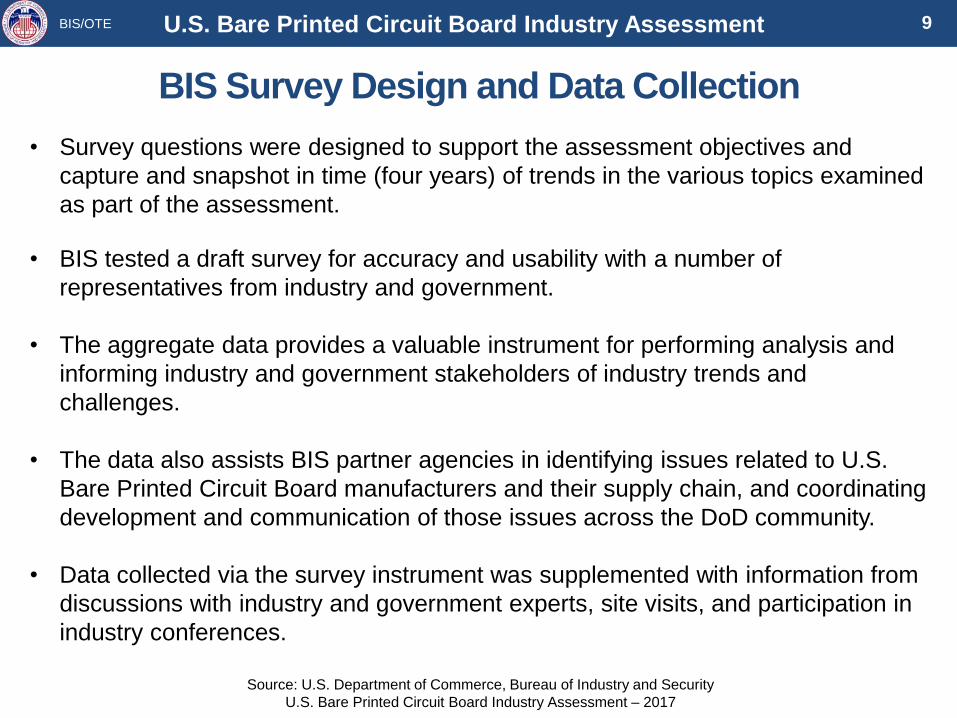
BIS Survey Design and Data Collection
• Survey questions were designed to support the assessment objectives and
capture and snapshot in time (four years) of trends in the various topics examined
as part of the assessment.
• BIS tested a draft survey for accuracy and usability with a number of
representatives from industry and government.
• The aggregate data provides a valuable instrument for performing analysis and
informing industry and government stakeholders of industry trends and
challenges.
• The data also assists BIS partner agencies in identifying issues related to U.S.
Bare Printed Circuit Board manufacturers and their supply chain, and coordinating
development and communication of those issues across the DoD community.
• Data collected via the survey instrument was supplemented with information from
discussions with industry and government experts, site visits, and participation in
industry conferences.

BIS/OTE U.S. Bare Printed Circuit Board Industry Assessment
Source: U.S. Department of Commerce, Bureau of Industry and Security
U.S. Bare Printed Circuit Board Industry Assessment – 2017
CHAPTER 1:
RESPONDENT PROFILE AND
ORGANIZATION INFORMATION
• CATEGORIZATION OF RESPONDENTS
• MANUFACTURING CAPABILITIES
• LOCATIONS OF U.S. BARE PCB MANUFACTURING FACILITIES
• COMMERCIAL AND DEFENSE MARKET SEGMENTS
PARTICIPATON
10

BIS/OTE U.S. Bare Printed Circuit Board Industry Assessment
Source: U.S. Department of Commerce, Bureau of Industry and Security
U.S. Bare Printed Circuit Board Industry Assessment – 2017
Survey Respondent Profile/Organization Information
11
RP/Q7C 202 respondents
142
38
5
146
46
10
0
20
40
60
80
100
120
140
160
Small Medium Large
Number of Companies/Facilities by Bare PCB Sales (2015)
Companies Facilities
Small: < $10M in sales Medium: $10M-$40M in sales Large: > $40M in sales
• 185 companies operate 202 bare printed
circuit board manufacturing facilities in the
U.S. (2015) 5 large companies operate 18 facilities in
the U.S.
• Total 2015 Bare Printed Circuit Board
Sales of $2 Billion
• BIS categorized respondent facilities and
companies as large, medium or small.
Organization size was established based
on the 2015 sales values reported from
bare printed circuit boards manufactured
in the U.S. Large – more than $40M in 2015 bare
PCB sales
Medium – between $10M and $40M in
2015 bare PCB sales
Small – less than $10M in 2015 bare PCB
sales

BIS/OTEBIS/OTE U.S. Bare Printed Circuit Board Industry Assessment 12
Source: U.S. Department of Commerce, Bureau of Industry and Security
U.S. Bare Printed Circuit Board Industry Assessment - 2017
U.S. Bare PCB Facility Capabilities
Respondents: 202
0
20
40
60
80
100
120
140
160
180
200
220
AllFacilities
DefenseEnd Use
AllFacilities
DefenseEnd Use
AllFacilities
DefenseEnd Use
Nu
mb
er
of
Facilit
ies
Manufacturing Services – All U.S. Bare PCB Facilities (2015)
Small <$10M Medium $10M-$40M Large >$40M
6147
PCB Design Bare PCB Manufacturing PCB Assembly
202
145
6148
Q1c,A
All 202 BIS survey respondent facilities reported bare PCB
manufacturing capabilities. Sixty-one facilities reported bare PCB design
capabilities and 61 facilities reported bare PCB assembly capabilities.
Defense End Use
• 145 facilities reported some
level of bare PCB production
and sales attributable to
defense end use. 10 Large
43 Medium
92 Small
• 47 defense end use facilities
reported bare PCB design
capabilities.
• 48 defense end use facilities
reported bare PCB
assembly capabilities.

BIS/OTEBIS/OTE U.S. Bare Printed Circuit Board Industry Assessment 13
Source: U.S. Department of Commerce, Bureau of Industry and Security
U.S. Bare Printed Circuit Board Industry Assessment - 2017
Survey Respondent Profile/Organization InformationFacility Size and Bare PCB Manufacturing Capabilities
Q5a,A 202 respondents
141
8259
44
24
21
10
6
5
0
20
40
60
80
100
120
140
160
180
200
Rigid PCBs Flex PCBs Rigid-Flex PCBs
Nu
mb
er
of
Fa
cil
itie
s
Manufacturing Capabilities – Types of Boards (2015)
Small <$10M Medium $10M-$40M Large >$40M
• 195 facilities reported rigid bare
PCB manufacturing capability 10 Large
44 Medium
141 Small
• 112 facilities reported flex bare
PCB manufacturing capability 6 Large
24 Medium
82 Small
• 85 facilities reported rigid-flex
bare PCB manufacturing
capability 5 Large
21 Medium
59 Small

BIS/OTEBIS/OTE U.S. Bare Printed Circuit Board Industry Assessment 14
Source: U.S. Department of Commerce, Bureau of Industry and Security
U.S. Bare Printed Circuit Board Industry Assessment - 2017
Survey Respondent Profile/Organization Information Bare PCB Manufacturing Capabilities With Defense End-Users
Q 1c,A / Q5aA 145 respondents
88
5547
41
24
21
10
6
5
0
20
40
60
80
100
120
140
Rigid PCBs Flex PCBs Rigid-Flex PCBs
Nu
mb
er
of
Fa
cil
itie
s
Manufacturing Capabilities – Types of Boards Facilities with Defense End Use Applications (2015)
Small <$10M Medium $10M-$40M Large >$40M
145 Facilities with Defense End
Use Production
• 139 facilities reported rigid bare
PCB manufacturing capability 10 Large
41 Medium
88 Small
• 112 facilities reported flex bare
PCB manufacturing capability 6 Large
24 Medium
55 Small
85 facilities reported rigid-flex
bare PCB manufacturing
capability 5 Large
21 Medium
47 Small

BIS/OTEBIS/OTE U.S. Bare Printed Circuit Board Industry Assessment 15
Source: U.S. Department of Commerce, Bureau of Industry and Security
U.S. Bare Printed Circuit Board Industry Assessment - 2017
Survey Respondent Profile/Organization InformationLocations of U.S. Bare PCB Manufacturing Facilities (2015)
Q1a,A 202 respondents
0 10 20 30 40 50 60 70 80
Others
Ohio
Arizona
New Hampshire
Utah
New Jersey
Colorado
Pennsylvania
New York
Wisconsin
Texas
Minnesota
Illinois
California
Number of Facilities
Small <$10M Medium $10M-$40M Large >$40M
Nine Companies Operate
More Than One U.S. Bare
PCB Facility

BIS/OTEBIS/OTE U.S. Bare Printed Circuit Board Industry Assessment 16
Source: U.S. Department of Commerce, Bureau of Industry and Security
U.S. Bare Printed Circuit Board Industry Assessment - 2017
Survey Respondent Profile/Organization InformationLocations of U.S. Bare PCB Manufacturing Facilities (2015)
Q1a,A 202 respondents
Top 10 States
Number of Facilities
CA 70
IL 29
MN 12
TX 11
NY 8
WI 8
PA 7
NH 5
UT 5
NJ 5
CO 5

BIS/OTEBIS/OTE U.S. Bare Printed Circuit Board Industry Assessment 17
Source: U.S. Department of Commerce, Bureau of Industry and Security
U.S. Bare Printed Circuit Board Industry Assessment - 2017
Survey Respondent Profile/Organization InformationU.S. Bare PCB Facilities: Publicly Traded vs. Privately Held
Q1a,C 202 respondents
Privately Held, 180, 89%
Publicly Traded, 22, 11%
Number of U.S. Bare PCB Facilities Belonging to Publicly Traded vs. Privately Held Organizations (2015)

BIS/OTEBIS/OTE U.S. Bare Printed Circuit Board Industry Assessment 18
Source: U.S. Department of Commerce, Bureau of Industry and Security
U.S. Bare Printed Circuit Board Industry Assessment - 2017
Survey Respondent Profile/Organization InformationU.S. Bare PCB Facilities: Types of Business Ownership
142
169
62
2210
0
20
40
60
80
100
120
140
160
Small businessenterprise (asdefined by the
SBA)
8(a) Firm (asdefined by the
SBA)
Historicallyunderutilized
business zone(HUBZone)
Minority-ownedbusiness
Woman-ownedbusiness
Veteran-owned orservice-disabledveteran-owned
business
Nu
mb
er
of
Fa
cil
itie
s
Number of Facilities That Qualify as Any of The Following Types of Business (2015)
*Small Business Administration (SBA)
**A facility can qualify as more than one type of business.
Q1b,C 202 respondents

BIS/OTEBIS/OTE U.S. Bare Printed Circuit Board Industry Assessment 19
Source: U.S. Department of Commerce, Bureau of Industry and Security
U.S. Bare Printed Circuit Board Industry Assessment - 2017
Survey Respondent Profile/Organization Information Percent of Bare PCB Sales with Commercial End Use (2015)
4
1724
33
124
0
20
40
60
80
100
120
140
No CommercialEnd Use Sales
0.01% - 25% 26% - 50% 51% - 75% 76%-100%
Nu
mb
er
of
Fa
cil
itie
s
Percent of Bare Circuit Board Sales
Estimated percentage of bare circuit board sales attributable to COMMERCIAL end use by facility
Q1c,A 202 respondents
98% of facilities reported bare
PCB sales attributable to
commercial end use

BIS/OTEBIS/OTE U.S. Bare Printed Circuit Board Industry Assessment 20
Source: U.S. Department of Commerce, Bureau of Industry and Security
U.S. Bare Printed Circuit Board Industry Assessment - 2017
Survey Respondent Profile/Organization Information Commercial End Use Market Segments (2015)
40
64
71
92
124
129
130
142
157
159
0 20 40 60 80 100 120 140 160 180
Other
Space
Marine (surface andunderwater)
Automotive
Consumer Goods
Aerospace
Computers/BusinessEquipment
Medical/Healthcare
Communications
Industrial Electronics
Number of Facilities
U.S. Bare PCB Facilities – Commercial Market Segments Participation
Q1c,A 202 respondents

BIS/OTEBIS/OTE U.S. Bare Printed Circuit Board Industry Assessment 21
Source: U.S. Department of Commerce, Bureau of Industry and Security
U.S. Bare Printed Circuit Board Industry Assessment - 2017
Survey Respondent Profile/Organization InformationBare PCB Sales Percentages for Specific Commercial Uses
2%
2%
4%
4%
10%
11%
11%
11%
13%
23%
0% 5% 10% 15% 20% 25%
Marine (surface and underwater)
Space
Automotive
Other
Consumer Goods
Aerospace
Computers/Business Equipment
Medical/Healthcare
Communications
Industrial Electronics
Percent of Bare PCB Sales
Co
mm
erc
ial M
ark
et
Se
gm
en
t
U.S. PCB Facilities – Average Estimated % of Bare PCB Sales
Q1c,B 202 respondents

BIS/OTE U.S. Bare Printed Circuit Board Industry Assessment
Source: U.S. Department of Commerce, Bureau of Industry and Security
U.S. Bare Printed Circuit Board Industry Assessment – 2017
Survey Respondent Profile/Organization InformationPercent of Bare PCB Sales Linked to Defense End Use (2015)
57
77
34
18 16
0
10
20
30
40
50
60
70
80
90
No Defense Sales 0.01% - 25% 26% - 50% 51% - 75% 76%-100%
Nu
mb
er
of
Fa
cil
itie
s
Percent of Bare Circuit Board Sales
Estimated percentage of bare circuit board sales attributable to DEFENSE end use by facility
22
Q1c,A 202 respondents
• 145 facilities (72%)
reported defense end use
• 58 facilities consider
themselves dependent on
USG programs for their
continued viability

BIS/OTEBIS/OTE U.S. Bare Printed Circuit Board Industry Assessment 23
Source: U.S. Department of Commerce, Bureau of Industry and Security
U.S. Bare Printed Circuit Board Industry Assessment - 2017
Respondent Profile/Organization Information Defense End Use Market Segments (2015)
26
53
62
64
72
92
99
106
0 50 100 150
Other
Ground Vehicles
Space
Marine (Surface and Underwater)
Missiles
Command, Control, Communications, Computers,Intelligence, Surveillance and Reconnaissance (C4ISR)
Aerospace
Electronics
Number of Facilities
U.S. Bare PCB Facilities – Defense Market Segments Participation
Q1c,A 145 respondents

BIS/OTEBIS/OTE U.S. Bare Printed Circuit Board Industry Assessment 24
Source: U.S. Department of Commerce, Bureau of Industry and Security
U.S. Bare Printed Circuit Board Industry Assessment - 2017
Respondent Profile/Organization Information Bare PCB Sales Percentages for Specific Defense Uses (2015)
3%
3%
4%
4%
8%
9%
15%
19%
0% 5% 10% 15% 20% 25%
Marine (Surface and Underwater)
Ground Vehicles
Space
Other
Missiles
Command, Control, Communications, Computers,Intelligence, Surveillance and Reconnaissance (C4ISR)
Electronics
Aerospace
Percent of Bare PCB Sales
U.S. PCB Facilities – Average Estimated % of Bare PCB Sales
Q1c,B 145 respondents

BIS/OTEBIS/OTE U.S. Bare Printed Circuit Board Industry Assessment 25
Source: U.S. Department of Commerce, Bureau of Industry and Security
U.S. Bare Printed Circuit Board Industry Assessment - 2017
Survey Respondent Profile/Organization Information Defense End Use Market Segments – Comments (2015)
A number of respondents reported having incomplete or no information on the end
uses of the products they make – defense or commercial
• “Most customers are contract manufacturers and we are not informed of product's end use.”
• “We don't have any systematic way of tracking the end use of the boards we sell. They are made to
customer print. We are not told what they are used for.”
• “It is unknown exactly where our PCBs end up when they are shipped to our defense subcontractor
customers. This information is not shared with us by our customers.”
• “All of the USG and defense work we do is done indirectly through our customers. We do not have any
jobs that we do directly with the DOD or USG.”
• “Defense end use throughout this survey is pure speculation. We very rarely (if ever) know what the
end use is.”
• “We do not know end use. This is a estimate. IPC-6012A and MIL-PRF-55110 is only 3% of business.”
Q1c 202 respondents

Source: U.S. Department of Commerce, Bureau of Industry and Security
U.S. Bare Printed Circuit Board Industry Assessment – 2017
BIS/OTE U.S. Bare Printed Circuit Board Industry Assessment
Mergers and Acquisitions / Joint Ventures
Mergers and Acquisitions (M&As)
28 reported mergers and acquisitions since 2012
• 25 with U.S. companies
• 2 with Chinese companies
• 1 with a U.K. company
26
Q2,A/B
1
1
1
4
4
7
10
0 5 10
Access to intellectual property
Bankruptcy restructuring/litigation
Reduce Costs
Other objective/purpose(Explain)
Vertical integration
Develop new capabilities
Broaden customer base
Primary Objective
202 respondents
Joint Ventures (JVs)
8 joint ventures reported
• No data on country of JV entities
• “Other” JV objectives included co-
production and broker partnership
1
1
2
4
0 5 10
Improved access to U.S.markets
Shared/improved technologyor skills
Product improvements
Other objective/purpose
Primary Objective

BIS/OTE U.S. Bare Printed Circuit Board Industry Assessment
Source: U.S. Department of Commerce, Bureau of Industry and Security
U.S. Bare Printed Circuit Board Industry Assessment – 2017
CHAPTER 2:
CUSTOMERS AND COMPETITORS
• TOP CUSTOMERS
• FACTORS IN REJECTING BUSINESS OPPORTUNITIES
• LEADING COMPETITORS
• COMPETITIVE ADVANTAGE: U.S. VS NON-U.S.
27

BIS/OTEBIS/OTE U.S. Bare Printed Circuit Board Industry Assessment 28
Source: U.S. Department of Commerce, Bureau of Industry and Security
U.S. Bare Printed Circuit Board Industry Assessment - 2017
Customers & CompetitorsU.S.-Based Bare Printed Circuit Board Customers
Respondents were asked to identify their top 5 U.S. direct customers by sales for the
period 2012 to 2015, indicating the type of customer, the primary end use, and the
customer location.
• 915 U.S customers were identified Over two-thirds (68 percent) were commercial customers, with almost one-quarter (24
percent) Government Defense customers.
‘Electronics’ was the leading primary end use with 29 percent of responses.
California was the number one state for top U.S. bare PCB customers with 26 percent of
responses.
• 273 Non-U.S customers were identified 82 percent were commercial customers with Government Defense accounting for 10
percent of responses.
‘Electronics’ was the leading primary end use with 30 percent of responses.
Canada, Malaysia, and China were the top reported countries for non-U.S. bare PCB
customers with approximately 14 percent of responses each.

BIS/OTE U.S. Bare Printed Circuit Board Industry Assessment
Source: U.S. Department of Commerce, Bureau of Industry and Security
U.S. Bare Printed Circuit Board Industry Assessment – 2017
Customers & CompetitorsU.S.-Based Bare Printed Circuit Board Customers (2012-2015)
Q3a,C 202 respondents
University/Non-Profit, 5, 1%
Other, 29, 3%
Government Non-Defense,
33, 4%
Government Defense, 222, 24%
Commercial, 626, 68%
Types of U.S. Customers (915 total)
29

BIS/OTE U.S. Bare Printed Circuit Board Industry Assessment
Source: U.S. Department of Commerce, Bureau of Industry and Security
U.S. Bare Printed Circuit Board Industry Assessment – 2017
Customers & Competitors
U.S.- Based Customers By Primary End Use (2012-2015)
Q3a,C 202 respondents
14
6
8
8
10
22
40
41
49
60
68
92
106
124
267
0 50 100 150 200 250 300
No Response
C4ISR
Marine (Surface and Underwater)
Space
Ground Vehicles
Automotive
Missiles
Computers/Business Equipment
Consumer Goods
Medical/Healthcare
Other
Communications
Industrial Electronics
Aerospace
Electronics
Number of Customers
Primary End Uses of Bare Printed Circuit Boards – U.S. Customers
30

BIS/OTE U.S. Bare Printed Circuit Board Industry Assessment
Source: U.S. Department of Commerce, Bureau of Industry and Security
U.S. Bare Printed Circuit Board Industry Assessment – 2017
Customers & CompetitorsU.S.-Based Customers By State (2012-2015)
Q3a,C 202 respondents
15
300
30
33
36
37
39
41
49
49
50
236
0 50 100 150 200 250 300 350
No response
Other (34 States)
Ohio
Pennsylvania
Massachusetts
Wisconsin
Minnesota
Florida
New York
Texas
Illinois
California
Number of Customers
Geographic Locations of Bare Printed Circuit Board Customers in U.S.
31

BIS/OTE U.S. Bare Printed Circuit Board Industry Assessment
Source: U.S. Department of Commerce, Bureau of Industry and Security
U.S. Bare Printed Circuit Board Industry Assessment – 2017
Customers & CompetitorsNon-U.S.-Based Bare Printed Circuit Board Customers (2012-2015)
Q3a,C 202 respondents
Other, 17, 6%
Government Non-Defense, 6, 2%
Government Defense, 27, 10%
Commercial, 223, 82%
Types of Non-U.S. Customers (273 total)
32

BIS/OTE U.S. Bare Printed Circuit Board Industry Assessment
Source: U.S. Department of Commerce, Bureau of Industry and Security
U.S. Bare Printed Circuit Board Industry Assessment – 2017
Customers & CompetitorsNon-U.S. Based Customers By Primary End Use (2012-2015)
Q3a,C 202 respondents
3
1
2
7
8
9
9
21
27
30
35
39
82
0 20 40 60 80 100
No Response
Marine (Surface and Underwater)
Space
Missiles
Consumer Goods
Automotive
Other
Computers/Business Equipment
Communications
Industrial Electronics
Medical/Healthcare
Aerospace
Electronics
Number of Customers
Primary End Uses for Bare Printed Circuit Boards – Non-U.S. Customers
33

BIS/OTE U.S. Bare Printed Circuit Board Industry Assessment
Source: U.S. Department of Commerce, Bureau of Industry and Security
U.S. Bare Printed Circuit Board Industry Assessment – 2017
Customers & CompetitorsNon-U.S. Based Customers By Country (2012-2015)
Q3a,C 202 respondents
3
78
7
7
11
13
14
24
38
38
40
0 10 20 30 40 50 60 70 80 90
No Response
Other (28 countries)
Israel
Italy
Mexico
Singapore
Germany
United Kingdom
China
Malaysia
Canada
Number of Customers
Geographic Locations of Bare Printed Circuit Board Non-U.S. Customers
34

BIS/OTEBIS/OTE U.S. Bare Printed Circuit Board Industry Assessment 35
Source: U.S. Department of Commerce, Bureau of Industry and Security
U.S. Bare Printed Circuit Board Industry Assessment - 2017
Customers & CompetitorsRejected Business Opportunities (2012-2015)
Respondents were asked whether they has rejected any business opportunities due to
any of a number of factors. The leading factor for rejecting business opportunities in
the responses was ‘Complexity of Job.’ Comments received included:
• “Do not posses manufacturing capabilities to produce latest technology complex circuit
boards.”
• “Some board requirements may be beyond our capabilities.”
• “Too high layer count, too tight lines/spaces, exotic materials, etc.”
• “PCB layer count beyond our capabilities.”
• “Need more equipment.”
• “Design at RFQ was beyond process capabilities.”
Other top factors included ‘Customer Credit Rating’ and ‘Insufficient Dollar Value of
Job.’ Respondents reported that they require minimum production and order values to
justify set up and production costs. They also reported facing additional pricing
pressure as potential customers are asking for pricing quotes matching bare PCBs
produced offshore.

BIS/OTE U.S. Bare Printed Circuit Board Industry Assessment
Source: U.S. Department of Commerce, Bureau of Industry and Security
U.S. Bare Printed Circuit Board Industry Assessment – 2017
Customers & CompetitorsRejected Customer Business Opportunities (2012-2015)
11
12
12
15
36
69
72
127
0 50 100 150
Circuit Board Panel Production Run Too Small
Additional Work Not Needed
Other Criteria
Insufficient Order Frequency
Insufficient Dollar Value of Recurring Business Opportunity
Insufficient Dollar Value of Job
Customer Credit Rating
Complexity of Job
Number of Facilities
Factors for Rejecting Business Opportunities
Other criteria included:
Production run too large,
rapid turn around request,
lack of credentials, raw
material shortage, panel size.
Q3a,B 202 respondents
36

BIS/OTE U.S. Bare Printed Circuit Board Industry Assessment
Source: U.S. Department of Commerce, Bureau of Industry and Security
U.S. Bare Printed Circuit Board Industry Assessment – 2017
Customers & CompetitorsFactors for Rejecting Business Opportunities
Q3a,B 202 respondents
Factor for Rejecting Business
OpportunityExplanation
Complexity of Job “Design at RFQ was beyond process capabilities.”
“Do not posses manufacturing capabilities to produce latest technology complex circuit boards.”
“Need more equipment.”
“PCB layer count beyond our capabilities.”
“Some board requirements may be beyond our capabilities.”
“Too high layer count, too tight lines/spaces, exotic materials, etc.”
Customer Credit Rating “Low profit margins require vigilance of credit.”
“Payments upfront, Credit Card or COD is required.”
“Select customers have a poor credit report that makes it risky to extend terms.”
“Customer with bad history of payments.”
Insufficient Dollar Value of Job “Can not afford to do below production cost. They want us to match overseas prices, which is not possible for us.”
“Internal policy of minimum order value and annual revenue targets.”
“Our minimum lot charge is higher than commercial competition due to MIL documentation.”
“Customer requires USA-made at overseas pricing.”
“Customers moving business to cheaper labor countries.”
Insufficient Order Frequency “Many orders are pure prototype with no future requirements.”
Other Criteria “Lacking credentials (e.g., MIL-PRF-31032).”
“Panel count could not be produced within customer's required date.”
“We are not a military approved facility.”
Additional Work Not Needed “Small amount turned away do to lack of quick-turn capacity.”
Circuit Board Panel Production Run
Size
“Request quantity is too small. It does not meet minimum setup requirements.”
37

BIS/OTEBIS/OTE U.S. Bare Printed Circuit Board Industry Assessment 38
Source: U.S. Department of Commerce, Bureau of Industry and Security
U.S. Bare Printed Circuit Board Industry Assessment - 2017
Respondents were asked to identify their leading competitors (U.S. and non-U.S.) in
the manufacture of bare PCBs, their location, and their primary competitive attribute.
• 236 U.S. Competitors ‘Range of Capabilities’ (40 percent) and ‘Price’ (32 percent) were the leading primary
competitive attributes identified.
47 percent of U.S. competitors identified were located in California.
• 253 Non-U.S. competitors ‘Price’ was the dominant primary competitive attribute identified, accounting for 76
percent of responses.
China was the leading location for non-U.S. competitors, accounting for 67 percent of
responses.
Customers & CompetitorsCompetitive Attributes and Geographic Location

BIS/OTE U.S. Bare Printed Circuit Board Industry Assessment
Source: U.S. Department of Commerce, Bureau of Industry and Security
U.S. Bare Printed Circuit Board Industry Assessment – 2017
Customers & CompetitorsTop U.S. Competitors: Key Factors and Geographic Location
Q3b, B 202 respondents
6
8
13
16
36
67
174
216
0 50 100 150 200
Receipt of GovernmentSubsidies
Reliability
Quality
Financing
Delivery Time
Other
Price
Range of Capabilities
Number of Competitors
U.S. Competitors – Primary Competitive Attribute
5
62
10
12
13
14
14
17
25
48
62
254
0 50 100 150 200 250
No Response
Other (16 states)
Arizona
Oregon
Wisconsin
Michigan
Texas
New Hampshire
Minnesota
Colorado
Illinois
California
Number of Competitors
U.S. Competitors – Geographic Location
39

BIS/OTE U.S. Bare Printed Circuit Board Industry Assessment
Source: U.S. Department of Commerce, Bureau of Industry and Security
U.S. Bare Printed Circuit Board Industry Assessment – 2017
Customers & CompetitorsTop Non-U.S. Competitors: Key Factors and Geographic Location
Q3b,B 202 respondents
7
5
6
7
12
24
192
0 50 100 150 200
No Response
Receipt of GovernmentSubsidies
Quality
Delivery Time
Other
Range of Capabilities
Price
Number of Competitors
Non-U.S. Competitors – Primary Competitive Attribute
13
3
5
5
5
6
8
9
9
21
169
0 50 100 150
Other (10 countries)
Mexico
India
Israel
United States
Japan
Switzerland
Canada
South Korea (ROK)
Taiwan
China
Number of Competitors
Non-U.S. Competitors – Geographic Location
(20 countries)
40

BIS/OTEBIS/OTE U.S. Bare Printed Circuit Board Industry Assessment 41
Source: U.S. Department of Commerce, Bureau of Industry and Security
U.S. Bare Printed Circuit Board Industry Assessment - 2017
Respondents were asked to indicate whether bare PCB manufacturers inside the U.S.
or outside the U.S. possess the competitive advantage for a list of factors.
According to respondents, U.S. bare PCB manufacturers possess the comparative
advantage in: • Lead Time
• Quality
• Performance
According to respondents, non-U.S. bare PCB manufacturers possess the
comparative advantage in various costs which results in lower finished bare PCB
prices:• Labor Costs
• Material Costs
• Equipment Costs
• Environmental Compliance Costs
• Building Space Costs
• R&D Costs
Customers & CompetitorsCompetitive Advantage: U.S. vs. non-U.S. (2015)

BIS/OTE U.S. Bare Printed Circuit Board Industry Assessment
Source: U.S. Department of Commerce, Bureau of Industry and Security
U.S. Bare Printed Circuit Board Industry Assessment – 2017
Customers & CompetitorsCompetitive Advantage: U.S. vs. non-U.S. (2015)
12
13
14
15
16
17
18
27
36
65
67
68
75
100
119
120
11
24
42
22
50
14
20
66
64
38
57
68
42
37
25
24
3
8
22
8
6
2
7
12
10
5
22
23
13
26
29
19
2
14
6
5
16
5
14
16
6
16
16
18
16
16
15
13
174
143
118
152
114
164
143
81
86
78
40
25
56
23
14
26
0 50 100 150 200
Labor Costs
Reduced Cost
Equipment Costs
Material Costs
Building Space Costs
Overall Finished Board Price
Environmental Compliance Costs
R&D Costs
Export Controls
Safety Requirements
Reduced Process Variability
Increased Yield
Supply of Skilled Workers
Performance
Quality
Lead Time
Number of Responses
U.S. Unknown None N/A Non-U.S.
Q3b,A 202 Respondents
42

BIS/OTE U.S. Bare Printed Circuit Board Industry Assessment
Source: U.S. Department of Commerce, Bureau of Industry and Security
U.S. Bare Printed Circuit Board Industry Assessment – 2017
CHAPTER 3:
PARTICIPATION IN U.S. GOVERNMENT
PROGRAMS AND U.S. GOVERNMENT
INTERACTIONS
• U.S. GOVERNMENT AGENCY SUPPORT AND PROGRAM
IDENTIFICATION
• U.S. GOVERNMENT INTERACTIONS – DEPENDENCE ON USG
BUSINESS AND MANUFACTURING LINES INTEGRATION
• IMPACTS OF CHANGE IN USG DEFENSE DEMAND
43
BIS/OTE U.S. Bare Printed Circuit Board Industry Assessment
Source: U.S. Department of Commerce, Bureau of Industry and Security
U.S. Bare Printed Circuit Board Industry Assessment – 2017
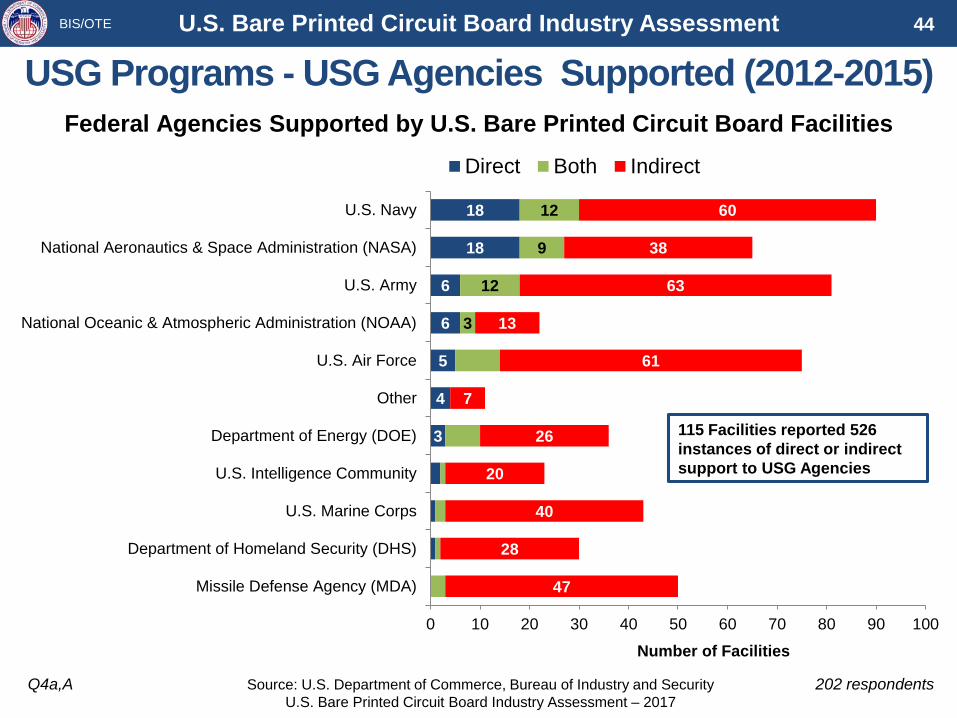
USG Programs - USG Agencies Supported (2012-2015)
Q4a,A 202 respondents
3
4
5
6
6
18
18
3
12
9
12
47
28
40
20
26
7
61
13
63
38
60
0 10 20 30 40 50 60 70 80 90 100
Missile Defense Agency (MDA)
Department of Homeland Security (DHS)
U.S. Marine Corps
U.S. Intelligence Community
Department of Energy (DOE)
Other
U.S. Air Force
National Oceanic & Atmospheric Administration (NOAA)
U.S. Army
National Aeronautics & Space Administration (NASA)
U.S. Navy
Number of Facilities
Direct Both Indirect
115 Facilities reported 526
instances of direct or indirect
support to USG Agencies
Federal Agencies Supported by U.S. Bare Printed Circuit Board Facilities
44

BIS/OTE U.S. Bare Printed Circuit Board Industry Assessment
Source: U.S. Department of Commerce, Bureau of Industry and Security
U.S. Bare Printed Circuit Board Industry Assessment – 2017
USG Programs USG Agencies Relying on U.S. PCB Facilities (2012-2015)
• 202 U.S. Bare PCB
manufacturing facilities
estimated that they
have directly or
indirectly supported
3,615 USG programs
since 2012:
• Survey respondents
identified 512 specific
USG programs.
Q4a,B 202 respondents
7
19
21
32
100
120
139
0 50 100 150
Other
U.S. Marine Corps
NASA - National Aeronautics& Space Administration
MDA - Missile DefenseAgency
U.S. Army
U.S. Navy
U.S. Air Force
Number of Facilities
Top USG Agencies Identified for 512 Programs
45

BIS/OTE U.S. Bare Printed Circuit Board Industry Assessment
Source: U.S. Department of Commerce, Bureau of Industry and Security
U.S. Bare Printed Circuit Board Industry Assessment – 2017
USG Programs Government Systems Using U.S. Bare PCBs (2012-2015)
46
Q4a,B 65 respondents
8
8
10
11
12
17
0 5 10 15 20
F-15 Aircraft
Space Fence
Air and Missile Defense Radar (AMDR)
Patriot Missile
Long Range Discrimination Radar (LRDR)
Joint Strike Fighter (JSF)
Number of Facilities
Top USG Programs Identified
Over 300 Systems Utilize U.S. Bare Printed Circuit Boards

BIS/OTE U.S. Bare Printed Circuit Board Industry Assessment
Source: U.S. Department of Commerce, Bureau of Industry and Security
U.S. Bare Printed Circuit Board Industry Assessment – 2017
USG Programs Bare PCB Products Supporting USG Systems (2012-2015)
400
144
233
0
50
100
150
200
250
300
350
400
450
Rigid Flex Rigid-Flex
Nu
mb
er
of
Re
sp
on
se
s
Types of Bare PCBs Manufactured By U.S. Facilities for 512 USG Programs
Q4a,B 202 respondents
47

BIS/OTE U.S. Bare Printed Circuit Board Industry Assessment
Source: U.S. Department of Commerce, Bureau of Industry and Security
U.S. Bare Printed Circuit Board Industry Assessment – 2017
USG ProgramsMechanisms for Obtaining U.S. Government Business (2012-2015)
2
9
13
53
62
63
0 10 20 30 40 50 60 70
DOD Queries
Federal Web Site
N/A
Word of Mouth
Prime Contractors
Other
Number of Facilities
Primary Methods Used to Find USG Business Opportunities
Q3a,A 202 respondents
Other includes: Sales Teams (Inside and
Outside), Advertisement (Print and Internet),
Do not seek USG business opportunities
48

BIS/OTE U.S. Bare Printed Circuit Board Industry Assessment
Source: U.S. Department of Commerce, Bureau of Industry and Security
U.S. Bare Printed Circuit Board Industry Assessment – 2017
U.S. Air Force
75 Respondents
49
75 U.S. Bare PCB facilities reported providing support to USAF (2012-2015)
47 facilities reported dependence on U.S. Government for their continued viability
Reported roughly 53% / 47% commercial end-use / defense end-use sales split
322
46
4
Financial Risk Rating
High/Severe Risk
Moderate/Elevated Risk
Low/Neutral Risk
Uncalculated
1
2
5
13
23
31
0 10 20 30 40
Contraction
Other
Potential Closure
None
Expansion
Modernization
# of Facilities
Primary Expected Change in Operations 2016-2020
37
30
8
Bare PCB Facility Size by Annual Sales (2015)
Small <$10M
Medium $10M-$40M
Large >$40M
Top USAF Programs Supported :
• Joint Strike Fighter • JASSM
• Paveway • APKWS
• AMRAAM • F-16
• SDB • ATFLIR
• MEADS • F-22
• F-15 • F-35
• Space Fence

BIS/OTE U.S. Bare Printed Circuit Board Industry Assessment
Source: U.S. Department of Commerce, Bureau of Industry and Security
U.S. Bare Printed Circuit Board Industry Assessment – 2017
U.S. NAVY
90 U.S. Bare PCB facilities reported providing support to the U.S. Navy (2012-2015)
47 facilities reported dependence on U.S. Government for their continued viability
Reported roughly 58% / 42% commercial end-use / defense end-use sales split
4834
8
Bare PCB Facility Size by Annual Sales (2015)
Small <$10M
Medium $10M-$40M
Large >$40M
2
2
6
18
25
37
0 10 20 30 40
Contraction
Other
Potential Closure
None
Expansion
Modernization
# of Facilities
Primary Expected Change in Operations 2016-2020
327
57
3
Financial Risk Rating
High/Severe Risk
Moderate/Elevated Risk
Low/Neutral Risk
Uncalculated
U.S. Navy Programs Supported Include:• AMDR • Naval Undersea Warfare Center
• AGR4 • NLOS Missiles
• F-18 • P8A Poseidon
• F35 Joint Strike Fighter • SM2
• JDAMs • Spy3
• MK48 • Standard Missile SM-3
• NAVAL RESEARCH LAB • TPY-53
50

BIS/OTE U.S. Bare Printed Circuit Board Industry Assessment
Source: U.S. Department of Commerce, Bureau of Industry and Security
U.S. Bare Printed Circuit Board Industry Assessment – 2017
U.S. ARMY
81 U.S. Bare PCB facilities reported providing support to the U.S. Army (2012-2015)
45 facilities reported dependence on U.S. Government for their continued viability
Reported roughly 55% / 45% commercial end-use / defense end-use sales split
4130
10
Bare PCB Facility Size by Annual Sales (2015)
Small <$10M
Medium $10M-$40M
Large >$40M
2
2
4
15
27
31
0 10 20 30 40
Contraction
Other
Potential Closure
None
Expansion
Modernization
# of Facilities
Primary Expected Change in Operations 2016-2020
323
51
4
Financial Risk Rating
High/Severe Risk
Moderate/Elevated Risk
Low/Neutral Risk
Uncalculated
U.S. Army Programs Supported Include:• Abrams ECP1 • JAVELIN
• AH-64 Apache • KIV-77
• BLACKHAWK • Manpack
• Enhanced Night Vision Goggles • Missile Defense
• ENVG • PAC-3
• Excalibur • Patriot
• Falcon II / III • THAAD
• GMLRS • Tomahawk
51
BIS/OTE U.S. Bare Printed Circuit Board Industry Assessment
Source: U.S. Department of Commerce, Bureau of Industry and Security
U.S. Bare Printed Circuit Board Industry Assessment – 2017
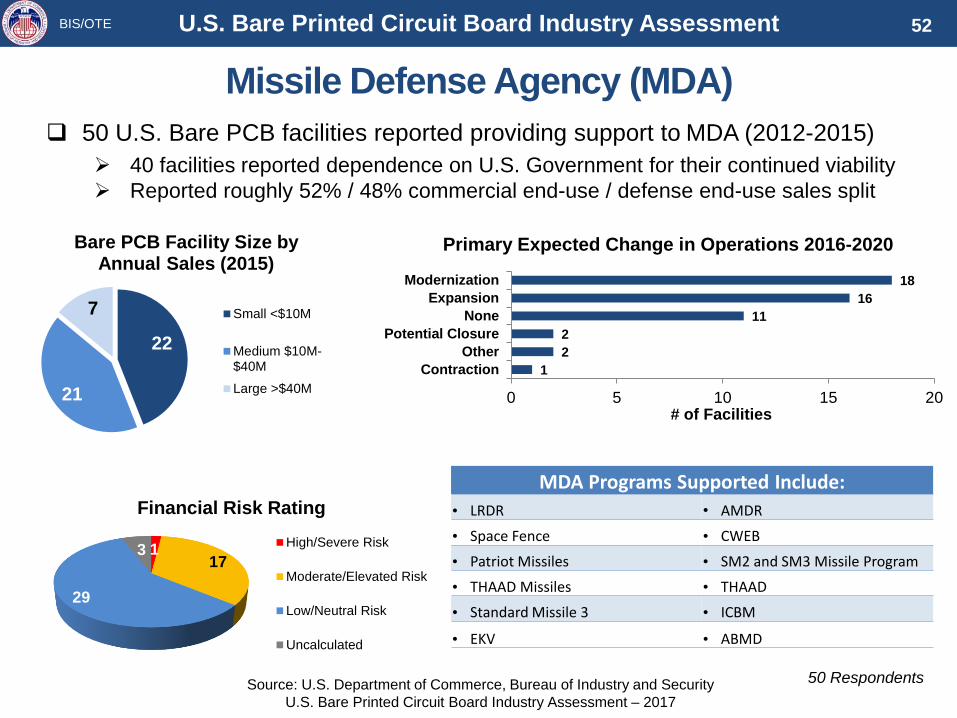
Missile Defense Agency (MDA)
50 Respondents
52
50 U.S. Bare PCB facilities reported providing support to MDA (2012-2015)
40 facilities reported dependence on U.S. Government for their continued viability
Reported roughly 52% / 48% commercial end-use / defense end-use sales split
117
29
3
Financial Risk Rating
High/Severe Risk
Moderate/Elevated Risk
Low/Neutral Risk
Uncalculated
1
2
2
11
16
18
0 5 10 15 20
Contraction
Other
Potential Closure
None
Expansion
Modernization
# of Facilities
Primary Expected Change in Operations 2016-2020
22
21
7
Bare PCB Facility Size by Annual Sales (2015)
Small <$10M
Medium $10M-$40M
Large >$40M
MDA Programs Supported Include:
• LRDR • AMDR
• Space Fence • CWEB
• Patriot Missiles • SM2 and SM3 Missile Program
• THAAD Missiles • THAAD
• Standard Missile 3 • ICBM
• EKV • ABMD

BIS/OTE U.S. Bare Printed Circuit Board Industry Assessment
Source: U.S. Department of Commerce, Bureau of Industry and Security
U.S. Bare Printed Circuit Board Industry Assessment – 2017
National Aeronautics and Space Administration (NASA)
65 Respondents
53
65 U.S. Bare PCB facilities reported providing support to NASA (2012-2015)
40 facilities reported dependence on U.S. Government for their continued viability
Reported roughly 55% / 45% commercial end-use / defense end-use sales split
220
40
3
Financial Risk Rating
High/Severe Risk
Moderate/Elevated Risk
Low/Neutral Risk
Uncalculated
1
2
4
9
21
28
0 5 10 15 20 25 30
Contraction
Other
Potential Closure
None
Expansion
Modernization
# of Facilities
Primary Expected Change in Operations 2016-2020
3423
8
Bare PCB Facility Size by Annual Sales (2015)
Small <$10M
Medium $10M-$40M
Large >$40M
NASA Programs Supported Include:• SLS • Atlas 4
• JUDY FLEX J1-001 • Space Cube
• JUDY FLEX J3-001 • Mars Pathfinder
• SDO • Mars Curosity
• JSWST • Mars Rover
• Dragon Capsule • AEHF
• Orion Crew Vehicle • GEOS
• MSL Rover

BIS/OTEBIS/OTE U.S. Bare Printed Circuit Board Industry Assessment 54
Source: U.S. Department of Commerce, Bureau of Industry and Security
U.S. Bare Printed Circuit Board Industry Assessment - 2017
USG InteractionsUSG Dependence and Manufacturing Lines Integration
Respondents were asked to indicate whether they consider themselves dependent on
USG programs for their continued viability. Additionally, if the facility supported USG
programs, respondents were asked to state whether the associated manufacturing
lines were integrated with, or separate from its commercial manufacturing lines.
58 facilities (29 percent) considered themselves dependent on USG programs.• This included facilities whose customers are the USG or USG contractors.
• Respondent feedback suggested that U.S. bare PCB manufacturing facilities that support
the USG have become increasingly dependent on USG programs. As PCB commercial
business has shifted offshore, and as U.S. bare PCB manufacturers have become less
competitive globally in terms of pricing, USG and defense-related business has become
responsible for a greater proportion of sales.
Almost all of the respondents (119 facilities) replied that both commercial and USG
programs manufacturing lines are integrated. Only two facilities stated that they run
segregated manufacturing lines.• Respondent feedback expresses that running segregated manufacturing lines would be
cost prohibitive and inefficient. Many facilities, particularly smaller ones, lack the
equipment to run separate manufacturing lines.

BIS/OTE U.S. Bare Printed Circuit Board Industry Assessment
Source: U.S. Department of Commerce, Bureau of Industry and Security
U.S. Bare Printed Circuit Board Industry Assessment – 2017
USG InteractionsFacility Dependence on USG Business (2015)
Does this facility consider itself dependent on U.S. Government programs
for its continued viability?
Q4b,A 202 respondents
58
142
20
20
40
60
80
100
120
140
160
Facilities Dependent No N/A
Nu
mb
er
of
Fa
cil
itie
s
Bare PCB Facilities Dependent on U.S. Government
“Beyond U.S.
Government programs,
we are focused in
growing other markets
and applications.”
“Not dependent on U.S.
Government programs
but would like to engage
in additional U.S.
Government business.”
“35% of our business comes from U.S.
Government contracts. It would difficult
to survive without it.
“Absolutely - without our defense work,
this facility would not be viable.”
“As a company whose end customer
base is primarily military prime
contractors, our existence revolves
around USG programs.”
“As commercial business has moved off
shore we have increased reliance on
USG business.”
“Cannot compete in the commercial
market because of Asian pricing.”
“There is no longer enough commercial
work within the U.S. We depend on
defense-based programs to keep viable.”
55

BIS/OTE U.S. Bare Printed Circuit Board Industry Assessment
Source: U.S. Department of Commerce, Bureau of Industry and Security
U.S. Bare Printed Circuit Board Industry Assessment – 2017
USG InteractionsCommercial and USG Manufacturing Lines Integration (2015)
If this facility's bare circuit board manufacturing supports USG programs,
whether directly or indirectly, are the associated manufacturing lines
integrated with, or separate from, its commercial manufacturing lines?
Q4b,A
119
2
81
0
20
40
60
80
100
120
140
Integrated Separate N/A
Nu
mb
er
of
Fa
cil
itie
s
Manufacturing Line Integration for Commercial, USG Bare PCBs
202 Respondents
“All product is treated with the same process equipment
and process control standards.”
“Commercial and USG programs run on the same
manufacturing equipment/lines.”
“Just one manufacturing line. Different classes have
different test requirements.”
“Products covered by ITAR are kept segregated, but
same lines are utilized.”
“Running segregated manufacturing lines for different
end users …would increase cost.”
“The same capital equipment is used for flex circuit
manufacturing, regardless of end market.”
“We manufacture with a single processing guideline
with is associated with the IPC 600 guideline.”
“Our size does not allow us to separate our
manufacturing.”
56

BIS/OTE U.S. Bare Printed Circuit Board Industry Assessment
Source: U.S. Department of Commerce, Bureau of Industry and Security
U.S. Bare Printed Circuit Board Industry Assessment – 2017
USG InteractionsEffects of Change in USG Defense Demand (2015)
Respondents were asked to identify the impacts on a number of business operations that a sudden change in
direct and/or indirect USG demand for electronic product containing bare PCBs would have. Responses were
provided for both the scenarios of a sudden increase and a sudden decrease in USG defense demand.
Q4b,B 202 Respondents
• The greatest impact of a sudden increase in USG demand would be an increase in participation in USG
contracts, capital and research and development expenditures, level of key production equipment, increase
in skilled personnel, and improving organizational viability.
• A sudden decrease in USG demand would reduce industry participation in USG contracts, reduce capital
and research and development expenditures, decrease skilled personnel, and have a negative effect on
organizational viability/solvency. Additionally, it would likely result in increased product/service costs for a
number of U.S. bare PCB manufacturers.
Business OperationDecrease Increase Increase Decrease
66 2 Capital Expenditures 105 1
48 5 Research & Development Expenditures 62 1
70 3 Participation in USG Contracts 105 2
16 50 Product/Service Costs 40 37
50 6 Organization Viability/Solvency 75 6
46 2 Personnel with Key Skills 94 2
26 4 Number of Product/Service Lines 67 1
3 32 Pursuit of Non-U.S. Customers 7 23
30 2 Level of Key Production Equipment 97 3
6 8 Movement of Operations to Non-U.S. Locations 7 5
167 172
170 102
188 190
146 121
154 106
172 134
149 139
129 95
136 125
Impact of sudden DECREASE in USG Defense Demand Impact of sudden INCREASE in USG Defense DemandNo Change or N/A No Change or N/A
128 96
57

BIS/OTE U.S. Bare Printed Circuit Board Industry Assessment
Source: U.S. Department of Commerce, Bureau of Industry and Security
U.S. Bare Printed Circuit Board Industry Assessment – 2017
Q4b,B 202 respondents
• “A decrease in USG demand would drive companies presently engaged in supporting
USG programs to compete in our niche. An increase in USG demand for printed circuits
would create opportunities for the entire U.S. manufacturing base.”
• “Greatest impact from a sudden decrease would be from competitors with higher
dependence on government spending. They would try to take business from each other
and us, by undercutting in last attempt to stay alive. This could result in short term
profitability hit to the entire industry, and jeopardize the U.S. infrastructure.”
• “If the USG decreases demand suddenly it will affect raw material and supply pricing for
the whole industry in a negative manner. If the USG increased its need to buy PCBs
suddenly we may find our facility doing more USG work if our services were needed.”
• “The trickle-down effect of DOD/Homeland Security spending is significant to the printed
circuit board supply chain and participants.”
Impact of USG Demand Change Industry Comments:
58

BIS/OTE U.S. Bare Printed Circuit Board Industry Assessment
Source: U.S. Department of Commerce, Bureau of Industry and Security
U.S. Bare Printed Circuit Board Industry Assessment – 2017
Q4b,B 202 Respondents
INDUSTRY COMMENTS:
“CapEx primarily dependent on overall business levels.”
“Dependent on level of increase.”
“Dependent on size of increase; May need additional equipment for production.”
“Only legacy and as-needed equipment would be replaced.”
“Our current capital budget would be little influenced by the types of jobs we know are tied to the USG.”
“We adjust our Capex plans based on demand.”
“Decrease would impact ability to invest. Increase may increase Cap Ex but not typically.”
Impact of USG Demand Change Capital Expenditures (CAPEX)
A change in USG demand would have an effect on industry CAPEX, with an increase in USG
demand having a higher impact than a decrease. Over half of respondents (52 percent) stated
that their CAPEX would rise with increased USG demand, compared to 32 percent stating that
their CAPEX would be reduced with decreased USG demand.
Business OperationDecrease Increase Increase Decrease
66 2 Capital Expenditures 105 1
Impact of sudden DECREASE in USG Defense Demand Impact of sudden INCREASE in USG Defense DemandNo Change or N/A No Change or N/A
128 96
59

BIS/OTE U.S. Bare Printed Circuit Board Industry Assessment
Source: U.S. Department of Commerce, Bureau of Industry and Security
U.S. Bare Printed Circuit Board Industry Assessment – 2017
Q4b,B 202 Respondents
INDUSTRY COMMENTS:
• “Internal independent research and development (IRAD) would follow the business case.”
• “Our development efforts would increase as we are targeting the defense market for long term revenue
and profitability.”
• “R&D investment is done based on the need.”
• “[Increased USG] spending results in more complex products which require R&D.”
• “We do not have an R&D budget.”
Impact of USG Demand Change Industry Comments: Research and Development Expenditures
Business OperationDecrease Increase Increase Decrease
48 5 Research & Development Expenditures 62 1
Impact of sudden DECREASE in USG Defense Demand Impact of sudden INCREASE in USG Defense DemandNo Change or N/A No Change or N/A
149 139
A change in USG demand would impact industry R&D expenditures, with an increase in USG
demand having a slightly higher impact than a decrease. Thirty percent of respondents stated
that their R&D expenditures would rise with increased USG demand, compared to 24 percent
stating that their R&D expenditures would be reduced as a result of decreased USG demand.
60

BIS/OTE U.S. Bare Printed Circuit Board Industry Assessment
Source: U.S. Department of Commerce, Bureau of Industry and Security
U.S. Bare Printed Circuit Board Industry Assessment – 2017Q4b,B 202 Respondents
INDUSTRY COMMENTS:
• “Dependent on size of increase.”
• “Every bit of business helps.”
• “Increase in production will increase viability.”
• “Mil / Aero / Defense is very important to this facility.”
• “Our commercial based customers would suffer.”
• “We would anticipate less price pressure on the parts we are building.”
• “Depends on level of demand change; depth of decrease.”
• “If not profitable because of loss of volume, the company fails.”
• “The integrity of the organization could be challenged.”
Impact of USG Demand Change Industry Comments: Organizational Viability/Solvency
Business OperationDecrease Increase Increase Decrease
50 6 Organization Viability/Solvency 75 6
Impact of sudden DECREASE in USG Defense Demand Impact of sudden INCREASE in USG Defense DemandNo Change or N/A No Change or N/A
146 121
A change in USG demand would impact organizational viability/solvency in the industry, with an increase in
USG demand having a slightly higher impact than a decrease. Thirty-seven percent of respondents stated that
their organizational viability/solvency would improve with increased USG demand, compared to 25 percent
stating that their organizational viability/solvency would be reduced as a result of decreased USG demand.
61

BIS/OTE U.S. Bare Printed Circuit Board Industry Assessment
Source: U.S. Department of Commerce, Bureau of Industry and Security
U.S. Bare Printed Circuit Board Industry Assessment – 2017
Q4b,B 202 Respondents
INDUSTRY COMMENTS:
• “Capital purchases for capacity.”
• “May need additional equipment for technology or production.”
• “Our current capital budget would be little influenced by the types of jobs tied to the USG.”
• “When profitable upgrades can be invested in.”
• “Possibly would increase [equipment requirements] depending on the increase.”
• “Same equipment. No changes.”
• “Short term capacity utilization would be impacted.”
Impact of USG Demand Change Industry Comments: Level of Key Production Equipment
Business OperationDecrease Increase Increase Decrease
30 2 Level of Key Production Equipment 97 3
Impact of sudden DECREASE in USG Defense Demand Impact of sudden INCREASE in USG Defense DemandNo Change or N/A No Change or N/A
170 102
A change in USG demand would impact industry levels of key production equipment, with an increase in USG
demand having a higher impact than a decrease. Forty-eight percent of respondents stated that their levels of
key production equipment would increase with increased USG demand, compared to 15 percent stating that
their levels of key production equipment would decrease as a result of decreased USG demand.
62

BIS/OTE U.S. Bare Printed Circuit Board Industry Assessment
Source: U.S. Department of Commerce, Bureau of Industry and Security
U.S. Bare Printed Circuit Board Industry Assessment – 2017
CHAPTER 4:
BARE PCB MANUFACTURING
• MANUFACTURING CAPABILITIES
• MANUFACTURING STANDARDS
• MANUFACTURING PRODUCTION AND CAPACITY
63

BIS/OTE U.S. Bare Printed Circuit Board Industry Assessment
Source: U.S. Department of Commerce, Bureau of Industry and Security
U.S. Bare Printed Circuit Board Industry Assessment – 2017
Facility Manufacturing Capabilities
Types of Boards: Tin Lead/Lead Free (2015)
64
Q5a,A 202 respondents
3
15
184
0 50 100 150 200
Tin-Lead Only
Lead Free Only
Both Tin-Lead and Lead-Free
Number of Facilities
U.S. Bare PCB Facilities Manufacturing Capabilities

BIS/OTE U.S. Bare Printed Circuit Board Industry Assessment 65
Source: U.S. Department of Commerce, Bureau of Industry and Security
U.S. Bare Printed Circuit Board Industry Assessment – 2017Q5a,A 202 respondents
0 25 50 75 100 125 150 175 200
Integrated Circuit Package Substrates
Flexible Microwave Boards
Flexible High Speed Boards
Flexible High Frequency Boards
Rigid-Flex Hybrid Boards
Flexible Multilayer Boards
Flexible Conventional Boards (single-sided or double-sided)
Rigid Microwave Boards
Rigid High Frequency Boards
Rigid High Speed Boards
Rigid Multilayer Boards
Rigid Conventional Boards (single-sided or double-sided)
Number of Facilities
U.S. Bare PCB Manufacturing Capabilities – Types of Boards (2015)
Tin-Lead Only Lead-Free Only Both Tin-Lead and Lead-Free
Facility Manufacturing Capabilities

BIS/OTE U.S. Bare Printed Circuit Board Industry Assessment
Source: U.S. Department of Commerce, Bureau of Industry and Security
U.S. Bare Printed Circuit Board Industry Assessment – 2017
Facility Manufacturing CapabilitiesMinimum Bare PCB Inner Layer (Core) Thickness (2015)
66
Q5a,B 202 respondents
2
18
48
42
31
1922
20
0
10
20
30
40
50
60
N/A Less than0.001"
0.001" 0.002" 0.003" 0.004" 0.005" More than0.005"
Nu
mb
er
of
Fa
cil
itie
s
What is the minimum inner layer (core) thickness of circuit board components that this facility can produce?

BIS/OTE U.S. Bare Printed Circuit Board Industry Assessment
Source: U.S. Department of Commerce, Bureau of Industry and Security
U.S. Bare Printed Circuit Board Industry Assessment – 2017
Facility Manufacturing Capabilities Maximum Bare PCB Thickness (2015)
67
Q5a,B 202 respondents
17 7
12
175
0
20
40
60
80
100
120
140
160
180
200
N/A Less than 0.01" 0.01" 0.02" More than 0.02"
Nu
mb
er
of
Fa
cil
itie
s
What is the maximum bare circuit board thickness that this facility can achieve?

BIS/OTE U.S. Bare Printed Circuit Board Industry Assessment
Source: U.S. Department of Commerce, Bureau of Industry and Security
U.S. Bare Printed Circuit Board Industry Assessment – 2017
Facility Manufacturing Capabilities – Printed Electronics (PE)
68
Q5a,C 202 respondents
5
3
7
2
1 1
4
2
1 1
0
1
2
3
4
5
6
7
8
Commercial Government Defense Government Non-Defense
Other University/Non-Profit
Nu
mb
er
of
Fa
cil
itie
s
PE Full Production PE Limited Production PE R&D Only
• Twenty-seven Bare PCB facilities manufacture printed electronics (PE) (2015)
"Printed Electronics" refers to the use of additive printing methods on flexible substrates such as
plastic, paper, epoxy-fiberglass, textiles, and other electronic devices such as discrete electronic
components, sensors, and others.

BIS/OTE U.S. Bare Printed Circuit Board Industry Assessment
Source: U.S. Department of Commerce, Bureau of Industry and Security
U.S. Bare Printed Circuit Board Industry Assessment – 2017
Facility Manufacturing Capabilities
Printed Electronics (PE): Comments
Commercial Government DefenseGovernment Non-
Defense
University /
Non-Profit
Full
Production
• Automotive Actuators, Resistive
Circuitry
• Flexible PE from bare to
assembly (medical devices and
equipment)
• Printing on copper and fiberglass
• Print conductive ink on plastic
films (automotive, medical, and
commercial)
• PE to defense,
medical, and
aerospace industries
• RF Electronics
Limited
Production
• Flex components/Thin FR 4
• Developing new additive
technology called [Redacted]
• Epoxy
Fiberglass/Polyimide
(Military)
• Thick film resistors
• Embedded resistors and
resistive etch capabilities
(commercial/non-
defense)
R&D Only
• Prototype Projects
• R&D Development for customers
(touch panels, wearables)
• Evaluating eSurface
process (R&D for
OEMs)
• Advanced PE
Development (for DoD
systems)
• Prototypes
(consortia for
future
applications)
69
Q5a,C 202 respondents
BIS/OTE U.S. Bare Printed Circuit Board Industry Assessment
Source: U.S. Department of Commerce, Bureau of Industry and Security
U.S. Bare Printed Circuit Board Industry Assessment – 2017
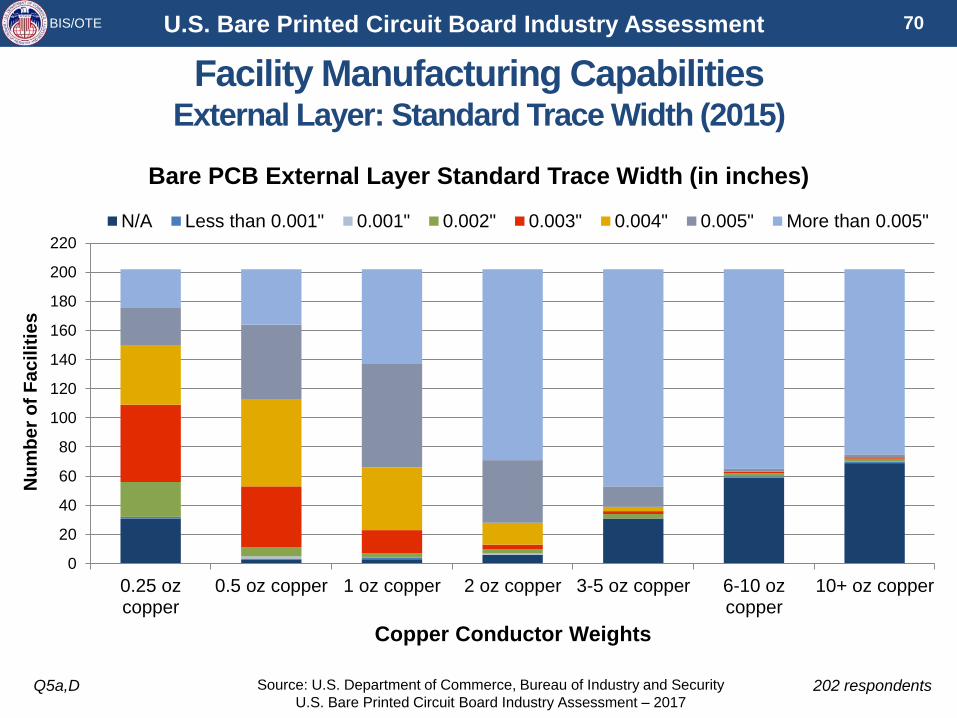
Facility Manufacturing CapabilitiesExternal Layer: Standard Trace Width (2015)
0
20
40
60
80
100
120
140
160
180
200
220
0.25 ozcopper
0.5 oz copper 1 oz copper 2 oz copper 3-5 oz copper 6-10 ozcopper
10+ oz copper
Nu
mb
er
of
Fa
cil
itie
s
Copper Conductor Weights
Bare PCB External Layer Standard Trace Width (in inches)
N/A Less than 0.001" 0.001" 0.002" 0.003" 0.004" 0.005" More than 0.005"
70
Q5a,D 202 respondents

BIS/OTE U.S. Bare Printed Circuit Board Industry Assessment
Source: U.S. Department of Commerce, Bureau of Industry and Security
U.S. Bare Printed Circuit Board Industry Assessment – 2017
Facility Manufacturing CapabilitiesExternal Layer: Minimum Trace Width (2015)
0
20
40
60
80
100
120
140
160
180
200
220
0.25 ozcopper
0.5 oz copper 1 oz copper 2 oz copper 3-5 oz copper 6-10 ozcopper
10+ oz copper
Nu
mb
er
of
Fa
cil
itie
s
Copper Conductor Weights
Bare PCB External Layer Minimum Trace Width (in inches)
N/A Less than 0.001" 0.001" 0.002" 0.003" 0.004" 0.005" More than 0.005"
71
Q5a,D 202 respondents

BIS/OTE U.S. Bare Printed Circuit Board Industry Assessment
Source: U.S. Department of Commerce, Bureau of Industry and Security
U.S. Bare Printed Circuit Board Industry Assessment – 2017
Facility Manufacturing CapabilitiesInternal Layer: Standard Trace Width (2015)
0
20
40
60
80
100
120
140
160
180
200
220
0.25 ozcopper
0.5 oz copper 1 oz copper 2 oz copper 3-5 oz copper 6-10 ozcopper
10+ oz copper
Nu
mb
er
of
Fa
cil
itie
s
Copper Conductor Weights
Bare PCB Internal Layer Standard Trace Width (in inches)
N/A Less than 0.001" 0.001" 0.002" 0.003" 0.004" 0.005" More than 0.005"
72
Q5a,D 202 respondents

BIS/OTE U.S. Bare Printed Circuit Board Industry Assessment
Source: U.S. Department of Commerce, Bureau of Industry and Security
U.S. Bare Printed Circuit Board Industry Assessment – 2017
Facility Manufacturing CapabilitiesInternal Layer: Minimum Trace Width (2015)
0
20
40
60
80
100
120
140
160
180
200
220
0.25 ozcopper
0.5 oz copper 1 oz copper 2 oz copper 3-5 oz copper 6-10 ozcopper
10+ oz copper
Nu
mb
er
of
Fa
cil
itie
s
Copper Conductor Weights
Bare PCB Internal Layer Minimum Trace Width (in inches)
N/A Less than 0.001" 0.001" 0.002" 0.003" 0.004" 0.005" More than 0.005"
73
Q5a,D 202 respondents

BIS/OTE U.S. Bare Printed Circuit Board Industry Assessment
Source: U.S. Department of Commerce, Bureau of Industry and Security
U.S. Bare Printed Circuit Board Industry Assessment – 2017
Facility Manufacturing CapabilitiesExternal Layer: Standard Space Width (2015)
0
20
40
60
80
100
120
140
160
180
200
220
0.25 ozcopper
0.5 oz copper 1 oz copper 2 oz copper 3-5 oz copper 6-10 ozcopper
10+ oz copper
Nu
mb
er
of
Fa
cil
itie
s
Copper Conductor Weights
Bare PCB External Layer Standard Space Width (in inches)
N/A Less than 0.001" 0.001" 0.002" 0.003" 0.004" 0.005" More than 0.005"
74
Q5a,E 202 respondents

BIS/OTE U.S. Bare Printed Circuit Board Industry Assessment
Source: U.S. Department of Commerce, Bureau of Industry and Security
U.S. Bare Printed Circuit Board Industry Assessment – 2017
Facility Manufacturing CapabilitiesExternal Layer: Minimum Space Width (2015)
0
20
40
60
80
100
120
140
160
180
200
220
0.25 ozcopper
0.5 oz copper 1 oz copper 2 oz copper 3-5 oz copper 6-10 ozcopper
10+ oz copper
Nu
mb
er
of
Fa
cil
itie
s
Copper Conductor Weights
Bare PCB External Layer Minimum Space Width (in inches)
N/A Less than 0.001" 0.001" 0.002" 0.003" 0.004" 0.005" More than 0.005"
75
Q5a,E 202 respondents

BIS/OTE U.S. Bare Printed Circuit Board Industry Assessment
Source: U.S. Department of Commerce, Bureau of Industry and Security
U.S. Bare Printed Circuit Board Industry Assessment – 2017
Facility Manufacturing CapabilitiesInternal Layer: Standard Space Width (2015)
0
20
40
60
80
100
120
140
160
180
200
220
0.25 ozcopper
0.5 oz copper 1 oz copper 2 oz copper 3-5 oz copper 6-10 ozcopper
10+ oz copper
Nu
mb
er
of
Fa
cil
itie
s
Copper Conductor Weights
Bare PCB Internal Layer Standard Space Width (in inches)
N/A Less than 0.001" 0.001" 0.002" 0.003" 0.004" 0.005" More than 0.005"
76
Q5a,E 202 respondents

BIS/OTE U.S. Bare Printed Circuit Board Industry Assessment
Source: U.S. Department of Commerce, Bureau of Industry and Security
U.S. Bare Printed Circuit Board Industry Assessment – 2017
Facility Manufacturing CapabilitiesInternal Layer: Minimum Space Width (2015)
0
20
40
60
80
100
120
140
160
180
200
220
0.25 ozcopper
0.5 oz copper 1 oz copper 2 oz copper 3-5 oz copper 6-10 ozcopper
10+ oz copper
Nu
mb
er
of
Fa
cil
itie
s
Copper Conductor Weights
Bare PCB Internal Layer Minimum Space Width (in inches)
N/A Less than 0.001" 0.001" 0.002" 0.003" 0.004" 0.005" More than 0.005"
77
Q5a,E 202 respondents

BIS/OTE U.S. Bare Printed Circuit Board Industry Assessment
Source: U.S. Department of Commerce, Bureau of Industry and Security
U.S. Bare Printed Circuit Board Industry Assessment – 2017
Facility Manufacturing Capabilities – Specific Processes
16
21
67
83
85
97
101
106
110
113
114
115
118
157
180
185
185
187
8
21
47
65
72
87
86
89
85
86
91
95
104
152
174
182
186
186
0 20 40 60 80 100 120 140 160 180 200
Opto-electronic structures
Other
Embedded devices (e.g. resistors, capacitors, etc.)
Z-axis interconnect technology
Laser ablation
Fully additive plating
Thermal management structures
Direct metallization plating
Dry film solder mask
Automated electroless copper plating
Automated electrolytic copper plating
Direct imaging
Hot air solder level lead-free
Hot air solder level tin-lead
Controlled drilling/milling
Screen printing
LPI solder mask
Photo imaging
Number of Facilities
Curently Use (2015) Capable of Using (2015)
Other processes identified
include: ENIG, Fusion bonding,
LPI LDI solder mask, Multiple
surface finishes, Polymer thick
films, Sputtering, Teflon etching.
78
Q5b,A 202 respondents

BIS/OTE U.S. Bare Printed Circuit Board Industry Assessment
Source: U.S. Department of Commerce, Bureau of Industry and Security
U.S. Bare Printed Circuit Board Industry Assessment – 2017
Facility Manufacturing Capabilities Other Processes Reported
• Buried capacitance
• ENEPIG
• ENIG
• ENIG, gold tab, silver
• Fusion bonding
• Immersion Tin, Imm. Silver and OSP
• Laser-direct solder mask
• LPI LDI solder mask
• Manual electroless copper
• Multiple surface finishes
• Organic solderability protectant
79
Q5b,A 202 respondents
• Plating process is semi auto
• Polymer thick films
• Screened resistors, digital and microwave circuit on
one homogenous plane, Rohacell, closed-cell foam
boards and special application processes.
• Sputtering
• Teflon etching
• Tin silver
• Tin/Lead plate and fuse
• White tin, gold, spray printing, other
Other processes identified include: ENIG, Fusion bonding, LPI LDI
solder mask, Multiple surface finishes, Polymer thick films,
Sputtering, Teflon etching, Tin silver

BIS/OTE U.S. Bare Printed Circuit Board Industry Assessment
Source: U.S. Department of Commerce, Bureau of Industry and Security
U.S. Bare Printed Circuit Board Industry Assessment – 2017
Facility Manufacturing Capabilities Maximum Circuit Layers per Board
47
54
42
27
1417
10
10
20
30
40
50
60
1-10 11-20 21-30 31-40 41-50 51-99 100+
Nu
mb
er
of
Fa
cil
itie
s
Maximum Circuit Layers per Board
Maximum Capability for Circuit Layers (2015)
80
Q5b,B 202 respondents

BIS/OTE U.S. Bare Printed Circuit Board Industry Assessment
Source: U.S. Department of Commerce, Bureau of Industry and Security
U.S. Bare Printed Circuit Board Industry Assessment – 2017
Facility Manufacturing Capabilities
Maximum Sequential Laminations per Board
43
104
34
14
51 0 1
0
20
40
60
80
100
120
0 1-5 6-10 11-20 21-30 31-40 41-50 50+
Nu
mb
er
of
Fa
cil
itie
s
Maximum Sequential Laminations per Board
Maximum Capability for Sequential Laminations (2015)
81
Q5b,B 202 respondents

BIS/OTE U.S. Bare Printed Circuit Board Industry Assessment
Source: U.S. Department of Commerce, Bureau of Industry and Security
U.S. Bare Printed Circuit Board Industry Assessment – 2017
Facility Manufacturing Capabilities
Maximum Impedance Structures per Board
65
53
29 29
8 73
53
0
10
20
30
40
50
60
70
0 1-5 6-10 11-20 21-30 31-40 41-50 51-100 100+
Nu
mb
er
of
Fa
cil
itie
s
Maximum Impedance Structures per Board
Maximum Capability for Impedance Structures (2015)
3 facilities reported maximum
impedance structures per board
of 500, 10,000, and 1,000,000 each
82
Q5b,B 202 respondents

BIS/OTE U.S. Bare Printed Circuit Board Industry Assessment
Source: U.S. Department of Commerce, Bureau of Industry and Security
U.S. Bare Printed Circuit Board Industry Assessment – 2017
Facility Manufacturing Capabilities
Maximum Stacked Micro Vias per Board
115
56
20
71 0 1 2
0
20
40
60
80
100
120
140
0 1-5 6-10 11-20 21-30 31-40 41-50 50+
Nu
mb
er
of
Fa
cil
itie
s
Maximum Stacked Micro Vias per Board
Maximum Capability for Stacked Micro Vias (2015)
2 facilities reported maximum
stacked micro vias per board of
200,000, and 1,000,000 each
83
Q5b,B 202 respondents

BIS/OTE U.S. Bare Printed Circuit Board Industry Assessment
Source: U.S. Department of Commerce, Bureau of Industry and Security
U.S. Bare Printed Circuit Board Industry Assessment – 2017
Facility Manufacturing Capabilities
Maximum Staggered Micro Vias per Board
112
56
19
9
1 0 14
0
20
40
60
80
100
120
0 1-5 6-10 11-20 21-30 31-40 41-50 50+
Nu
mb
er
of
Fa
cil
itie
s
Maximum Staggered Micro Vias per Board
Maximum Capability for Staggered Micro Vias (2015)
2 facilities reported maximum
staggered micro vias per board of
200,000, and 1,000,000 each
84
Q5b,B 202 respondents

BIS/OTE U.S. Bare Printed Circuit Board Industry Assessment
Source: U.S. Department of Commerce, Bureau of Industry and Security
U.S. Bare Printed Circuit Board Industry Assessment – 2017
Facility Manufacturing Capabilities PCB Via Fill and Planarization: Locations and Process Methods
85
Q5b,C 202 respondents
2
2
15
35
28
5
9
44
11
25
39
3
9
3
0 10 20 30 40 50 60 70 80 90 100 110 120
Other company-owned non-U.S.facilities
Contractor-operated non-U.S. facilities
Other company-owned U.S. facilities
Contractor-operated U.S. facilities
This facilty
Number of Facilities
Process Method
Automatic Manual Both N/A
Location
Identify where the bare circuit board via fill and planarization manufacturing
activities are performed for this facility (2015):

BIS/OTE U.S. Bare Printed Circuit Board Industry Assessment
Source: U.S. Department of Commerce, Bureau of Industry and Security
U.S. Bare Printed Circuit Board Industry Assessment – 2017
Automatic28
Manual44
Both39
N/A3
Process Methods: This Facility
Automatic Manual Both Neither N/A
86
Q5b,C 114 respondents
Manual: Explanations
• Conductive and non-conductive ink
• Flex manufacturer, planarization not employed
• In development at this time
• Non-conductive is primarily done in-house
• Processed at this facility
• Screened in with template
• Use of vibrating sander
• Do conductive via fill at this facility manually
• Use Ormet paste technology
Automatic: Explanations
• Automated tool with scavenger blade and horizontal
conveyorized planarizer
• Copper via fill
• Custom equipment
• Liquid photo imageable via fill only
• Mass GmbH 300 via fill machine & Polo-Massa Planarizer
• Mass GmbH via fill, Polo-Massa planarizer
• Non conductive fill / outside service for conductive fill
• Planarization only
• Polo-Massa equipment. Non-conductive fill material
• New equipment installed in Q2 2016
Both: Explanations
• Auto via fill, manual planarizer
• Automatic for via fill and manual planarization
• Both auto and manual planarizer
• Combination of auto planarization and manual sanding is used
• Conductive & non-conductive via fill
• Manual and automated mass equipment
• Planarization only is done in-house
• Semi-automatic via fill & planarization
• Via fill and planarization performed in house
• Via fill automated, planarization manual
• Use auto and manual sanding and machine assisted fill
• Wise planarizer and ITC via fill on premises
Facility Manufacturing Capabilities PCB Via Fill and Planarization: Locations and Process Methods

BIS/OTE U. S. Bare Printed Circuit Board Industry Assessment
Source: U.S. Department of Commerce, Bureau of Industry and Security
U.S. Bare Printed Circuit Board Industry Assessment – 2017
87
Q5b,C 34 respondents
Automatic15
Manual5
Both11
N/A3
Process Methods: Other company-owned U.S. facilities
Automatic Manual Both Neither N/A
Automatic: Explanations
• Use local supplier
• Outside service
Both: Explanations
• Hand screened and planarized using
automatic planarizer
• Manual and automated Mass GmbH
equipment
• Ue HDI via fill for non-conductive materials
Manual: Explanations
• Non-conductive fill / outside service for
conductive fill
Facility Manufacturing Capabilities PCB Via Fill and Planarization: Locations and Process Methods

BIS/OTE U.S. Bare Printed Circuit Board Industry Assessment
Source: U.S. Department of Commerce, Bureau of Industry and Security
U.S. Bare Printed Circuit Board Industry Assessment – 2017
88
Q5b,C 78 respondents
Automatic35
Manual9
Both25
N/A9
Process Methods:Contractor-operated U.S. facilities
Automatic Manual Both Neither N/A
Automatic: Explanations
• California location
• Conductive via filling - can do in house, but only
very small demand so some work is outsourced
• Dependent on volume and/or hole size
• Hole fill, planarization performed in-house & out-
sourced
• Planarizing Machine
Both: Explanations
• Both auto and manual planarizer
• Only utilized in capacity constrained situation
• Outsourced locally
• Sometimes we subcontract
• Use 3rd-party contractor for via-fill, but
planarization is done in-house
• We use an outside service for large runs of
conductive and non-conductive via fill
Facility Manufacturing Capabilities PCB Via Fill and Planarization: Locations and Process Methods

BIS/OTE U.S. Bare Printed Circuit Board Industry Assessment
Source: U.S. Department of Commerce, Bureau of Industry and Security
U.S. Bare Printed Circuit Board Industry Assessment – 2017
89
Q5b,C 3 respondents
Automatic, 2
Both, 1
Process Methods:Other company-owned non-U.S. facilities
Automatic Manual Both Neither N/A
Automatic: Explanations
• Commercial customer only
Both: Explanations
• Hand screened and planarized
using automatic planarizer
Facility Manufacturing Capabilities PCB Via Fill and Planarization: Locations and Process Methods

BIS/OTE U.S. Bare Printed Circuit Board Industry Assessment
Source: U.S. Department of Commerce, Bureau of Industry and Security
U.S. Bare Printed Circuit Board Industry Assessment – 2017
90
Q5b,C 4 respondents
Automatic2
Both1
N/A1
Process Methods:Contractor-operated non-U.S. facilities
Automatic Manual Both Neither N/A
Automatic: Explanations
• Planarizing Machine
Facility Manufacturing Capabilities PCB Via Fill and Planarization: Locations and Process Methods

BIS/OTE U.S. Bare Printed Circuit Board Industry Assessment
Source: U.S. Department of Commerce, Bureau of Industry and Security
U.S. Bare Printed Circuit Board Industry Assessment – 2017
91
Q5b,D 202 respondents
75
89
120
134
149
158
115
98
72
59
42
33
12
15
10
9
11
11
0 20 40 60 80 100 120 140 160 180 200 220
Laser via formation
Micro-via solid copper fill
Plasma etch
Nonconductive via fill
Chemical smear removal
Etchback
Number of Facilities
Via Formation Process Capabilities (2015)
Yes No N/A
Facility Manufacturing Capabilities Via Structures

BIS/OTE U.S. Bare Printed Circuit Board Industry Assessment
Source: U.S. Department of Commerce, Bureau of Industry and Security
U.S. Bare Printed Circuit Board Industry Assessment – 2017
92
Q5b,D 202 respondents
29
10
26
60
44
14
5
5
7
2
62
41
43
34
9
4
3
1
3
2
0 10 20 30 40 50 60 70
0
Under 5:1
5:1
10:1
15:1
20:1
25:1
30:1
Over 30:1
Yes
Number of Facilities
Ma
xim
um
As
pe
ct
Ra
tio
Via Structure Drilling Process Capabilities (2015)
Mechanically drilled via: controlled-depth Mechanically drilled via: through-board
Facility Manufacturing Capabilities Mechanically Drilled Vias

BIS/OTE U.S. Bare Printed Circuit Board Industry Assessment
Source: U.S. Department of Commerce, Bureau of Industry and Security
U.S. Bare Printed Circuit Board Industry Assessment – 2017
93
Q5b,D 202 respondents
99
4
8
24
45
20
2
0 10 20 30 40 50 60 70 80 90 100
N/A
Under 0.5:1
0.5:1
0.75:1
1:1
Over 1:1
Yes
Number of Facilities
Maxim
um
Asp
ec
t R
ati
o
Via Structure Drilling Process Capabilities (2015)
Laser-formed Micro Via
Facility Manufacturing Capabilities Laser-formed Micro Vias

BIS/OTE U.S. Bare Printed Circuit Board Industry Assessment
Source: U.S. Department of Commerce, Bureau of Industry and Security
U.S. Bare Printed Circuit Board Industry Assessment – 2017
Facility Manufacturing Standards (2015)
69
4
21
47
22
4
6
3
17
149
42
24
55
22
39
58
102
118
88
49
57
51
79
25
47
38
48
21
67
95
49
22
61
100
90
99
65
23
85
108
73
118
27
45
30
15
31
49
49
49
41
5
28
32
26
41
0 50 100 150 200 250
AS 9100
IPC 1071
IPC 6011
IPC 6012
IPC 6013
IPC 6015
IPC 6016
IPC 6017
IPC 6018
ISO 9001
MIL-PRF 31032
MIL-PRF 50884
MIL-PRF 55110
NADCAP
Number of Facilities
Sta
nd
ard
Standards Used by U.S. Bare PCB Facilities
Formal Certification Informal Use Not Used N/A
94
Q5c,A 202 respondents
Other Standards
Used:
(1-2 facilities each)
AIAG
AS9003
IPC610
IPC-A-600
ISO 13485
ISO 13548
ISO 14001
ISO/TS16949
ISO13495
ISO14001
ITAR
J-STD-01F
TS16949
UL

BIS/OTE U.S. Bare Printed Circuit Board Industry Assessment 95
Source: U.S. Department of Commerce, Bureau of Industry and Security
U.S. Bare Printed Circuit Board Industry Assessment – 2017
Facility Manufacturing Standards – MIL Certification
• Only 31% of U.S. PCB manufacturing facilities hold an official MIL certification. MIL-PRF 31032: 42 total facilities (only 14 of 146 small)
MIL-PRF 50884: 24 total facilities (only 11 of 146 small)
MIL-PRF 55110: 55 total facilities (only 28 of 146 small)
• Comments: “We recently dropped MIL certification due to increasing requirements burden.”
“Cost of compliance to MIL specs, etc. could result in a few suppliers getting all the
business. Our business serves medical market, industrial market and military markets.
Separate and unique certifications and systems compliance for each segment results in a
lot of additional (LOW VALUE) effort and support.”
“We have avoided government space applications due to stringent testing and paperwork
requirements. Needs a full time program manager with experience.”
“Testing & documentation relative to other customers is extreme.”
• Potential Actions:
Increase/create funding program to help small U.S. PCB manufacturers
achieve formal certifications. (ex: MIL-PRF).

BIS/OTE U.S. Bare Printed Circuit Board Industry Assessment
Source: U.S. Department of Commerce, Bureau of Industry and Security
U.S. Bare Printed Circuit Board Industry Assessment – 2017
96
Q5c,B 202 respondents
Facility Manufacturing StandardsUse of Active Technical Review Boards (2015)
Yes14069%
No62
31%
Does This Facility Have an Active Technical Review Board
Yes No

BIS/OTE U.S. Bare Printed Circuit Board Industry Assessment
Source: U.S. Department of Commerce, Bureau of Industry and Security
U.S. Bare Printed Circuit Board Industry Assessment – 2017
Facility Manufacturing StandardsInspection Methods and Capabilities (2015)
97
Q5c,C 202 respondents
16
20
35
131
C=0
Sampling
Other
100% Inspection
0 50 100 150
Number of Facilities
Number of facilities using identified methods for assuring conformance
with performance requirements
Primary Final Circuit Board Inspection Method
Yes14170%
No55
27%
N/A6
3%
Number of facilities reporting that their first article
inspection capabilities comply with AS 9102
Yes No N/A

BIS/OTE U.S. Bare Printed Circuit Board Industry Assessment
Source: U.S. Department of Commerce, Bureau of Industry and Security
U.S. Bare Printed Circuit Board Industry Assessment – 2017
Facility Manufacturing StandardsForms of Testing Used for Bare PCB Performance (2015)
17
23
38
59
126
136
162
173
178
182
163
158
145
129
66
56
25
22
15
16
22
21
19
14
10
10
15
7
9
4
0 20 40 60 80 100 120 140 160 180 200 220
Highly Accelerated Life Testing (HALT)
Highly Accelerated Stress Testing (HAST)
Highly Accelerated Thermal Shock (HATS)
Interconnect Stress Testing (IST)
Bed-of-Nails
Impedance Testing with Plots
Test all end points, no phase testing
Isolation 250 Volts DC, 100 MegaOhm Minimum
Continuity 10 Volts DC, 10 Ohm Maximum
Flying Probe
Number of Facilities
Testi
ng
Fo
rm
Yes No N/A
98
Q5c,D 202 respondents

BIS/OTE U.S. Bare Printed Circuit Board Industry Assessment
Source: U.S. Department of Commerce, Bureau of Industry and Security
U.S. Bare Printed Circuit Board Industry Assessment – 2017
Facility Manufacturing Standards - SoftwareStatistical Process Control and Material Requirements Planning
(2015)
99
Q5c,E 202 respondents
Yes10552%
No85
42%
N/A126%
Facilities employing TrueChem or equivalent software to manage
chemistries, coatings, and associated processes in bare printed circuit board
production
Yes No N/A
Yes10351%
No89
44%
N/A105%
Facilities employing material requirements planning software in the
operation bare printed circuit board manufacturing facilities in the U.S.
Yes No N/A

BIS/OTE U.S. Bare Printed Circuit Board Industry Assessment
Source: U.S. Department of Commerce, Bureau of Industry and Security
U.S. Bare Printed Circuit Board Industry Assessment – 2017
32
36
58
26
44
6
30
37
57
25
47
6
3032
63
19
51
7
31
41
57
15
53
5
0
10
20
30
40
50
60
70
0-10 11-100 101-500 501-1,000 1,001-10,000 10,000+
Nu
mb
er
of
Fa
cil
itie
s
Average Weekly Inner Layers (Cores) Manufactured
2012 2013 2014 2015
100
Q5d,A 202 respondents
Facility Manufacturing Production and Capacity Average Weekly Inner Layers (Cores) Manufactured (2012-2015)

BIS/OTE U.S. Bare Printed Circuit Board Industry Assessment
Source: U.S. Department of Commerce, Bureau of Industry and Security
U.S. Bare Printed Circuit Board Industry Assessment – 2017
18
42
88
27 27
15
42
92
24
29
13
44
88
24
33
13
46
86
2730
0
10
20
30
40
50
60
70
80
90
100
0-10 11-100 101-500 501-1,000 1,000+
Nu
mb
er
of
Fa
cil
itie
s
Average Weekly Panels Manufactured
2012 2013 2014 2015
101
Q5d,A 202 respondents
Facility Manufacturing Production and Capacity Average Weekly Panels Manufactured (2012-2015)

BIS/OTE U.S. Bare Printed Circuit Board Industry Assessment
Source: U.S. Department of Commerce, Bureau of Industry and Security
U.S. Bare Printed Circuit Board Industry Assessment – 2017
102
Q5d,B 202 respondents
27
44
88
178
120
175
125
74
0
20
40
60
80
100
120
140
160
180
200
24x36 24x30 21x24 18x24 12x24 12x18 9x12 Other
Nu
mb
er
of
Fa
cil
itie
s
Panel Size
U.S. Bare PCB Facilities – Panel Size Production Capability
Facility Manufacturing Production and Capacity
Bare PCB Panels: Range of Sizes (2015)

BIS/OTE U.S. Bare Printed Circuit Board Industry Assessment
Source: U.S. Department of Commerce, Bureau of Industry and Security
U.S. Bare Printed Circuit Board Industry Assessment – 2017
2319
51
33
76
0
10
20
30
40
50
60
70
80
0-10 11-100 101-500 501-1,000 1,000+
Nu
mb
er
of
Fa
cil
itie
s
Number of Weekly Inner Layers (Cores)
Inner Layers (Cores) Production
Capacity Ranges for U.S. Bare PCB
Facilities
103
Q5d,C 202 respondents
Facility Manufacturing Production and CapacityRated Weekly Inner Layer and Panel Facility Capacity (2015)
6
25
72
50 49
0
10
20
30
40
50
60
70
80
0-10 11-100 101-500 501-1,000 1,000+
Nu
mb
er
of
Fa
cil
itie
s
Number of Weekly Panel Units
Panel Production Capacity Ranges for U.S. Bare PCB
Facilities

BIS/OTE U.S. Bare Printed Circuit Board Industry Assessment
Source: U.S. Department of Commerce, Bureau of Industry and Security
U.S. Bare Printed Circuit Board Industry Assessment – 2017
4
95
59
44
1
24
49
128
16
130
43
1310
40
69
83
0
20
40
60
80
100
120
140
0 Shifts 1 Shift 2 Shifts 3 Shifts
Nu
mb
er
of
Fa
cil
itie
s
Number of 8-hour Production Shifts
How many 8-hour production shifts does this facility typically operate per day?
How many 8-hour production shifts per day COULD this facility operate practically?
How many 8-hour front-end engineering shifts does this facility typically operate per day?
How many 8-hour front-end engineering shifts per day COULD this facility operate practically?
104
Q5d,D 202 respondents
Facility Manufacturing Production and CapacityProduction Shifts Per Day (2015)

BIS/OTE U.S. Bare Printed Circuit Board Industry Assessment
Source: U.S. Department of Commerce, Bureau of Industry and Security
U.S. Bare Printed Circuit Board Industry Assessment – 2017
105
Q5d,D 202 respondents
Facility Manufacturing Production and CapacityProduction Shift Capability: Comments
• “2nd & 3rd shifts are partial coverage shifts”
• “3rd shift is currently very lightly staffed”
• “Additional shifts are dependent on the ability to hire qualified operators”
• “All engineering is done outside the company”
• “Based on current production requirements the board shop department of the
company only operates one shift, the first shift”
• “Company could run 24-hours-a-day with proper personnel”
• “Currently capacity is not an issue, and could increase engineering staff to
accommodate business needs if so required”
• “Currently one full shift with a small swing shift”
• “Currently work 1 full shift; partial coverage on 2nd shift for bottleneck areas”
• “Expansion to a third shift is possible; not probable at current production levels”
• “Factors are availability of trained personnel and work amount available”
• “If work is there, we can hire people to work 24/7”
• “Limited availability of sufficiently skilled personnel”
• “Methods engineering and CAM Engineering reduced staff on 2nd, 3rd shifts”
• “With more work we would work more hours”
• “No demand for bare boards to operate facility to capacity. Lack of available
experienced operator and engineers”
• “Production typically is 4 days per week, 6-hour shift days”
• “Run 7 days x 24 hours using variety of shifts”
• “Saturday/Sunday used for overtime and maintenance”
• “Since 2012 we have been on mostly 4 days at 8 hours a day only and very few 5
days a week”
• “Facility is running at nearly 70% of capacity and limited to 2 (9 hour) shifts.”
• “Third shift does exist but very minimally staffed (<10 associates); Room for both
2nd and 3rd shift to significantly increase”
• “We work what it takes to manufacture the specialty boards round the clock”
• “We are currently running under capacity”
• “We are open 24 hours M-F with Saturdays as needed”
• “We could run a whole second shift but we would need to add employees “
• “Downsized to stay open but we have the capability of ramping up”
• “We have room to grow in production and engineering”
• “Roster of 8 employee's two of which are engineers”
• “We operate a daily split shift, operating from 7AM to 8PM with 18 employees”
• “Work load is currently extremely low. Most employees are gone. Equipment and
facility capable of 3 shifts provided the work load is there”
• “Other than a skeleton crew of 2 or 3 workers, the 3rd shift is open for additional
production and front-end engineering”

BIS/OTE U.S. Bare Printed Circuit Board Industry Assessment 106
Source: U.S. Department of Commerce, Bureau of Industry and Security
U.S. Bare Printed Circuit Board Industry Assessment – 2017
Facility Manufacturing Production and CapacityU.S. Bare PCB Facility Utilization Rate (2012–2015)
Q5d, E 106Respondents: 202
47% 47% 47% 46%
41% 41% 40% 39%
62% 62% 62% 63%64%
70%
66% 67%
51% 51% 51% 51%
30%
40%
50%
60%
70%
80%
2012 2013 2014 2015
Man
ufa
ctu
rin
g U
tilizati
on
Rate
All Facilities
Small <$10M
Medium $10M-$40M
Large >$40M
Defense End Use
*Average manufacturing utilization rate for each of the years 2012-2015, as a percentage of
production possible under a 7 day-per-week, 24-hour-per-day operation.

BIS/OTE U.S. Bare Printed Circuit Board Industry Assessment
Source: U.S. Department of Commerce, Bureau of Industry and Security
U.S. Bare Printed Circuit Board Industry Assessment – 2017
10
34
66 67
16
913
22
46 48
56
17
0
10
20
30
40
50
60
70
80
100% capacityutilization already
(0 weeks)
1-4 weeks 5-12 weeks 13-26 weeks 27-52 weeks 52+ weeks
Nu
mb
er
of
Facilit
ies
Estimates of Weeks Needed
Estimate how many weeks it would take to raise this facility's production from current levelsto 100% capacity utilization:
Estimate how many weeks it would take to raise this facility's production from current levelsto 150% of your current capacity utilization:
107
Q5d,F 202 respondents
Facility Manufacturing Production and Capacity Raising Production Output From Current Levels (2015)

BIS/OTE U.S. Bare Printed Circuit Board Industry Assessment
Source: U.S. Department of Commerce, Bureau of Industry and Security
U.S. Bare Printed Circuit Board Industry Assessment – 2017
108
Q5d,G 202 respondents
16
45
56
64
74
82
143
14
82
63
101
82
134
154
0 50 100 150 200
Other
Manufacturing space
Availability of input materials
Availability of equipment
Quality control
Amount of equipment
Availability or cost of workforce
Number of Facilities
Limiting Factor to Raising Utilization Rate to 150%
Limiting Factor to Raising Utilization Rate to 100%
Facility Manufacturing Production and CapacityLimiting Factors for Surge Capability (2015)

BIS/OTE U.S. Bare Printed Circuit Board Industry Assessment
Source: U.S. Department of Commerce, Bureau of Industry and Security
U.S. Bare Printed Circuit Board Industry Assessment – 2017
Facility Manufacturing Production and CapacityAnticipated Changes in Bare PCB Product Lines by 2020
31
115
115
103
102
72
55
60
61
51
68
39
88
14
12
13
33
4
17
4
4
4
7
3
63
31
32
40
44
23
41
26
27
29
25
29
20
42
43
46
23
103
89
112
110
118
102
131
0 20 40 60 80 100 120 140 160 180 200 220
Rigid Conventional Boards (single-sided or double-sided)
Rigid High Frequency Boards
Rigid High Speed Boards
Rigid Microwave Boards
Rigid Multilayer Boards
Rigid-Flex Hybrid Boards
Flexible Conventional Boards (single-sided or double-sided)
Flexible High Frequency Boards
Flexible High Speed Boards
Flexible Microwave Boards
Flexible Multilayer Boards
Integrated Circuit Package Substrates
Number of Facilities
How does this facility anticipate the range of bare circuit board product lines it manufactures will change by 2020?
Increase Decrease No Change N/A
109
Q5e,A 202 respondents

BIS/OTE U.S. Bare Printed Circuit Board Industry Assessment
Source: U.S. Department of Commerce, Bureau of Industry and Security
U.S. Bare Printed Circuit Board Industry Assessment – 2017
Facility Manufacturing Production and CapacityAnticipated Changes in Front-End Engineering Capability by 2020
108
93
21
9
67
55
6
45
0
20
40
60
80
100
120
Commercial End Use Defense End Use
Nu
mb
er
of
Facilit
ies
How does this facility anticipate it's front-end engineering processing capabilities will change by 2020?
Increase Decrease No Change N/A
110
Q5e,B 202 respondents

BIS/OTE U.S. Bare Printed Circuit Board Industry Assessment
Source: U.S. Department of Commerce, Bureau of Industry and Security
U.S. Bare Printed Circuit Board Industry Assessment – 2017
111
Q5e,C1/C2 202 respondents
Facility Manufacturing Production and CapacityFront-end Bare PCB Engineering: In-House (2015)
193
90
20
40
60
80
100
120
140
160
180
200
Yes No
Nu
mb
er
of
Fa
cil
itie
s
Does this facility have its own staff on site to perform front-end engineering for
manufacturing bare circuit boards?
27
175
0
20
40
60
80
100
120
140
160
180
200
Yes No
Nu
mb
er
of
Fa
cil
itie
s
Does this facility perform front-end engineering for manufacturing bare circuit boards as a service to other
companies that may have bare circuit boards manufactured elsewhere?

BIS/OTE U.S. Bare Printed Circuit Board Industry Assessment
Source: U.S. Department of Commerce, Bureau of Industry and Security
U.S. Bare Printed Circuit Board Industry Assessment – 2017
112
Q5e,C3 202 respondents
3
165
34
0 50 100 150 200
N/A
No
Yes
Number of Facilities
Does this facility outsource any front-end engineering for bare circuit board products
manufactured at this facility?
Facility Manufacturing Production and CapacityFront-end Bare PCB Engineering: Outsource (2015)
159
19
24
0 50 100 150 200
N/A
No
Yes
Number of Facilities
Does your company notify customers in advance that it outsources front-end
engineering for manufacturing bare circuit boards?
0
21
0
5
10
15
20
25
Defense Work Commercial Work
Nu
mb
er
of
Fa
cil
itie
s
If this facility outsources front-end engineering for bare circuit board products, indicate the country or countries (including the United States) to which this service is outsourced:
1
3
17
Philippines
China
India
Commercial Work Locations

BIS/OTE U.S. Bare Printed Circuit Board Industry Assessment
Source: U.S. Department of Commerce, Bureau of Industry and Security
U.S. Bare Printed Circuit Board Industry Assessment – 2017
Facility Manufacturing Production and CapacityPrimary Factors Causing Production Bottlenecks (2015)
113
Q5e,D 202 respondents
1
12
18
19
25
29
37
45
73
78
84
91
0 10 20 30 40 50 60 70 80 90 100
Via in Pad Plated Over (VIPPO)
Inner layer pretreatment
Imaging
Etching
Automated optical inspection (AOI)
Electroless plating
Lamination
Electrical test
Front end engineering
Drilling
Electrolytic plating
Other
Number of Facilities
Identify the three most significant factors causing production bottlenecks at this facility. (512 responses)
Most "Other" responses cited
workforce factors, machine,
material and technological
limitations, or that there are no
existing bottlenecks.

BIS/OTE U.S. Bare Printed Circuit Board Industry Assessment
Source: U.S. Department of Commerce, Bureau of Industry and Security
U.S. Bare Printed Circuit Board Industry Assessment – 2017
CHAPTER 5:
MATERIALS AND EQUIPMENT
• MATERIALS - SOURCING AND SUPPLY CHAIN
• EQUIPMENT
114

BIS/OTE U.S. Bare Printed Circuit Board Industry Assessment 115
Source: U.S. Department of Commerce, Bureau of Industry and Security
U.S. Bare Printed Circuit Board Industry Assessment – 2017
Bare PCB Supply Chain
• U.S. PCB manufacturers are confronted with a diminished supply chain as
well as diminishing number of downstream customers. PCB are intermediate products, not end products. As electronic systems
manufacturing has shifted overseas, so have many downstream customers and
partner manufacturers. U.S. PCB manufacturers have been facing a diminishing
domestic market while simultaneously finding it challenging to compete in
foreign markets.
• As mass PCB production has shifted away from the U.S. towards Asia, so
has the industry supply chain. Many specialty PCB supply chain manufacturers derive their revenue from the
square feet of board produced rather than from the value of the finished PCB.
This has resulted in many suppliers following PCB production overseas.
Also, many in the supply chain have failed or merged with others in order to
remain financially solvent.
• Forty-five percent of BIS survey respondents stated that a reduction in U.S.
companies that manufacture laminate and other circuit-board related materials
has created supply problems for them.

BIS/OTE U.S. Bare Printed Circuit Board Industry Assessment 116
Source: U.S. Department of Commerce, Bureau of Industry and Security
U.S. Bare Printed Circuit Board Industry Assessment – 2017
• The ability to trace the source and origins of PCBs and other
potentially critical components is a challenge for DoD
• Some DoD oversight and assessment of supply-chain capabilities is
needed. Other USG agencies as well as industry needs to participate
in this effort.
• Potential Actions: Work with DMEA (program manager for DoD Trusted Foundry
program) on trusted supplier accreditation.
Package PCBs with Integrated Circuits into existing DMEA program
and ongoing National Security Council semiconductors effort.
Bare PCB Supply Chain

BIS/OTE U.S. Bare Printed Circuit Board Industrial Assessment
Source: U.S. Department of Commerce, Bureau of Industry and Security
U.S. Bare Printed Circuit Board Industry Assessment – 2017
Materials - Bare PCB Material Sourcing
7
29
35
40
88
102
135
149
153
163
164
173
178
181
187
190
193
193
0 50 100 150 200
Other
Embedded passives, formed, resistors, and capacitors - lead-free
Other foils
Embedded passives, formed, resistors, and capacitors - tin-lead
Laminate - rigid-flex boards
Laminate - flex boards
Via fill, conductive, and non-conductive material
Finish materials
Laminate - rigid high speed, high frequency, and microwave boards
Through-hole and plating preparation for plating material
Solder
Laminate - rigid multilayer boards
Copper foil
Electrolytic plating material
Laminate - rigid conventional boards
Etchant
Solder mask
Drill bits
Number of Facilities
Mate
rial
Facilities Reporting One or More Suppliers (2015)
117
Q6a,A 202 respondents

BIS/OTE U.S. Bare Printed Circuit Board Industrial Assessment
Source: U.S. Department of Commerce, Bureau of Industry and Security
U.S. Bare Printed Circuit Board Industry Assessment – 2017
1.2
1.3
1.4
1.5
1.5
1.6
1.6
1.7
1.7
1.7
1.8
2.1
2.1
2.3
2.9
3.2
3.4
3.5
0 1 2 3 4
Etchant
Solder
Through-hole and plating preparation for plating material
Electrolytic plating material
Solder mask
Drill bits
Other
Copper foil
Other foils
Via fill, conductive, and non-conductive material
Laminate - flex boards
Embedded passives, formed, resistors, and capacitors - tin-lead
Embedded passives, formed, resistors, and capacitors - lead-free
Finish materials
Laminate - rigid high speed, high frequency, and microwave boards
Laminate - rigid-flex boards
Laminate - rigid conventional boards
Laminate - rigid multilayer boards
Average Number of Suppliers
Mate
rial
Average Number of Suppliers Reported by Facility (2015)
118
Q6a,A 202 respondents
Materials - Bare PCB Material Sourcing

BIS/OTE U.S. Bare Printed Circuit Board Industrial Assessment
Source: U.S. Department of Commerce, Bureau of Industry and Security
U.S. Bare Printed Circuit Board Industry Assessment – 2017
1
5
6
6
6
6
9
10
11
11
14
15
16
19
20
22
22
39
0 10 20 30 40
Other
Drill bits
Other foils
Embedded passives, formed, resistors, and capacitors - tin-lead
Embedded passives, formed, resistors, and capacitors - lead-free
Solder
Finish materials
Via fill, conductive, and non-conductive material
Electrolytic plating material
Solder mask
Etchant
Through-hole and plating preparation for plating material
Copper foil
Laminate - rigid-flex boards
Laminate - flex boards
Laminate - rigid conventional boards
Laminate - rigid multilayer boards
Laminate - rigid high speed, high frequency, and microwave boards
Number of Facilities
Mate
ria
l
Facilities Reporting Material Availability is a Concern (2015)
119
Q6a,A 202 respondents
Materials - Bare PCB Material Sourcing

BIS/OTE U.S. Bare Printed Circuit Board Industry Assessment 120
Source: U.S. Department of Commerce, Bureau of Industry and Security
U.S. Bare Printed Circuit Board Industry Assessment – 2017
Materials - Supply Chain Disruptions Since 2012
1
3
4
5
6
7
7
8
9
9
10
14
16
16
21
33
38
40
0 10 20 30 40
Other
Embedded passives, formed, resistors, and capacitors - lead-free
Embedded passives, formed, resistors, and capacitors - tin-lead
Other foils
Solder
Solder mask
Drill bits
Via fill, conductive, and non-conductive material
Electrolytic plating material
Finish materials
Etchant
Through-hole and plating preparation for plating material
Laminate - flex boards
Laminate - rigid-flex boards
Copper foil
Laminate - rigid multilayer boards
Laminate - rigid high speed, high frequency, and microwave boards
Laminate - rigid conventional boards
Number of Facilities
Mate
rial
Facilities That Experienced Supply Chain Disruptions (2012 to 2015)
Q6a,A 202 respondents

BIS/OTE U.S. Bare Printed Circuit Board Industry Assessment 121
Source: U.S. Department of Commerce, Bureau of Industry and Security
U.S. Bare Printed Circuit Board Industry Assessment – 2017
Materials - Supply Chain Disruptions - Example
0
20
40
60
80
100
120
Yes No
Nu
mb
er
of
Fa
cil
itie
s
Does a reduction in U.S.-based companies that manufacture laminates
and other circuit board-related materials create supply problems for
this facility?
Large >$40M Medium $10M-$40M Small <$10M
109
77% reported defense-
related sales
199 respondents
90
16
16
21
33
38
40
0 10 20 30 40
Laminate - flex boards
Laminate - rigid-flex boards
Copper foil
Laminate - rigid multilayer boards
Laminate - rigid high speed, highfrequency, and microwave boards
Laminate - rigid conventional boards
Number of Facilities
Top Experienced Material Supply Chain Disruptions (2012 to 2015)
United States56%
China34% Taiwan
7% Japan2%
South Korea (ROK)
1%
Suppliers Listed – Countries:Laminate – rigid conventional board

BIS/OTE U.S. Bare Printed Circuit Board Industrial Assessment
Source: U.S. Department of Commerce, Bureau of Industry and Security
U.S. Bare Printed Circuit Board Industry Assessment – 2017
Materials - Laminate for Use in
Rigid Conventional Boards
187
22
40
20
0
50
100
150
200
FacilitiesReporting 1+
Suppliers
Availability isa Concern
ExperiencedSupply Chain
Problemssince 2012
Both
Nu
mb
er
of
Fa
cil
itie
s
Laminate For Use in Rigid Conventional Boards
122
Q6a,A
627
356
41
0
100
200
300
400
500
600
700
Total SuppliersReported
Suppliers Listed Unique SuppliersListed
Nu
mb
er
of
Su
pp
lie
rs
Suppliers
202 respondents
United States56%
China34%
Taiwan7%
Japan2%
South Korea (ROK)
1%
Suppliers Listed - Countries

BIS/OTE U.S. Bare Printed Circuit Board Industrial Assessment
Source: U.S. Department of Commerce, Bureau of Industry and Security
U.S. Bare Printed Circuit Board Industry Assessment – 2017
Materials - Laminate for Use in Rigid Multilayer Boards
173
21
33
20
0
50
100
150
200
FacilitiesReporting
1+ Suppliers
Availabilityis a Concern
ExperiencedSupplyChain
Problemssince 2012
Both
Nu
mb
er
of
Fa
cil
itie
s
Laminate For Use in Rigid Multilayer Boards
123
Q6a,A
600
323
32
0
100
200
300
400
500
600
700
Total SuppliersReported
Suppliers Listed Unique SuppliersListed
Nu
mb
er
of
Su
pp
lie
rs
Suppliers
202 respondents
United States62%
China29%
Taiwan7%
Japan2%
South Korea (ROK)<1%
Suppliers Listed - Countries

BIS/OTE U.S. Bare Printed Circuit Board Industrial Assessment
Source: U.S. Department of Commerce, Bureau of Industry and Security
U.S. Bare Printed Circuit Board Industry Assessment – 2017
Materials - Laminate for use in Rigid High Speed,
High Frequency, and Microwave Boards
153
39 3829
0
50
100
150
200
FacilitiesReporting 1+
Suppliers
Availability isa Concern
ExperiencedSupplyChain
Problemssince 2012
Both
Nu
mb
er
of
Fa
cil
itie
s
Laminate For Use in Rigid High Speed, High Frequency, and Microwave
Boards
124
Q6a,A
450
273
27
0
100
200
300
400
500
Total SuppliersReported
Suppliers Listed Unique SuppliersListed
Nu
mb
er
of
Su
pp
lie
rs
Suppliers
202 respondents
United States85%
Japan7%
China6%
Taiwan2%
South Korea (ROK)<1%
Suppliers Listed - Countries

BIS/OTE U.S. Bare Printed Circuit Board Industrial Assessment
Source: U.S. Department of Commerce, Bureau of Industry and Security
U.S. Bare Printed Circuit Board Industry Assessment – 2017
Materials - Impact of Supply Chain Disruptions
125
Q6b,A1/A2 202 respondents
3
149
40
5 2 3
0
20
40
60
80
100
120
140
160
0 weeks 1-4weeks
5-12weeks
13-26weeks
27-52weeks
52+weeks
Nu
mb
er
of
Fa
cil
itie
s
If this facility were no longer able to purchase circuit board laminate from your current
suppliers, for how many weeks could you continue normal operations?
8
164
28
0 1 10
20
40
60
80
100
120
140
160
180
0 weeks 1-4weeks
5-12weeks
13-26weeks
27-52weeks
52+weeks
Nu
mb
er
of
Fa
cil
itie
s
How many weeks would it take this facility to obtain material from a new supplier of laminate?

BIS/OTE U.S. Bare Printed Circuit Board Industry Assessment
Source: U.S. Department of Commerce, Bureau of Industry and Security
U.S. Bare Printed Circuit Board Industry Assessment – 2017
Materials - Impact of Supply Chain Disruptions
126
Q6b,A3/A4 199 respondents
0
20
40
60
80
100
120
Yes No
Nu
mb
er
of
Fa
cil
itie
s
Does a reduction in U.S.-based companies that manufacture laminates
and other circuit board-related materials create supply problems for this facility?
Large >$40M Medium $10M-$40M Small <$10M
109
77% reported defense-
related sales
90
0 20 40 60 80 100
N/A
Would Not Be Able To
Not Confident
Somewhat Confident
Very Confident
Number of Facilities
How confident are you that this facility could obtain the materials necessary to rapidly ramp up production in a national
emergency?
Large >$40M Medium $10M-$40M Small <$10M
86
68
37
8
3

BIS/OTE U.S. Bare Printed Circuit Board Industrial Assessment
Source: U.S. Department of Commerce, Bureau of Industry and Security
U.S. Bare Printed Circuit Board Industry Assessment – 2017
Materials - Inventory Practices for
Bare PCB Production Materials
127
Q6b,B 202 respondents
Maintain extra inventory as a buffer against
unexpected delays in material shipments and
unanticipated new production orders: 106 facilities (52%)
Minimize on-hand inventory of circuit board
production materials: 93 facilities (46%)
N/A, 3, 2%
Which statement best describes this facility's general method for maintaining inventory levels of laminate and related materials
required for the production of circuit boards?

BIS/OTE U.S. Bare Printed Circuit Board Industrial Assessment
Source: U.S. Department of Commerce, Bureau of Industry and Security
U.S. Bare Printed Circuit Board Industry Assessment – 2017
Materials - Practices Used to Assure Availability of
Bare PCB Materials
128
Q6b,C 202 respondents
84
116
2
127
73
20
20
40
60
80
100
120
140
Yes No Unknown/ NA
Nu
mb
er
of
Fa
cil
itie
s
On-site stocking agreements through which distributors/manufacturers keep a quantity ofmaterials at this facility.
Local stocking agreements through which distributors/manufacturers maintain supplywarehouses in close proximity to this facility.

BIS/OTE U.S. Bare Printed Circuit Board Industrial Assessment
Source: U.S. Department of Commerce, Bureau of Industry and Security
U.S. Bare Printed Circuit Board Industry Assessment – 2017
Equipment – Number of Functioning Units On Site
29
125
140
143
167
178
196
202
227
286
287
328
337
340
436
443
464
467
510
530
630
633
1161
0 100 200 300 400 500 600 700 800 900 1000 1100 1200
Photo resist exposure-LED
Via fill
Drilling - laser
Photo resist exposure-laser
Electroless copper
Scoring
Desmear
Inner layer treatment & layup
Photo film processing
Legend print
Chemical cleaning
Automatic optical inspection
Solder mask
Develop etch & strip equipment
Final finish
Lamination
Photo resist application
Electrolytic copper
Photo resist exposure
Quality control measurement
Routing
Electrical testing
Drilling - mechanical
Total Number of Functioning Units On Site Reported
Eq
uip
me
nt
129
Q6c,A 202 respondents

BIS/OTE U.S. Bare Printed Circuit Board Industrial Assessment
Source: U.S. Department of Commerce, Bureau of Industry and Security
U.S. Bare Printed Circuit Board Industry Assessment – 2017
22
63
74
90
141
147
159
159
163
168
172
176
179
180
180
181
184
189
193
195
195
197
200
0 50 100 150 200
Photo resist exposure-LED
Drilling - laser
Photo resist exposure-laser
Via fill
Scoring
Automatic optical inspection
Desmear
Electroless copper
Inner layer treatment & layup
Quality control measurement
Final finish
Chemical cleaning
Legend print
Photo film processing
Electrolytic copper
Electrical testing
Solder mask
Lamination
Photo resist exposure
Develop etch & strip equipment
Routing
Photo resist application
Drilling - mechanical
Number of Facilities Reporting Functioning Units On Site
Eq
uip
me
nt
130
Q6c,A 202 respondents
Equipment – Number of Facilities With Functioning Units On Site

BIS/OTE U.S. Bare Printed Circuit Board Industrial Assessment
Source: U.S. Department of Commerce, Bureau of Industry and Security
U.S. Bare Printed Circuit Board Industry Assessment – 2017
4
5
6
7
7
9
10
10
11
11
11
11
11
11
12
12
12
12
12
13
14
14
15
0 5 10 15 20
Photo resist exposure-laser
Photo resist exposure-LED
Via fill
Automatic optical inspection
Drilling - laser
Quality control measurement
Legend print
Electrical testing
Photo film processing
Final finish
Inner layer treatment & layup
Develop etch & strip equipment
Chemical cleaning
Scoring
Solder mask
Desmear
Electroless copper
Photo resist exposure
Electrolytic copper
Photo resist application
Drilling - mechanical
Lamination
Routing
Estimated Average Age of On Site Units (Years)
Eq
uip
me
nt
131
Q6c,A 202 respondents
Equipment – Average Age of Functioning On Site Units

BIS/OTE U.S. Bare Printed Circuit Board Industrial Assessment
Source: U.S. Department of Commerce, Bureau of Industry and Security
U.S. Bare Printed Circuit Board Industry Assessment – 2017
Equipment – Primary Concerns
132
Q6c,A 202 respondents
77
105
142
200
213
294
312
720
1305
Availability
Other
Upgradeability
Time to replace
Skill to operate
Service
Spare parts
None
Cost to replace
0 200 400 600 800 1000 1200 1400
Number of Responses (for all equipment)
Aggregated U.S. Bare PCB Facility Responses – Primary Concerns About Continued/Future Use of On Site Equipment

BIS/OTE U.S. Bare Printed Circuit Board Industrial Assessment
Source: U.S. Department of Commerce, Bureau of Industry and Security
U.S. Bare Printed Circuit Board Industry Assessment – 2017
Equipment - Trouble Obtaining Parts and Service
133
Q6c, B 202 respondents
84
93
112
77
6
32
0
20
40
60
80
100
120
U.S. Equipment Non-U.S. Equipment
Nu
mb
er
of
Fa
cil
itie
s
Has this facility had trouble obtaining PARTS for U.S. or non-
U.S. equipment?
Yes No N/A
81 81
113
86
8
35
0
20
40
60
80
100
120
U.S. Equipment Non-U.S. Equipment
Nu
mb
er
of
Fa
cil
itie
s
Has this facility had trouble obtaining SERVICE on U.S. or non-
U.S. equipment?
Yes No N/A

BIS/OTE U.S. Bare Printed Circuit Board Industry Assessment
Source: U.S. Department of Commerce, Bureau of Industry and Security
U.S. Bare Printed Circuit Board Industry Assessment – 2017
134
Q6c,C 201 respondents
0
20
40
60
80
100
120
140
Yes No
Nu
mb
er
of
Fac
ilit
ies
Are there bare circuit board products that this facility is unable to manufacture due to the limitations of installed equipment?
Large >$40M Medium $10M-$40M Small <$10M
115
86
Equipment - Manufacturing Limitations

BIS/OTE U.S. Bare Printed Circuit Board Industrial Assessment
Source: U.S. Department of Commerce, Bureau of Industry and Security
U.S. Bare Printed Circuit Board Industry Assessment – 2017
135
Q6c,C 202 respondents
Equipment – New Equipment Supply Concerns for Tin-Lead
Bare PCBs
35
148
19
0
20
40
60
80
100
120
140
160
Yes No N/A
Nu
mb
er
of
Facilit
ies
Have you had or do you anticipate having difficulty obtaining new equipment for manufacturing tin-lead
bare circuit boards?

BIS/OTE U.S. Bare Printed Circuit Board Industrial Assessment
Source: U.S. Department of Commerce, Bureau of Industry and Security
U.S. Bare Printed Circuit Board Industry Assessment – 2017
136
Q6d,A 202 respondents
15 2
72
122
0
20
40
60
80
100
120
140
Confirmed Suspected Both No N/A
Nu
mb
er
of
Facilit
ies
Material - Prepreg
• “Prepreg would not melt to join the inner
layers together on three separate
occasions. “
• “We had a batch from [a company] that
kept delaminating now we only use [
different company product] for standard
runs.”
• “When Non-U.S. raw material
manufacturers make changes in the
material, they do not feel obligated to
notify us.”
• “We have no way of knowing if the
material is counterfeit. Our vendors
import and certify.”
• “Don’t use”
• “Purchase from OEM”
Materials - Suspected/Confirmed Counterfeit Materials Between 2012 and 2015, did this facility encounter product failures that are suspected or
confirmed to be attributed to counterfeit materials used in building bare circuit boards?

BIS/OTE U.S. Bare Printed Circuit Board Industrial Assessment
Source: U.S. Department of Commerce, Bureau of Industry and Security
U.S. Bare Printed Circuit Board Industry Assessment – 2017
137
Q6d,A 202 respondents
2 4 2
72
122
0
20
40
60
80
100
120
140
Confirmed Suspected Both No N/A
Nu
mb
er
of
Facilit
ies
Material - Laminate
• "Unknown Chinese manufacturing
using our [redacted] logo."
Materials - Suspected/Confirmed Counterfeit Materials Between 2012 and 2015, did this facility encounter product failures that are suspected or
confirmed to be attributed to counterfeit materials used in building bare circuit boards?

BIS/OTE U.S. Bare Printed Circuit Board Industrial Assessment
Source: U.S. Department of Commerce, Bureau of Industry and Security
U.S. Bare Printed Circuit Board Industry Assessment – 2017
138
Q6d,A 202 respondents
1 2 1
77
121
0
20
40
60
80
100
120
140
Confirmed Suspected Both No N/A
Nu
mb
er
of
Facilit
ies
Material - Soldermask
Materials - Suspected/Confirmed Counterfeit Materials Between 2012 and 2015, did this facility encounter product failures that are suspected or
confirmed to be attributed to counterfeit materials used in building bare circuit boards?

BIS/OTE U.S. Bare Printed Circuit Board Industrial Assessment
Source: U.S. Department of Commerce, Bureau of Industry and Security
U.S. Bare Printed Circuit Board Industry Assessment – 2017
Materials – Bare PCB Materials Procurement
139
Q6d,B 202 respondents
10
186
6
0
20
40
60
80
100
120
140
160
180
200
Yes No N/A
Nu
mb
er
of
Fa
cil
itie
s
Does this facility buy materials for the manufacture of bare circuit boards from sources other than the original manufacturer or its
authorized distributor?
1
1
10
12
14
0 5 10 15
Certificate required from themanufacturer of material
Other: Purchase material throughUSA auctions and are able to
identify most material
Systematic testing of inventory
Check authenticity of standardsorganization certification
labels/trademarks
Confirm production lots andproduction dates with the original
manufacturer
Number of Facilities
If so, what practices do you regularly use to verify that the materials are genuine and
perform to specifications?

BIS/OTE U.S. Bare Printed Circuit Board Industry Assessment
Source: U.S. Department of Commerce, Bureau of Industry and Security
U.S. Bare Printed Circuit Board Industry Assessment – 2017
CHAPTER 6:
SALES
• AGGREGATE COMPANY AND FACILITY SALES
• DOMESTIC SALES AND EXPORTS
• GOVERNMENT SALES
140

BIS/OTE U.S. Bare Printed Circuit Board Industry Assessment
Source: U.S. Department of Commerce, Bureau of Industry and Security
U.S. Bare Printed Circuit Board Industry Assessment – 2017
141
Sales (2012-2015)
• Respondents reported their total sales by facility, all circuit-board-related sales (including
design, manufacture, and assembly), and Bare circuit board manufacturing sales
(excluding design and assembly) for the period of 2012 to 2015. They also reported
figures for both U.S. and non-U.S. sales. Additionally, respondents provided the percent of
Government sales for each of the above categories.
• Bare PCBs constituted 83 percent of total sales during the four year period from 2012 to
2015. All CB sales constituted 97 percent of total sales during the four year period from
2012 to 2015.
• During the period of 2012 to 2015, five large companies out of 185 total accounted for 43
percent of total industry bare PCB sales.
• Industry Bare PCB sales for the 2012 to 2015 period were relatively flat. Bare PCB
manufacturing sales increased 1.5 percent for the period from 2012 to 2015. Large
companies were responsible for 110 percent of total Bare PCB sales growth from 2012 to
2015. 21 facilities showed sales growth every year during the 2012 to 2015 period.
36 facilities showed sales decline every year during the 2012 to 2015 period.

BIS/OTE U.S. Bare Printed Circuit Board Industry Assessment
Source: U.S. Department of Commerce, Bureau of Industry and Security
U.S. Bare Printed Circuit Board Industry Assessment – 2017
142
Sales (2012-2015)
• During the period of 2012 to 2015, U.S. Bare PCB domestic sales averaged 85 percent
compared to 15 percent for exports sales. U.S. domestic sales increased by 3.8 percent from 2012 to 2015
U.S. Bare PCB exports decreased by 13 percent from 2012 to 2015
• From 2012 to 2015, large companies accounted for 39 percent, medium for 37 percent,
and small-sized for 24 percent of domestic Bare PCB sales. During the same period, large
companies accounted for 64 percent, medium for 29 percent, and small-sized for 7
percent of Bare PCB export sales.
• From 2012 to 2015, U.S. sales growth for Bare PCBs was driven by large and medium-
sized companies which were responsible for 66 percent and 43 percent of growth,
respectively. Small-sized companies were the only category to report an increase in
exports sales from 2012 to 2015, from $17M to $25M. However, total exports decreased
13 percent, from $306M to $266M during the same period.
• U.S. Government sales increased each year, from $386M in 2012 to $453M in 2015.
Medium-sized enterprises accounted for $48M, or 71 percent of the USG sales increase
from 2012 to 2015.

BIS/OTE U.S. Bare Printed Circuit Board Industry Assessment
Source: U.S. Department of Commerce, Bureau of Industry and Security
U.S. Bare Printed Circuit Board Industry Assessment – 2017
Bare PCB Sales (2015)
143
Q7 185 respondents
Companies:
• 10 Publicly Traded
• 175 Privately Held
$432 Million
$722 Million
$875 Million
Bare PCB Sales by Company Size – Total $2.03 Billion in 2015
Small <$10M Medium $10M-$40M Large >$40M
5 Large
142 Small
38 Medium

BIS/OTE U.S. Bare Printed Circuit Board Industry Assessment
Source: U.S. Department of Commerce, Bureau of Industry and Security
U.S. Bare Printed Circuit Board Industry Assessment – 2017
Total Sales, All CB-Related Sales, Bare PCB Sales (2012-2015)
$2.39
$2.46 $2.49 $2.47
$2.31
$2.43 $2.43 $2.37
$2.00 $2.06 $2.04 $2.03
$1.5
$2.0
$2.5
2012 2013 2014 2015
$ B
illio
ns
U.S. Bare PCB Manufacturers
Total Sales All CB Sales Bare PCB Manufacturing Sales
Total Sales,
3.3% increase (2012-2015)
All CB Sales,
2.6% increase (2012-2015)
144
Q7 202 respondents
All CB sales constituted 97 percent of total sales
during the four year period from 2012 to 2015.
Bare PCBs constituted 83 percent of total sales
during the four year period from 2012 to 2015.
Bare PCB Manufacturing Sales,
1.5% increase (2012-2015)

BIS/OTE U.S. Bare Printed Circuit Board Industry Assessment
Source: U.S. Department of Commerce, Bureau of Industry and Security
U.S. Bare Printed Circuit Board Industry Assessment – 2017
Breakout of Industry Sales (2012-2015)
145
Q7 202 respondents
U.S. Non-U.S. U.S. Non-U.S. U.S. Non-U.S. U.S. Non-U.S.
1,946$ 441$ 2,030$ 434$ 2,107$ 384$ 2,089$ 380$
470$ 6$ 530$ 6$ 544$ 5$ 538$ 9$
1,885$ 428$ 2,000$ 429$ 2,066$ 368$ 2,010$ 360$
460$ 6$ 513$ 6$ 536$ 5$ 511$ 9$
1,698$ 306$ 1,731$ 332$ 1,761$ 280$ 1,763$ 266$
386$ 5$ 408$ 6$ 421$ 5$ 453$ 8$
Total Sales (in $)
All Circuit Board-Related Sales - including
design, manufacture, and assembly (in $)
Bare Circuit Board Manufacturing Sales -
excluding design and assembly (in $)
Total Government Sales
All Circuit Board-Related Government
Sales
Bare Circuit Board Government Sales
Record in $ Millions e.g. $12,000,000.00 = survey input $12
2012 2013 2014 2015
Total Sales, All CB Sales, and Bare CB Sales

BIS/OTE U.S. Bare Printed Circuit Board Industry Assessment
Source: U.S. Department of Commerce, Bureau of Industry and Security
U.S. Bare Printed Circuit Board Industry Assessment – 2017
146
Q7 202 respondents
Small: Under $10M in annual sales Medium: $10M-$40M in annual sales Large: Over $40M in annual sales
$450M
$895M
$659M
2012
Small <$10M Medium $10M-$40M Large >$40M
$452M
$936M
$676M
2013
Small <$10M Medium $10M-$40M Large >$40M
$455M
$907M
$680M
2014
Small <$10M Medium $10M-$40M Large >$40M
$451M
$885M
$693M
2015
Small <$10M Medium $10M-$40M Large >$40M
Bare PCB Sales – by Facility Size (2012-2015)

BIS/OTE U.S. Bare Printed Circuit Board Industry Assessment
Source: U.S. Department of Commerce, Bureau of Industry and Security
U.S. Bare Printed Circuit Board Industry Assessment – 2017
Distribution of Bare PCB Sales by Facility (2015)
147
43
74
28
32
16
9
0
10
20
30
40
50
60
70
80
$1-$1M $1M-$5M $5M-$10M $10-$20M $20M-$40M Over $40M
Nu
mb
er
of
Fa
cil
itie
s
Bare PCB Sales (2015)
Distribution of Bare PCB Sales by Facility (2015)
Q7 202 respondents
21 facilities reported sales
growth every year during the
2012 to 2015 period.
• Average sales growth of 68
percent (2012-2015).
• Average yearly sales growth
of 18 percent.
36 facilities reported sales
decline every year during the
2012 to 2015 period.
• Average sales decline of 32
percent (2012-2015).
• Average yearly sales decline
of 13 percent

BIS/OTE U.S. Bare Printed Circuit Board Industry Assessment
Source: U.S. Department of Commerce, Bureau of Industry and Security
U.S. Bare Printed Circuit Board Industry Assessment – 2017
148
Q7 202 respondents
$450 $452 $455 $451
$895 $936 $907 $885
$659 $676 $680 $693
0
500
1,000
1,500
2,000
2,500
2012 2013 2014 2015
$ M
illio
ns
Small <$10M Medium $10M-$40M Large >$40M
Bare PCB Sales
Growth (2012-2015):
Large: 5.2%
Medium: -1.1%
Small: 0.2%
Large facilities were responsible for 135 percent of total Bare
PCB sales growth from 2012 to 2015.
Bare PCB Sales (2012-2015) – By Facility Size

BIS/OTE U.S. Bare Printed Circuit Board Industry Assessment
Source: U.S. Department of Commerce, Bureau of Industry and Security
U.S. Bare Printed Circuit Board Industry Assessment – 2017
149
Q7 185 respondents
$430 $434 $436 $432
$727 $753 $726 $722
$847 $877 $880 $875
0
500
1,000
1,500
2,000
2,500
2012 2013 2014 2015
$ M
illi
on
s
Small <$10M Medium $10M-$40M Large >$40M
Bare PCB Sales
Growth (2012-2015):
Large: 3.3%
Medium: -0.7%
Small: 0.5%
Large companies were responsible for 110 percent of total Bare
PCB sales growth from 2012 to 2015.
Bare PCB Sales (2012-2015) – By Company Size

BIS/OTE U.S. Bare Printed Circuit Board Industry Assessment
Source: U.S. Department of Commerce, Bureau of Industry and Security
U.S. Bare Printed Circuit Board Industry Assessment – 2017
150
Q7 185 respondents
$1,157 $1,187 $1,162 $1,154
$847 $877 $880 $875
0
200
400
600
800
1,000
1,200
1,400
2012 2013 2014 2015
$ M
illio
ns
Large Companies and All Others (2012-2015)
All Others <$40M Large >$40M (5 companies)
During the period of 2012 to 2015, five large companies out of 185
total accounted for 43 percent of total industry Bare PCB sales.
Bare PCB Sales (2012-2015) – Large Companies

BIS/OTE U.S. Bare Printed Circuit Board Industry Assessment
Source: U.S. Department of Commerce, Bureau of Industry and Security
U.S. Bare Printed Circuit Board Industry Assessment – 2017
151
Q7 202 respondents
$306 $332 $280 $266
$1,698 $1,731 $1,762 $1,763
0
500
1,000
1,500
2,000
2,500
2012 2013 2014 2015
$ M
illio
ns
Bare PCB Sales – U.S. and Exports (2012-2015)
Non-U.S. Customer U.S. Customer
During the period of 2012
to 2015 U.S. Bare PCB
sales averaged 85 percent
compared to 15 percent
for exports sales.
From 2012 to 2015:
U.S. domestic sales
increased by 3.8 percent
Exports decreased by 13
percent
Bare PCB Sales (2012-2015) U.S. and Exports

BIS/OTE U.S. Bare Printed Circuit Board Industry Assessment
Source: U.S. Department of Commerce, Bureau of Industry and Security
U.S. Bare Printed Circuit Board Industry Assessment – 2017
Bare PCB Company Sales (2012-2015) U.S. and Exports
152
Q7 185 respondents
$413
$17
$414
$19
$416
$20
$407
$25
$634
$93
$636
$117
$651
$74
$662
$61
$651
$196
$681
$196
$694
$185
$694
$181
0
200
400
600
800
1,000
1,200
1,400
1,600
1,800
2012 U.S. 2012Exports
2013 U.S. 2013Exports
2014 U.S. 2014Exports
2015 U.S. 2015Exports
$ M
illio
ns
Bare PCB Sales by Company Size (2012-2015)
Small <$10M Medium $10M-$40M Large >$40M

BIS/OTE U.S. Bare Printed Circuit Board Industry Assessment
Source: U.S. Department of Commerce, Bureau of Industry and Security
U.S. Bare Printed Circuit Board Industry Assessment – 2017
153
Q7 202 respondents
$433
$17
$433
$19
$435
$20
$426
$25
$795
$100
$811
$125
$816
$90
$818
$67
$470
$189
$487
$188
$511
$170
$519
$174
$-
$200
$400
$600
$800
$1,000
$1,200
$1,400
$1,600
$1,800
2012U.S.
2012Exports
2013U.S.
2013Exports
2014U.S.
2014Exports
2015U.S.
2015Exports
$ M
illi
on
s
Bare PCB Sales by Facility Size (2012-2015)
Small <$10M Medium $10M-$40M Large >$40M
Bare PCB Facility Sales (2012-2015)U.S. and Exports

BIS/OTE U.S. Bare Printed Circuit Board Industry Assessment
Source: U.S. Department of Commerce, Bureau of Industry and Security
U.S. Bare Printed Circuit Board Industry Assessment – 2017
Bare PCB Company Sales (2012-2015) U.S. and Exports
154
Q7 185 respondents
Company Size U.S. Sales
% Change
(2012-2015)
Export Sales
% Change
(2012-2015)
Large >$40M 6.6% -7.7%
Medium $10M-$40M 4.4% -34.4%
Small <$10M -1.5% 47.1%
Facility Size U.S. Sales
% Change
(2012-2015)
Export Sales
% Change
(2012-2015)
Large >$40M 10.4% -7.9%
Medium $10M-$40M 2.9% -33%
Small <$10M -1.6% 47%
• From 2012 to 2015, U.S. sales
growth for Bare PCBs was driven
by large and medium-sized
companies which were
responsible for 66 percent and 43
percent of growth, respectively.
• Small-sized companies were the
only category to report an
increase in exports sales from
2012 to 2015, from $17M to
$25M. However, total exports
decreased 13 percent, from
$306M to $266M during the
same period.

BIS/OTE U.S. Bare Printed Circuit Board Industry Assessment
Source: U.S. Department of Commerce, Bureau of Industry and Security
U.S. Bare Printed Circuit Board Industry Assessment – 2017
155
Q7 202 respondents
$392 $414 $426 $461
$1,578 $1,616 $1,582 $1,538
0
500
1,000
1,500
2,000
2,500
2012 2013 2014 2015
$ M
illi
on
s
Bare PCB Sales by U.S. Facilities (2012-2015)
Government Sales Non-Government Sales (Commercial)
Bare PCB Sales (2012-2015) Government vs. Non-Government Sales
$386 $408 $421 $453
$5 $6 $5
$8
0
100
200
300
400
500
2012 2013 2014 2015
$ M
illi
on
s
Bare PCB Government Sales by U.S. Facilities (2012-2015)
U.S. Government Non-U.S. Government (Exports)
• Government sales accounted for 21
percent of total Bare PCB sales during the
2012 to 2015 period.
• U.S. Government sales accounted for
99 percent of total Government sales
during the 2012 to 2015 period.

BIS/OTE U.S. Bare Printed Circuit Board Industry Assessment
Source: U.S. Department of Commerce, Bureau of Industry and Security
U.S. Bare Printed Circuit Board Industry Assessment – 2017
156
Q7 202 respondents
$98 $100 $106 $112
$223 $238 $248 $271
$65 $70
$67
$70
0
50
100
150
200
250
300
350
400
450
2012 2013 2014 2015
$ M
illi
on
s
USG Bare PCB Sales by U.S. Facilities (2012-2015)
Large >$40M Medium $10M-$40M Small <$10M
Bare PCB Sales (2012-2015)U.S. Government
USG sales increased each year, from
$386M in 2012 to $453M in 2015.
• 5.5 Percent average increase year
to year.
• 17 percent total increase (2012 to
2015).
USG sales increase (2012-2015)
• Large: 14 percent
• Medium: 22 percent
• Small: 14 percent
Medium-sized enterprises accounted
for $48M, or 71 percent of the USG
sales increase from 2012 to 2015.
• Large facilities accounted for
$14M, or 21 percent of USG sales
increase (2012 to 2015).
• Small facilities accounted for $5M,
or 8 percent of USG sales increase
(2012 to 2015).

BIS/OTE U.S. Bare Printed Circuit Board Industry Assessment
Source: U.S. Department of Commerce, Bureau of Industry and Security
U.S. Bare Printed Circuit Board Industry Assessment – 2017
CHAPTER 7:
FINANCIALS
• FINANCIAL RISK RATINGS
• NEGATIVE NET INCOME AND FACILITIES OPERATING AT A LOSS
• NET PROFIT MARGIN
• NET SALES PER EMPLOYEE
• DEBT RATIO
157

BIS/OTE U.S. Bare Printed Circuit Board Industry Assessment
Source: U.S. Department of Commerce, Bureau of Industry and Security
U.S. Bare Printed Circuit Board Industry Assessment – 2017
Financials (2012-2015)
158
BIS survey respondents provided data on select financial accounting items, including net
and operating income, assets, liabilities, and inventories.
BIS used this financial data to calculate certain financial ratios, profitability, and other
metrics. Additionally, BIS developed a customized financial risk metric to better capture the
overall financial condition of respondents. The model was based largely on standardized
financial ratios covering profitability, liquidity, leverage, and default probability of an
organization over time. Additional select qualitative data were taken into account during the
financial risk evaluation.
Respondents were assigned a comprehensive 2012-2015 financial risk score, which
incorporated yearly scores and trends in financial health. Based on this scorecard,
respondents were categorized as low/neutral risk, moderate/elevated risk, or high/severe
risk. Some respondents did not have data for all years or all measures and as a result could
not be assigned a financial risk score. These respondents are included in the uncalculated
risk category.

BIS/OTE U.S. Bare Printed Circuit Board Industry Assessment
Source: U.S. Department of Commerce, Bureau of Industry and Security
U.S. Bare Printed Circuit Board Industry Assessment – 2017
FinancialsFacility Financial Risk Ratings (2012-2015)
5
136
47
14
0
20
40
60
80
100
120
140
160
High/Severe Risk Low/Neutral Risk Moderate/ElevatedRisk
Uncalculated
Nu
mb
er
of
Fa
cil
itie
s
Facility Financial Risk Rating
Respondents were assigned a
comprehensive 2012-2015 financial
risk score, which incorporated yearly
scores and trends in financial health.
Based on this scorecard, respondents
were categorized as low/neutral risk,
moderate/elevated risk, or
high/severe risk.
Some respondents did not have data
for all years or all measures and as a
result could not be assigned a
financial risk score.
These respondents are included in
the uncalculated risk category.
159
Q8 202 respondents

BIS/OTE U.S. Bare Printed Circuit Board Industry Assessment
Source: U.S. Department of Commerce, Bureau of Industry and Security
U.S. Bare Printed Circuit Board Industry Assessment – 2017
FinancialsFinancial Risk Ratings By Facility Size (2012-2015)
63 11
36
72
4
94
37
110
20
40
60
80
100
120
140
Nu
mb
er
of
Fac
ilit
ies
Financial Risk Rating – Facility Size
Large >$40M Medium $10M-$40M Small <$10M
202 respondents
160
Q8
6 311
34
623
60
24
50
10
20
30
40
50
60
70
80
90
100
Nu
mb
er
of
Fac
ilit
ies
Financial Risk Rating –Facilities with Defense-Related Production
Large >$40M Medium $10M-$40M Small <$10M
145 respondents

BIS/OTE U.S. Bare Printed Circuit Board Industry Assessment
Source: U.S. Department of Commerce, Bureau of Industry and Security
U.S. Bare Printed Circuit Board Industry Assessment – 2017
FinancialsFinancial Risk Ratings By Facility Size (2012-2015)
161
Q8
Facility
Financial Risk Score
Large
>$40M
Medium
$10M-
$40M
Small
<$10MTotal
High/Severe Risk 0 1 4 5
Low/Neutral Risk 6 36 94 136
Moderate/Elevated Risk 3 7 37 47
Uncalculated 1 2 11 14
Total 10 46 146 202
Financial Risk Rating
Facility Size
Facility
Financial Risk Score
Large
>$40M
Medium
$10M-
$40M
Small
<$10MTotal
High/Severe Risk 0 1 3 4
Low/Neutral Risk 6 34 60 100
Moderate/Elevated Risk 3 6 24 33
Uncalculated 1 2 5 8
Total 10 43 92 145
Financial Risk Rating
Facilities with Defense-Related
Bare PCB Production
• Only 5 out of 202 Bare PCB manufacturing
facilities received a High/Severe financial risk
score
• 4 out of the 5 Bare PCB manufacturing facilities
that received a High/Severe financial risk score
reported some level of defense-related production

BIS/OTE U.S. Bare Printed Circuit Board Industry Assessment
Source: U.S. Department of Commerce, Bureau of Industry and Security
U.S. Bare Printed Circuit Board Industry Assessment – 2017
FinancialsFinancial Risk Ratings by Facility Size (2012-2015)
6, 60%
3, 30%
1, 10%
Financial Risk Rating – Large Facilities
(10)
High/Severe Risk
Low/Neutral Risk
Moderate/Elevated Risk
Uncalculated
162
Q8 202 respondents
1, 2%
36, 78%
7, 15%
2, 5%
Financial Risk Rating – Medium Facilities
(46)
High/Severe Risk
Low/Neutral Risk
Moderate/Elevated Risk
Uncalculated
4, 3%
94, 64%
37, 25%
11, 8%
Financial Risk Rating – Small Facilities
(146)
High/Severe Risk
Low/Neutral Risk
Moderate/Elevated Risk
Uncalculated

BIS/OTE U.S. Bare Printed Circuit Board Industry Assessment
Source: U.S. Department of Commerce, Bureau of Industry and Security
U.S. Bare Printed Circuit Board Industry Assessment – 2017
FinancialsNegative Net Income (2012-2015)
1 3 2 18
13
97
48
56
53 57
0
10
20
30
40
50
60
70
80
2012 2013 2014 2015
Nu
mb
er
of
Fa
cil
itie
s
Facilities Reporting Negative Net Income (2012-2015)
Large >$40M Medium $10M-$40M Small <$10M
An average of 65
facilities per year, or 32
percent of survey
respondents, reported
negative net income from
2012 to 2015.
22 facilities reported
negative net income for
all four years from 2012
to 2015.
163
Q8 202 respondents

BIS/OTE U.S. Bare Printed Circuit Board Industry Assessment 164
Source: U.S. Department of Commerce, Bureau of Industry and Security
U.S. Bare Printed Circuit Board Industry Assessment – 2017
FinancialsFacilities Operating at Net Loss (2012-2015)
Q8 22 respondents
• 22 facilities reported negative net income every year from 2012 to 2015
• 8 reported dependency on the USG for their continued viability
• 4 have defense-related sales of 50% or more
• 5 reported supporting 20 or more USG programs
4
13
4
1
Financial Risk Rating
High/Severe Risk
Moderate/ElevatedRisk
Low/Neutral Risk
Uncalculated
4
1
9
4
4
Changes Expected 2016-2020
PotentialClosure
Contraction
Modernization
Expansion
None/Other

BIS/OTE U.S. Bare Printed Circuit Board Industry Assessment
Source: U.S. Department of Commerce, Bureau of Industry and Security
U.S. Bare Printed Circuit Board Industry Assessment – 2017
FinancialsNet Profit Margin (2012-2015)
3.2%
2.4%2.1%
3.1%
8.4%
2.6%
6.2%
9.7%
6.2%
4.5%
5.4%
4.9%
1.9% 1.7%
0.8%
2.0%
0%
1%
2%
3%
4%
5%
6%
7%
8%
9%
10%
2012 2013 2014 2015
Ne
t P
rofi
t M
arg
in
Net Profit Margin by Facility Size
Average Large >$40M Medium $10M-$40M Small <$10M
While all but one large
facilities reported lower net
profit in 2013, two facilities
accounted for the majority of
the decline in profitability
among large facilities in
2013.
The average profit margin
for all respondents from
2012 to 2015 was 2.7
percent.
Large – 6.6 percent
Medium – 5.3 percent
Small – 1.6 percent
165
Q8 202 respondents

BIS/OTE U.S. Bare Printed Circuit Board Industry Assessment
Source: U.S. Department of Commerce, Bureau of Industry and Security
U.S. Bare Printed Circuit Board Industry Assessment – 2017
FinancialsSales per Employee (2012-2015)
$723 $662 $773 $787
$3,151
$2,887
$3,496 $3,538
$1,962
$1,730
$2,056 $2,118
$144 $145 $152 $153 $-
$500
$1,000
$1,500
$2,000
$2,500
$3,000
$3,500
$4,000
2012 2013 2014 2015
$ T
ho
us
an
ds
Average Annual Net Sales per Employee by Respondent Size
Average Large >$40M Medium $10M-$40M Small <$10M
Average net sales per
employee increased 8.9
percent from 2012 to
2015. The increase was
highest among large
facilities at 12.2
percent, followed by
medium facilities at 8
percent, and small
facilities at 6.3 percent.
166
Q8 202 respondents

BIS/OTE U.S. Bare Printed Circuit Board Industry Assessment
Source: U.S. Department of Commerce, Bureau of Industry and Security
U.S. Bare Printed Circuit Board Industry Assessment – 2017
FinancialsDebt Ratio (2012-2015)
0.71 0.71
1.23
0.90
0.51 0.48 0.48 0.48
0.41 0.420.31
0.45
0.82 0.82
1.58
1.08
0
0.2
0.4
0.6
0.8
1
1.2
1.4
1.6
1.8
2012 2013 2014 2015
To
tal L
iab
ilit
ies
/ T
ota
l A
ss
ets
Debt Ratio by Facility Size
Average Large >$40M Medium $10M-$40M Small <$10M
Debt Ratio is a financial ratio
that measures the extent of a
company’s leverage, or the
percentage of a company’s
assets relative to debt.
Debt Ratio
=
Total Liabilities/Total Assets
Respondent debt ratios were
calculated using financial data
provided in the BIS industry
survey. The figures in this
chart represent the average of
all individual respondent debt
ratios calculated.
167
Q8 202 respondents

BIS/OTE U.S. Bare Printed Circuit Board Industry Assessment
Source: U.S. Department of Commerce, Bureau of Industry and Security
U.S. Bare Printed Circuit Board Industry Assessment – 2017
CHAPTER 8:
RESEARCH AND DEVELOPMENT (R&D)
AND CAPITAL EXPENDITURES (CAPEX)
• NEED FOR R&D AND CAPITAL INVESTMENT (CAPEX)
• R&D R&D EXPENDITURES AND FUNDING SOURCES (2012-2015)
TOP PRIORITIES AND INVESTMENT FACTORS
DEPARTMENT OF DEFENSE (DOD) IMPACT AND SUPPORT
• CAPEX CAPITAL EXPENDITURES (2012-2015)
EFFECT OF U.S. GOVERNMENT SPENDING CUTBACKS
TOP PRIORITIES (2016-2020)
168

BIS/OTE U.S. Bare Printed Circuit Board Industry Assessment 169
Source: U.S. Department of Commerce, Bureau of Industry and Security
U.S. Bare Printed Circuit Board Industry Assessment – 2017
PCB manufacturing is a process that is both capital and
technology-intensive
Technology and processes
advance rapidly driving need for new equipment Manufacturers
need to add to or update
techniques and equipment regularly to
remain globally competitive
Cost of equipment and innovation has
resulted in a gap between large
and small manufacturers
Reported Average Net
Profit Margin (2012-2015):• Large - 6.7%
• Medium - 5.3%
• Small - 1.6%
Reported Average Net
Sales per Employee
(2012-2015):• Large – $ 3.53M
• Medium - $2.12M
• Small - $153K
Bare PCB CAPEX as a
percentage of 2015 sales:• Large – 2.1%
• Medium – 4.1%
• Small – 6.2%
Only 38 out of 185
companies reported
conducting R&D:• Large - 4 (80%)
• Medium - 14 (39%)
• Small - 20 (13%)
Need for R&D and Capital Investment (CAPEX)
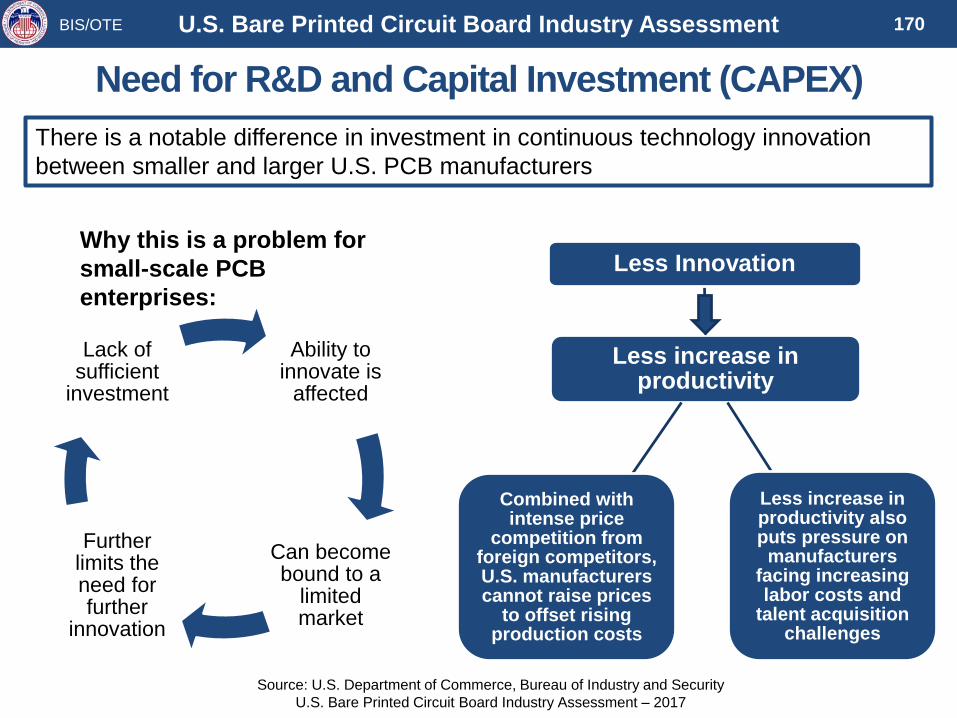
BIS/OTE U.S. Bare Printed Circuit Board Industry Assessment 170
Source: U.S. Department of Commerce, Bureau of Industry and Security
U.S. Bare Printed Circuit Board Industry Assessment – 2017
Need for R&D and Capital Investment (CAPEX)
There is a notable difference in investment in continuous technology innovation
between smaller and larger U.S. PCB manufacturers
Ability to innovate is
affected
Can become bound to a
limited market
Further limits the need for further
innovation
Lack of sufficient
investment
Why this is a problem for
small-scale PCB
enterprises:
Less increase in productivity
Less Innovation
Less increase in productivity also puts pressure on
manufacturers facing increasing labor costs and
talent acquisition challenges
Combined with intense price
competition from foreign competitors, U.S. manufacturers cannot raise prices
to offset rising production costs

BIS/OTE U.S. Bare Printed Circuit Board Industry Assessment 171
Source: U.S. Department of Commerce, Bureau of Industry and Security
U.S. Bare Printed Circuit Board Industry Assessment – 2017
• Industry comment - “Innovation is important to meeting both legacy and future DoD needs.“
• R&D for PCBs has shifted offshore (partly due to foreign government R&D support and growth in Asian PCB
manufacturing).
• U.S. PCB manufacturers, facing lower margins and lower sales volumes, are becoming limited in their
investments in R&D, technology, and innovation.Industry Comments:
• “The Asian market has driven the commercial market share out of the country. The small companies cannot afford the
equipment needed for technology advancement.”
• “Large portion of the US bare circuit board industry, (137 out of 202, 68%) are sub $10 million in revenue that have not
been able to recapitalize and have aging ownership.”
• “Lack of capital investments by these facilities makes them non-competitive technologically – and therefore do not have
the capability to meet today’s demands.”
• “In the U.S., only the remaining large public and private PCB companies will be able to afford the necessary capital
costs for acquiring state-of-the-art equipment.”
• It is important for the U.S. PCB industry to make the investments in advanced manufacturing required in
order to maintain competency and competitiveness with the global leaders in China, Taiwan, and Japan.
• Need for U.S. PCB Industry partnership and collaboration efforts (consortium) to conduct R&D?
Possible partners – DARPA, NIST, iNEMI, Universities, others?
Increase investments in basic technology, product R&D, and process R&D.
Creation of tax incentives, rebates or credits for DoD suppliers of PCBs in order to renew interest and
investment by U.S. PCB manufacturers.
Need for R&D and Capital Investment (CAPEX)

BIS/OTE U.S. Bare Printed Circuit Board Industrial Assessment
Source: U.S. Department of Commerce, Bureau of Industry and Security
U.S. Bare Printed Circuit Board Industry Assessment – 2017
Yes, 40,
20%
No, 162, 80%
Does this facility conduct research and development
(R&D)?
Yes No
202 respondentsQ9a,A
172
Research & Development (2015)
BIS asked survey respondents by facility
whether they conducted research and
development (R&D). Forty facilities
(representing 38 companies) replied that they
do, accounting for 20 percent of all facilities.
Of the 38 of 185 companies that reported
conducting R&D:
Large companies - 4 out of 5 (80%)
Medium companies - 14 out of 38 (37%)
Small companies - 20 out of 142 (13%)

BIS/OTE U.S. Bare Printed Circuit Board Industry Assessment 173
Source: U.S. Department of Commerce, Bureau of Industry and Security
U.S. Bare Printed Circuit Board Industry Assessment – 2017
Research & Development
Q9a,B 38 respondents
$43,871 $49,243
$61,876 $62,991
$11,517 $13,327 $14,919 $16,357
$4,400 $4,411 $4,262 $4,684 $-
$10,000
$20,000
$30,000
$40,000
$50,000
$60,000
$70,000
2012 2013 2014 2015
$ T
ho
us
an
ds
U.S. Bare PCB Facilities R&D Expenditures (2012-2015)
Total R&D Expenditures
Bare Circuit Board R&D Expenditures
Defense-Related Bare Circuit Board R&D Expenditures
*Note: R&D expenditures for one large company are not included

BIS/OTE U.S. Bare Printed Circuit Board Industry Assessment
Source: U.S. Department of Commerce, Bureau of Industry and Security
U.S. Bare Printed Circuit Board Industry Assessment – 2017
Research & DevelopmentTypes of Expenditures
174
Q9a,B 38 respondents
$43,871 $49,243
$61,876 $62,991
$1,366 $1,250 $1,119 $1,797
$2,174 $2,519 $3,739 $3,131
$18,325 $19,802
$24,462 $24,969 $22,007
$25,671
$32,556 $33,094
$-
$10,000
$20,000
$30,000
$40,000
$50,000
$60,000
$70,000
2012 2013 2014 2015
$ T
ho
us
an
ds
U.S. Bare PCB Facilities Reported R&D Expenditures (2012-2015)
Total R&D Expenditures Basic Research Applied Research Product/Process Development No Data
*Note: R&D expenditures for one large company are not included
**No data refers to R&D expenditures not identified by type. Many respondents were not able to report
R&D expenditures with that level of detail.

BIS/OTE U.S. Bare Printed Circuit Board Industrial Assessment
Source: U.S. Department of Commerce, Bureau of Industry and Security
U.S. Bare Printed Circuit Board Industry Assessment – 2017
175
Research and DevelopmentFunding Sources
Q9a,C 38 respondents
$43,871
$49,275
$59,294 $60,964
$21,427 $23,124
$25,450 $27,240
$86 $48 $48 $52
$460 $532 $1,273 $555
$-
$10,000
$20,000
$30,000
$40,000
$50,000
$60,000
$70,000
2012 2013 2014 2015
$ T
ho
us
an
ds
U.S. Bare PCB Facilities R&D Funding Sources (2015)
Total R&D Funding Sources
Internal/Self-Funded/IRAD
Total Federal Government
U.S. Industry, Venture Capital, Non-Profit
*Note: R&D expenditures for one large company are not included

BIS/OTE U.S. Bare Printed Circuit Board Industry Assessment 176
Source: U.S. Department of Commerce, Bureau of Industry and Security
U.S. Bare Printed Circuit Board Industry Assessment – 2017
Research and DevelopmentPercentage of Total Sales
1.84%2.00%
2.48% 2.55%
0.00%
0.50%
1.00%
1.50%
2.00%
2.50%
3.00%
2012 2013 2014 2015
R&
D /
To
tal
Sale
s
U.S. Bare PCB Facilities Reported R&D Expenditures as a Percentage of Total Sales (2012-2015)
*Note: R&D expenditures for one large company are not included
Q9a,B1 38 respondents

BIS/OTE U.S. Bare Printed Circuit Board Industrial Assessment
Source: U.S. Department of Commerce, Bureau of Industry and Security
U.S. Bare Printed Circuit Board Industry Assessment – 2017
7
8
12
14
15
15
18
25
55
0 10 20 30 40 50 60
Direct IC die-on-board ultra high density interconnects
Sub-10 micrometer photoresists, etchants
Ultra smooth copper foil
Stretchable/wearable electronics
Advanced embedded active/passive device methods
Printed electronics (additive, 3-D, etc.)
Development of very thin unsupported dielectrics
Enhanced solid copper via fill methods
Other
Number of Responses
Anticipated Top R&D Priorities (2016-2020)
Survey respondents could
list up to 5 anticipated top
R&D priorities.
177
Q9b,A 59 respondents
Research & DevelopmentTop Priorities

BIS/OTE U.S. Bare Printed Circuit Board Industrial Assessment
Source: U.S. Department of Commerce, Bureau of Industry and Security
U.S. Bare Printed Circuit Board Industry Assessment – 2017
OTHER: • Fineline etching development, .002" space/trace or less • long thin flex for medical catheter products
• Focus is currently in increasing blind and buried via capability • new high speed materials and technologies required to manufacture
• HDI, obtaining 1 mil lines and spaces and thin dielectrics. • RF Rigid Flex
• High Temp Rigid Flex • Stacked/staggered via configurations
• Laser drilled microvias • 50 micron lines/spacing
• Market focus on high end application development related to
Automotive and Industrial Devices• alternate interconnect methods, no vias, conductive pastes
• Material Testing • Backdrilling implementation
• Microvias • Blind/Buried via capability
• No R&D going forward • Connectorization on automatic RF connectors
• Prototype product requires R&D to perfect each part/process. • Fine lines and spaces down to .001
• Sequential Lamination strategies and optimizations • Greater capability to model thermal solutions for flex heater products
• Work on development of flex products and nano technology • Laser cutting of polyimide coverlay materials
• Working on direct imaging • Extra Large Form-Factor for RF Antennas
• Additive plating / circuit creation • HDI
• Back drill stub capability • Improve Flex / Rigid-Flex capabilities
• Development of low -Loss / RF material capabilities• Novel electrical interconnect methods for high end (high layer count, high density )
printed
• Embedded plastic circuitry • Speed and efficiency improvements & yield improvement on HDI boards.
• Focus will be on developing a non-conductive via-fill capability • Sub 25 micron circuits
• Heavy copper builds using plating and lamination.• High performance (speed) printed wiring boards using ultra-low loss dielectrics and
smooth copper
• High Density semiconductor packaging, including use of glass
interposers• High speed/low loss designs and hybrid construction will increase.
• High speed flex circuitry >12Gbps • Routing and scoring of rigid boards
178
Q9b,A 59 respondents
Research & Development - Top Priorities: ‘Other’ Comments

BIS/OTE U.S. Bare Printed Circuit Board Industrial Assessment
Source: U.S. Department of Commerce, Bureau of Industry and Security
U.S. Bare Printed Circuit Board Industry Assessment – 2017
179
Q9b,A 59 respondents
Research & Development - Top Priorities: Comments
Enhanced solid
copper via fill
methods
• Copper fill and high aspect ratio needs
• Reduce cycle-time, expand aspect ratio capability
• Need to continue to refine this process and improve
throughput.
• Plan to add metal and epoxy via fill capabilities
• Copper via fill is demanded in today’s market and will
continue into the future.
• Currently process is very time consuming
• High Density Interconnect (HDI) package test
applications
• Close vias at plating or other additive material to allow
capping or preclude it's need
• Required in many sequential lamination strategies
Development of very
thin unsupported
dielectrics
• LCP
• 2 mil cores and lower
• HDI packaging
• For all flexible circuit applications, especially medical
devices, including implantable.
• IRAD driving thin flexible interposers fabrication and
die assembly
• Need to improve signal loss
Advanced embedded
active/passive device
methods
• Looking into wireless devices
• Seeing more demand for these technologies.
• Drives package and overall system shrink
• Specifically whether or not to etch our own resistors
• Reduce foot print
• Passive integration to support density
Printed electronics
(additive, 3-D, etc.)
• eSurface process.
• Identify materials that can print on polyimide film
• Heaters
• Future methods of manufacturing, new technology
Stretchable/
wearable
electronics
• Addition of metal and epoxy via fill capabilities
• Flex and rigid-flex product
• Flex circuits is an area to investigate
Ultra smooth
copper foil
• Prototypes
• Stacked/staggered via configurations
• RF demand to improve circuit loss
Sub-10 micrometer
photoresists,
etchants
• High speed designs
• 2 mil cores and lower
Direct IC die-on-
board ultra high
density
interconnects
• Working with [redacted] for special dry film resist and etching
needs
• Higher density product will continue to grow requiring
advancements in capability.

BIS/OTE U.S. Bare Printed Circuit Board Industrial Assessment
Source: U.S. Department of Commerce, Bureau of Industry and Security
U.S. Bare Printed Circuit Board Industry Assessment – 2017
49 49
34
07 6
123
146 147156
199
0
20
40
60
80
100
120
140
160
180
200
Need for competitiveadvantage
Customerrequirements
Industry roadmap Other
Nu
mb
er
of
Fa
cil
itie
s
Key Factors Driving R&D Investment (2015)
Yes No N/A
180
Q9b,B 202 respondents
Research & DevelopmentInvestment Factors

BIS/OTE U.S. Bare Printed Circuit Board Industrial Assessment
Source: U.S. Department of Commerce, Bureau of Industry and Security
U.S. Bare Printed Circuit Board Industry Assessment – 2017
Need for competitive advantage:
• “Maintaining competitive edge is always a concern with foreign competition”
• “Competing globally”
• “Contract manufacturers for semiconductor packaging are continuing to increase packaging density to accommodate
the continually shrinking nodes for IC manufacturers and increasing signal processing speeds for semiconductor
packaging and printed wiring boards. Must accommodate the OEMs’ needs for faster data processing”
• “Product differentiator”
• “Direct Image will be used for a sales tool also”
• “To continue sustained growth R&D is required”
• “Increasing capabilities promotes additional business”
• “Need to keep focusing on niche opportunities, steer away from the U.S. price erosion market”
• “Need to stay on high end of technology curve”
• “Reduce cost, improve yields and capabilities”
• “System level competitive advantage”
• “Trying to separate ourselves from local competitors and their standard capabilities”
181
Q9b,B 202 respondents
Research & Development Key Factors Driving Investment: Industry Comments

BIS/OTE U.S. Bare Printed Circuit Board Industrial Assessment
Source: U.S. Department of Commerce, Bureau of Industry and Security
U.S. Bare Printed Circuit Board Industry Assessment – 2017
Customer Requirements:
• “Advances in semiconductor performance and corresponding test applications”
• “Attempt to lock in with customers that need our specialized services”
• “Customer asking for direct imaging”
• “Customers are demanding more complex builds, more dense PCBs”
• “Customers continually drive new products, technology”
• “Customers requesting quick turn for evaluation”
• “Designs are getting smaller with more spacing constraints”
• “Development for specific high-end applications”
• “Higher temp, higher frequency, higher speed in harsher environments”
• “Increase packaging density and signal processing speeds”
• “Market demand always drives needed capability”
• “Need to maintain and grow market share with key customers”
• “Our customers have needs now for both ultra fine lines and heavy copper”
• “Reacting to customer requirements helps promote growth activities”
182
Q9b,B 202 respondents
Research & Development Key Factors Driving Investment: Industry Comments

BIS/OTE U.S. Bare Printed Circuit Board Industrial Assessment
Source: U.S. Department of Commerce, Bureau of Industry and Security
U.S. Bare Printed Circuit Board Industry Assessment – 2017
Industry roadmap:
• “Again based on market demand”
• “All of our competitors have Direct Image”
• “High speed (> 20 gig performance PCI application in semiconductor)”
• “Keeping up with and exceeding industry expectations promotes relevance with customers”
• “Manufacturing capabilities to support customer roadmap”
• “Need to stay ahead of the curve”
• “Technology is moving towards more complicated and dense designs”
• “U.S. need to stay on high end of technology curve”
183
Q9b,B 202 respondents
Research & DevelopmentKey Factors Driving Investment: Industry Comments

BIS/OTE U.S. Bare Printed Circuit Board Industrial Assessment
Source: U.S. Department of Commerce, Bureau of Industry and Security
U.S. Bare Printed Circuit Board Industry Assessment – 2017
Yes, 14, 7%
No, 45, 22%
N/A, 143, 71%
From 2012-2015, were your organization's R&D expenditures adversely impacted by reductions in U.S. Government defense spending?
Yes No N/A
Comments:
• “Defense contracts are usually not cutting
edge technology”
• “Government defense business is a
relatively low percentage of our total
market today”
• “Investments increased to support
technology goals”
• “Research and Development is
fundamental in remaining relevant in the
marketplace and was not impacted by
reduced government spending”
Comments:
• “Budget cuts and price pressure have
reduced sales and available resources”
• “Government support of organizations like
[redacted] reduced or eliminated contract
money available for funding [redacted]
programs”
• “Many project that were well underway were
put on hold causing a great reduction in shop
loading”
• “Reduce customer demand and product
development”
• “Sequester hurt us, and many others, and
we are still recovering”
• “We use to do a lot more work with
[redacted] locally in [redacted], but they are
hardly doing anything”
• “Higher order volume and more consistent
order volume would greatly improve R&D
expenditures. Currently the bare board
industry is in very tough financial shape, so
very little true R&D takes place.”
• “With more government business, we would
have theoretically spent more on R&D”
184
Q9b,C 202 respondents
Research & DevelopmentUSG Spending Reduction Impacts

BIS/OTE U.S. Bare Printed Circuit Board Industrial Assessment
Source: U.S. Department of Commerce, Bureau of Industry and Security
U.S. Bare Printed Circuit Board Industry Assessment – 2017
185
Q9b,D 202 respondents
Research & DevelopmentImproving PCB Performance (2015)
Yes, 24, 12%
No, 29, 14%
N/A, 149, 74%
Are there specific R&D areas related to bare circuit board manufacturing that DOD could support to improve board
performance?
Yes No N/A
Comments for ‘Yes’:
• “[redacted] for enhanced buried capacitance RF/video transmission”
• “Additive technologies and the integration of optics on board technologies”
• “All aspects of printed circuit fabrication from Single-sided to HDI multilayers”
• “All manufacturers are hindered by material dimensional stability and also
copper via longevity after numerous temperature cycles”
• “Development work for new technologies is not readily available to most
suppliers”
• “HDI manufacturing technology”
• “Material testing that support cryogenic temps currently only single source
available”
• “Printed heaters”
• “RF materials, Advanced substrate development for Aerospace community.
Development of advanced cooling methods”
• “Rigid-Flex capabilities, Embedded Passives”
• “Strengthen domestic sourcing of leading material and equipment base”
• “Ultra high frequency applications”
• “Ultra-low loss dielectric materials, smooth copper, optoelectronics”
• “Advanced organic microelectronic packaging could move forward more
quickly with DOD funding and support”
• “Need information on how to develop things like Rigid/flex combination that
we have had requests for. Need educational resources”
• “We have been working with the (redacted) technology for additive plating and
circuit creation. This technology promises to vastly improve our ability to
create fine lines & spaces (down to .001 and less). It also can greatly
improve line tolerances for RF applications”

BIS/OTE U.S. Bare Printed Circuit Board Industry Assessment 186
Source: U.S. Department of Commerce, Bureau of Industry and Security
U.S. Bare Printed Circuit Board Industry Assessment – 2017
Research & Development Technology Priorities for DoD (2015)
6
7
8
12
15
17
22
24
24
0 5 10 15 20 25 30
Ultra smooth copper foil
Sub-10 micrometer photoresists, etchants
Direct IC die-on-board ultra high density interconnects
Printed electronics (additive, 3-D, etc.)
Development of very thin unsupported dielectrics
Other
Enhanced solid copper via fill methods
Advanced embedded active/passive device methods
Stretchable/wearable electronics
Number of Facilities
What advanced bare circuit board-related technologies should DOD support to better enable manufacturers to meet future national security requirements?
Maximum 3 responses
per facility
53 respondentsQ9b,E

BIS/OTE U.S. Bare Printed Circuit Board Industrial Assessment
Source: U.S. Department of Commerce, Bureau of Industry and Security
U.S. Bare Printed Circuit Board Industry Assessment – 2017
187
Q9b,E 53 respondents
Enhanced solid copper via fill methods
• “Electronics are getting denser and reliable processes need to be developed.”
• “Improved reliability vs. current via hole fill methodologies. Now a capacity constraint in plating. Additional development needed.”
• “U.S. manufacturing needs to be a the forefront of capability and technology.”
Advanced embedded active/passive device methods
• “Embedded active components to prevent loss of IP and/or counterfeiting.”
• “Embedded active/passive devices is a discriminator and could be moved forward more quickly with DOD support.”
• “DOD should develop a "Trusted Foundry" type approach for PCB manufacturing.”
Other
• “Anti-tamper packaging and anti-counterfeit measures”
• “DOD needs to get on board with lead-free product”
• “eSurface for fine lines and better line tolerances”
• “High Temp Rigid Flex for future munitions and high speed missile applications”
• “Environmentally friendly PCB processing”
• “Ruggedized products for field applications”
• “Alternative Metal Finishes”
• “Flexible Hybrid Electronics for human and asset performance monitors, especially for monitoring the well being of the warfighter”
Research & Development –PCB Technology For DOD To Support: Industry Comments

BIS/OTE U.S. Bare Printed Circuit Board Industrial Assessment
Source: U.S. Department of Commerce, Bureau of Industry and Security
U.S. Bare Printed Circuit Board Industry Assessment – 2017
188
Q9b,E 53 respondents
Ultra smooth copper foil
• “Enhanced signal integrity”
• “May play a direct role in maintaining signal integrity in RF/Microwave material theater”
• “Helps electronic device performance”
Sub-10 micrometer photoresists, etchants
• “Developing very exact etching and printing capabilities can increase design density and push miniaturization in the market”
Direct IC die-on-board ultra high density interconnects
• “For reduction in size, weight, and power (SWaP) for aerospace and defense applications”
• “U.S. manufacturing needs to be a the forefront of capability and technology”
Printed electronics (additive, 3-D, etc.)
• “Customer interest
• “Potential for advancing the concept to multiple applications with 3-D, multi-layer technologies”
Stretchable/wearable electronics
• “Advance the use of printable material on polyimide”
• “Forming and/or embedding circuits as part for clothing, pack, helmet, etc.…will lighten war fighter load while improving
mission assurance/traceability/communications/etc.”
Research & DevelopmentPCB Technology For DOD To Support: Industry Comments

BIS/OTE U.S. Bare Printed Circuit Board Industry Assessment 189
Source: U.S. Department of Commerce, Bureau of Industry and Security
U.S. Bare Printed Circuit Board Industry Assessment – 2017
U.S. Bare PCB Facility Capital Expenditures (2012-2015)
Q10A 202 respondents
$112,399
$125,432
$106,814 $113,623
$81,984 $85,086
$75,008 $74,204
$-
$20,000
$40,000
$60,000
$80,000
$100,000
$120,000
$140,000
2012 2013 2014 2015
$ T
ho
us
an
ds
Total CAPEX Expenditures Bare Circuit Board-Related CAPEX

BIS/OTE U.S. Bare Printed Circuit Board Industry Assessment
Source: U.S. Department of Commerce, Bureau of Industry and Security
U.S. Bare Printed Circuit Board Industry Assessment – 2017
U.S. Bare PCB Facility Capital Expenditures (2012-2015)
190
Q10A 202 respondents
$112,399
$125,432
$106,814 $113,623
$86,482
$101,708
$87,228
$93,678
$19,182
$15,068 $9,373 $9,539 $5,084 $5,749 $7,952 $8,871
$1,500 $2,769 $1,916 $1,296
$81,984 $85,086
$75,008 $74,204
$-
$20,000
$40,000
$60,000
$80,000
$100,000
$120,000
$140,000
2012 2013 2014 2015
$ T
ho
us
an
ds
Total CAPEX Expenditures Machinery, Equipment, and Vehicles
Land, Buildings, and Leasehold Improvements IT, Computers, Software
Other (reported) Bare circuit board-related Expenditures

BIS/OTE U.S. Bare Printed Circuit Board Industry Assessment
Source: U.S. Department of Commerce, Bureau of Industry and Security
U.S. Bare Printed Circuit Board Industry Assessment – 2017
45
114
2419
0
20
40
60
80
100
120
Yes No N/A No response
Nu
mb
er
of
Fa
cil
itie
s
From 2012 to 2015, were your organization's bare circuit board-related capital expenditures adversely impacted by reductions in
U.S. Government defense spending?
191
Q10B 202 respondents
Capital ExpendituresUSG Defense Spending Impact

BIS/OTE U.S. Bare Printed Circuit Board Industry Assessment
Source: U.S. Department of Commerce, Bureau of Industry and Security
U.S. Bare Printed Circuit Board Industry Assessment – 2017
192
Effects of USG Spending Cutbacks on CAPEX: Industry Comments
Facilities impacted by reductions in U.S. Government defense spending:
• “Many capital expenditure programs were delayed or reduced in volume”
• “There was an 80% loss of military orders in this time period. No new equipment needed”
• “Defense spending cuts resulted in program push outs and delays in funding for development applications”
• “Less purchase orders equals less investment”
• “Limited volumes of Aerospace/Defense products resulted in poor ROI to purchase new equipment”
• “Loss of revenue constrained capital expenditures”
• “Company capital budget has decreased as our sales numbers have decreased”
• “Reduction in sales dictates a cautious spending plan relating to capital expenditures”
• “Due to a decrease in sales and new contracts, we could not invest in as much equipment as needed”
Facilities NOT impacted by reductions in U.S. Government defense spending:
• “Did not have any government business”
• “Government sales are not a large portion of our revenue”
• “More affected by the financial crisis”
• “PWB demand and workforce numbers stayed relatively constant over this timeframe”
Q10B 202 respondents

BIS/OTE U.S. Bare Printed Circuit Board Industry Assessment 193
Source: U.S. Department of Commerce, Bureau of Industry and Security
U.S. Bare Printed Circuit Board Industry Assessment – 2017
CAPEX: Top Priorities for U.S. PCB Manufacturers
0 20 40 60 80 100 120 140 160 180
Other
Expanded facility
IT/computers/software
Equipment for existing technologies
Equipment for new technologies
# of Responses
Top 5 bare PCB-related CAPEX priorities (2016-2020) - Ranked
Priority 1
Priority 2
Priority 3
Priority 4
Priority 5202 respondents
Q10,C
Equipment Priorities for New Technologies Equipment Priorities for Existing Technologies
Flex and Rigid Flex capability
Lead-free hot air solder leveling
(HASL)
Expand capacity in high density
interconnect (HDI) technology
Ink-jet nomenclature application
Printed electronics
Laser direct imaging equipment
Advanced processing
technologies and advanced
materials
Light emitting diode (LED)
Application of masks and inks
Sequential lamination
equipment
Solder mask spray unit + etcher
High temperature lamination for
fusion bonding
Advanced develop-etch-strip /
design (DES) equipment
Drilling equipment for finer
features
Plasma etch
Laser drill
Optical routing
Reverse pulse plate plating
technologies
Automated optical inspection
equipment
Electroless nickel immersion
gold (ENIG) plating process
Advanced test equipment
Pulse rectification: electro-
copper
High density interconnect (HDI)
capability
Permanganate Desmear
Direct imaging
Via fill and planarization equipment
Laser direct imaging
CMM
Photo plotting system
Lamination presses
Develop-etch-strip / design (DES)
Vacuum lamination presses
Plasma etching
Automated hole alignment, camera
assisted drill
Ink jet sprayer for solder mask
Laser drills
Legend Ink Jet Printing
Deburr equipment
Etching equipment
Routing equipment
Copper electroplating equipment
Coordinate measurement machine
(CMM)
Advanced plating rectifiers for
copper-filled vias
Additional measurement
equipment
Electroless nickel immersion gold
(ENIG) plating process
Electrical test equipment

BIS/OTE U.S. Bare Printed Circuit Board Industry Assessment
Source: U.S. Department of Commerce, Bureau of Industry and Security
U.S. Bare Printed Circuit Board Industry Assessment – 2017
CHAPTER 9:
EMPLOYMENT
• U.S. BARE PCB EMPLOYMENT - CHALLENGES
• EMPLOYMENT FIGURES (2012-2015)
• HIRING AND RETENTION
• KEY ISSUES ANTICIPATED
• WORKFORCE RETIREMENT AND REPLACEMENT
• WORK EXPERIENCE LEVELS
194

BIS/OTE U.S. Bare Printed Circuit Board Industry Assessment 195
Source: U.S. Department of Commerce, Bureau of Industry and Security
U.S. Bare Printed Circuit Board Industry Assessment – 2017
Employment – Challenges (2015)
• Thirty-six percent of BIS survey respondents reported current difficulties hiring and retaining
employees.
• Top two key future workforce-related issues anticipated (2016-2020).
Finding experienced workers – 65% of respondents
Finding qualified workers – 52% of respondents
• Aging workforce and upcoming retirement is also an industry challenge.
13% of technical staff (scientists, engineers, R&D staff) expected to retire by 2020.
• Comments from U.S. PCB manufacturers include:
“To expand we need qualified workers that just are not available”
“The biggest challenge is to find qualified candidates who would be a good match”
“Experienced workforce is aging, fewer new entrants to manufacturing”
“Harder to find circuit board related experience. We have to do 100% OTJ training”
“Much of the work in our industry has moved offshore affecting both local and US talent availability. It can be difficult to
attract new talent in what is considered to be a diminishing market.”
“Many senior level employees leaving within the next 5 years.”
“Average age of 58.”
“Many workers over at or near retirement age.”
“Lower demand over the years led to workforce reductions instead of hiring. As a result existing workforce is the more
experienced and now facing retirement age”
“Significant portion of our workforce will be retirement-eligible in 5-years”
“Anticipating large number of retirements in next five years; aging workforce”

BIS/OTE U.S. Bare Printed Circuit Board Industry Assessment 196
Source: U.S. Department of Commerce, Bureau of Industry and Security
U.S. Bare Printed Circuit Board Industry Assessment – 2017
Industry Hiring and Retention Issues (2015)
Yes, 73, 36%
No, 88, 44%
N/A, 41, 20%
Does this facility have difficulty hiring and/or retaining any types
of employees?
Yes No N/A
202 respondents
16
35
57
57
62
106
132
0 50 100 150
Finding workers able to getsecurity clearances
Finding U.S. citizens
Significant portion ofworkforce retiring
Employee turnover
Attracting workers tolocation
Finding qualified workers
Finding experiencedworkers
Number of Facilities
U.S. Bare PCB Workforce:Key Issues Anticipated
(2016-2020)
202 respondents
Q11a, B/C

BIS/OTE U.S. Bare Printed Circuit Board Industry Assessment 197
Source: U.S. Department of Commerce, Bureau of Industry and Security
U.S. Bare Printed Circuit Board Industry Assessment – 2017
U.S. Bare PCB Workforce
Hiring/Retention Difficulty by Job Category (2015)
3
6
11
4
8
23
16
14
11
14
22
24
19
21
19
28
35
44
2
2
3
5
1
3
7
5
7
6
6
3
3
9
8
7
7
3
7
3
9
13
5
13
11
17
15
8
12
22
22
18
32
26
21
0 10 20 30 40 50 60 70 80
Other
Safety Engineer
Graphic Arts Engineer
Industrial Engineer
Mechanical Engineer
Laser Drilling Tech
Product Engineer
Testing Tech
Electrical Engineer
Electrical Testing Tech
Imaging Tech
Silk Screening Tech
Chemist
Chemical Engineer
Mechanical Drilling Tech
Plating Tech
Process Engineer
CAM Software - Job Tooling Tech
Number of Facilities
Hiring Retaining Both
Does this facility have difficulty hiring and/or retaining any types of employees?
202 respondentsQ11a,B

BIS/OTE U.S. Bare Printed Circuit Board Industry Assessment 198
Source: U.S. Department of Commerce, Bureau of Industry and Security
U.S. Bare Printed Circuit Board Industry Assessment – 2017
Employment – Challenges (2015)
• The industry’s ability to recruit and hire a qualified sustainable workforce seems to
be limited by two key factors. Shortage of prospective employees who have the essential skills needed to be
successful in a PCB manufacturing capacity.
A shortage of young people interested in manufacturing careers in general.
• These are exacerbated by the impression that U.S. PCB manufacturing is a
diminishing industry.
• Many manufacturing companies are facing seemingly contradictory goals in order
to remain competitive - a need both to cut workforce costs and at the same time to
invest in the workforce so that it can do more.
• Industry Needs: Address the skill gaps in the industry’s labor market by working with academic
institutions to develop and grow technical education workforce development programs
such as internships, apprenticeships, tuition reimbursements, etc.
Community colleges can have a critical role to play because they understand the needs
of local employers, and can design programs and courses that are responsive to local
employers’ needs.

BIS/OTE U.S. Bare Printed Circuit Board Industry Assessment 199
Source: U.S. Department of Commerce, Bureau of Industry and Security
U.S. Bare Printed Circuit Board Industry Assessment – 2017
U.S. Bare PCB Facility Workforce
Q11a,A 202 respondents
13% of technical staff (scientists, engineers, R&D staff) are expected to retire by 2020.
15,141 15,758 15,877 15,517
8,537 8,839 8,925 8,769
1,090 1,171 1,197 1,195
2,164 2,283 2,276 2,142
-
2,000
4,000
6,000
8,000
10,000
12,000
14,000
16,000
18,000
2012 2013 2014 2015
Nu
mb
er
of
Em
plo
ye
es
Employment Levels (2012-2015)
FTE Employees
Production LineWorkers
Engineers, Scientists,and R&D Staff
Testing Operators,Quality Control, andSupport Technicians

BIS/OTE U.S. Bare Printed Circuit Board Industrial Assessment
Source: U.S. Department of Commerce, Bureau of Industry and Security
U.S. Bare Printed Circuit Board Industry Assessment – 2017
U.S. Bare PCB Workforce - Total v. Production Line
200
Q11a,A 202 respondents
15,141 15,758 15,877 15,517
8,537 8,839 8,925 8,769
-
1,000
2,000
3,000
4,000
5,000
6,000
7,000
8,000
9,000
10,000
11,000
12,000
13,000
14,000
15,000
16,000
17,000
2012 2013 2014 2015
Nu
mb
er
of
Em
plo
yees
U.S. Bare PCB Facilities Workforce (2012-2015)
Administrative, Management, &Legal Staff
Engineers, Scientists, and R&D Staff
Facility & Maintenance Staff
FTE Employees
Information TechnologyProfessionals
Marketing & Sales
Production Line Workers
Testing Operators, Quality Control,and Support Technicians
Other
FTE Employees
Production Line Workers

BIS/OTE U.S. Bare Printed Circuit Board Industry Assessment 201
Source: U.S. Department of Commerce, Bureau of Industry and Security
U.S. Bare Printed Circuit Board Industry Assessment – 2017
Q11a,A 202 respondents
U.S. Bare PCB Facility Workforce – Geographic Location (2015)
Top 10 States
Number of Employees
CA 5,349
WI 1,403
MN 1,215
IL 1,160
NY 920
OR 839
CO 665
VA 468
UT 438
NH 417

BIS/OTE U.S. Bare Printed Circuit Board Industrial Assessment
Source: U.S. Department of Commerce, Bureau of Industry and Security
U.S. Bare Printed Circuit Board Industry Assessment – 2017
68
2017
24
2 1 1 2
8
68
2527
6 7
0 02
0
4
0
10
20
30
40
50
60
70
1-10% 11-20% 21-30% 31-40% 41-50% 51-60% 61-70% 71-80% 81-90% 91-100%
Nu
mb
er
of
Fa
cil
itie
s
Workforce – Technical Staff Retirement/Replacement (2016-2020)
What % of this facility's technical staff do you expect to RETIRE within the next five years?
What % of this facility's technical staff do you expect to have to REPLACE over the next five years?
202
Q11b,A 202 respondents
U.S. Bare PCB Workforce – Technical Staff Turnover

BIS/OTE U.S. Bare Printed Circuit Board Industrial Assessment
Source: U.S. Department of Commerce, Bureau of Industry and Security
U.S. Bare Printed Circuit Board Industry Assessment – 2017
U.S. Bare PCB WorkforceLevel of Work Experience for U.S./Non-U.S. Workers (2015)
3,709
2,830
3,5743,325
351, 9%
259, 8%
271, 7%245, 7%
0
500
1,000
1,500
2,000
2,500
3,000
3,500
4,000
4,500
Five or Fewer Years 6-10 Years 11-20 Years Over 20 Years
Nu
mb
er
of
Em
plo
ye
es
Estimated number of employees by years of work experience
U.S. Citizens Non-U.S. Citizens
203
Q11b,B 202 respondents

BIS/OTE U.S. Bare Printed Circuit Board Industrial Assessment
Source: U.S. Department of Commerce, Bureau of Industry and Security
U.S. Bare Printed Circuit Board Industry Assessment – 2017
51
44
50
73
50
79
128
54
101
132
165
246
252
219
251
257
346
53
66
75
148
161
136
150
231
241
238
263
344
47
76
103
136
130
86
136
208
199
297
289
48
44
49
103
115
107
129
117
163
200
264
338
445
0 200 400 600 800 1,000 1,200 1,400
Industrial Engineer
Safety Engineer
Graphic Arts Engineer
Chemical Engineer
Mechanical Engineer
Electrical Engineer
Chemist
Product Engineer
Laser Drilling Tech
Testing Tech
Electrical Testing Tech
Silk Screening Tech
Process Engineer
CAM Software - Job Tooling Tech
Imaging Tech
Mechanical Drilling Tech
Plating Tech
Other
Number of Employees
Over 20 Years 11-20 Years 6-10 Years Five or Fewer Years
Other includes: Manufacturing Technician,
Production Worker, Quality (AOI, QC, QE,
QA, Cross Section), Management, Sales,
Shipping, etc.
204
Q11b,B 202 respondents
U.S. Bare PCB Workforce Level of Work Experience by Job Category (2015)

BIS/OTE U.S. Bare Printed Circuit Board Industry Assessment
Source: U.S. Department of Commerce, Bureau of Industry and Security
U.S. Bare Printed Circuit Board Industry Assessment – 2017
CHAPTER 10:
COMPETITIVE FACTORS
• PROJECTED CHANGES IN OPERATIONS
• ENVIRONMENTAL REGULATION IMPACT
• FACTORS EFFECTING INTEREST IN USG BUSINESS
• COST EFFECT OF DOD STANDARD MIL-PRFP331032
• RETURN-ON-INVESTMENT (ROI) SUFFICIENCY
• INDUSTRY CONSOLIDATION AND FOREIGN ACQUISITION
EXPECTATIONS
• IMPACT OF POTENTIAL USG ACTIONS
205

BIS/OTE U.S. Bare Printed Circuit Board Industrial Assessment
Source: U.S. Department of Commerce, Bureau of Industry and Security
U.S. Bare Printed Circuit Board Industry Assessment – 2017
Competitive Factors Primary Projected Changes for U.S. Bare PCB Facilities
5
6
21
43
61
66
0 10 20 30 40 50 60 70
Other
Contraction
Potential Closure
Expansion
None
Modernization
Number of Facilities
Primary Expected Change in Operations (2016-2020)
206
Q12a, A 202 respondents
• At this rate we just manage to keep the doors open
• Change of ownership
• Closed down manufacturing operations in 2015
• Owner is planning to retire and successor ownership is uncertain
• RF growth

BIS/OTE U.S. Bare Printed Circuit Board Industrial Assessment
Source: U.S. Department of Commerce, Bureau of Industry and Security
U.S. Bare Printed Circuit Board Industry Assessment – 2017
Competitive FactorsChanges Expected at U.S. Bare PCB Facilities (2016-2020)
Q12a, A
207
197 Respondents
0
10
20
30
40
50
60
70
Nu
mb
er
of
Fa
cil
itie
s
Small <$10M Medium $10M-$40M Large >$40M
6
43
66
61
21
2
34
55
39
Contraction Expansion Modernization None Potential Closure
11

BIS/OTE U.S. Bare Printed Circuit Board Industrial Assessment
Source: U.S. Department of Commerce, Bureau of Industry and Security
U.S. Bare Printed Circuit Board Industry Assessment – 2017
208
27 Respondents
Competitive Factors - Facilities Eyeing Contraction (2016-2020)
27 facilities reported expecting to contract or potentially close in the next five years • 13 reported some level of defense end use sales
• 9 support USG programs
• 8 are dependent on USG business
• 5 reported net income <0 each year
3
119
4
Financial Risk Rating
High/Severe Risk
Moderate/Elevated Risk
Low/Neutral Risk
Uncalculated
$3 $4 $4 $4
$38 $35 $33
$30
0
5
10
15
20
25
30
35
40
45
2012 2013 2014 2015
$ M
illi
on
s
U.S. Bare PCB Sales
Government Sales Non-Government Sales
13 13 13 13
0
2
4
6
8
10
12
14
2012 2013 2014 2015
# o
f F
ac
ilit
ies
Net Income < $0
27
14
6
0
5
10
15
20
25
30
Rigid PCBs Flex PCBs Rigid-Flex PCBs
# o
f F
ac
ilit
ies
Manufacturing Capabilities – Board Types
Q12a, A

BIS/OTE U.S. Bare Printed Circuit Board Industrial Assessment
Source: U.S. Department of Commerce, Bureau of Industry and Security
U.S. Bare Printed Circuit Board Industry Assessment – 2017
Competitive Factors Effect of Environmental Regulations on U.S. PCB Facilities (2015)
112, 55%
10, 5%
80, 40%
Have recent changes in environmental control regulations adversely affected
this facility's capability to compete against circuit board manufacturers in
other countries?
No N/A Yes
209
Q12a,B1 202 respondents
Industry Comments:
• “A great deal of our budget has to be spent to maintain and monitor all our waste
treatment. We spend more than 20% of our budget to remove "hazardous" waste.”
• “Continued focus on reduction of copper levels and other metals have forced us to
invest money in treatment equipment rather than equipment that would enhance
our capability. In addition, continuous monitoring of effluents and reporting
requirements result in increased labor expenses.”
• “For every $1 dollar we spend on our waters supply, it costs us more than $12 in
waste treatment and regulation fees. I'm sure that producers in other countries
have to spend less than 1/4 of our waste treatment and regulation costs.”
• “Mandatory Federal, State and Local Certifications, waste treatment, recycling and
Permits are very costly per year and need to be covered in product pricing, which
puts US Electronic manufacturers at a huge disadvantage. The regulations have
been getting worse over the last 8 years.”
• “Our regulatory conditions continue to be more stringent and expensive to comply
with while our overseas competitors have little or no environmental compliance or
related expenses.”
• “Very difficult for small company to comply with documents required by these
regulations.”
• “We are more regulated than some countries and the cost to comply with more and
tighter regulations directly impacts price which can result in pricing us out of being
competitive.”
• “We have no problem with compliance and are advocates of the environment but it
puts us at a competitive disadvantage.”
• “Labor costs typically biggest challenge vs other countries.”
• “No significant changes past several years.”
• “No, we continue to invest in the EH&S sector of our business.”
• “Not "recent" but overall regulatory issues are a time issue.”
• “Not yet, but it will certainly be a concern soon.”
• “We do not have wet processes in house.”

BIS/OTE U.S. Bare Printed Circuit Board Industrial Assessment
Source: U.S. Department of Commerce, Bureau of Industry and Security
U.S. Bare Printed Circuit Board Industry Assessment – 2017
Competitive FactorsForecast Closures of U.S. Bare PCB Tin-Lead Facilities (2015)
210
Q12a,B2
151, 75%
23, 11%
28, 14%
Will environmental regulations force this facility to cease manufacturing tin-
lead circuit boards?
No Not Applicable Yes
4
2 2
1
5
2
1 1 1 1
0
1
2
3
4
5
6
2015 2016 2017 2018 2020 2021 2022 2026 2030 2125
If yes, what year is this facility expected to cease producing tin-lead circuit boards?
Nu
mb
er
of
Fa
cil
itie
s
*Note: Eight “Yes” respondents either did not provide a year or provided a
year prior to the period covered in the survey.
202 respondents

BIS/OTE U.S. Bare Printed Circuit Board Industrial Assessment
Source: U.S. Department of Commerce, Bureau of Industry and Security
U.S. Bare Printed Circuit Board Industry Assessment – 2017
Competitive Factors Facilities Affected by Limits on Storage of Bare PCB Materials (2015)
211
Q12a,B3
139, 69%
20, 10%
43, 21%
Do environmental regulations cause this facility to keep smaller quantities of circuit
board manufacturing materials in inventory than what you might otherwise
consider optimal?
No N/A Yes
202 respondents
Industry Comments:
• “Chemical Storage is a problem.”
• “DHS (department of homeland security) has caused change to several input
products and reduced the amounts of which may be maintained at the facility
resulting in increased management, material and net product cost.”
• “Fire code limits our raw materials and SQG status does not allow for efficient use
of hazardous waste transportation.”
• “If we keep more than the government thinks we should, then we have to pay
more fees for being a large producer of product.”
• “Regulations coupled with limited storage space.”
• “Regulations only allow us to keep certain quantities of acids without moving into
the next tier level.”
• “Storage requirements preclude large volumes of chemistries.”
• “Yes and No. Decreases in business volume has more of an impact on inventory
levels. Inventory comes with carrying cost, so there is constant pressure to
reduce inventory.”
• “Chemical suppliers willing to hold inventory for us.”
• “Circuit board materials and chemicals are ordered and replenished based on
product demands driven by SAP.”
• “Environmental regulations are not covering the amount of manufacturing
materials in inventory as of this point. Only waste materials.”
• “No issues with what we are allowed to keep. Reduced quantities occur because
we cannot afford to keep money tied up in excess inactive inventory.”
• “No, orders are built to order. Industry changes too much to plan stock.”
• “This is true with chemistries, not material.”
• “We are a small shop and our footprint fits.”
• “We have sized our operations to meet the environmental
regulations. Consignment and stocking programs are sufficient to meet our
requirements.”

BIS/OTE U.S. Bare Printed Circuit Board Industry Assessment 212
Source: U.S. Department of Commerce, Bureau of Industry and Security
U.S. Bare Printed Circuit Board Industry Assessment – 2017
Factors Affecting Facility Interest in USG Business (2015)
6
8
9
19
23
24
47
11
20
21
58
60
88
80
0 20 40 60 80 100 120 140
Intellectual Property Protection
Small Production Lots
One-off orders
Infrequent Orders
Slow Payment
Paperwork/Requirements
Insufficient Profit Margin
Number of Facilities
Indicate whether the following factors affect this facility's interest in USG business.
May Cause Facility to Stop Producing for USG Reduce Interest in USG Business
Other Factors:
• ITAR & FEDBID.com
• Employment Rates/Future
Additions
202 respondentsQ12a,C
• DoD is often perceived as a difficult customer for small businesses or commercial businesses.
• Challenges: Unique requirements - highly specialized boards, special functions and requirements.
Diminishing purchasing position in the overall PCB market.
Demand for higher technical performance at an affordable cost.
Administrative burden, low-volume, infrequent orders.
Legacy products production – costs and challenges.

BIS/OTE U.S. Bare Printed Circuit Board Industry Assessment
Source: U.S. Department of Commerce, Bureau of Industry and Security
U.S. Bare Printed Circuit Board Industry Assessment – 2017
213
Q12a, D 43 respondents
0
24
10
4
1
4
00
24
9
4
13
00
28
56
13
00
5
10
15
20
25
30
<0% 1-20% 21-40% 41-60% 61-80% 81-100% 100%+
Nu
mb
er
of
Fa
cil
itie
s
Percent Change
Estimated Change Relative to MIL-P-50884C*
% Direct Change in Fixed Costs per Slash Sheet (circuit board specification sheet)
% Change in Recurring Costs for Maintenance
% Change in Administrative Cost of Compliance
*DoD standard for the manufacture of flexible and rigid-flex printed circuit boards that was replaced by MIL-PRF-31032.
Competitive Factors Cost Effect of DOD Standard MIL-PRF-31032 (2015)
Indicate how DOD requirements to use MIL-PRF-31032 standards affect your costs
relative to other existing standards?

BIS/OTE U.S. Bare Printed Circuit Board Industry Assessment
Source: U.S. Department of Commerce, Bureau of Industry and Security
U.S. Bare Printed Circuit Board Industry Assessment – 2017
214
Q12a, D 61 respondents
1
42
12
5
0 03
0
40
8
42 1 10
46
6 5
1 1 2
0
5
10
15
20
25
30
35
40
45
50
<0% 1-20% 21-40% 41-60% 61-80% 81-100% 100%+
Nu
mb
er
of
Fa
cil
itie
s
Percent Change
Estimated Change Relative to IPC-6012 Class 3*
% Direct Change in Fixed Costs per Slash Sheet (circuit board specification sheet)
% Change in Recurring Costs for Maintenance
% Change in Administrative Cost of Compliance
Indicate how DOD requirements to use MIL-PRF-31032 standards affect your costs
relative to other existing standards?
Competitive Factors Cost Effect of DOD Standard MIL-PRF-31032 (2015)
*Covers qualification and performance specifications of single- or multi-sided rigid printed boards

BIS/OTE U.S. Bare Printed Circuit Board Industry Assessment 215
Source: U.S. Department of Commerce, Bureau of Industry and Security
U.S. Bare Printed Circuit Board Industry Assessment – 2017
Competitive Factors – Reliance on USG Business (2015)
74, 37%
20, 10%39, 19%
31, 15%
38, 19%
To what extent is this facility's continued ability to manufacture bare circuit boards
for USG Customers dependent on the viability of your Commercial business?
Significantly Moderately Somewhat
37, 18%
24, 12%
38, 19%
70, 35%
33, 16%
To what extent is this facility's continued ability to manufacture bare circuit boards for Commercial Customers dependent on
the viability of your USG business?
Significantly Moderately Somewhat Not at all Not Applicable
49%
Dependent
202 respondents
• A commercially healthy and viable PCB industrial base is essential in order to
support DoD needs and requirements.
• DoD domestic sourcing can help support a healthy, robust and technically
advanced domestic supply base that can compete commercially.
66%
Dependent
Q12b,A

BIS/OTE U.S. Bare Printed Circuit Board Industrial Assessment
Source: U.S. Department of Commerce, Bureau of Industry and Security
U.S. Bare Printed Circuit Board Industry Assessment – 2017
Competitive FactorsAdequacy of Return-on-Investment for U.S. Bare PCB Facilities
(2015)
216
Q12b, A 202 respondents
112
51
39
82
46
74
0
20
40
60
80
100
120
Yes No N/A
Nu
mb
er
of
Fa
cil
itie
s
Is the return-on-investment (ROI) associated with this facility's bare circuit board manufacturing business sufficient relative to capital
requirements and business risk?
Commercial Manufacturing Defense-related Manufacturing

BIS/OTE U.S. Bare Printed Circuit Board Industrial Assessment
Source: U.S. Department of Commerce, Bureau of Industry and Security
U.S. Bare Printed Circuit Board Industry Assessment – 2017
Competitive FactorsProjections for U.S. Bare PCB Facility Consolidation (2016-2020)
217
Q12b, B
13
61
91
37
0
10
20
30
40
50
60
70
80
90
100
None Minimal Moderate Major
Nu
mb
er
of
Fa
cil
itie
s
What level of overall industry consolidation do you expect to occur in the U.S. bare circuit board industry in the next five years?
202 respondents

BIS/OTE U.S. Bare Printed Circuit Board Industrial Assessment
Source: U.S. Department of Commerce, Bureau of Industry and Security
U.S. Bare Printed Circuit Board Industry Assessment – 2017
218
Q12b, B 202 respondents
8
11
16
23
26
33
41
63
107
0 20 40 60 80 100 120
Improved production efficiency
Shrinking USG orders
Excess production capacity
Not technologically competitive
Diminishing Commercial orders
Other
Cost reduction
Larger companies possess marketadvantages
Increased foreign competition
Number of Facilities
Key Factors Driving Consolidation
Competitive FactorsU.S. PCB Facility Views of Issues Driving Consolidation (2015)

BIS/OTE U.S. Bare Printed Circuit Board Industrial Assessment
Source: U.S. Department of Commerce, Bureau of Industry and Security
U.S. Bare Printed Circuit Board Industry Assessment – 2017
219
Q12b,B 202 respondents
Increased foreign competition
33%
Larger companies possess market
advantages19%
Cost reduction13%
Other10%
Diminishing Commercial orders
8%Not technologically
competitive7%
Excess production
capacity5%
Shrinking USG orders3%
Improved production efficiency
2%
Percent of Companies Identifying Key Factor as Cause for Consolidation
Competitive FactorsConsolidation Drivers Identified by U.S. PCB Companies (2015)

BIS/OTE U.S. Bare Printed Circuit Board Industrial Assessment
Source: U.S. Department of Commerce, Bureau of Industry and Security
U.S. Bare Printed Circuit Board Industry Assessment – 2017
Competitive Factors Key Drivers for Consolidation: Industry Comments
• “Foreign competition and low profitability both result in some competitors discontinuing operations. Seems like some leave the
industry every year.”
• “Consolidation to reduce overhead compared to the sales price pressure.”
• “High capital equipment cost; and required annual software license purchase.”
• “Some larger companies are buying the customer lists of smaller companies in order to capture a larger percentage of the market
share.”
• “More small manufacturers will continue closing facility because they do not have significant assets and business.”
• “The remaining small to midsize PCB fabricators in the US which have excellent process controls will be consolidated into larger
companies to eliminate competition.”
• “Large portion of the US bare circuit board industry are sub $10 million in revenue that have not been able to recapitalize and have
aging ownership.”
• “US companies that cannot make profit under a given market condition will eventually go out of business. There will always going
to be increase foreign competition, large companies gobbling up smaller ones, and a majority of smaller companies not being able
to reinvest in business to keep up with customer's needs.”
• “Large companies do not like dealing with small suppliers.”
• “Between foreign competition and larger companies taking over the market share and opening branches on foreign soil it is hard to
see the viability of the small PCB owner in the US without assistance in import limitations and environmental regulations.”
• “The Asian market has driven the commercial market share out of the country. The small companies cannot afford the equipment
needed for technology advancement.”
• “Capital equipment costs, labor costs and locations.”
• “The Printed Circuit Board is in the decline phase of its life cycle. Industry value added (IVA), which measures an industry's
contribution to the U.S. economy, is projected to decline at an annualized 3.1% …to 2021. By contrast, U.S. GDP is forecast to
grow at an annualized 2.3% during the same 10-year period. Industries with lower IVA growth rates compared with GDP indicate a
declining status.”
220
Q12b,B 202 respondents

BIS/OTE U.S. Bare Printed Circuit Board Industrial Assessment
Source: U.S. Department of Commerce, Bureau of Industry and Security
U.S. Bare Printed Circuit Board Industry Assessment – 2017
• “The main issue with the US PCB industry is the Chinese PCB industry. Basically the only work left in the US are USG jobs that
must be made here and commercial jobs where the design owners do not want the boards made China. The cost advantage that
the Chinese companies have is just too luring for most companies to ignore trying and then continuing to use the Chinese
companies. Even poor quality, slow delivery, language barriers, etc. can all be ignored to a certain extent if the cost reduction is
that good, and in most cases it is.”
• “Lack of capital investments by these facilities makes them non-competitive technologically – and therefore do not have the
capability to meet today’s demands.”
• “Other manufacturers globally have lower cost bases, but also increasing in their technical capabilities quickly.”
• “Many small shops not technologically capable of smaller lines and spaces.”
• “Large government supported growth within China.”
• “Major consolidation has already occurred. Further consolidation is likely to continue. USG is in serious risk on being held
hostage by 1 or 2 major suppliers and losing what is left of the bare board circuit board industry. This could severely impact
DOD's ability to respond quickly in a real international conflict or crisis.”
• “Commercial customers want cheaper prices and go to China. The USG doesn't seem to have that much work for U.S.
Electronics manufacturers.”
• “Many consolidations have already occurred in recent years and there are a limited amount of manufacturers remaining in the
U.S.”
• “Currently China dominates PCB manufacturing, but I look for other Asian counties to play a larger role in near future. In the
U.S., only the remaining large public and private PCB companies will be able to afford the necessary capital costs for acquiring
state-of-the-art equipment.”
• “Too costly to operate locally. Diminishing technical resources.”
• “First, the cost of capital; and Second, key labor/technical resource retirements.”
221
Q12b,B 202 respondents
Competitive Factors Key Drivers for Consolidation: Industry Comments

BIS/OTE U.S. Bare Printed Circuit Board Industrial Assessment
Source: U.S. Department of Commerce, Bureau of Industry and Security
U.S. Bare Printed Circuit Board Industry Assessment – 2017
Competitive FactorsOutlook for Foreign Acquisitions of U.S. Bare PCB Facilities
(2016-2020)
222
Q12b, B
100
45
36
21
0
20
40
60
80
100
120
Minimal None Moderate Major
Nu
mb
er
of
Fa
cil
itie
s
What level of foreign acquisition of U.S. bare circuit board manufacturers do you expect in the next five years?
202 respondents

BIS/OTE U.S. Bare Printed Circuit Board Industrial Assessment
Source: U.S. Department of Commerce, Bureau of Industry and Security
U.S. Bare Printed Circuit Board Industry Assessment – 2017
Competitive Factors – Views on Consolidation Effects (2015)
106
136
139
143
145
148
162
166
166
87
60
60
51
49
44
35
33
28
9
8
8
6
3
5
3
8
10
0 20 40 60 80 100 120 140 160 180 200 220
Higher Prices for Bare Board Companies
Reduced Domestic Board Capability
Higher Material Costs
Increased Market Share for Non-U.S. Companies
Fewer U.S. Materials Manufacturers
Greater Dependence on Non-U.S. Materials
Pricing Advantage for Large Board Manufacturers
Small Companies Less Able to Compete
Shrinkage in Manufacturing Workforce
Number of Facilities
Which of the following impacts do you anticipate from consolidation in the number of U.S. bare circuit board manufacturing facilities?
Yes No N/A
223
Q12b,C 202 respondents
*Other expected impacts listed were – Cycle Time, Reduction in Capabilities Available, Stringent regulations in the circuit board industry
requires smaller companies to eliminate certain processes and contract them out which raises our prices, good for customers in region of
PCB manufacturing.

BIS/OTE U.S. Bare Printed Circuit Board Industrial Assessment
Source: U.S. Department of Commerce, Bureau of Industry and Security
U.S. Bare Printed Circuit Board Industry Assessment – 2017
224
12b,C146 respondents
72
102
105
109
109
110
116
125
127
0 20 40 60 80 100 120 140
Higher prices for bare board customers
Greater dependence on non-U.S. materials
Reduced domestic board capability
Higher material costs
Increased market share for non-U.S. companies
Fewer U.S. materials manufacturers
Shrinkage in manufacturing workforce
Pricing advantage for larger board manufacturers
Small companies less able to compete
Which of the following impacts do you anticipate from consolidation in the number of U.S. bare circuit board manufacturing facilities?
Small <$10M
Number of Facilities
Competitive Factors – Views on Consolidation Effects (2015)Small Facilities

BIS/OTE U.S. Bare Printed Circuit Board Industrial Assessment
Source: U.S. Department of Commerce, Bureau of Industry and Security
U.S. Bare Printed Circuit Board Industry Assessment – 2017
225
12b,C46 respondents
26
28
29
32
32
34
36
37
41
0 10 20 30 40 50
Higher prices for bare board customers
Higher material costs
Reduced domestic board capability
Increased market share for non-U.S. companies
Fewer U.S. materials manufacturers
Pricing advantage for larger board manufacturers
Small companies less able to compete
Greater dependence on non-U.S. materials
Shrinkage in manufacturing workforce
Which of the following impacts do you anticipate from consolidation in the number of U.S. bare circuit board manufacturing facilities?
Medium $10M-$40M
Number of Facilities
Competitive Factors – Views on Consolidation Effects (2015)Medium Facilities

BIS/OTE U.S. Bare Printed Circuit Board Industrial Assessment
Source: U.S. Department of Commerce, Bureau of Industry and Security
U.S. Bare Printed Circuit Board Industry Assessment – 2017
226
12b,C10 respondents
2
2
2
3
3
3
8
9
9
0 2 4 6 8 10
Higher material costs
Reduced domestic board capability
Increased market share for non-U.S. companies
Fewer U.S. materials manufacturers
Pricing advantage for larger board manufacturers
Small companies less able to compete
Higher prices for bare board customers
Greater dependence on non-U.S. materials
Shrinkage in manufacturing workforce
Which of the following impacts do you anticipate from consolidation in the number of U.S. bare circuit board manufacturing facilities?
Large >$40M
Number of Facilities
Competitive Factors – Views on Consolidation Effects (2015)Large Facilities

BIS/OTE U.S. Bare Printed Circuit Board Industrial Assessment
Source: U.S. Department of Commerce, Bureau of Industry and Security
U.S. Bare Printed Circuit Board Industry Assessment – 2017
Competitive Factors
Respondent Views of Potential USG Bare PCB Actions (2015)
227
Q12c,A 202 respondents
117
168
72
117
148
115
1
2
6
13
6
14
44
17
55
27
19
26
40
15
67
45
29
47
0 20 40 60 80 100 120 140 160 180 200 220
Increased Funding of targeted PCB Manufacturing tech R&D
Requirement that Electronic Systems use U.S. manufacturedboards
DOD adds circuit board laminate and related materials to theDefense National Stockpile
Critical Systems Boards Produced in the U.S.
Requirement for defense systems boards manufactured inthe U.S. by "trusted" suppliers
Requirement for Defense Systems Product ManufacturersRegistered on QML/QPL
Number of Facilities
What impact would each of the following potential USG actions have on your business?
Benefit Harm No Change Unclear

BIS/OTE U.S. Bare Printed Circuit Board Industrial Assessment
Source: U.S. Department of Commerce, Bureau of Industry and Security
U.S. Bare Printed Circuit Board Industry Assessment – 2017
Competitive Factors – General Industry Comments
228
Q12c,A 202 respondents
• “Cost of compliance to Mil specs, etc. could result in a few suppliers getting all the business. Our business serves medical
market, industrial market and military markets. Separate and unique certifications and systems compliance for each segment
results in a lot of additional (LOW VALUE) effort and support.”
• “Make it easier for small manufacturers, not harder.”
• “Needed for national defense concerns and keeping high quality product.”
• “PWB companies need help in the U.S. The foreign PWB companies have taken the lion's share of our work and product.
The future looks uncertain.”
• “Smaller shops can help an keep costs down if they are given help and opportunity to be a part of the supply chain to DOD.”
• “State and Federal laws should be passed that all circuit boards for city, county, government to be paid with tax papers money
should be built in the USA by the tax payers. Small list other then defense, Lighting, signs, cameras, police apparel,
equipment, etc.”
• “The components to go on the circuit is made offshore. The copper clad to make a circuit board is been made offshore for
years. In 5 years we will no longer be able to produce a circuit board when we can't buy any copper clad material ……………”
• “They should visit PCB facilities make sure the boards are actually produced in the USA. Also, ISO, ASA certification does not
dictate good bare boards! Sometimes specialty [companies] can manufacture repeatable and accountable boards without
certification!”
• “USG should put tariff on overseas boards.”

BIS/OTE U.S. Bare Printed Circuit Board Industry Assessment
Source: U.S. Department of Commerce, Bureau of Industry and Security
U.S. Bare Printed Circuit Board Industry Assessment – 2017
CHAPTER 11:
CYBER SECURITY
• INTERNAL AND EXTERNAL IT NETWORKS MANAGEMENT
• PROTECTION OF COMMERCIALLY SENSITIVE INFORMATION (CSI)
• IMPACT OF CYBER EVENTS RELATED TO MALICIOUS ACTIVITY
229

BIS/OTE U.S. Bare Printed Circuit Board Industrial Assessment
Source: U.S. Department of Commerce, Bureau of Industry and Security
U.S. Bare Printed Circuit Board Industry Assessment – 2017
Cyber SecurityPCB Facilities With IT Networks Exposed to Internet (2015)
230
Q13a,A 201 respondents
Yes, 167, 83%
No, 34, 17%
Does your organization's internal network connect to the Internet?
Yes No

BIS/OTE U.S. Bare Printed Circuit Board Industrial Assessment
Source: U.S. Department of Commerce, Bureau of Industry and Security
U.S. Bare Printed Circuit Board Industry Assessment – 2017
231
Cyber SecurityManagement of Internal Networks (2015)
Q13a,B
134
24 23 20
1 0 00
20
40
60
80
100
120
140
160
Internal IT Dept. Internal IT Dept.& U.S. external
provider(s)
Only U.S.external
provider(s)
Not Applicable Only non-U.S.external
provider(s)
Internal IT Dept.& U.S. & non-U.S. externalprovider(s)
U.S. and non-U.S. externalprovider(s)
Nu
mb
er
of
Fa
cil
itie
s
Indicate who is responsible for your organization's internal IT networks:

BIS/OTE U.S. Bare Printed Circuit Board Industrial Assessment
Source: U.S. Department of Commerce, Bureau of Industry and Security
U.S. Bare Printed Circuit Board Industry Assessment – 2017
232
Q13a,B
71
57
38
31
3 1 10
10
20
30
40
50
60
70
80
Internal IT Dept. Not Applicable Internal IT Dept.& U.S. & non-U.S. externalprovider(s)
Internal IT Dept.& U.S. external
provider(s)
Only non-U.S.external
provider(s)
Only U.S.external
provider(s)
U.S. and non-U.S. externalprovider(s)
Nu
mb
er
of
Fa
cil
itie
s
Indicate who is responsible for your organization's external IT networks:
Cyber SecurityManagement of External Networks (2015)

BIS/OTE U.S. Bare Printed Circuit Board Industrial Assessment
Source: U.S. Department of Commerce, Bureau of Industry and Security
U.S. Bare Printed Circuit Board Industry Assessment – 2017
233
Cyber SecurityProtection of Commercially Sensitive Information (CSI) (2015)
Q13a,C 202 respondents
11
11
13
18
18
22
24
27
36
42
46
190
189
187
183
181
180
176
170
164
151
151
0 50 100 150 200 250
Customer/client information
Financial Information and records
Human Resources/Employee data
Intellectual property related information
Regulatory/compliance information
Information subject to export control regulations (EAR and/or ITAR)
Manufacturing and production line information
Supply chain and sourcing information
Internal communications including negotiation points, merger and…
Research & Development related information
Patent and trademark information
Number of Facilities
Does this facility have defined, structured methods for actively protecting the following types of Commercially Sensitive Information?
No N/A Yes

BIS/OTE U.S. Bare Printed Circuit Board Industrial Assessment
Source: U.S. Department of Commerce, Bureau of Industry and Security
U.S. Bare Printed Circuit Board Industry Assessment – 2017
234
Cyber SecurityImpact of Incidents on IT Security Budget (2015)
Q13b,A 202 respondents
No, 102, 51%
N/A, 27, 13%
Yes, 73, 36%
Have recent cyber incidents across the marketplace caused your organization to increase its information security budget?
No N/A Yes

BIS/OTE U.S. Bare Printed Circuit Board Industrial Assessment
Source: U.S. Department of Commerce, Bureau of Industry and Security
U.S. Bare Printed Circuit Board Industry Assessment – 2017
235
Cyber SecurityStorage of Commercially Sensitive Information (CSI) (2015)
Q13b,B 202 respondents
177
113 2 2 2 5
171
3 2 4 1 1
20
0
20
40
60
80
100
120
140
160
180
200
220
240
0% 0%-10% 10%-20% 20%-40% 40%-60% 60%-80% 80%-100%
Nu
mb
er
of
Fa
cil
itie
s
Percent of CSI
Estimate the percentage of your organization's commercially sensitive information (CSI) that is stored with:
External Cloud Service Providers External Data Storage Providers

BIS/OTE U.S. Bare Printed Circuit Board Industrial Assessment
Source: U.S. Department of Commerce, Bureau of Industry and Security
U.S. Bare Printed Circuit Board Industry Assessment – 2017
236
Cyber SecurityStorage of Commercially Sensitive Information (CSI) (2015)
Q13b,B 202 respondents
Yes, 83, 41%
No, 17, 8%
97, 48%
5, 3%
Does your organization restrict or prohibit your external cloud service or external data storage provider(s) from storing Commercially
Sensitive Information outside of the U.S.?
Yes No N/A Unknown

BIS/OTE U.S. Bare Printed Circuit Board Industrial Assessment
Source: U.S. Department of Commerce, Bureau of Industry and Security
U.S. Bare Printed Circuit Board Industry Assessment – 2017
237
Cyber Security – Impact of Cyber Events (2012-2015)
Q13b,C 202 respondents
6
7
9
7
5
8
11
11
8
4
4
65
7
8
13
11
12
17
18
19
26
50
51
7
192
190
186
186
181
175
174
174
163
140
136
119
0 20 40 60 80 100 120 140 160 180 200
Theft of software and/or source code
Exfiltration of CSI data
Theft of personnel information
Reputation loss, market share, & brand damages
Destruction of information asset
Damage to software and/or source code
Damage or theft of IT assets & infrastructure
Damage to company production capabilities or systems
Incurred cost of damage assessment & remediation
Business interruption
Disruption to normal operations b/c of system availability problems
User idle time & lost productivity b/c of downtime or systemsperformance delays
Number of Facilities
Indicate the level of impact each of the following types of events attributed to malicious cyber activity has had on this facility since 2012.
Major Moderate Minimal None

BIS/OTE U.S. Bare Printed Circuit Board Industrial Assessment
Source: U.S. Department of Commerce, Bureau of Industry and Security
U.S. Bare Printed Circuit Board Industry Assessment – 2017
Cyber Security – Idle Time Tied to Malicious Activity
Q13a
238
Levels of impact of idle time and lost productivity at U.S. Bare PCB
manufacturing facilities attributed to malicious cyber activity (2012-2015)
5%4%
32%59%
All Bare PCB Facilities
Major - 11
Moderate - 7
Minimal - 65
None - 119
202 Respondents
6%4%
31%59%
Bare PCB Facilities with Defense End Use Applications
Major - 8
Moderate - 6
Minimal - 45
None - 86
145 Respondents

BIS/OTE U.S. Bare Printed Circuit Board Industrial Assessment
Source: U.S. Department of Commerce, Bureau of Industry and Security
U.S. Bare Printed Circuit Board Industry Assessment – 2017
239
Q13b 202 respondents
Cyber Security - General Industry Comments
• “Cyber attacks or hacking are always a concern for the IT department. Computer and
software upgrades are always being considered.”
• “External Data Storage is done for archives/backups of critical data.”
• “Design, manufacturing and product documentation data, assets are all stored on local
servers.”
• “No cyber damage.”
• “No incidents related to cyber security to date.”
• “We are aware of DFARs requirements associated with cybersecurity. Our IT
management monitors and would report any event as applicable.”
• “We do not use cloud services or any other off site storage of data.”
• “We outsource IT and data storage back up with a local U.S. service provider.”
• “We take steps to limit our exposure cyber threats.”
BIS/OTE U.S. Bare Printed Circuit Board Industry Assessment
Source: U.S. Department of Commerce, Bureau of Industry and Security
U.S. Bare Printed Circuit Board Industry Assessment – 2017
CHAPTER 12:
CHALLENGES AND OUTREACH
• INDUSTRY CHALLENGES
• AREAS OF OUTREACH INTEREST
240

BIS/OTE U.S. Bare Printed Circuit Board Industry Assessment 241
Source: U.S. Department of Commerce, Bureau of Industry and Security
U.S. Bare Printed Circuit Board Industry Assessment – 2017
Current and Future Issues of Concern to Industry
Q14, A 202 respondents
7
13
22
16
5
22
16
21
15
25
36
22
28
20
52
29
28
57
48
42
22
19
11
28
38
31
19
11
17
10
22
5
22
21
4
62
35
16
11
57
33
35
38
35
38
39
64
72
72
76
79
111
89
99
87
53
99
93
110
72
0 20 40 60 80 100 120 140 160 180
Proximity to suppliers
Environmental regulations/remediation - foreign
Government purchasing volatility
Obsolescence
Material input availability
Cyber security
Qualifications/certifications
Health and safety regulations
Reduction in USG demand
Government regulatory burden
Environmental regulations/remediation - domestic
Taxes
Reduction in commercial demand
Worker/skills retention
Competition - domestic
Aging workforce
Labor availability/costs
Competition - foreign
Healthcare costs
Aging equipment, facilities, or infrastructure
Number of Facilities
Current Impact Future Impact Both

BIS/OTE U.S. Bare Printed Circuit Board Industrial Assessment
Source: U.S. Department of Commerce, Bureau of Industry and Security
U.S. Bare Printed Circuit Board Industry Assessment – 2017
Challenges – Issues Affecting Bare PCB Producers
242
Q14, A 202 respondents
1
1
30
39
49
52
56
60
60
64
68
83
83
96
105
105
106
107
120
121
122
124
130
133
140
141
143
151
162
162
0 20 40 60 80 100 120 140 160 180
Imaging
Sustainable pricing for PCBs
Pension costs
Proximity to customers
Counterfeit parts
Quality of material inputs
Obsolescence
Government acquisition process
Material input availability
Environmental regulations/remediation - foreign
Export controls/ITAR & EAR
Proximity to suppliers
Qualifications/certifications
Health and safety regulations
Intellectual property/patent infringement
R&D costs
Cyber security
Government purchasing volatility
Worker/skills retention
Environmental regulations/remediation - domestic
Aging equipment, facilities, or infrastructure
Aging workforce
Labor availability/costs
Reduction in commercial demand
Reduction in USG demand
Government regulatory burden
Taxes
Competition - foreign
Competition - domestic
Healthcare costs
Number of Facilities

BIS/OTE U.S. Bare Printed Circuit Board Industry Assessment
Source: U.S. Department of Commerce, Bureau of Industry and Security
U.S. Bare Printed Circuit Board Industry Assessment – 2017
Challenges – Top 5 Ranked Bare PCB Industry Key Issues
243
Q14, A 202 respondents
0 20 40 60 80 100 120 140
Environmental regulations/remediation - foreign
Export controls/ITAR & EAR
Government acquisition process
Government regulatory burden
Intellectual property/patent infringement
Material input availability
Obsolescence
Proximity to customers
Proximity to suppliers
Cyber security
Health and safety regulations
Quality of material inputs
R&D costs
Taxes
Government purchasing volatility
Qualifications/certifications
Reduction in USG demand
Worker/skills retention
Environmental regulations/remediation - domestic
Labor availability/costs
Reduction in commercial demand
Competition - domestic
Healthcare costs
Aging workforce
Aging equipment, facilities, or infrastructure
Competition - foreign
Number of Facilities
#1 #2 #3 #4 #5

BIS/OTE U.S. Bare Printed Circuit Board Industry Assessment 244
Source: U.S. Department of Commerce, Bureau of Industry and Security
U.S. Bare Printed Circuit Board Industry Assessment – 2017
U.S. PCB Industry Interest in U.S. Government Outreach
45
49
50
51
54
56
59
63
64
89
0 20 40 60 80 100
Energy and Environmentally Conscious Manufacturing
Design for Manufacturability
Cyber Security
Quality Managament and Control
Technology Acceleration
Prototyping
Small Business Innovation Research (SBIR) and SmallBusiness Technology Transfer (STTR) contracts
Continuous Improvement/Lean Manufacturing
Government Procurement Guidelines
Market Expansion/Business Growth
Number of Facilities
Top 10 Areas of Outreach Interest
Q14,B 202 respondents

BIS/OTE U.S. Bare Printed Circuit Board Industrial Assessment
Source: U.S. Department of Commerce, Bureau of Industry and Security
U.S. Bare Printed Circuit Board Industry Assessment – 2017
Challenges - Interest in U.S. Government Outreach
245
Q14, B 202 respondents
17
19
22
24
28
44
45
49
50
51
54
56
59
63
64
89
0 20 40 60 80 100
Product Design
Design for Assembly
Export Assistance
Vendor/Material Sourcing
Supply Chain Optimization
Export Licensing (ITAR/EAR)
Energy and Environmentally Conscious Manufacturing
Design for Manufacturability
Cyber Security
Quality Managament and Control
Technology Acceleration
Prototyping
Small Business Innovation Research (SBIR) and SmallBusiness Technology Transfer (STTR) contracts
Continuous Improvement/Lean Manufacturing
Government Procurement Guidelines
Market Expansion/Business Growth
Number of Facilities
Areas of Outreach Interest

BIS/OTE U.S. Bare Printed Circuit Board Industrial Assessment
Source: U.S. Department of Commerce, Bureau of Industry and Security
U.S. Bare Printed Circuit Board Industry Assessment – 2017
• “Without SALES, no one can help us ….”
• “How can we get more work from DOD?”
• “Not interested in doing any government work”
• “[My company] is very interested in partnering with USG”
• “The biggest issue for our business continues to be a competitive issue with Asia. The cost of
production is not the same for lots of reasons….”
• “We could use help from State or Federal government grants”
• “We have enough assistance available at present”
• “We have attended multiple EAR / ITAR seminars sponsored by the USG, but the information has
been high level - often just to pointing us to confusing regulations….”
246
Q14, B 202 respondents
ChallengesInterest in U.S. Government Outreach: Industry Comments

The U.S. Department of Commerce, Bureau of Industry and Security (BIS), Office of Technology Evaluation, in coordination with the United States Navy, Naval Surface Warfare
Center, Crane Division (NSWC Crane) is conducting an assessment of the U.S. industrial base for manufacturing bare printed circuit board products. The primary goal of this
study is to assist the U.S. defense community in understanding the health and competitiveness of organizations manufacturing bare printed circuit boards for commercial and U.S.
Government applications at facilities located in the United States.
The Secretary of the Navy is the Department of Defense (DOD) Defense Executive Agent for printed circuit board technology. NSWC Crane is the DOD Executive Agent
technical lead for printed circuit board and interconnect technology. NSWC Crane provides acquisition engineering, in-service engineering, and technical support for sensors,
electronics, electronic warfare, and special warfare weapons.
RESPONSE TO THIS SURVEY IS REQUIRED BY LAW
A response to this survey is required by law (50 U.S.C. App. Sec. 4555). Failure to respond can result in a maximum fine of $10,000, imprisonment of up to one year, or both.
Information furnished herewith is deemed confidential and will not be published or disclosed except in accordance with Section 705 of the Defense Production Act of 1950, as
amended (50 U.S.C App. Sec. 4555). Section 705 prohibits the publication or disclosure of this information unless the President determines that its withholding is contrary to the
national defense. Information will not be shared with any non-government entity, other than in aggregate form. The information will be protected pursuant to the appropriate
exemptions from disclosure under the Freedom of Information Act (FOIA), should it be the subject of a FOIA request.
Not withstanding any other provision of law, no person is required to respond to nor shall a person be subject to a penalty for failure to comply with a collection of information
subject to the requirements of the Paperwork Reduction Act unless that collection of information displays a currently valid OMB Control Number.
BURDEN ESTIMATE AND REQUEST FOR COMMENT
Public reporting burden for this collection of information is estimated to average 13 hours per response, including the time for reviewing instructions, searching existing data
sources, gathering and maintaining the data needed, and completing and reviewing the collection of information. Send comments regarding this burden estimate or any other
aspect of this collection of information to BIS Information Collection Officer, Room 6883, Bureau of Industry and Security, U.S. Department of Commerce, Washington, D.C.
20230, and to the Office of Management and Budget, Paperwork Reduction Project (OMB Control No. 0694-0119), Washington, D.C. 20503.
BUSINESS CONFIDENTIAL - Per Section 705(d) of the Defense Production Act
Next Page
OMB Control Number: 0694-0119Expiration Date: 12/31/2016
DEFENSE INDUSTRIAL BASE ASSESSMENT:
Bare Printed Circuit Board Manufacturers
SCOPE OF ASSESSMENT
PDF FOR REFERENCE SUBMIT EXCEL VERSION ONLY
1

Next Page
I
II
III
1
2
3
4
5
6
7
8
9
10
11
12
13
14
15
BUSINESS CONFIDENTIAL - Per Section 705(d) of the Defense Production Act
Previous Page
Certification
Challenges and Outreach Interest
Workforce
Competitive Factors
Capital Expenditures
Customers and Competitors
Interactions with the USG
Manufacturing Capabilities
Materials and Equipment
Sales
Financial Information
Research & Development
Cyber Security
TABLE OF CONTENTS
General Instructions
Definitions
Respondent Profile
Organization Information
Mergers, Acquisitions, Divestitures, and Joint Ventures
PDF FOR REFERENCE SUBMIT EXCEL VERSION ONLY
2

A.
B.
C.
D.
E.
F.
G.
Do not disclose any Classified Information in this survey form.
Estimates may be furnished in select instances but in sections that do not explicitly allow estimates you must contact BIS survey
support staff before including estimates.
Questions related to this Excel survey should be directed to: [email protected].
E-mail is the preferred method of contact.
You may also speak with a member of the BIS survey support staff by calling 202-482-6339.
For questions related to the overall scope of this Defense Industrial Base assessment, contact:
Brad Botwin, Director, Industrial Studies
Office of Technology Evaluation, Room 1093
U.S. Department of Commerce
1401 Constitution Avenue, NW
Washington, DC 20230
DO NOT submit completed surveys to Mr. Botwin's postal or e-mail address; all surveys must be submitted electronically to
Upon completion of the survey, final review, and certification on the final page, transmit the survey via e-mail to :
To arrange for the completed survey to be delivered on CD-ROM or DVD disc by private carrier, contact BIS survey staff.
BUSINESS CONFIDENTIAL - Per Section 705(d) of the Defense Production Act
Previous Page Next Page
Section I: General Instructions
Your facility is required to complete this bare printed circuit board survey using an Excel template, which can be downloaded from the
BIS website: http://bis.doc.gov/printedcircuitboards . If you are not able to download the survey document, at your request BIS staff will
e-mail the Excel survey template directly to you.
For your convenience, a PDF version of the survey containing required drop-down content is available on the BIS website to aid internal
data collection. DO NOT SUBMIT the PDF version of the survey as your response to BIS. Should this occur, your facility will be
required to resubmit the survey in the requested Excel format.
Respond to every question. Surveys that are not fully completed will be returned for completion. Use the comment boxes to provide
any information to supplement responses provided in the survey form. Make sure to record a complete answer in the cell provided, even
if the cell does not appear to expand to fit all the information.
DO NOT CUT AND PASTE RESPONSES WITHIN THIS SURVEY. Survey inputs should be completed by typing in responses or
through use of a drop-down menu. The use of cut and paste can corrupt the survey template. If your survey response is corrupted as a
result of cut and paste responses, a new survey will be sent to your organization for immediate completion.
Return to Table of Contents
PDF FOR REFERENCE SUBMIT EXCEL VERSION ONLY
3

Previous Page Next Page
Term
Applied Research
Authorizing Official
Bare Printed Circuit Board
Basic Research
Board Thickness
Commercial and Government Entity
(CAGE) Code
Commercially Sensitive Information (CSI)
Customer
Data Universal Numbering System
(DUNS)
Export Controls
External Cloud Service Provider
External Data Storage Provider
Flex
Full Time Equivalent (FTE) Employees
Microvia
North American Industry Classification
System (NAICS) Code
Planarization
Pre-Preg
Product/Process Development
Qualified Manufacturers' List (QML)
Qualified Products List (QPL)
Rigid
Rigid-Flex
Service
Single Source
Sole Source
Supplier
United States
Via
Via Structure
BUSINESS CONFIDENTIAL - Per Section 705(d) of the Defense Production Act
Section II: Definitions
DefinitionSystematic study to gain knowledge or understanding necessary to determine the means by which a recognized
and specific need may be met. This activity includes work leading to the production of useful materials,
devices, and systems or methods, including design, development, and improvement of prototypes and new
processes.
Systematic, scientific study directed toward greater knowledge or understanding of the fundamental aspects of
phenomena and of observable facts.
Return to Table of Contents
A completed, tested circuit board ready to be populated with components to create a working system.
An entity from which your facility obtains inputs. A supplier may be another firm with which you have a
contractual relationship, or it may be another facility owned by the same parent organization. The inputs may be
goods or services.
Conceptualization and development of a product prior to the production of the product for customers.
An intangible product (contrasted to a good, which is a tangible product). Services typically cannot be stored or
transported, are instantly perishable, and come into existence at the time they are bought and consumed.
Executive officer or other representative of the corporation, division, business unit and/or facility who has the
authority to execute this survey on behalf of the designated facility.
1) Regulations administered by the Bureau of Industry and Security (BIS), U.S. Department of Commerce
governing the export of dual-use technologies; 2) International Traffic in Arms Regulations (ITAR) administered
by the U.S. Department of State governing products and services provided specifically for defense applications.
A conductive hole with a diameter of 0.005" or less that connects layers of a multi-layer printed circuit board.
Microvias are used in blind and buried vias, but not for through-the-board connections. The term is often used to
refer to any small geometry connection holes created by laser drilling.
North American Industry Classification System (NAICS) codes identify the category of product(s) or service(s)
provided by an organization. Find NAICS codes at http://www.census.gov/epcd/www/naics.html
An organization that is the only source for the supply of parts, components, materials, or services. No
alternative U.S. or non-U.S. based suppliers exist other than the current supplier.
An organization that is designated as the only accepted source for the supply of parts, components, materials,
or services, even though other sources with equivalent technical know-how and production capability may exist.
The overall thickness of the base material, all conductive material deposited thereon, and solder mask.
A nine-digit numbering system that uniquely identifies an individual business. Find DUNS numbers at
http://fedgov.dnb.com/webform .
Commercial and Government Entity (CAGE) Code identifies companies doing or wishing to do business with
the U.S. Federal Government. The code is used to support mechanized government systems and provides a
standardized method of identifying a given facility at a specific location. Find CAGE codes at
https://cage.dla.mil/search/begin_search.aspx .
Employees who work for 40 hours in a normal work week. Convert part-time employees into "full time
equivalents" by taking their work hours as a fraction of 40 hours.
Privileged or proprietary information which, if compromised through alteration, corruption, loss, misuse, or
unauthorized disclosure, could cause serious harm to the organization owning it.
Any organization (external or internal entity) for which your company manufactures bare circuit board products.
A service model in which a company employs an external third-party service provider to maintain, manage, and
back up business data at a remote location away from the company's operating facilities. The use of shared
third-party storage infrastructure by businesses can reduce capital, operations, storage, and security
requirements, significantly lowering costs. Data is transmitted between the company and the cloud service
provider via networks as needed.
A business that provides external data storage services to your company for data that is not currently held in
your company's main data network work systems.
One or more rigid circuit boards connected by a flexible circuit board.
The "United States" or "U.S." includes the 50 states, Puerto Rico, the District of Columbia, the island of Guam,
the Trust Territories, and the U.S. Virgin Islands.
A plated feed-through hole that is used to route a trace vertically in the board from one layer to another. Vias
are not used as connecting devices for component leads or for anchoring reinforcing material.
A description of vias (including microvias) incorporated in a multilayer circuit board product.
A flexible circuit board with printed circuitry on flexible base material consisting of one or more layers.
Planarization is a mechanical sanding/polishing process to create a flat or planar surface across copper
conductor on circuit boards.
A sheet of base dielectric laminate incorporating reinforcing material (typically glass fabric/mat, or aramid
fabric/mat) impregnated with a resin cured to an intermediate stage (i.e. B-stage resin) where it is not fully
cured.
A list of manufacturers who have had their products examined and tested and who have satisfied all applicable
U.S. Department of Defense qualification requirements for that product.
A list of products, or family of products, that have met the qualification requirements set forth in the applicable
specification, including appropriate product identification, tests or qualification reference, and the name and
plant address of the manufacturer and authorized distributor.
A rigid circuit board composed of resin and reinforcing material such as fiberglass that contains an electric
conductor in a defined path to connect with devices and terminal connectors.
PDF FOR REFERENCE SUBMIT EXCEL VERSION ONLY
4

Next Page
A.
Design
Capability
Manufacture
Capability
Assembly
Capability
If your organization has multiple facilities in the United States that manufacture bare printed circuit boards you must
provide separate survey responses for each facility. Indicate at right the description that best describes your
organization's circuit board manufacturing structure.
1. Organization has a single facility, which is located in the U.S.
2. Organization has multiple facilities, but only one bare circuit board manufacturing facility in the U.S.
3. Organization has multiple facilities in the U.S. with bare circuit board manufacturing capabilities.
If your organization does not manufacture bare printed circuit boards in the U.S., contact BIS survey staff at
What capabilities does this facility have related to the production of bare printed circuit boards?
B.
BUSINESS CONFIDENTIAL - Per Section 705(d) of the Defense Production Act
Return to Table of ContentsPrevious Page
Section III: Respondent Profile
Select the description that best identifies your organization:
PDF FOR REFERENCE SUBMIT EXCEL VERSION ONLY
5
dboylan
Callout
Corporation Non-Profit University USG Agency Other

Next Page
C.
Title State
Website
City
Is your organization publicly traded or privately held?If your organization is publicly traded, identify its stock ticker
symbol.
Point of Contact regarding this survey:
Postal Code/Zip Code
Parent Primary CAGE Code
Street Address
BUSINESS CONFIDENTIAL - Per Section 705(d) of the Defense Production Act
State
Country
Primary CAGE Code
State/Province
B.
D.
Comments:
Provide the following information for your parent organization(s), if applicable. If not applicable, insert "NA" in the Parent Name box.
Parent Name
Previous Page Return to Table of Contents
Section 1a: Organization Information
Facility/Organization Name
Name Phone Number E-mail Address
City
Provide the following information for this facility.
A.
Parent Organization
Street Address
Zip Code
Phone Number
PDF FOR REFERENCE SUBMIT EXCEL VERSION ONLY
6

Next Page
Percent of
Company HeldStreet Address City State/Region Country
123456
BUSINESS CONFIDENTIAL - Per Section 705(d) of the Defense Production Act
A minority-owned business A historically underutilized business zone (HUBZone)
http://fedgov.dnb.com/webform
Comments:
C.
Previous Page
Section 1b: Organization Information (continued)
Return to Table of Contents
Identify and rank in descending order all entities that directly or indirectly own or have beneficial ownership of five percent or more of your organization (including
parent companies and others):
B.
Indicate if your organization qualifies as any of the following types of business:
NAICS (6-digit) Code(s)
A.
A small business enterprise (as defined by the Small Business Administration)
Entity Name
Find NAICS codes at:
Data Universal Numbering
System (DUNS) Code(s)
Find DUNS numbers at:
http://www.census.gov/epcd/www/naics.html
8(a) Firm (as defined by the Small Business Administration)
A veteran-owned or service-disabled veteran-owned business A woman-owned business
Please provide the following identification codes (see definitions), as applicable, to this facility.
PDF FOR REFERENCE SUBMIT EXCEL VERSION ONLY
7

Next Page
% of Bare Circuit
Board Sales
% of Bare Circuit
Board Sales
Other
% of Bare Circuit
Board Sales
% of Bare Circuit
Board Sales
Other
Industrial Electronics
Ground Vehicles
Commercial Market Segments
Defense Market Segments
Marine (surface and underwater)
Aerospace
Commercial End Use Commercial End Use
Command, Control, Communications, Computers,
Intelligence, Surveillance and Reconnaissance (C4ISR)
Medical/Healthcare
Communications
Defense End Use Defense End Use
Marine (surface and underwater)
(specify here)
Computers/Business Equipment Space
(specify here)
Electronics
Previous Page Return to Table of Contents
Section 1c: Organization Information (continued)
B.
From the list below, estimate the percentage of this facility's bare circuit board sales attributable to each COMMERCIAL end use.
Consumer Goods
A.
Estimate the percentage of this facility's bare printed circuit board sales attributable to COMMERCIAL end uses:
Estimate the percentage of this facility's bare printed circuit board sales attributable to DEFENSE end uses:
BUSINESS CONFIDENTIAL - Per Section 705(d) of the Defense Production Act
C.
From the list below, estimate the percentage of this facility's bare circuit board sales attributable to each DEFENSE end use.
Aerospace Missiles
Automotive
Comments:
Space
PDF FOR REFERENCE SUBMIT EXCEL VERSION ONLY
8

Next Page
Type of Activity Country Year Explain
1.
2.
3.
4.
5.
Year
InitiatedExplain
1.
2.
3.
4.
5.
6.
7.
8.
9.
10.
11.
12.
13.
14.
15.
BUSINESS CONFIDENTIAL - Per Section 705(d) of the Defense Production Act
Country
Identify your organization's current joint venture relationships, including public/private R&D partnerships. Be sure to explain the joint venture's purpose (e.g. patent licensing, co-production, product
integration, after-market support, etc.):
A.
B.
Organization/Entity Name
Organization Name
Primary Purpose of Relationship
Previous Page
How many mergers, acquisitions, and divestitures has your organization had since 2012?
Return to Table of Contents
How many joint ventures does your organization currently participate in?
Joint Ventures
Primary Objective
Section 2: Mergers, Acquisitions, Divestitures, and Joint Ventures
Identify and describe your organization's five most recent mergers, acquisitions, and divestitures, if applicable.
Mergers, Acquisitions, Divestitures
Comments:
PDF FOR REFERENCE SUBMIT EXCEL VERSION ONLY
9
dboylan
Callout
Access to government contracts Access to intellectual property Bankruptcy restructuring/litigation Broaden customer base Develop new capabilities Overcome market entry barrier/Geopolitical concerns R&D access/coordination Reduce Costs Tax-related Vertical integration Other objective/purpose (Explain)
dboylan
Callout
Access to financial resources Access to suppliers Access to technological resources Creation of new technologies Improved access to foreign markets Improved access to U.S. markets Product improvements Reduced costs Reduced lead times Risk sharing Shared/improved technology or skills Other objective/purpose (Explain)

Return to Table of Contents Next Page
Select the primary method this facility uses to find business opportunities with the U.S. Government:
Explain:
-Yes/No-
Other criteria (specify here)
C.
1.
2.
3.
4.
5.
1.
2.
3.
4.
5.
BUSINESS CONFIDENTIAL - Per Section 705(d) of the Defense Production Act
Primary End Use
Top Non-U.S.-Based Customers
Type of Customer
Customer State
Insufficient dollar value of recurring business opportunity
Complexity of job
Customer credit rating
Identify this facility's top 5 U.S. and top 5 non-U.S. direct customers by sales for the past four years. A direct customer is the immediate entity to which you sell your products/services. Customers
can include other business units/divisions within your parent organization. Indicate the type of customer and their location.
Top U.S.-Based Customers
Type of Customer Customer City
Previous Page
Section 3a: Customers
Explain
B.
Since 2012 has this facility rejected business opportunities due to any of the following?
Circuit board panel production run too small
Customer City Customer Country
A.
Additional work not needed
Insufficient order frequency
Insufficient dollar value of job
Primary End Use
Comments:
Customer Name
Customer Name
PDF FOR REFERENCE SUBMIT EXCEL VERSION ONLY
10
dboylan
Callout
Prime contractors Federal web site DOD Queries Word of Mouth Other
dboylan
Callout
Commercial Government Defense Government Non-Defense University/Non-Profit Other
dboylan
Callout
Aerospace Automotive C4ISR Communications Computers/Business Equipment Consumer Goods Electronics Ground Vehicles Industrial Electronics Marine (surface and underwater) Medical/Healthcare Missiles Space Other

Next Page
Location with
Advantage
(specify here)
(specify here)
State
1
2
3
4
5
Country
1
2
3
4
5
BUSINESS CONFIDENTIAL - Per Section 705(d) of the Defense Production Act
Section 3b: Competitors
Previous Page Return to Table of Contents
A.
Explain
Supply of Skilled Workers
Export Controls
Overall Finished Board Price
Quality
Building Space Costs
R&D Costs
Identify your organization's leading U.S. and non-U.S. competitors in the manufacture of bare circuit boards, and select their primary competitive attribute.
Top U.S. Competitors
Explain
Explain
Other
Other
Competitor Name Primary Competitive Attribute
Primary Competitive AttributeCompetitor Name
Top Non-U.S. Competitors
Increased Yield
For each of the following factors, indicate whether bare circuit board manufacturers located inside the U.S. or outside the U.S. possess the competitive advantage.
Labor Costs
Environmental Compliance Costs
Material Costs
Equipment Costs
Safety Requirements
B.
Comments:
Factor
Performance
Lead Time
Reduced Process Variability
Reduced Cost
PDF FOR REFERENCE SUBMIT EXCEL VERSION ONLY
11
dboylan
Callout
U.S. Non-U.S. None Unknown
dboylan
Callout
Price Quality Delivery Time Reliability Financing Range of Capabilities Receipt of Government Subsidies Other

Next Page
U.S. Air ForceDepartment of Homeland Security
(DHS)Other
U.S. ArmyNational Aeronautics & Space
Administration (NASA)Other
U.S. NavyNational Oceanic & Atmospheric
Administration (NOAA)Other
U.S. Marine Corps Department of Energy (DOE) Other
U.S. Intelligence Community
(such as CIA, NGA, NRO, NSA)Missile Defense Agency (MDA) Other
Flex Rigid-Flex
1
2
3
4
5
6
7
8
9
10
11
12
13
14
15
16
17
18
19
20
BUSINESS CONFIDENTIAL - Per Section 705(d) of the Defense Production Act
Return to Table of Contents
Bare Circuit Board Type Supporting USG Program
USG Program Identification
USG Agency Support
A.
Identify the USG agencies supported by this facility since 2012. If you support an agency not already listed, indicate which agency in the "Other" box.
Previous Page
Section 4a: Participation in USG Programs
Comments:
B. Identify the USG programs this facility has supported since 2012, and indicate which types of bare circuit boards this facility has manufactured for each program.
U.S. Government AgencyUSG Program NameRigid
(select from dropdown)
(select from dropdown)
(select from dropdown)
(specify here)
(specify here)
Estimate the total number of USG programs this facility has directly or indirectly supported since 2012.
PDF FOR REFERENCE SUBMIT EXCEL VERSION ONLY
12
dboylan
Callout
Direct Indirect Both None Unknown
dboylan
Callout
U.S. Air Force U.S. Army U.S. Navy U.S. Marine Corps U.S. Intelligence Community (such as CIA, NGA, NRO, NSA) DHS - Department of Homeland Security NASA - National Aeronautics & Space Administration NOAA - National Oceanic & Atmospheric Administration DOE - Department of Energy MDA - Missile Defense Agency DARPA - Defense Advanced Research Projects Agency USDA - Department of Agriculture DOC - Department of Commerce HHS - Department of Health and Human Services State Department Justice Department Transportation Department EPA - Environmental Protection Agency FCC - Federal Communications Commission NRC - Nuclear Regulatory Commission VA - Department of Veterans Avvairs White House Other
dboylan
Callout
Yes No

Next Page
Explain
Explain
Impact of sudden
DECREASE in USG
Defense Demand
Impact of sudden
INCREASE in USG
Defense Demand
Other
Other
B.
Movement of Operations to Non-U.S. Locations
(specify here)
Previous Page Return to Table of Contents
Capital Expenditures
Research & Development Expenditures
Does this facility consider itself dependent on U.S. Government programs for its continued viability?
Identify impacts that a sudden change in direct and/or indirect U.S. Government defense demand for electronic products containing bare circuit boards would likely have on your
organization and provide an explanation where applicable.
Pursuit of Non-U.S. Customers
BUSINESS CONFIDENTIAL - Per Section 705(d) of the Defense Production Act
Section 4b: USG Interactions
A.If this facility's bare circuit board manufacturing supports USG programs, whether directly or indirectly, are the associated manufacturing
lines integrated with, or separate from, its commercial manufacturing lines?
Participation in USG Contracts
ExplanationBusiness Operation
Number of Product/Service Lines
Comments:
Product/Service Costs
Organization Viability/Solvency
Personnel with Key Skills
Level of Key Production Equipment
(specify here)
PDF FOR REFERENCE SUBMIT EXCEL VERSION ONLY
13
dboylan
Callout
Yes No
dboylan
Callout
Integrated Separate Not Applicable
dboylan
Callout
Increase No Change Decrease Not Applicable
dboylan
Callout
Increase No Change Decrease Not Applicable

Return to Table of Contents Next Page
B.
Explain:
Explain:
0.25 oz copper 0.5 oz copper 1 oz copper 2 oz copper 3-5 oz copper 6-10 oz copper 10+ oz copper
0.25 oz copper 0.5 oz copper 1 oz copper 2 oz copper 3-5 oz copper 6-10 oz copper 10+ oz copper
Previous Page
D.
Internal Layer: Standard
Internal Layer: Minimum
External Layer: Standard
External Layer: Minimum
What is the minimum inner layer (core) thickness of circuit
board components that this facility can produce?
Does this facility manufacture printed electronics (PE)?
Tin-Lead Lead-Free
BUSINESS CONFIDENTIAL - Per Section 705(d) of the Defense Production Act
Comments:
A.
Identify the types of bare circuit boards that this facility is currently capable of manufacturing:
For each type of bare circuit board layer listed below, identify this facility's standard and minimum trace widths, based on specified copper conductor weights:
C.
Section 5a: Manufacturing Capabilities
"Printed Electronics" refers to the use of additive printing methods on flexible substrates such as plastic, paper, epoxy-
fiberglass, textiles, and other electronic devices such as discrete electronic component, sensors, and others.
What is the maximum bare circuit board thickness that this facility
can achieve?
Flexible High Speed Boards
Flexible High Frequency Boards
Flexible Microwave Boards
E.
For each type of bare circuit board layer listed below, identify this facility's standard and minimum space widths, based on specified copper conductor weights:
External Layer: Standard
External Layer: Minimum
Internal Layer: Standard
Internal Layer: Minimum
Flexible Multilayer Board
Rigid Conventional Board (single-sided or double-sided)
Rigid Multilayer Board
Rigid High Speed Boards
Rigid High Frequency Boards
Rigid Microwave Boards
Flexible Conventional Board (single-sided or double-sided)
Rigid-Flex Hybrid Boards
Integrated Circuit Package Substrates
Trace Width (in inches)
Space Width (in inches)
If yes, identify the PE business activities this facility engages in:
If yes, identify the PE business sectors this facility supports:
PDF FOR REFERENCE SUBMIT EXCEL VERSION ONLY
14
dboylan
Callout
Yes No
dboylan
Callout
Yes No
dboylan
Callout
Less than 0.001" 0.001" 0.002" 0.003" 0.004" 0.005" More than 0.005"
dboylan
Callout
Less than 0.01" 0.01" 0.02" More than 0.02"
dboylan
Callout
R&D Only Limited Production Full Production Other (explain)
dboylan
Callout
Less than 0.001" 0.001" 0.002" 0.003" 0.004" 0.005" More than 0.005"
dboylan
Callout
Less than 0.001" 0.001" 0.002" 0.003" 0.004" 0.005" More than 0.005"

Return to Table of Contents Next Page
Capable of
UsingCurrently Use
Capable of
UsingCurrently Use
Automated electrolytic copper plating
Direct metallization plating
Hot air solder level tin-lead
Hot air solder level lead-free
LPI solder mask
Dry film solder mask
Maximum per
Board
-Yes/No-
-Yes/No- -Yes/No-Maximum
aspect ratio
Previous Page
Section 5b: Manufacturing Capabilities (continued)
A.
Identify the bare circuit board manufacturing processes that this facility is capable of employing:
Process Process
Photo imaging Thermal management structures
Direct imaging Automated electroless copper plating
Screen printing
Controlled drilling/milling
Laser ablation
Fully additive plating
Z-axis interconnect technology
Embedded devices (e.g. resistors, capacitors, etc.)
Opto-electronic structures Other (specify here)
B.
Identify this facility's maximum capability for each of the following bare circuit board production factors:
Factor Explanation
Circuit layers
Sequential laminations
Impedance structures
Stacked micro vias
Staggered micro vias
C.
Identify where the bare circuit board via fill and planarization manufacturing activities are performed for this facility:
Process Method Explanation
This facility
Other company-owned U.S. facilities
Other company-owned non-U.S. facilities
Contractor-operated U.S. facilities
Contractor-operated non-U.S. facilities
D.
Identify which of following processes associated with via structures this facility is capable of performing:
Via Formation Via Formation Drilling Process
Etchback Plasma etch
Comments:
BUSINESS CONFIDENTIAL - Per Section 705(d) of the Defense Production Act
Laser-formed micro via
Chemical smear removal Laser via formation Mechanically drilled via: through-board
Micro-via solid copper fill Nonconductive via fill Mechanically drilled via: controlled-depth
PDF FOR REFERENCE SUBMIT EXCEL VERSION ONLY
15
dboylan
Callout
Yes No Not Applicable
dboylan
Callout
Yes No Not Applicable
dboylan
Callout
Yes No Not Applicable
dboylan
Callout
Manual Automatic Both Neither Not Applicable
dboylan
Callout
Under 0.5:1 0.5:1 0.75:1 1:1 Over 1:1

Next Page
Section 5c: Manufacturing Standards
Use
Other (specify here)
Other (specify here)
Does this facility have an active technical review board?
Explain:
Explain:
-Yes/No- -Yes/No-
BUSINESS CONFIDENTIAL - Per Section 705(d) of the Defense Production Act
AS 9100
NADCAP
Identify the primary final circuit board inspection method this facility uses to
assure that manufactured products meet performance requirements.
Comments:
A.
E.
Standard
Continuity 10 Volts DC, 10 Ohm Maximum
MIL-PRF 55110
MIL-PRF 31032
Does this facility employ Material Requirements Planning (MRP) software in the operation of its bare circuit board manufacturing facilities in the U.S.?
Identify the forms of testing that this facility uses in manufacturing to assure performance and adherence to operational requirements.
Are first article inspection capabilities at this facility
compliant with AS 9102?
Previous Page Return to Table of Contents
Identify the standards that this facility currently employs and indicate whether you have a formal certification or apply the standards informally.
Explain
IPC 6011
ISO 9001
Isolation 250 Volts DC, 100 MegaOhm Minimum
Highly Accelerated Life Testing (HALT)
Highly Accelerated Thermal Shock (HATS)
B.
C.
Does this facility use Statistical Process Control with TrueChem or equivalent software specifically to control and automate the management of chemistries,
coatings, and associated bare circuit board production processes?
D.
Testing Form
Impedance Testing with Plots
Interconnect Stress Testing (IST)
Highly Accelerated Stress Testing (HAST)
Test all end points, no phase testing
Testing Form
Flying Probe
Bed-of-Nails
MIL-PRF 50884
IPC 6012
IPC 6013
IPC 6015
IPC 6016
IPC 6017
IPC 6018
IPC 1071
PDF FOR REFERENCE SUBMIT EXCEL VERSION ONLY
16
dboylan
Callout
Formal Certification Informal Use Not Used
dboylan
Callout
C=0 Sampling 100% Inspection Other

Next Page
Section 5d: Manufacturing Production & Capacity
2012 2013 2014 2015
24x36 24x30 21x24 18x24 12x24 12x18 9x12 Other
Inner Layers
(Cores)Panels
2012 2013 2014 2015
100% 150%
1
2
3
4
5
6
7
Identify the bare circuit board panel sizes that this facility can produce with its current manufacturing equipment:
Panel Size:
Capability:
Explain:
Previous Page Return to Table of Contents
Average Weekly Panels Manufactured
A.
Inner Layer (Core):
A sheet of copper clad dielectric with one or both sides bearing circuit patterns.
Panel:
(1) a double-sided or single-sided rigid structure (double-sided or single-sided panel) or
(2) two or more inner cores laminated together forming a multilayered, rigid structure (multilayer panel).
For each of the years 2012-2015, estimate the average weekly number of inner layers (cores) and completed circuit board panels that this facility
manufactured:
Average Weekly Inner Layers (Cores) Manufactured
B.
G.
Explain:
Estimate how many weeks it would take to raise this facility's production from current levels to 150% of your current capacity
utilization:
C.
How many 8-hour production shifts does this facility typically operate per day?
Explain:
Identify which of the factors below would limit this facility's ability to raise its bare circuit board manufacturing utilization rate to 100% (maximum
current capacity) and to 150% (50% increase from current maximum capacity) to meet a surge in demand.
Estimate the 2015 rated weekly manufacturing capacity of this facility in units:
How many 8-hour production shifts per day COULD this facility operate practically?
Examples: Assuming little maintenance downtime, one 8-hour shift, 5 days per week is approximately 25%
capacity utilization; two 8-hour shifts, 7 days per week is approximately 65% capacity utilization.
Estimate this facility's average manufacturing utilization rate for each of the years 2012-2015, as a percentage of production possible under a 7 day-
per-week, 24-hour-per-day operation.
Note: a 100% utilization rate equals full operation with no downtime beyond that necessary for maintenance
BUSINESS CONFIDENTIAL - Per Section 705(d) of the Defense Production Act
Comments:
E.
F.
Scenario:
Manufacturing space
Amount of equipment
Availability of equipment
Other (specify in explanation)
D.
Explanation
How many 8-hour front-end engineering shifts per day COULD this facility operate practically?
How many 8-hour front-end engineering shifts does this facility typically operate per day?
Factor
Estimate how many weeks it would take to raise this facility's production from current levels to 100% capacity utilization:If this facility already operates at 100% capacity utilization, respond with a "0".
Availability or cost of workforce
Quality control
Availability of input materials
PDF FOR REFERENCE SUBMIT EXCEL VERSION ONLY
17
dboylan
Callout
Yes No

Next Page
Section 5e: Manufacturing Production & Capacity (continued)
Anticipated
Change
Anticipated
Change
1
2
End Use -Yes/No-
Commercial
Defense
1 Explain:
2 Explain:
3 Explain:
Country 2 Country 3Country 1
BUSINESS CONFIDENTIAL - Per Section 705(d) of the Defense Production Act
D.
Identify the three biggest factors causing production bottlenecks at this facility.
Commercial
Comments:
Rigid Multilayer Board
Rigid Conventional Board (single-sided or double-sided)
Previous Page Return to Table of Contents
C.
A.
How does this facility anticipate the range of bare circuit board product lines it manufactures will change by 2020?
Board Type Explain
Does this facility perform front-end engineering for manufacturing bare circuit boards as a service to other companies that may have bare circuit boards
manufactured elsewhere?
B.
How does this facility anticipate it's front-end engineering processing capabilities will change by 2020?
End Use Explain
Does this facility outsource any front-end engineering for bare circuit board products manufactured at this facility?
If yes, does your company notify customers in advance that it outsources front-end engineering for manufacturing bare circuit boards?
Defense
Integrated Circuit Package Substrates
If this facility outsources front-end engineering for bare circuit board products, indicate the country or countries (including the United States) to which this service is
outsourced:3
Rigid High Speed Boards
Rigid High Frequency Boards
Does this facility have its own staff on site to perform front-end engineering for manufacturing bare circuit boards?
Rigid-Flex Hybrid Boards
Rigid Microwave Boards
Flexible Conventional Board (single-sided or double-sided)
Flexible Multilayer Board
Flexible High Speed Boards
Flexible High Frequency Boards
Flexible Microwave Boards
PDF FOR REFERENCE SUBMIT EXCEL VERSION ONLY
18
dboylan
Callout
Increase No Change Decrease Not Applicable
dboylan
Callout
Increase No Change Decrease Not Applicable
dboylan
Callout
Automated optical inspection (AOI) Drilling Electroless plating Electrolytic plating Electrical test Etching Front end engineering Inner layer pretreatment Imaging Lamination Other

Next Page
Section 6a: Materials & Equipment
Availability is
a Concern
Experienced
Supply Chain
Disruptions
Since 2012
1
2
1
2
1
2
1
2
1
2
1
2
1
2
1
2
1
2
1
2
1
2
1
2
1
2
1
2
1
2
1
2
1
2
1
2
Return to Table of Contents
Other (specify here)
Previous Page
Comments:
BUSINESS CONFIDENTIAL - Per Section 705(d) of the Defense Production Act
For each of the inputs below, state whether you have experienced sourcing problems and identify the principal manufacturers of each material that this facility uses in manufacturing bare circuit boards.
Sourcing Problems Manufacturers
Material
A.
Total Number of
Manufacturers
UsedTwo Principal Manufacturer Names Country of Manufacture
Laminate for use in rigid conventional boards
Laminate for use in rigid high speed, high
frequency, and microwave boards
Laminate for use in rigid multilayer boards
Laminate for use in flex boards
Laminate for use in rigid-flex boards
Copper foil
Other foils
Embedded passives, formed, resistors, and
capacitors (active or passive) - tin-lead
Embedded passives, formed, resistors, and
capacitors (active or passive) - lead free
Through-hole and via preparation for plating
material
Electrolytic plating material
Via fill, conductive, and non-conductive material
Solder mask
Finish materials
Solder
Etchant
Drill bits
PDF FOR REFERENCE SUBMIT EXCEL VERSION ONLY
19

Next Page
Section 6b: Materials & Equipment (continued)
1
2
Explain:
Explain:
1
2
Previous Page Return to Table of Contents
Comments:
A.
How confident are you that this facility could obtain on a timely basis the material necessary to rapidly ramp up bare
circuit board production in the event of a national emergency?4
Explain:
BUSINESS CONFIDENTIAL - Per Section 705(d) of the Defense Production Act
B.
Which statement best describes this facility's general method for maintaining inventory levels of laminate and related materials required for the production of
circuit boards?
Does the reduction in the number of companies in the U.S. that manufacture circuit board laminates and other circuit board-related materials
create material supply problems for this facility? 3
C.
On-site stocking agreements through which distributors/manufacturers keep a quantity of materials at this facility.
Local stocking agreements through which distributors/manufacturers maintain supply warehouses in close proximity to this facility.
If this facility were no longer able to purchase circuit board laminate from your current suppliers, for how many weeks
could you continue normal operations?
How many weeks would it take this facility to obtain material from a new supplier of laminate?
Does this facility use either of the following practices for assuring the availability of circuit board-related materials?
Explain:
PDF FOR REFERENCE SUBMIT EXCEL VERSION ONLY
20
dboylan
Callout
Minimize on-hand inventory of circuit board production materials. Maintain extra inventory as a buffer against unexpected delays in material shipments and unanticipated new production orders.
dboylan
Callout
Very confident Somewhat confident Not confident Would not be able to

Next Page
Section 6c: Materials & Equipment (continued)
Number of
Functioning
Units On Site
Estimated
Average Age
(in years)
Other
Other
Other
U.S. Non-U.S.
Explain:
Explain:
Previous Page Return to Table of Contents
From the list below identify how many of each type of equipment this facility has. Then, estimate overall average age, and indicate your primary concern about continued/future use of this equipment
Equipment
Has this facility had trouble obtaining parts for U.S. or non-U.S. equipment?
Explanation
Photo film processing
Photo resist application
Photo resist exposure
Photo resist exposure-laser
Photo resist exposure-LED
Electroless copper
Routing
Electrical testing
Quality control measurement
Drilling - laser
(specify here)
(specify here)
(specify here)
Final finish
Legend print
Comments:
BUSINESS CONFIDENTIAL - Per Section 705(d) of the Defense Production Act
Explain
Develop etch & strip equipment
Automatic optical inspection
Inner layer treatment & layup
Lamination
Drilling - mechanical
Desmear
Electrolytic copper
Chemical cleaning
Solder mask
Via fill
Scoring
A.
Primary Concern
Has this facility had trouble obtaining service on U.S. or non-U.S. equipment?
B.
Are there bare circuit board products that this facility is unable to manufacture due
to the limitations of installed equipment?
Have you had or do you anticipate having difficulty obtaining new equipment for
manufacturing tin-lead bare circuit boards?
C.
PDF FOR REFERENCE SUBMIT EXCEL VERSION ONLY
21
dboylan
Callout
Availability Cost to replace Time to replace Upgradeability Service Spare parts Other None

Next Page
Section 6d: Materials & Equipment (continued)
Explain:
Explain:
Explain:
Other (specify here) Explain:
Other
Other
Systematic testing of inventory
B.
BUSINESS CONFIDENTIAL - Per Section 705(d) of the Defense Production Act
If so, identify the types of circuit board materials that were suspected or confirmed to be counterfeit products and explain the
impact of the counterfeit.
Prepreg
Laminate
Soldermask
Confirm production lots and production dates with the original manufacturer
Check authenticity of standards organization certification labels/trademarks
Comments:
(specify here)
(specify here)
If so, what practices do you regularly use to verify that the materials are genuine and perform to specifications?
Previous Page
A.
Between 2012 and 2015, did this facility encounter product failures that are suspected or confirmed to be attributed
to counterfeit materials used in building bare circuit boards?
Does this facility buy materials for the manufacture of bare circuit boards from sources other than the original
manufacturer or its authorized distributor?
Return to Table of Contents
PDF FOR REFERENCE SUBMIT EXCEL VERSION ONLY
22
dboylan
Callout
Confirmed Suspected Both No
dboylan
Callout
Confirmed Suspected Both No

Next Page
U.S. Non-U.S. U.S. Non-U.S. U.S. Non-U.S. U.S. Non-U.S.
A.
Total Government Sales [as a % of line A]
B
All Circuit Board-Related Government Sales [as a % of line B]
C
Bare Circuit Board Government Sales [as a % of line C]
BUSINESS CONFIDENTIAL - Per Section 705(d) of the Defense Production Act
Return to Table of Contents
Comments:
Source of Sales Data:
Previous Page
Section 7: Sales
Provide this facility's sales information for the 2012-2015 to U.S. and non-U.S. customers.
Note: "U.S." means U.S. domestic sales; "Non-U.S." means export sales from U.S. locations.
Government sales include both direct and indirect sales to government customers. All sales with government end uses should be reported as government sales.
Reporting Schedule:
Total Sales (in $)
20142012
All Circuit Board-Related Sales - including design, manufacture, and
assembly (in $)
Bare Circuit Board Manufacturing Sales - excluding design and
assembly (in $)
2013 2015
Record in $ Thousands, e.g. $12,000.00 = survey input $12
PDF FOR REFERENCE SUBMIT EXCEL VERSION ONLY
23
dboylan
Callout
Facility Division/Business Unit Corporate/Whole Organization
dboylan
Callout
Calendar Year Fiscal Year

Next Page
2012 2013 2014 2015
A.
B.
C.
D.
E.
2012 2013 2014 2015
A.
B.
C.
D.
E.
F.
G.
H.
Return to Table of Contents
Total Current Assets
Cash
Inventories
Net Income
Balance Sheet (Select Line Items)
Source of Balance Sheet Items:
Reporting Schedule:
Net Sales (and other revenue)
Total Current Liabilities
Total Liabilities
Retained Earnings
Comments:
Total Owner's Equity
BUSINESS CONFIDENTIAL - Per Section 705(d) of the Defense Production Act
Cost of Goods Sold
Record $ in Thousands, e.g. $12,000.00 = survey input of $12
Record $ in Thousands, e.g. $12,000.00 = survey input of $12
Total Operating Income (Loss)
Income Statement (Select Line Items)
Earnings Before Interest and Taxes
Total Assets
Note: Total Assets must equal Total Liabilities plus Total Owner's Equity
Previous Page
Section 8: Financials
Provide the following financial line items for your facility/organization below.
Note: Facility level data is preferred. If you do not keep this information at a location level, provide data at the closest
level available.
Source of Income Statement Items:
Reporting Schedule:
PDF FOR REFERENCE SUBMIT EXCEL VERSION ONLY
24
dboylan
Callout
Facility Division/Business Unit Corporate/Whole Organization
dboylan
Callout
Facility Division/Business Unit Corporate/Whole Organization
dboylan
Callout
Calendar Year Fiscal Year
dboylan
Callout
Calendar Year Fiscal Year

Next Page
A.
Reporting Schedule:
2012 2013 2014 2015
1
2
3
4
5 0% 0% 0% 0%
6
7
2012 2013 2014 2015
1
2
3
4
5
6
7
8 Other (specify here)
BUSINESS CONFIDENTIAL - Per Section 705(d) of the Defense Production Act
Total Federal Government (as a percent of C1)
In Question B, record this facility's total dollar R&D expenditure and type of R&D expenditure for each of the years 2012 to 2015.
In Question C, identify this facility's R&D funding sources, by percent of total R&D dollars sourced.
Note: Facility level data is preferred. If you do not keep this information at a facility level, provide data at the closest level available.
C.
Record $ in Thousands, e.g. $12,000.00 = survey input of $12
Total R&D Funding Sources
Internal/Self-Funded/IRAD (as a percent of C1)
Universities - Public and Private (as a percent of C1)
Non-U.S. Investors (as a percent of C1)
Total State and Local Government (as a percent of C1)
U.S. Industry, Venture Capital, Non-Profit (as a percent of C1)
Product/Process Development (as a percent of B1)
Comments:
Return to Table of Contents
If No, proceed to Section 10.
B.
Total of 2, 3, and 4 (must equal 100%)
Previous Page
Does this facility/organization conduct research and development (R&D)?
Section 9a: Research & Development
Bare Circuit Board R&D Expenditures (as a percent of B1)
Source of R&D Data:
Defense-Related Bare Circuit Board R&D Expenditures (as a percent of B1)
Record $ in Thousands, e.g. $12,000.00 = survey input of $12
Total R&D Expenditures
Basic Research (as a percent of B1)
Applied Research (as a percent of B1)
PDF FOR REFERENCE SUBMIT EXCEL VERSION ONLY
25
dboylan
Callout
Calendar Year Fiscal Year
dboylan
Callout
Facility Division/Business Unit Corporate/Whole Organization

Next Page
Section 9b: Research & Development (continued)
1
2
3
4
5
-Yes/No-
Industry roadmap
(specify here)
(specify here)
(specify here)
1 Explain:
2 Explain:
3 Explain:
What advanced bare circuit board-related technologies should DOD support in order to better enable manufacturers to meet future national security
requirements?
Explain
Need for competitive advantage
Customer requirements
Other
Comments:
BUSINESS CONFIDENTIAL - Per Section 705(d) of the Defense Production Act
E.
Are there specific R&D areas related to bare circuit board manufacturing that DOD could support to improve board performance?
B.
D.
C.
Explain:
Explain:
Other
Other
From 2012-2015, were your organization's R&D expenditures adversely impacted by reductions in U.S. Government
defense spending?
Identify this facility/organization's anticipated top R&D priorities over the next five years and provide a brief explanation.
Description
Identify the key factors driving this facility's investment in research and development and explain how these factors shape this facility's research and
development projects.
Factor
Previous Page
Priority
A.
Return to Table of Contents
PDF FOR REFERENCE SUBMIT EXCEL VERSION ONLY
26
dboylan
Callout
Ultra smooth copper foil Development of very thin unsupported dielectrics Enhanced solid copper via fill methods Sub-10 micrometer photoresists, etchants Printed electronics (additive, 3-D, etc.) Stretchable/wearable electronics Advanced embedded active/passive device methods Direct IC die-on-board ultra high density interconnects Other

Next Page
2012 2013 2014 2015
A
1
2
3
4 Other (specify)
5 Other (specify)
0% 0% 0% 0%
6
1
2
3
4
5
C
Identify your facility/organization's anticipated top bare circuit board-related capital expenditure priorities over the next five years and provide a
brief explanation.
Priority Description
BUSINESS CONFIDENTIAL - Per Section 705(d) of the Defense Production Act
Land, Buildings, and Leasehold Improvements [as a % of A]
B
Comments:
IT, Computers, Software [as a % of A]
From 2012-2015, were your organization's bare circuit board-related capital expenditures adversely
impacted by reductions in U.S. Government defense spending?
Explain:
Bare circuit board-related capital expenditures
[as a % of A]
Lines 1 through 5 must total 100%
Machinery, Equipment, and Vehicles [as a % of A]
Capital Expenditure Reporting Schedule:
Capital Expenditure CategoryRecord $ in Thousands, e.g. $12,000.00 = survey input of $12
Total Capital Expenditures
Previous Page
Section 10: Capital Expenditures
Record this facility's capital expenditures corresponding to the select categories below.
Note: Facility level data is preferred. If you do not keep this information at a location level, provide data at the closest level available.
Source of Capital Expenditure Data:
Return to Table of Contents
PDF FOR REFERENCE SUBMIT EXCEL VERSION ONLY
27
dboylan
Callout
Facility Division/Business Unit Corporate/Whole Organization
dboylan
Callout
Calendar Year Fiscal Year
dboylan
Callout
Expanded facility Equipment for new technologies Equipment for existing technologies IT/computers/software Other

Next Page
2012 2013 2014 2015
1
a
b
c
d
e
f
g
h Other
i Other
0% 0% 0% 0%
(specify here)
-Yes/No-
Return to Table of Contents
Issue
(specify here)
(specify here)
Finding U.S. citizens
Finding qualified workers
Finding experienced workers
Finding workers able to get security clearances
Attracting workers to location
Significant portion of workforce retiring
Employee turnover
Other
Other
Industrial Engineer
Safety Engineer
Graphic Arts Engineer
CAM Software - Job Tooling Tech
Imaging Tech
Other
Process Engineer
Product Engineer
Difficulty
Comments:
Plating Tech
Explanation
Source of Workforce Data:
Reporting Schedule:
BUSINESS CONFIDENTIAL - Per Section 705(d) of the Defense Production Act
C
Identify the key workforce issues you anticipate in the next five years.
Testing Tech
Laser Drilling Tech
Production Line Workers [as a % of line 1]
Chemist
Chemical Engineer
A
Lines a through i must total 100%
Circuit Board-Related Full Time Equivalent (FTE) Employees
Administrative, Management, & Legal Staff [as a % of line 1]
Engineers, Scientists, and R&D Staff [as a % of line 1]
Facility & Maintenance Staff [as a % of line 1]
(specify here)
(specify here)
Silk Screening Tech
Previous Page
Section 11a: Workforce
Record the total number of full time equivalent (FTE) employees in your U.S.-based operations for the 2012-2015 period. Then, estimate the percentage of these
employees that perform the occupations indicated in part A, lines a-i
Note: Facility level data is preferred. If you do not keep this information at a location level, provide data at the closest level available.
B
Does this facility have difficulty hiring and/or retaining any types of employees?
If yes, identify which occupations, type of difficulty, and provide an explanation.
Mechanical Drilling Tech
Occupation
Information Technology Professionals [as a % of line 1]
Testing Operators, Quality Control, and Support Technicians [as a % of line 1]
Electrical Testing Tech
Explanation
Electrical Engineer
Mechanical Engineer
Marketing & Sales [as a % of line 1]
PDF FOR REFERENCE SUBMIT EXCEL VERSION ONLY
28
dboylan
Callout
Facility Division/Business Unit Corporate/Whole Organization
dboylan
Callout
Calendar Year Fiscal Year
dboylan
Callout
Hiring Retaining Both No

Next Page
# of Employees
% U.S. Citizens
Experience:
(specify here)
Over 20 Years 11-20 Years 6-10 Years Five or Fewer Years
Previous Page Return to Table of Contents
What percentage of this facility's technical staff do you expect to retire within the next five years?
What percentage of this facility's technical staff do you expect to have to replace over the next five years?
Comments:
BUSINESS CONFIDENTIAL - Per Section 705(d) of the Defense Production Act
# of Employees # of Employees # of Employees # of Employees
All Employees
Electrical Testing Tech
Section 11b: Workforce (continued)
Safety Engineer
Graphic Arts Engineer
CAM Software - Job Tooling Tech
Electrical Engineer
Mechanical Engineer
Industrial Engineer
Applicable Working Experience
Product Engineer
Process Engineer
Silk Screening Tech
Mechanical Drilling Tech
Laser Drilling Tech
B
Chemist
Chemical Engineer
Testing Tech
Other
Plating Tech
Note: Double counting is permitted for this section. For example, if an employee serves as both a mechanical drilling tech and a laser drilling tech,
the employee would be included in both lines.
Imaging Tech
Explain:
A.
First, estimate the total number of employees you have with each level of work experience and estimate the percentage that are U.S. citizens.
Then, for each technical role, estimate the number of employees you have with each level of work experience.
Five or Fewer Years6-10 Years11-20 YearsOver 20 Years
PDF FOR REFERENCE SUBMIT EXCEL VERSION ONLY
29

Next Page
Explain:
Comments:
Explain:
Reduce Interest in
USG Business
May Cause Facility
to Stop Producing for
USG
(specify here)
Estimated Change
Relative to MIL-P-
50884C
Estimated Change
Relative to IPC-6012
Class 3
BUSINESS CONFIDENTIAL - Per Section 705(d) of the Defense Production Act
One-off orders
Return to Table of Contents
A.
B.
What is the primary, if any, significant change in operations that is expected at this facility in the next five years?
Explain:
2
Indicate whether the following factors affect this facility's interest in USG business.
Have recent changes in environmental control regulations adversely affected this facility's capability to compete against circuit
board manufacturers in other countries?
Explain
Intellectual Property Protection
Paperwork/Requirements
Slow Payment
Small Production Lots
Factor
Previous Page
Section 12a: Competitive Factors
C.
1
Infrequent Orders
Other
Insufficient Profit Margin
Comments:
D.
Percentage change in recurring costs for
maintenance
Indicate how DOD requirements to use MIL-PRF-31032 standards affect your costs relative to other existing standards?
Percentage change in administrative cost of
compliance
Percentage direct change in fixed costs per slash
sheet
Explain
3
Do environmental regulations cause this facility to keep smaller quantities of circuit board manufacturing materials in inventory
than what you might otherwise consider optimal?
If yes, what year is this facility expected to
cease producing tin-lead circuit boards?
Will environmental regulations force this facility to cease manufacturing tin-lead circuit boards?
PDF FOR REFERENCE SUBMIT EXCEL VERSION ONLY
30
dboylan
Callout
None Expansion Modernization Contraction Potential Closure Other
dboylan
Callout
Yes No Not Applicable
dboylan
Callout
Yes No Not Applicable

Next Page
Explain
Explain
Explain
What two key factors do you see driving such a consolidation?
Explain:
Explain:
-Yes/No-
Other
Other
BUSINESS CONFIDENTIAL - Per Section 705(d) of the Defense Production Act
Return to Table of Contents
B.
Small companies less able to compete
Reduced domestic board capability
Higher prices for bare board customers
Impact
Previous Page
Comments:
Explain
C.
Shrinkage in manufacturing workforce
Which of the following impacts do you anticipate from consolidation in the number of U.S. bare circuit board manufacturing facilities?
Section 12b: Competitive Factors (continued)
A.
Is the return-on-investment (ROI) associated with this facility's DEFENSE-RELATED bare circuit board manufacturing business sufficient relative to
capital requirements and business risk?
Is the return-on-investment (ROI) associated with this facility's COMMERCIAL bare circuit board manufacturing business sufficient relative to capital
requirements and business risk?
To what extent is this facility's continued ability to manufacture bare circuit boards for commercial customers dependent on the viability of your USG
business?
Greater dependence on non-U.S. materials
Higher material costs
Pricing advantage for larger board manufacturers
Increased market share for non-U.S. companies
What level of foreign acquisition of U.S. bare circuit board manufacturers do you expect in the next five years?
Fewer U.S. materials manufacturers
To what extent is this facility's continued ability to manufacture bare circuit boards for USG customers dependent on the viability of your commercial
circuit board business?
What level of overall industry consolidation do you expect to occur in the U.S. bare circuit board industry in the next five years?
PDF FOR REFERENCE SUBMIT EXCEL VERSION ONLY
31
dboylan
Callout
Not at all Somewhat Moderately Significantly Not Applicable
dboylan
Callout
Not at all Somewhat Moderately Significantly Not Applicable
dboylan
Callout
None Minimal Moderate Major
dboylan
Callout
Improved production efficiency Cost reduction Excess production capacity Not technologically competitive Diminishing commercial orders Shrinking USG orders Increased foreign competition Larger companies possess market advantages Other
dboylan
Callout
None Minimal Moderate Major

Next Page
Expected Impact on
Organization
Other
Other
BUSINESS CONFIDENTIAL - Per Section 705(d) of the Defense Production Act
Return to Table of Contents
DOD requirement that bare circuit board manufacturers of products for
designated defense systems be registered on the Qualified Manufacturers
List (QML) and/or Qualified Products List (QPL)
(specify here)
(specify here)
Comments:
DOD adds circuit board laminate and related materials to the Defense
National Stockpile
USG requirement that circuit boards produced for critical systems be
manufactured with laminate and related materials made in the U.S.
DOD requirement for designated types of defense systems to use bare
circuit boards manufactured in the U.S. by certified "trusted" suppliers
Previous Page
Section 12c: Competitive Factors (continued)
A.
What impact would each of the following potential USG actions have on your business?
Action Explanation
Increased funding of targeted bare circuit board manufacturing technology
R&D
DOD requirement that electronic systems (not ITAR controlled) use circuit
boards made in manufacturing facilities located in the U.S.
PDF FOR REFERENCE SUBMIT EXCEL VERSION ONLY
32
dboylan
Callout
Benefit No Change Harm Unclear Effect

Next Page
-Yes/No-
BUSINESS CONFIDENTIAL - Per Section 705(d) of the Defense Production Act
Research and development (R&D) related information
Supply chain and sourcing information
Comments:
Information subject to export control regulations (EAR and/or ITAR)
Intellectual property related information
Financial information and records
Human resources information/employee data
Previous Page
Section 13a: Cyber Security
A. Does your organization's internal network connect to the Internet?
B.
C.
Patent and trademark information
Regulatory/compliance information
Return to Table of Contents
Internal Network
(drop-down)
Manufacturing and production line information
Internal communications including negotiation points, merger and
acquisition plans, and/or corporate strategy
Indicate who is responsible for your organization's external IT networks:
Indicate who is responsible for your organization's internal IT networks:
Does this facility have defined, structured methods for actively protecting the following types of Commercially Sensitive Information (see
definitions)?
Commercially Sensitive Information (CSI) Type Explanation
Customer/client information
PDF FOR REFERENCE SUBMIT EXCEL VERSION ONLY
33
dboylan
Callout
Internal IT Department Internal IT Department and U.S. external provider(s) Internal IT Department and non-U.S. external provider(s) Internal IT Department and U.S. and non-U.S. external provider(s) Only U.S. external provider(s) Only non-U.S. external provider(s) U.S. and non-U.S. external provider(s) Not Applicable

Next Page
A.
External Cloud Service Providers
External Data Storage Providers
Impact Level
Previous Page Return to Table of Contents
BUSINESS CONFIDENTIAL - Per Section 705(d) of the Defense Production Act
C.
Indicate the level of impact each of the following types of events attributed to malicious cyber activity has had on this facility since 2012.
Event
Other
Other (specify here)
Comments:
(specify here)
Other (specify here)
Damage to company production capabilities or
systems
Destruction of information asset
Reputation loss, market share, and brand damages
Exfiltration of CSI data
Theft of personnel information
Damage to software and/or source code
Damage or theft of IT assets and infrastructure
Incurred cost of damage assessment and remediation
Business interruption
Note: The FBI encourages recipients to report information concerning suspicious or criminal activity to their local FBI field office or the FBI's 24/7 Cyber Watch
(CyWatch). Field office contacts can be identified at http://www.fbi.gov/contact-us/field. CyWatch can be contacted by phone at 855-292-3937 or e-mail at
[email protected]. When available, each report submitted should include the date, time, location, type of activity, number of people, and type of equipment
used for the activity, the name of the submitting company or organization, and a designated point of contact.
Explanation
Have recent cyber incidents across the marketplace caused your organization to increase its information security budget?
Estimate the percentage of your organization's commercially sensitive information that
is stored with:
Does your organization restrict or prohibit your external cloud service or external data storage provider(s) from storing commercially
sensitive information outside of the U.S.?
Section 13b: Cyber Security (continued)
B.
User idle time and lost productivity because of
downtime or systems performance delays
Disruption to normal operations because of system
availability problems
Theft of software and/or source code
PDF FOR REFERENCE SUBMIT EXCEL VERSION ONLY
34
dboylan
Callout
None Minimal Moderate Major

Next Page
A B
ImpactRank Top
5
Other
Other (specify here) Other
BUSINESS CONFIDENTIAL - Per Section 705(d) of the Defense Production Act
(specify here)
C
Explanation
Supply Chain Optimization
Intellectual property/patent infringement
Aging equipment, facilities, or infrastructure
Competition - domestic
Export controls/ITAR & EAR
Government acquisition process
Labor availability/costs
Environmental regulations/remediation - domestic
Export Licensing (ITAR/EAR)
A.
(specify here)
Type of Issue
R&D costs
Reduction in USG demand
Aging workforce
Reduction in commercial demand
Export Assistance
Obsolescence
Quality Management and Control
Competition - foreign
Government purchasing volatility
Government regulatory burden
Prototyping
Pension costs
Proximity to customers
Qualifications/certifications
Design for Assembly
Energy and Environmentally Conscious Manufacturing
Worker/skills retention
Taxes
Design for Manufacturability
Previous Page
Section 14: Challenges and Outreach
Identify the issues that have or are expected to impact this facility.
In column A, identify all issues that currently are affecting your business in an adverse way or that are expected to do so in the future.
In column B, rank your top five issues (one being the most important) by selecting numbers one through five, using each rank exactly once.
In column C, provide an explanation for the relevant issues.
Counterfeit parts
Quality of material inputs
Proximity to suppliers
Environmental regulations/remediation - foreign
Healthcare costs
Material input availability
There are many federal and state government programs and services available to assist your organization to better compete in the global marketplace. If your organization
would like more information regarding these government programs, select the specific areas of interest below. The Commerce Department will follow-up with your
organization regarding your selections.
Continuous Improvement/
Lean ManufacturingMarket Expansion/Business Growth
Health and safety regulations
Comments:
B.
Return to Table of Contents
Technology Acceleration
Vendor/Material Sourcing
Cyber Security Product Design
Small Business Innovation Research (SBIR) and Small Business Technology
Transfer (STTR) contracts
Government Procurement Guidelines
Cyber security
PDF FOR REFERENCE SUBMIT EXCEL VERSION ONLY
35
dboylan
Callout
Current Future Both No
dboylan
Callout
1 2 3 4 5

Previous Page Return to Table of Contents
Facility Name
Organization Name
Organization's Internet Address
Name of Authorizing Official
Title of Authorizing Official
E-mail Address
Phone Number and Extension
Date Certified
How many hours did it take to complete this survey?
BUSINESS CONFIDENTIAL - Per Section 705(d) of the Defense Production Act
Section 15: Certification
The undersigned certifies that the information herein supplied in response to this questionnaire is complete and correct to the best of his/her
knowledge. It is a criminal offense to willfully make a false statement or representation to any department or agency of the United States
Government as to any matter within its jurisdiction (18 U.S.C.A. 1001 (1984 & SUPP. 1197))
Once this survey is complete, submit it via e-mail to: [email protected]. Be sure to retain a copy for your records and to facilitate any
necessary edits or clarifications.
In the box below, provide any additional comments or any other information you wish to include regarding this survey assessment.
PDF FOR REFERENCE SUBMIT EXCEL VERSION ONLY
36

OFFICE OF TECHNOLOGY EVALUATION (OTE)
Publication List
November 2018
For further information about OTE’s programs or for copies of assessments please visit http://www.bis.doc.gov/dib
Please visit www.bis.doc.gov/232 for Section 232 Investigations and www.bis.doc.gov/criticaltech for Technology Assessments.
The U.S. Department of Commerce’s Office of Technology Evaluation is the focal point within the Department for conducting assessments of defense-related industries and technologies. The assessments are based on detailed industry-specific surveys used to collect information from U.S. companies and are conducted on behalf of the U.S. Congress, the Military Services, other U.S. Government agencies, industry associations, or other interested parties.
Ongoing Assessments Date
U.S. Air Force Industrial Supply Chain Sustainment Assessment 2020
U.S. Software Integration in Infrastructure Network Systems Assessment 2019
The Effect of Imports of Uranium on the National Security 2019
U.S. Integrated Circuit Design and Manufacturing Industry Assessment 2019
Recent Assessments Date
U.S. Air Force C-17 Aircraft Supply Chain Impact Assessment 2018
U.S. Rocket Propulsion Industrial Base Assessment 2018
The Effect of Imports of Steel on the National Security Jan. 2018
The Effect of Imports of Aluminum on the National Security Jan. 2018
U.S. Footwear Industrial Base Assessment Summer 2017
U.S. Textile and Apparel Industrial Base Assessment Summer 2017
U.S. Bare Printed Circuit Board Industry Assessment 2017
U.S. Strategic Material Supply Chain Assessment: Select Rare Earth Elements 2016
U.S. Strategic Material Supply Chain Assessment: Titanium Spring 2016
U.S. Strategic Material Supply Chain Assessment: Carbon Fiber Composites Fall 2015
Defense Industrial Base Assessment of the U.S. Underwater Acoustics Transducer Industry Spring 2015
Cost-Metric Assessment of Diminishing Manufacturing Sources and Material Shortages (Update) Feb. 2015
U.S. Space Industrial Base “Deep Dive” Assessment: Small Businesses Dec. 2014
U.S. Space Industrial Base “Deep Dive” Assessment: Workforce Issues Sept. 2014
U.S. Space Industrial Base “Deep Dive” Assessment: Export Controls Feb. 2014
Industrial Base Assessment of Consumers of U.S. Electro-Optical (EO) Satellite Imagery Aug. 2013
National Security Assessment of the Cartridge and Propellant Actuated Device Industry: 4th Review July 2013
Critical Technology Assessment: Night Vision Focal Plane Arrays, Sensors, and Cameras Oct. 2012
National Aeronautics and Space Administration (NASA) Industrial Base – Post-Space Shuttle June 2012
Defense Industrial Base Assessment of the Telecommunications Industry Infrastructure Apr. 2012
Reliance on Foreign Sourcing in the Healthcare and Public Health (HPH) Sector Dec. 2011
Cost-Metric Assessment of Diminishing Manufacturing Sources and Material Shortages Aug. 2010
Critical Technology Assessment: Impact of U.S. Export Controls on Green Technology Items Aug. 2010
Technology Assessment of Fine Grain, High-Density Graphite Apr. 2010
Defense Industrial Base Assessment of Counterfeit Electronics Jan. 2010
Technology Assessment of 5-Axis Machine Tools July 2009

Brad Botwin, Director, Industrial Studies, OTE
Phone: (202) 482-4060 Email: [email protected]
Archived Assessments Date
Defense Industrial Base Assessment of U.S. Integrated Circuit Design and
Fabrication Capability Mar. 2009
Defense Industrial Base Assessment of the U.S. Space Industry Aug. 2007
Technology Assessment of Certain Aromatic Polyimides July 2007
Defense Industrial Base Assessment of U.S. Imaging and Sensors Industry Oct. 2006
National Security Assessment of the Cartridge and Propellant Actuated
Device Industry: Third Review Aug. 2006
Economic Impact Assessment of the Air Force C-17 Program Dec. 2005
National Security Assessment of the Munitions Power Sources Industry Dec. 2005
National Security Assessment of the Air Delivery (Parachute) Industry May 2004
Industry Attitudes on Collaborating with DoD in R&D – Air Force Jan. 2004
Industrial Base/Economic Impact Assessment of Army Theater Support
Vessel Procurement Dec. 2003
A Survey of the Use of Biotechnology in U.S. Industry Oct. 2003
Industrial Base Assessment of U.S. Textile and Apparel Industries Sept. 2003
Technology Assessment of U.S. Assistive Technology Industry Feb. 2003
Heavy Manufacturing Industries: Economic Impact and Productivity of
Welding – Navy June 2002
The Effect of Imports of Iron Ore and Semi-Finished Steel on the National
Security Oct. 2001
National Security Assessment of the U.S. High-Performance Explosives &
Components Sector June 2001
Statistical Handbook of the Ball and Roller Bearing Industry (Update) June 2001
National Security Assessment of the U.S. Shipbuilding and Repair
Industry May 2001
National Security Assessment of the Cartridge and Propellant Actuated
Device Industry: Update Dec. 2000
The Effect on the National Security of Imports of Crude Oil and Refined
Petroleum Products Nov. 1999
U.S. Commercial Technology Transfers to The People’s Republic of China Jan. 1999
Critical Technology Assessment of Optoelectronics Oct. 1998
National Security Assessment of the Emergency Aircraft Ejection Seat
Sector Nov. 1997
Critical Technology Assessment of the U.S. Semiconductor Materials
Industry Apr. 1997
Archived Assessments Date
National Security Assessment of the Cartridge and Propellant Actuated
Device Industry Oct. 1995
International Market for Computer Software with Encryption – NSA 1995
The Effect of Imports of Crude Oil and Petroleum Products on the
National Security Dec. 1994
Critical Technology Assessment of U.S. Artificial Intelligence Aug. 1994
Critical Technology Assessment of U.S. Superconductivity Apr. 1994
Critical Technology Assessment of U.S. Optoelectronics Feb. 1994
Critical Technology Assessment of U.S. Advanced Ceramics Dec. 1993
Critical Technology Assessment of U.S. Advanced Composites Dec. 1993
The Effect of Imports of Ceramic Semiconductor Packages on the National
Security Aug. 1993
National Security Assessment of the U.S. Beryllium Industry July 1993
National Security Assessment of the Antifriction Bearings Industry Feb. 1993
National Security Assessment of the U.S. Forging Industry Dec. 1992
The Effect of Imports of Gears & Gearing Products on the National
Security July 1992
National Security Assessment of the Domestic and Foreign Subcontractor
Base - 3 U.S. Navy Systems Mar. 1992
National Security Assessment of the U.S. Semiconductor Wafer Processing
Equipment Industry Apr. 1991
National Security Assessment of the U.S. Robotics Industry Mar. 1991
National Security Assessment of the U.S. Gear Industry Jan. 1991
The Effect of Imports of Uranium on the National Security Sept. 1989
The Effect of Imports of Crude Oil and Refined Petroleum on the National
Security Jan. 1989
The Effect of Imports of Plastic Injection Molding Machines on the
National Security Jan. 1989
The Effect of Imports of Anti-Friction Bearings on the National Security July 1988
Investment Castings: A National Security Assessment Dec. 1987
Joint Logistics Commanders/DOC Precision Optics Study June 1987
An Economic Assessment of the U.S. Industrial Fastener Industry Mar. 1987
Joint Logistics Commanders/DOC Bearing Study June 1986