
US Army Corps of Engineers ® Engineer Research and Development Center West Bay Sediment Diversion...
36
US Army Corps of Engineers ® Engineer Research and Development Center West Bay Sediment Diversion Work Plan Task 1 : Data Collection and Analysis December 1 2009 Thad Pratt CEERD-HF-FM
-
Upload
marvin-preston -
Category
Documents
-
view
213 -
download
0
Transcript of US Army Corps of Engineers ® Engineer Research and Development Center West Bay Sediment Diversion...

US Army Corps of Engineers® Engineer Research and Development Center
West Bay Sediment Diversion Work PlanTask 1 : Data Collection and Analysis
December 1 2009
Thad Pratt CEERD-HF-FM

US Army Corps of Engineers® Engineer Research and Development Center
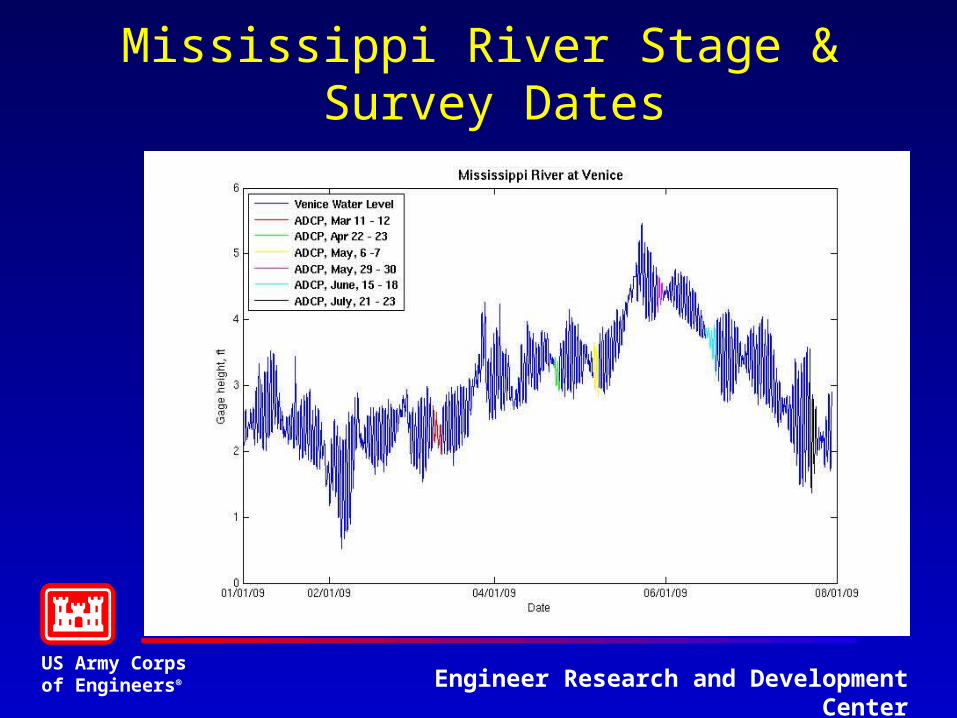
Data Collection Trips• Data collection Trip 1, March 9-12, 22-23 April, 5-6 May, 2009: Multi-beam and hydrodynamic (ADCP) surveys, bed samples and
suspended sediment samples.
• Data collection Trip 2, 27-31 May, 2009: Hydrodynamic surveys, suspended sediment samples and additional bed material samples from below Cubit’s Gap to Southwest Pass Jetties.
• Data collection Trip 3, June 15-18, 2009: Hydrodynamic surveys and suspended sediment samples.
• Data collection Trip 4, July 21-23, 2009: Hydrodynamic surveys, suspended sediment samples, and bed load samples.
• Additional Multi-beam survey, August 2009
• Data Collection Trip 5, September 23-24, 2009: Hydrodynamic surveys, suspended sediment samples and bed material samples.
US Army Corps of Engineers® Engineer Research and Development Center
Mississippi River Stage & Survey Dates

US Army Corps of Engineers® Engineer Research and Development Center
Instrumentation
• Geo-Acoustics 250 kHz swath system
w/ Applanix POSMV IMU• RDI 600 kHz Broadband ADCP with bottom-
tracking and GPS • P-61 point sampler for suspended sediments• Push core & bottom surface drag samplers• OBS and CTD Profiler

US Army Corps of Engineers® Engineer Research and Development Center
Multi-beam Survey Coverage

US Army Corps of Engineers® Engineer Research and Development Center
Multi-beam Surveys of the West Bay Diversion Cut
April Survey
August Survey
US Army Corps of Engineers® Engineer Research and Development Center
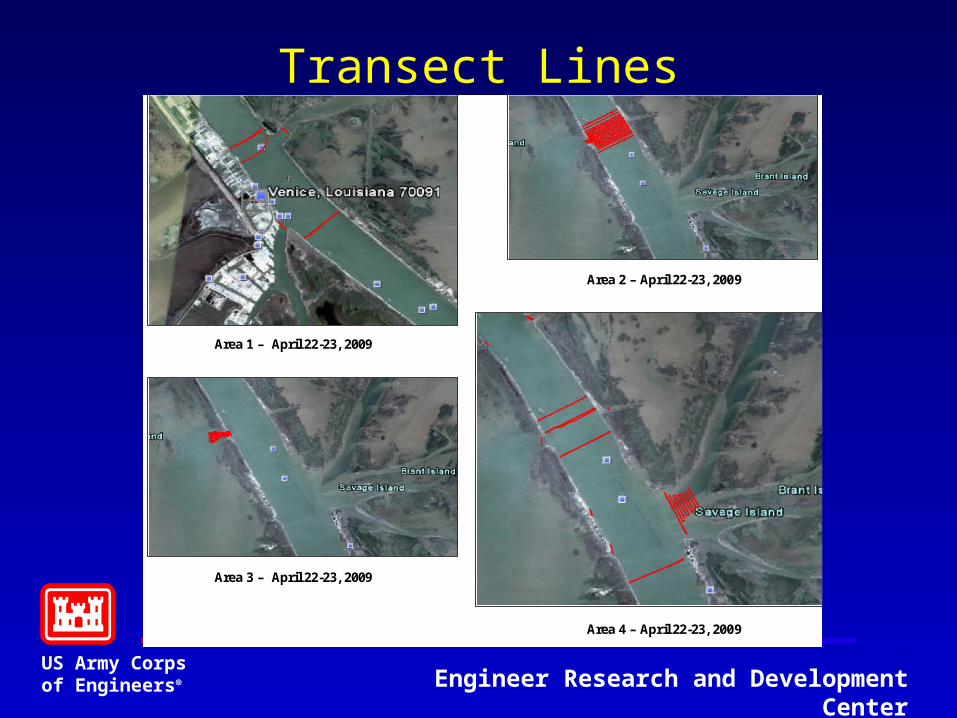
Transect Lines
Area 1 – April 22-23, 2009
Area 2 – April 22-23, 2009
Area 3 – April 22-23, 2009
Area 4 – April 22-23, 2009

US Army Corps of Engineers® Engineer Research and Development Center
Survey Dates Apr 22-23 May 5-6 May 29-30 Jun 16-17 Jul 21
Discharge North of Channel
550,738 ft3/s 500,448 ft3/s 740,062 ft3/s 568,041 ft3/s 304000 ft3/s
Discharge into Channel
46,514 ft3/s 42,011 ft3/s 68,373 ft3/s 52,252 ft3/s 31,000 ft3/s
Discharge South of the Channel
509,966 ft3/s 454,715 ft3/s 675,834 ft3/s 485,332 ft3/s 260,000 ft3/s
Percentage discharge into the channel
8.4% 8.4% 9.2% 9.2% 10.1%
Percentage of unaccounted discharge
1% -1% 1% -5% 4.2%
Discharges through the control volume that includes the West Bay Diversion Channel

US Army Corps of Engineers® Engineer Research and Development Center
Discharges through the control volume that includes Cubit’s Gap
Survey Dates April 22-23 May 29-30 June 16-17 Jul 21
Discharge north of Cubit’s Gap
509,966 ft3/s 675,834 ft3/s 485,332 ft3/s 237,000 ft3/s
Discharge through Cubit’s Gap
80,945 ft3/s 126,132 ft3/s 87,884 ft3/s 42,000 ft3/s
Discharge south of Cubit’s Gap
443,033 ft3/s 560,997 ft3/s 378,873 ft3/s 187,000 ft3/s
Percentage discharge into the channel 15.9% 18.7% 18.1% 18.1%
Percentage of unaccounted discharge 3% 2% -4% 3.3%
US Army Corps of Engineers® Engineer Research and Development Center
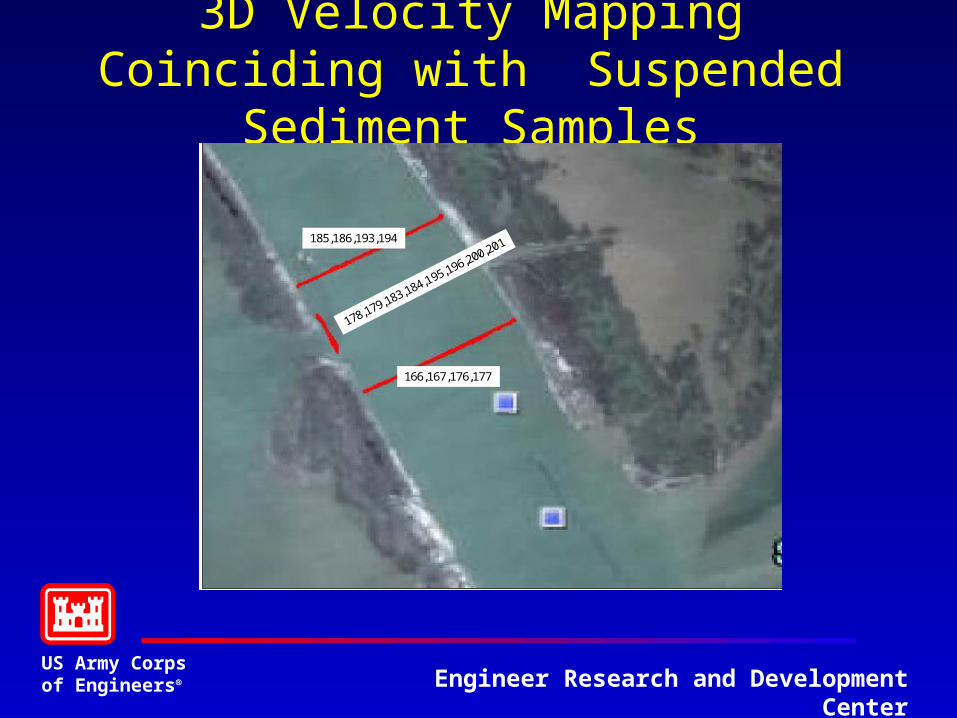
3D Velocity Mapping Coinciding with Suspended Sediment Samples
166,167,176,177
185,186,193,194
May 5-6, 2009

US Army Corps of Engineers® Engineer Research and Development Center
3D Velocity Mapping in Vicinity of West Bay Diversion
Area 2 – April 22-23, 2009

US Army Corps of Engineers® Engineer Research and Development Center
3D Velocity Mapping Inside West Bay Diversion
87
Area 3 – April 22-23, 2009

US Army Corps of Engineers® Engineer Research and Development Center
3D Velocity Mapping in Vicinity of Cubit’s Gap
119,121,123
124,125,126,127
137
132,135,136
133,134
128,130,131
139,140,141
142,143,144
145,146,147,148
149,150,151,152
156
157
158
159
160
161
162
163
153,154,155
Area 4 – April 22-23, 2009

US Army Corps of Engineers® Engineer Research and Development Center
West Bay Diversion Depth Averaged Velocities April 2009

US Army Corps of Engineers® Engineer Research and Development Center
West Bay Diversion Surface Velocity April 2009
US Army Corps of Engineers® Engineer Research and Development Center
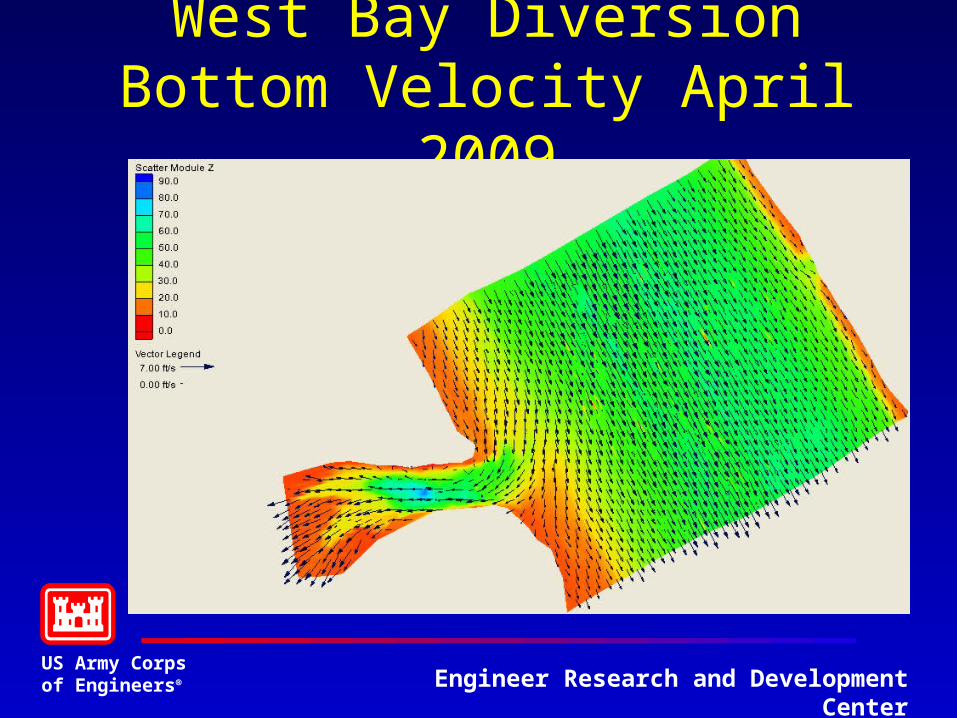
West Bay Diversion Bottom Velocity April 2009

US Army Corps of Engineers® Engineer Research and Development Center
Vertical Velocity Distribution within West Bay Diversion

US Army Corps of Engineers® Engineer Research and Development Center
Locations of suspended sediment samples, OBS measurements, and salinity
measurements made on May 30, 2009.
R5.2-A
R5.2-B
R5.2-C
R5.2-D
R5.2-E
R4.5-A
R4.5-B
R4.5-C
R4.5-D
R4.5-E
R4.9
WBD-A,B,C
CGMP
CGO5
CGBB
CGRP

US Army Corps of Engineers® Engineer Research and Development Center
River Transect North of West Bay June 2009
00.0
10.0
20.0
30.0
40.0
50.0
60.0
0.00 100.00 200.00 300.00 400.00 500.00 600.00 700.00
SSC (mg/L)
Dep
th (
ft)
N-1
N-2
N-3
N-4
N-5
River Transect just North of Diversion (June 17th)
R5.2-E 30ft
0
0.5
1
1.5
2
2.5
3
3.5
4
0.1 1 10 100 1000
Particle Diameter (um)
% o
f V
olu
me Series1
Series2
Series3
Series4
US Army Corps of Engineers® Engineer Research and Development Center
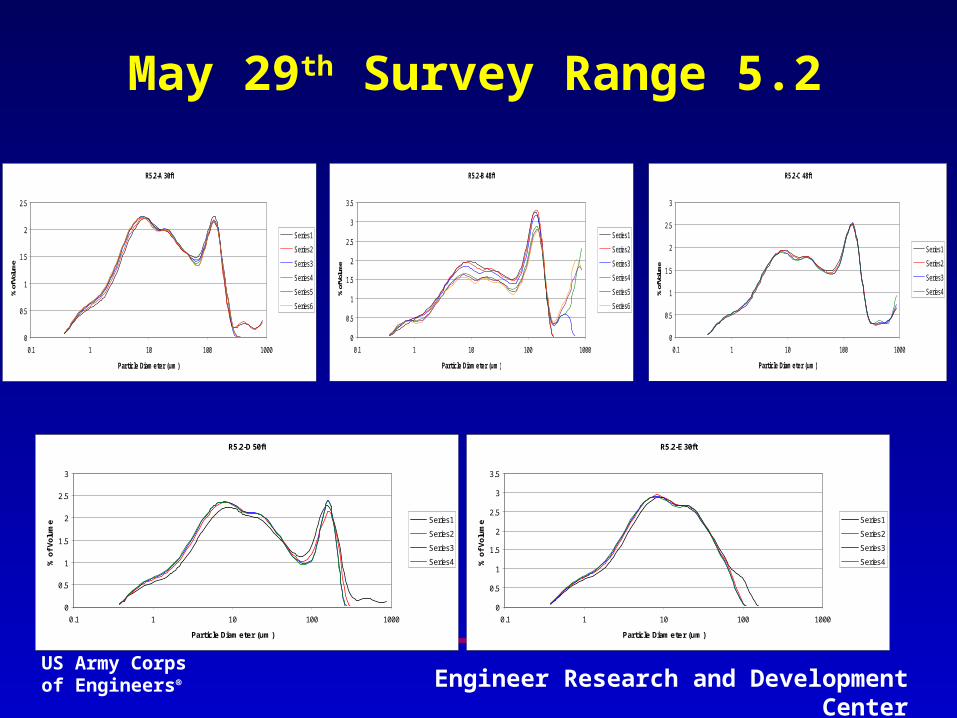
May 29th Survey Range 5.2
R5.2-E 30ft
0
0.5
1
1.5
2
2.5
3
3.5
0.1 1 10 100 1000
Particle Diameter (um)
% o
f V
olu
me Series1
Series2
Series3
Series4
R5.2-D 50ft
0
0.5
1
1.5
2
2.5
3
0.1 1 10 100 1000
Particle Diameter (um)
% o
f V
olu
me Series1
Series2
Series3
Series4
R5.2-B 48ft
0
0.5
1
1.5
2
2.5
3
3.5
0.1 1 10 100 1000
Particle Diameter (um)
% o
f Vol
ume
Series1
Series2
Series3
Series4
Series5
Series6
R5.2-A 30ft
0
0.5
1
1.5
2
2.5
0.1 1 10 100 1000
Particle Diameter (um)
% o
f Vol
ume
Series1
Series2
Series3
Series4
Series5
Series6
R5.2-C 48ft
0
0.5
1
1.5
2
2.5
3
0.1 1 10 100 1000
Particle Diameter (um)
% o
f Vol
ume
Series1
Series2
Series3
Series4

US Army Corps of Engineers® Engineer Research and Development Center
Suspended Sediment ConcentrationsWest Bay Cut Transect SSC April 2009
0
5
10
15
20
25
30
35
40
45
100 150 200 250 300 350
SSC (mf/L)
Dep
th (
ft) WB Cut 1
WB Cut 2
WB Cut 3
Transect North of West Bay Cut SSC April 2009
0
5
10
15
20
25
30
35
40
45
50
0 50 100 150 200 250 300 350 400 450 500
SSC (mg/L)
Dep
th (
ft) N Riv 1
N Riv 2
N Riv 3
US Army Corps of Engineers® Engineer Research and Development Center
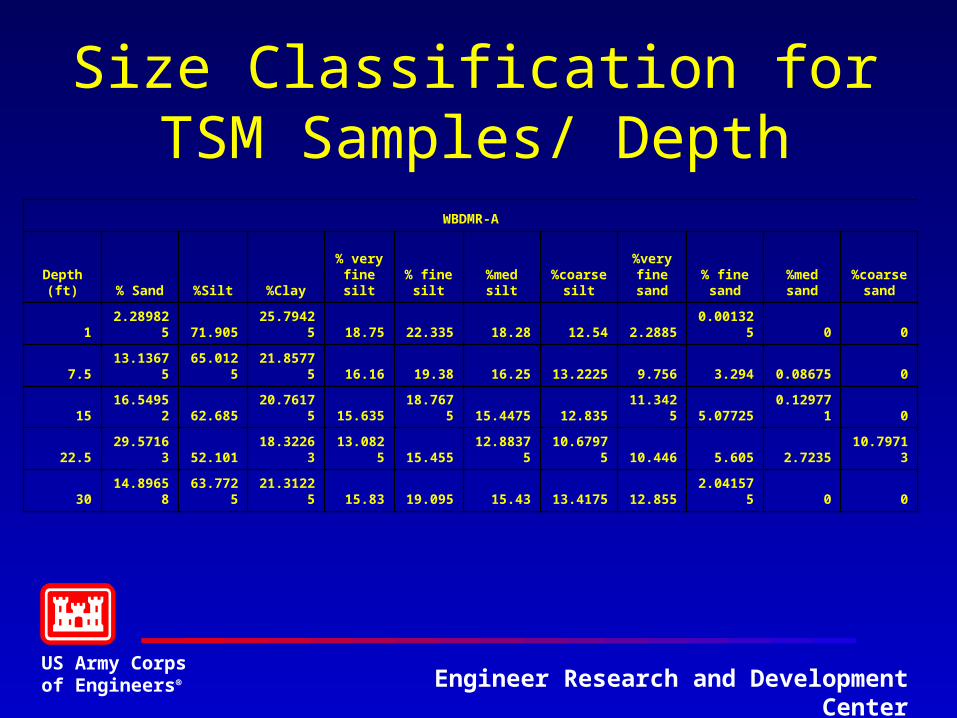
Size Classification for TSM Samples/ Depth
WBDMR-A
Depth (ft) % Sand %Silt %Clay
% very fine silt
% fine silt
%med silt
%coarse silt
%very fine sand
% fine sand
%med sand
%coarse sand
1 2.289825 71.905 25.79425 18.75 22.335 18.28 12.54 2.2885 0.001325 0 0
7.5 13.13675 65.0125 21.85775 16.16 19.38 16.25 13.2225 9.756 3.294 0.08675 0
15 16.54952 62.685 20.76175 15.635 18.7675 15.4475 12.835 11.3425 5.07725 0.129771 0
22.5 29.57163 52.101 18.32263 13.0825 15.455 12.88375 10.67975 10.446 5.605 2.7235 10.79713
30 14.89658 63.7725 21.31225 15.83 19.095 15.43 13.4175 12.855 2.041575 0 0

US Army Corps of Engineers® Engineer Research and Development Center
Drag and Push Core Sediment Samples taken on March 10-12 in vicinity of WB
and Cubit’s Gap
56
55
50 49
15
16
17 18
37,38
996
998
99948
997
3947
53
54
19
20
52
5144
45
46
43
42
41
40
34
35
36
32 33
57
21
22
24
23
26
25
28
27
30
29
31
58
Diversion Channel

US Army Corps of Engineers® Engineer Research and Development Center
Drag and Push-core Samples taken on March 10-12, 2009 between Venice, LA and the West
Bay Diversion channel.
5
6
7
8
9
10
11
12
13
14
15
16
17
18
56
5550
49
Venice, LA

US Army Corps of Engineers® Engineer Research and Development Center
Venice, LA
1
4
2
3
Locations of bottom drag samples made on March 10, 2009 north of Venice, LA.

US Army Corps of Engineers® Engineer Research and Development Center
74,68
73
72
71
70
69
67
66
65
64
62
61
63
60
59
Locations of the bottom drag samples made on May 22, 2009 in Southwest Pass.
US Army Corps of Engineers® Engineer Research and Development Center
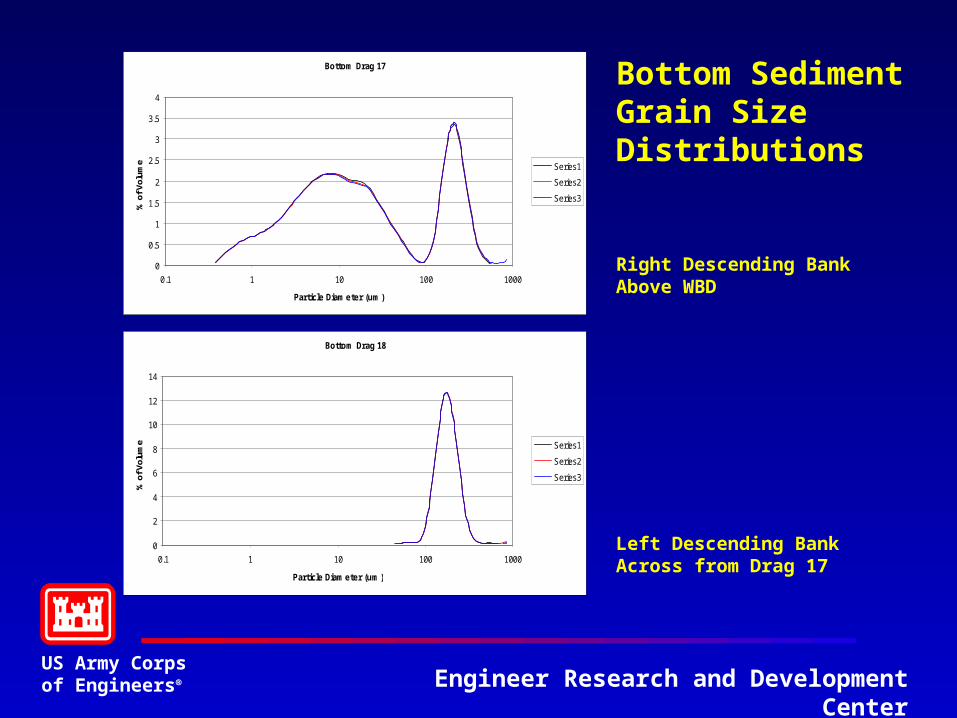
Bottom Drag 18
0
2
4
6
8
10
12
14
0.1 1 10 100 1000
Particle Diameter (um)
% o
f Vol
ume Series1
Series2
Series3
Bottom Drag 17
0
0.5
1
1.5
2
2.5
3
3.5
4
0.1 1 10 100 1000
Particle Diameter (um)
% o
f V
olu
me Series1
Series2
Series3
Bottom Sediment Grain Size Distributions
Right Descending Bank Above WBD
Left Descending Bank Across from Drag 17

US Army Corps of Engineers® Engineer Research and Development Center
Bed Sediment D50 ValuesReceiving Area
US Army Corps of Engineers® Engineer Research and Development Center
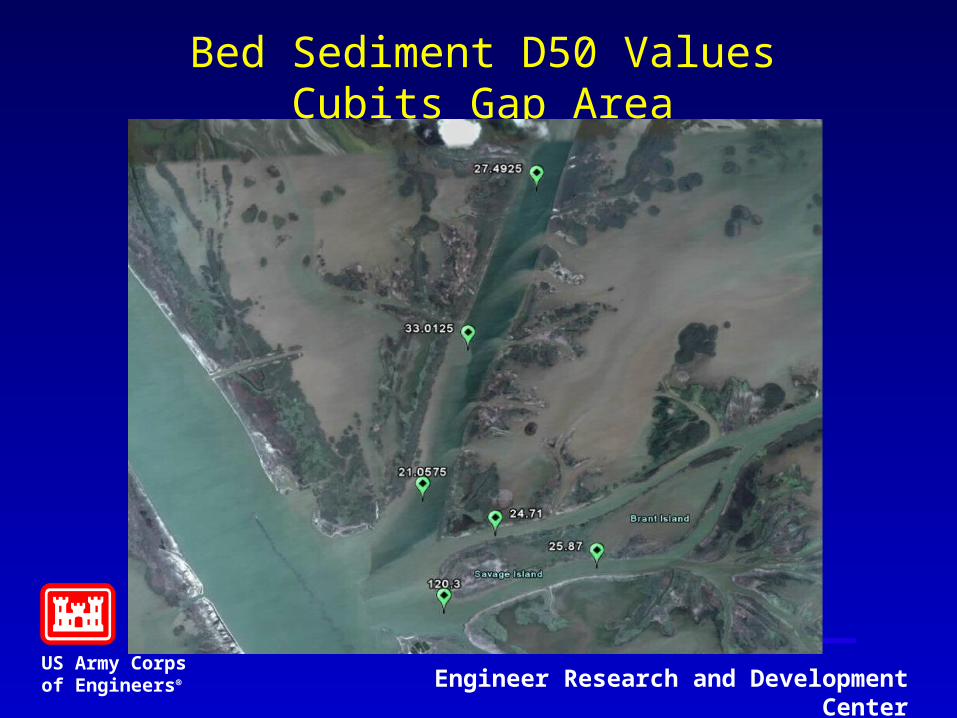
Bed Sediment D50 ValuesCubits Gap Area

US Army Corps of Engineers® Engineer Research and Development Center
Bed Sediment D50 ValuesSouth West Pass

US Army Corps of Engineers® Engineer Research and Development Center
108k0.47k
0.4k
24k
128k0.2k
0.4k
27k
18k17
0k April 22—23rd Line Total Q Sed Flux M2 (ft³/s) (Tons/Day)R-2.6 444,000 108 K 133 KR-2.8-RB 3,600 0.47 K .8 KR-3.5-RB 2,300 0.4 K .4KR-5.2 518,000 128 K 140KR-6.5-LB 4,700 0.4 K .7KR-6.4-RB 1,700 0.2 K .4KR-12.1 685,600 170 K 191KWBD 51,500 24 K 25kGP 81,000 27 K 50 kBCB 74,000 18 K 22 k
Q and Sediment Flux for Venice to below Cubit’s Gap

US Army Corps of Engineers® Engineer Research and Development Center
12.6k
144k
153k
May 5—6th
Line Total Q Sed Flux M2 (ft³/s) (Tons/Day)
R-5.2 504,000* 153.0 K 162.0 KWBD 42,000* 12.6 K 13.1 KR-4.5 454,000* 144.0 K 148.0 K
* Multiple Transects Averaged
Q and Sediment Flux Around the Diversion Cut
US Army Corps of Engineers® Engineer Research and Development Center
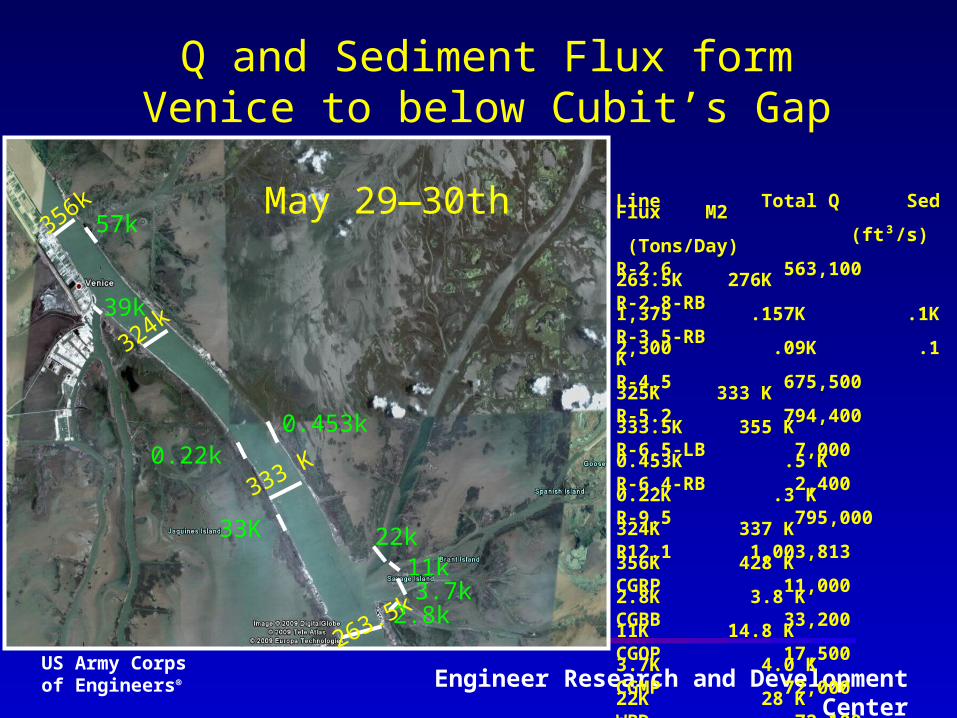
Line Total Q Sed Flux M2 (ft³/s) (Tons/Day)R-2.6 563,100 263.5K 276KR-2.8-RB 1,375 .157K .1K R-3.5-RB 2,300 .09K .1KR-4.5 675,500 325K 333 KR-5.2 794,400 333.5K 355 KR-6.5-LB 7,000 0.453K .5 KR-6.4-RB 2,400 0.22K .3 KR-9.5 795,000 324K 337 KR12.1 1,003,813 356K 428 KCGRP 11,000 2.8K 3.8 KCGBB 33,200 11K 14.8 KCGOP 17,500 3.7K 4.0 KCGMP 72,000 22K 28 KWBD 72,100 33K 34 KGP 104,600 39K 44KBCB 114,000 57K 50 K
Q and Sediment Flux form Venice to below Cubit’s Gap
263.5k
333 K
356k57k
39k
0.22k0.453k
33K
2.8k3.7k
22k
May 29—30th
11k
324k

US Army Corps of Engineers® Engineer Research and Development Center
104k
145.9k
191k23.4k
11.8k
0.0027k0.115k
14.3k
0.79k2.4k
5.7k
June 16—17th
0.9k
Line Total Q Sed Flux M2 (ft³/s) (Tons/Day)R-2.6 385,500 104 K 101 KR-5.2 568,000 145.9K 171 KR-6.5-LB 4,300 0.115 K .175 KR-6.4-RB 600 0.003 K 0 K R-12.1 698,500 191 K 200.0 KCGRP 7,300 0.79 K 1.1 KCGBB 21,000 2.4 K 3.4 KCGOP 9,000 0.9 K 1.1 KCGMP 50,000 5.7 K 8.6 KWBD 51,500 14.3 K 16.0 KGP 74,300 11.9 K 15.7 KBCB 72,100 23.4 K 18.0 K
Q and Sediment Flux form Venice to below Cubit’s Gap

US Army Corps of Engineers® Engineer Research and Development Center
Line Total Q Sed Flux M2 (ft³/s) (Tons/Day)R-2.6 269,000 14.4 K 14.3 KR-4.5 222,000 10.6 K 9.4 KR-5.2 245,000 13.2 K 13.4 KR-9.5 195,000 12.4 K 11.5 KR12.1 238,000 16.3 K 14.2 KCGRP 2,600 .09 K .1 KCGBB 5,600 .35 K .37 KCGOP 2,400 .06 K .07 KCGMP 24,000 .9 K 1.0 KWBD 28,000 1.8 K 1.5 KGP 29,000 1.4 K 1.7KBCB 51,000 2.9 K 7.9 K
Q and Sediment Flux form Venice to below Cubit’s Gap
14.4k
13.2 K
16.3k2.9k
1.4k
1.8K
.06k.09k
.9k
July 20__24th
.35k
12.4k

US Army Corps of Engineers® Engineer Research and Development Center
Observations• ~45% Total Discharge is lost to the multiple cuts from Venice to
below Cubit’s Gap with approximately 50% of the Suspended Sediment leaving the main Channel
• Bed material grain size in anchorage range from 0-800 microns• Suspended sediment concentrations range from 50-450 mg/l in the
vertical• Grain size in suspended sediments range from 0-100 microns w/
mean size at surface 8-9 microns and w/ mean grain size 1 foot above bed ~15 microns


