
Urs Wegmüller, Tazio Strozzi, and Charles Werner Gamma...
18
o This work was supported by the FP7 Project APHORISM (http://www.aphorism-project.eu) o ENVISAT data copyright ESA o PALSAR data copyright JAXA Earthquake damage mapping using the coherence of persistent scatterers 1 Urs Wegmüller, Tazio Strozzi, and Charles Werner Gamma Remote Sensing AG, Switzerland www.gamma-rs.ch
Transcript of Urs Wegmüller, Tazio Strozzi, and Charles Werner Gamma...

o This work was supported by the FP7 Project APHORISM (http://www.aphorism-project.eu)
o ENVISAT data copyright ESA o PALSAR data copyright JAXA
Earthquake damage mapping using the coherence of persistent scatterers
1
Urs Wegmüller, Tazio Strozzi, and Charles Werner Gamma Remote Sensing AG, Switzerland
www.gamma-rs.ch

o APHORISM is an EC FP7 project (SPACE-2013-1) o It proposes the development and testing of two new
methods to combine different types of Earth Observation satellite data and ground data:
- one addresses ash monitoring (volcanic crises) - one addresses damage mapping (seismic crises) o The work presented here contributes to the seismic
crises product development
2

o After an Earthquake earth observation methods can support the damage assessment.
o Primarily VHR optical and SAR data are used for this, especially for the assessment of damage at “single-building scale”
o Here we use HR SAR data (ENVISAT) o Using HR SAR data InSAR coherence showed
promising results in the past – but this at “block scale”
Background
3

PALSAR differential interferogram
4
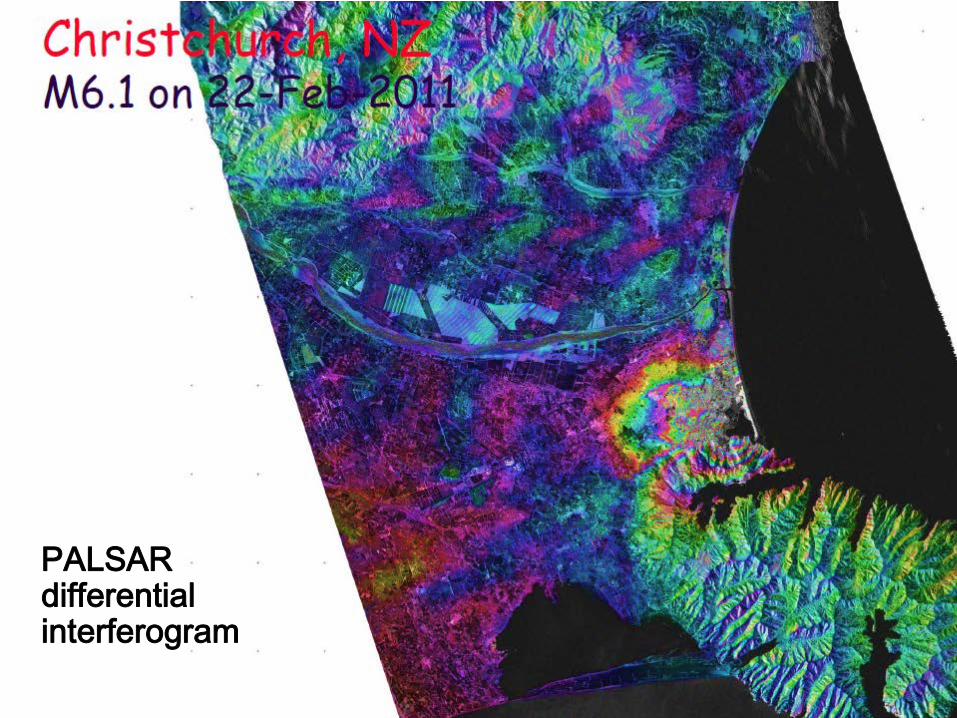
Christchurch deformation mapping (using PALSAR)
PALSAR differential interferogram
5

Christchurch damage mapping (using PALSAR)
6
o PSI provides information (height, deformation) for individual scatterers (single pixels) “single-building scale” potential
o Use “PSI coherence” to map building damage ? PS = selection of high coherence scatterers
develop methodology apply it to specific case assess potential and limitations
Objective of our work
7

o PSI temporal coherence Estimators: - deviation from (linear) phase model - deviation from spatially filtered value
o PSI spatial coherence Estimator: - as for 2D InSAR but only considering PS
For damage mapping spatial coherence is of interest (depends on individual pair only)
PSI coherence
8

1) PSI processing of pre-seismic stack ( point heights, deformation rates, atmospheric delays)
2) Calculate point differential interferogram for co-seismic pairs (considering model from pre-seismic analysis)
3) Determining spatial coherence for co-seismic pair(s) and for pre-seismic pairs with similar characteristics (baseline, time interval, season)
4) Determine coherence differences between corresponding pre- and co-seismic pairs; use coherence reduction as damage indicator
PSI coherence reduction approach to map building damage
9

o Darfield Earthquake M7.0 on 4-Sep-2010 o Causing damage in parts of Christchurch o ENVISAT ASAR stack with 36 pre-seismic and
1 post-seismic scenes (17-Sep-2010)
Application over Christchurch, NZ
10

Christchurch, PSI velocity map
from ENVISAT 36 pre-seismic scenes
11

Mapping Darfield Earthquake damage in Christchurch area using ENVISAT PSI coherence reduction
12
Reduction of spatial coherence of Persistent Scatterers in co-seismic pair (as compared to pre-seismic pairs). Green: no reduction Yellow: intermediate reduction Red: strong reduction
PSI coherence reduction
13
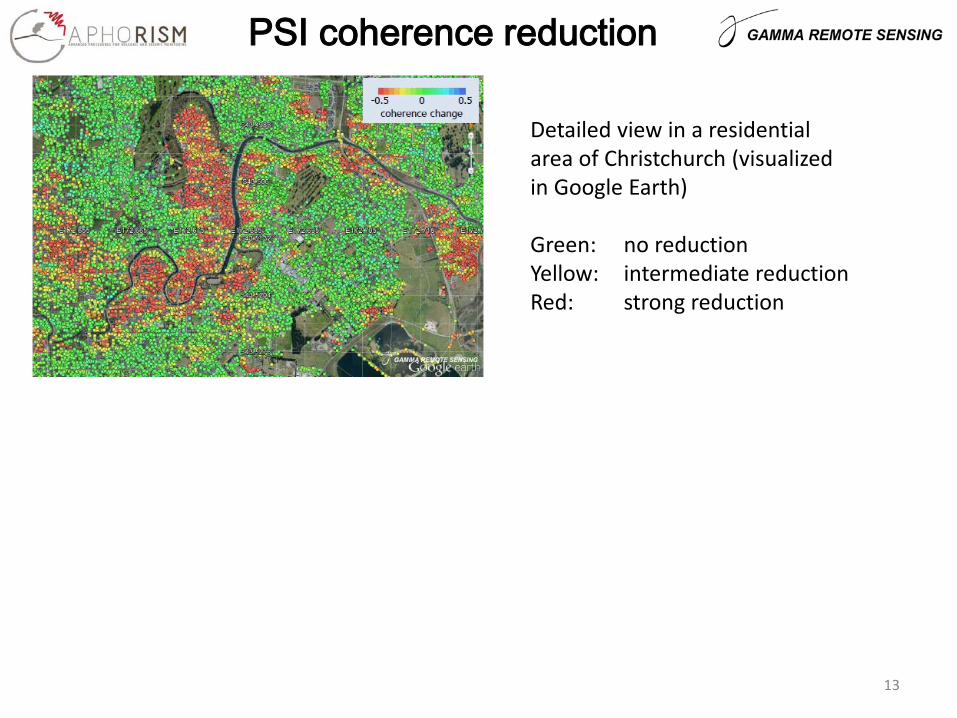
Detailed view in a residential area of Christchurch (visualized in Google Earth) Green: no reduction Yellow: intermediate reduction Red: strong reduction

PSI coherence reduction
14
Detailed view in a residential area of Christchurch (visualized in Google Earth) Green: no reduction Yellow: intermediate reduction Red: strong reduction
In-situ damage assessment: Red areas indicate “evidence of liquefaction visible at ground surface” (as shown in the Geotechnical land damage assessment & reinstatement report, stage 1, Oct. 2010, as found on New Zeeland government web-site [1].)

1) Damage mapping methodology based on PSI coherence reduction was presented
2) Methodology was applied to map damage of the Darfield Earthquake in Christchurch using ENVISAT ASAR
3) Comparison with in-situ information showed good correspondence of PSI coherence reduction with liquefaction areas, indicating a good potential of the method in this case
4) An advantage of considering persistent scatterers is the high level of the pre-seismic coherence
Conclusions (1)
15

Limitations identified 5) Estimation of spatial coherence requires multiple
scatterers, therefore “single-building scale” may not necessarily be achieved
6) Undamaged building among damaged buildings will not be identified
7) Scatter mechanism may depend only on one part of a building (e.g. 1 wall) and so damage to another part (e.g. roof) may not change the PSI phase and coherence
More cases should be investigated
Conclusions (2)
16

L’Aquila, PSI velocity map
Average linear deformation rate from ENVISAT (20021110 to 20090308). The red cross indicates the reference point, the red arrow the look direction.
17

0.5 0.0 -0.5 coherence reduction
L’Aquila, PSI coherence reduction
PSI coherence reduction caused by the l’Aquila earthquake, determined using ENVISAT ASAR data.
18
Damage inventory for single buildings in l’Aquila, done in-situ by INGV.


