Rome And the spread of urbanization. Spread of Urbanization .
Upload
avinash111dCategory
view
31download
0
A project on
URBANIZATION OF MANCHERIAL TOWN
Submitted by
Mohd Arbaaz 201511603
D Avinash 201511599

Content
1. Abstract
2. Specification Tables
3. Introduction
4. Case study
5. Methodology
6. Results
7. Limitation
8. Conclusion2
Abstract
By taking help of satellite data we have conducted studies on urbanization.These
datasets consists four different years of Landsat Images. A Detailed description
using flowchart is given to show how to use this data to produce land use/cover
maps.The land use/cove maps were used to know the urban growth in
Mancherial Town Telangana (18.8756°N,78.4591°E)
3
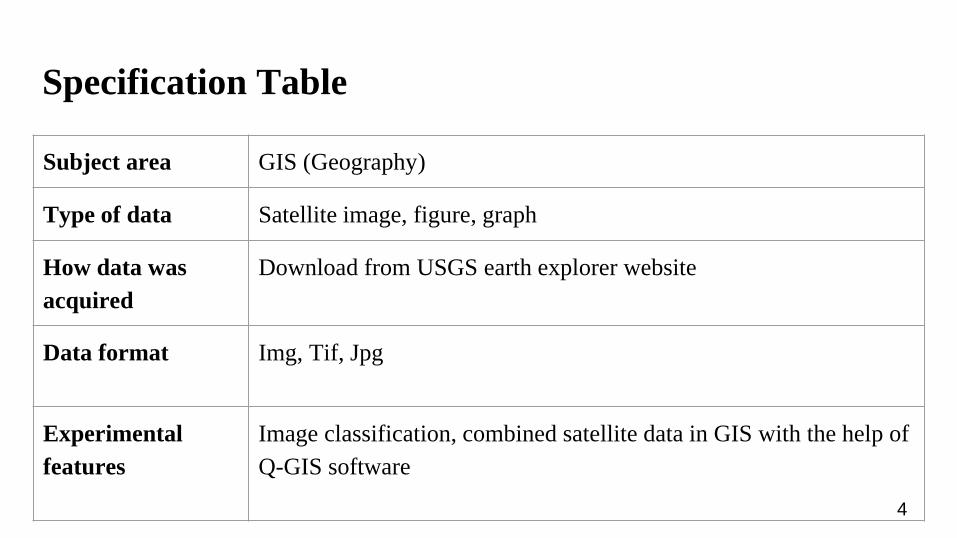
Specification Table
Subject area GIS (Geography)
Type of data Satellite image, figure, graph
How data was
acquired
Download from USGS earth explorer website
Data format Img, Tif, Jpg
Experimental
features
Image classification, combined satellite data in GIS with the help of
Q-GIS software
4
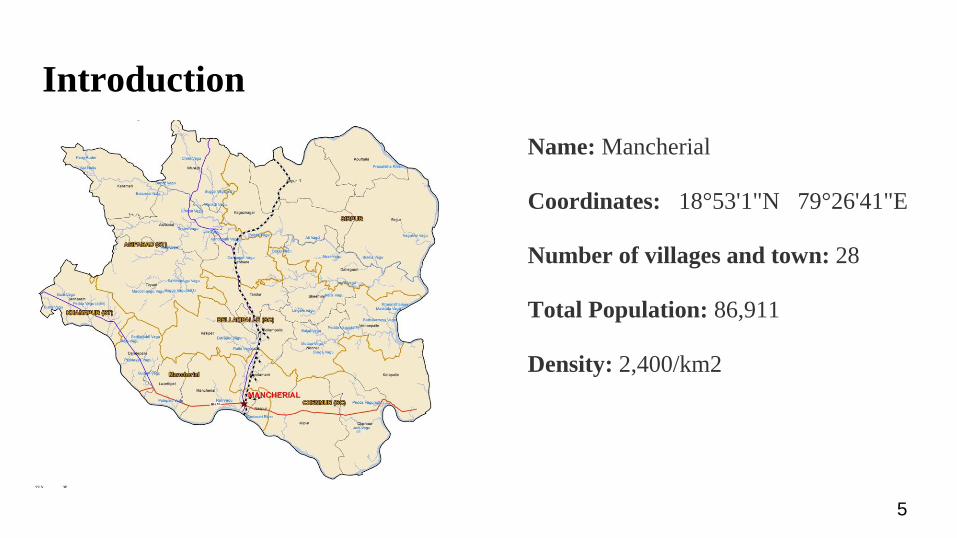
Introduction
Name: Mancherial
Coordinates: 18°53'1"N 79°26'41"E
Number of villages and town: 28
Total Population: 86,911
Density: 2,400/km2
5
Introduction
1. Landsat Thematic Mapper (TM) :images consist of seven spectral bands
with a spatial resolution of 30 meters for Bands 1 to 5 and 7.
2.Landsat 8 Operational Land Imager (OLI): images consist of nine
spectral bands with a spatial resolution of 30 meters for Bands 1 to 7 and 9.
We have used Landsat 5 TM shortwave-infrared (SWIR) and near-infrared
(NIR) bands for 2001,2005,2010 and Landsat 8 for 2016.
6

Introduction
Normalized Difference Built-Up Index (NDBI)
This index highlights urban areas where there is typically a higher reflectance in
the shortwave-infrared (SWIR) region, compared to the near-infrared (NIR)
region. Applications include watershed runoff predictions and land-use planning.
The NDBI was originally developed for use with Landsat TM bands 5 and 4.
However, it will work with any multispectral sensor with a SWIR band between
1.55-1.75 µm and a NIR band between 0.76-0.9 µm.
7
where , SWIR: shortwave-infrared & NIR: near-infrared
NDBI = (SWIR-NIR)/(SWIR+NIR)
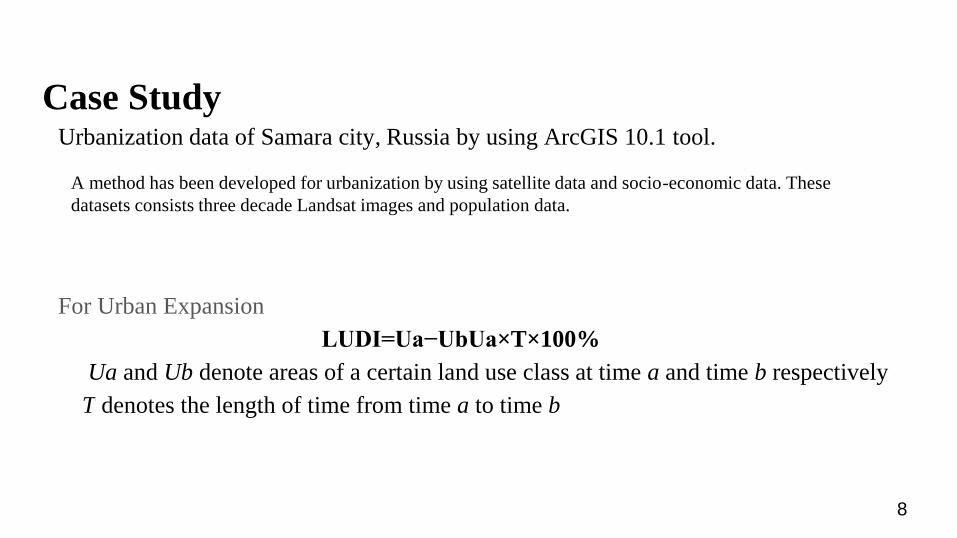
Case StudyUrbanization data of Samara city, Russia by using ArcGIS 10.1 tool.
For Urban Expansion
LUDI=Ua−UbUa×T×100%
Ua and Ub denote areas of a certain land use class at time a and time b respectively
T denotes the length of time from time a to time b
8
A method has been developed for urbanization by using satellite data and socio-economic data. These
datasets consists three decade Landsat images and population data.
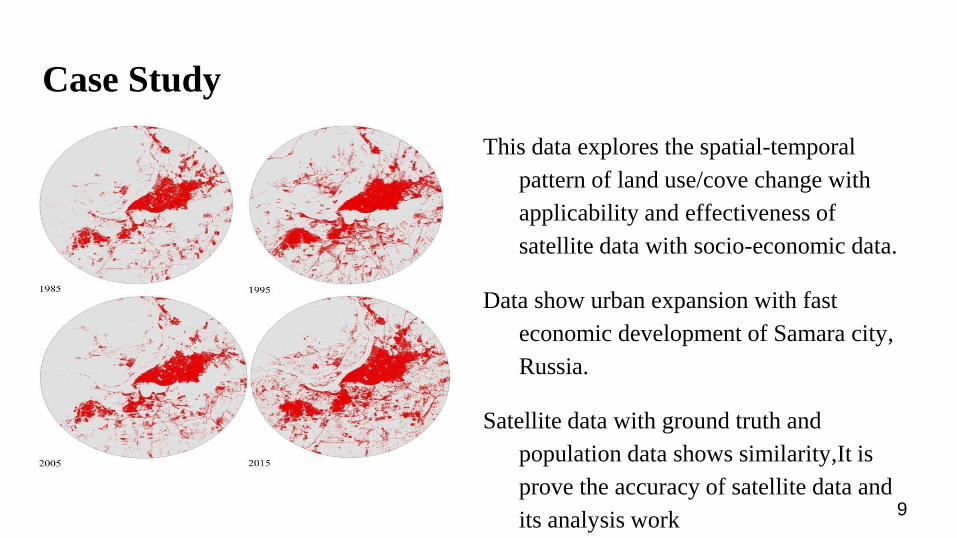
Case Study
This data explores the spatial-temporal
pattern of land use/cove change with
applicability and effectiveness of
satellite data with socio-economic data.
Data show urban expansion with fast
economic development of Samara city,
Russia.
Satellite data with ground truth and
population data shows similarity,It is
prove the accuracy of satellite data and
its analysis work9
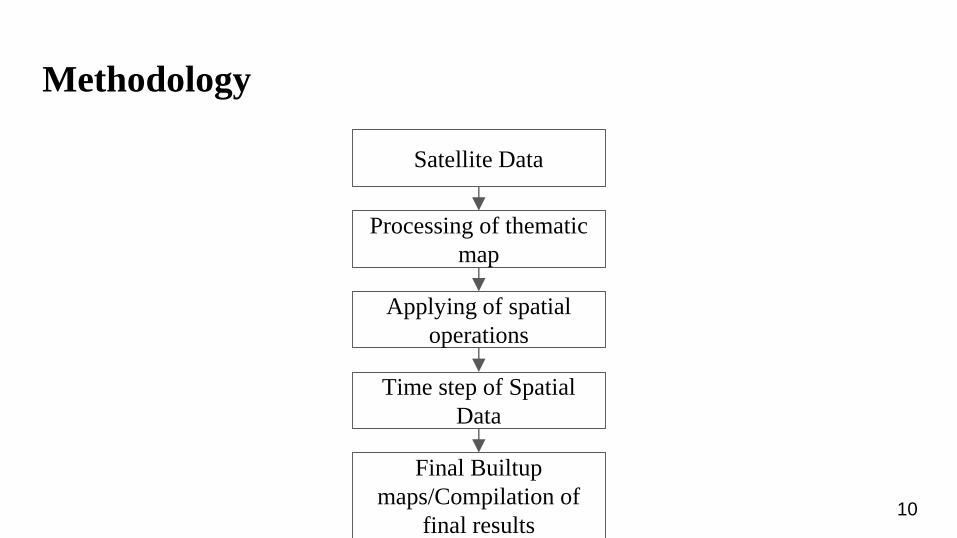
Methodology
Satellite Data
Applying of spatial
operations
Final Builtup
maps/Compilation of
final results
Processing of thematic
map
Time step of Spatial
Data
10
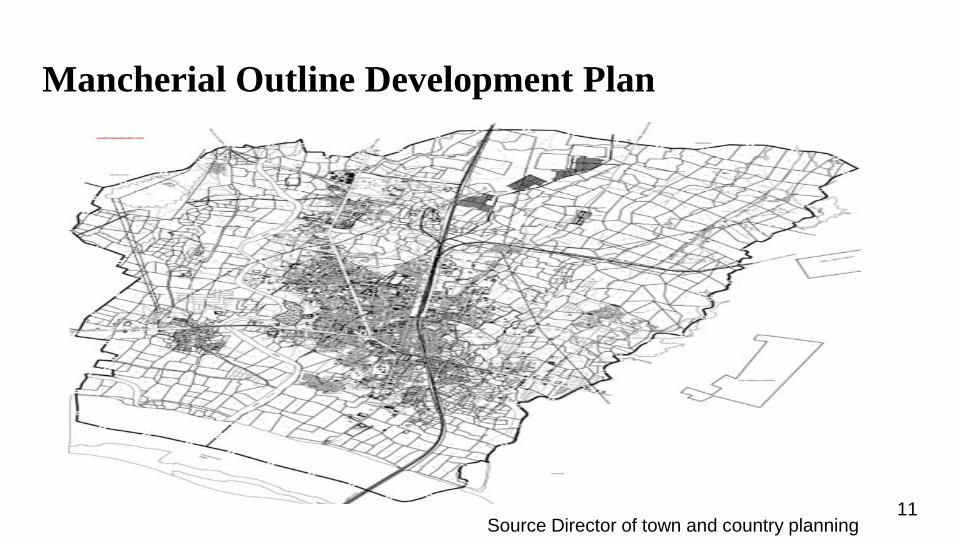
Mancherial Outline Development Plan
11Source Director of town and country planning
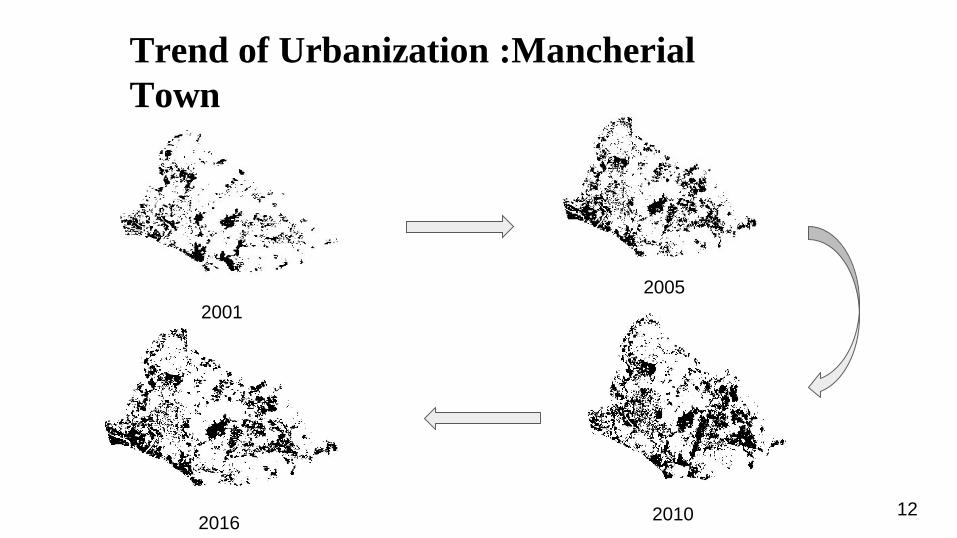
2001
2005
20102016
Trend of Urbanization :Mancherial
Town
12
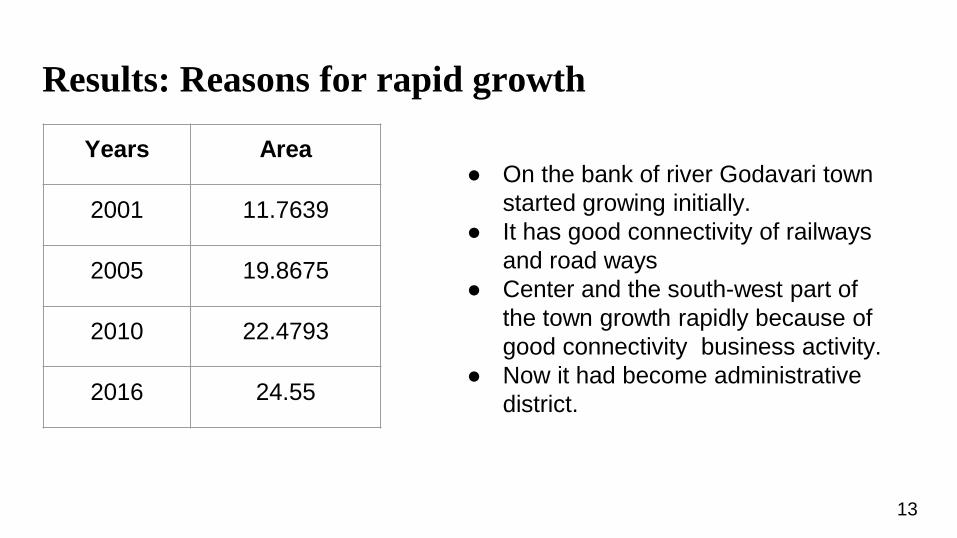
Results: Reasons for rapid growth
Years Area
2001 11.7639
2005 19.8675
2010 22.4793
2016 24.55
● On the bank of river Godavari town
started growing initially.
● It has good connectivity of railways
and road ways
● Center and the south-west part of
the town growth rapidly because of
good connectivity business activity.
● Now it had become administrative
district.
13

Results
A
R
E
A
YEARS 14YEARS
A
R
E
A
Limitation
The boundary (polygon) taken here was taken from the polygon which was drawn from
the google.
There may be minor errors in data analysis due to use age of satellite data.
We have considered different aspects in built up area like open (cast) coal mining,
afforestation, roads ways and railways.
15
Conclusion
Data of urban expansion, land use/cover is very useful to local government and urban
planners for the future plans to sustainable development of the city.
There is Rapid growth over a past years due to urbanization in Mancherial town.
In 2001 only center and few parts of mancherial had urbanized.
In 2005 south west and center mancherial had grown.
In 2010 along with south west ,east part started growing,In 2016 west and east part has
grown rapidly.
In the south-east part of mancherial there is coal mine(open casting),so there will not be
much growth in this area 16
Reference
1. www.usgsearthexplorer.com
2. https://www.ncbi.nlm.nih.gov/pmc/articles/PMC4752730/
3. https://www.harrisgeospatial.com/docs/backgroundotherindices.html
17