Urban Tree Canopy Goal Setting: A Guide for Chesapeake Bay ...

1
Che
sape
ake
Bay
F
ores
try
Wor
kgro
up
Urban Tree Canopy Goal Setting
A Guide for Chesapeake Bay Communities
Prepared By
Raciti, S., M.F. Galvin, J.M. Grove, J.P.M. O'Neil-Dunne, A. Todd, and S. Clagett
Funded by the USDA Forest Service
Prepared for and Published By:
United States Department of Agriculture
Forest Service
Northeastern Area
State and Private Forestry
Chesapeake Bay Program Office
410 Severn Ave
Annapolis, MD
www.na.fs.fed.gov

2
About this Manual
This guidebook is based on the Urban Tree Canopy Goal Setting Workshop, held in
Annapolis, MD on March 7 – 8, 2006. The workshop was designed to give practical
instruction on tools and methods for enhancing urban tree canopy cover. The topics
covered in this guide include administrative considerations, canopy assessment
techniques, goal setting criteria and implementation strategies. It also introduces the
Forest Opportunity Spectrum (FOS), a new framework for attaining diverse social and
ecological goals through urban forestry. This guide, based largely upon the material of
the workshop, is meant to be a resource to Chesapeake Bay communities interested in
reaping the environmental, social, economic, and aesthetic benefits of an enhanced urban
tree canopy.
Sponsoring Organizations:
• Maryland Department of Natural Resources
• USDA Forest Service, Northeastern Area
• USDA Forest Service, Northern Research Station
• Baltimore Ecosystem Study (BES) and the National Science Foundation
(DEB-0423476)
• University of Vermont Spatial Analysis Lab
Speakers and Workshop Organizers:
• Al Todd, USDA Forest Service, Northeastern Area
• Michael Galvin, Maryland Department of Natural Resources Forest Service
• Morgan Grove, USDA Forest Service, Northern Research Station
• Jarlath O’Neil-Dunne, University of Vermont, Spatial Analysis Lab
• Sally Claggett, USDA Forest Service, Northeastern Area
• Steve Raciti, Cornell University/USDA Forest Service
Workshop Participants:
• Jay Banks, City of Leesburg, VA • Sherri Brokoop, Boston College • Marc Buscaino, USDA Forest Service, National U&CF Program • John Chapman, Assistant Director Public Works, City of Cumberland, • Robert Corletta, City of Arlington, VA • Tracey Coulter, PA Bureau of Forestry, Bay Coordinator • Mary Cox, Parks and people Foundation • Bonnie Deahl, Purcellville, VA Tree Board • Alice Ewen Walker, Executive Director, Alliance for Community Trees, • Terry Galloway, MD DNR Forest Service, Urban Forester

3
• Jennifer Greenfield, New York City Parks • Norm Goulet, Northern VA Regional Commission • Guy Hager, Parks and people Foundation • Anne Hairstan-Strang, Forest Hydrologist, MD DNR Forest Service • Horace Henry, MD DNR Forest Service, Urban Forester • Marian Honeczy, MD DNR Forest Service, Forest Cons. Act • Jeff Horan, Forest Planner, MS DNR Forest Service • Holli Howard, Director, GIS, Casey Trees, Endowment, DC • Mike Knapp, Fairfax County, VA • Jim Lyons, Executive Director, Casey Tree Endowment, DC • Jim McGlone, Urban Forest Conservationist, VA Department of Forestry • Robin Morgan, USDA Forest Service, Assistant Director • Donna Murphy, USDA Forest Service, NA Urban Forestry Center • Colleen Murphy-Dunning, Urban Resources Initiative/Yale University • Gene Odato, PA Bureau of Forestry • Don Outen, Manager, Baltimore County DEPRM • Reggie Parrish, US EPA Chesapeake Bay Program, Urban Workgroup • Doug Petersen, Fairfax County, VA, • Steve Raciti, Cornell University/USDA Forest Service • Paul Revell, VA DOF Urban Forestry program • Phillip Rodbell, USDA Forest Service, NA U&CF Program • Sue Russell, Purcellville, VA Tree Board • Jill Spence, Falls Church, VA • Steve Stewart, Baltimore County DEPRM • John Thomas, Acting Associate Director, DC Urban Forestry Administration • Fiona Watt, New York City Parks • Sarah Weammert, CRC Fellow, Chesapeake Bay Program Office • Barbara White, VA DOF Urban Forestry program • Becky Wilson, MD DNR Forest Service, Urban Forester • Jim Woodworth, Casey Tree Endowment

4
Table of Contents
Chapter 1: Introduction
The Chesapeake Bay Program Partnership 6
Restoring the Chesapeake Bay 6
What is the Urban Forest? Urban Tree Canopy? Urparian? 7
Urban Development and Water Quality 8
The Need for Urban Forestry 11
Urban Forestry and Ecosystem Services 11
The Value of Trees: Getting More than We Pay For 14
Chapter 2: The Chesapeake Bay Program’s Goal Setting Guidelines
Definition of a Community 15
Canopy Assessment Criteria 16
Goal Setting and Institutionalization 16
Outcome-based Goal Setting 16
Implementation Plan 16
Reporting, Evaluation and Monitoring 17
Chapter 3: A Brief Primer on Remotely Sensed Data
What is a Remote Sensor? 18
Data Characteristics and Purchasing Decisions 19
Natural Color Composite versus Color Infrared 21
LIDAR 21
Remotely Sensed Data Providers 22
Data to Use (and Not to Use) 22
Advances in Automated Feature Extraction 23
An Example of Automated Feature Extraction 24
Chapter 4: Urban Tree Canopy Assessment and Goal Setting
How do Communities Set UTC Goals? 25

5
What are the Three Ps? 26
Approaches to Canopy Assessment: Top-down or Bottom-up? 27
GIS Methodology 28
Measuring Existing Tree Cover 28
Measuring the Possible 28
The Forest Opportunity Spectrum: Moving Beyond the Possible 34
(to the Potential and Preferable)
What is the Forest Opportunity Spectrum? 34
Why was FOS Developed? 34
How Can We Use the FOS? 34
FOS Data Hierarchy 34
Types of Forest Opportunities 36
Applications of the FOS to Goal Setting 41
The Priority Planting Index 41
FOS Toolbox: GIS Tools for Strategic Urban Forests Assessment 43
Chapter 5: UTC Goal Setting Examples
Baltimore City
Timeline 46
Results of the Baltimore UTC Assessment 48
Annapolis
Timeline 50
Results of the Annapolis UTC Assessment 50
Helping Communities Set UTC Goals – Summary of Steps 52
Glossary 53
Appendix 59

6
CHAPTER 1: INTRODUCTION
The Chesapeake Bay Program Partnership
The Chesapeake Bay Program (CBP) is a partnership between federal and state agencies,
non-profit organizations, and academic institutions whose aim is to protect and restore
the Chesapeake Bay. The goal of these restoration efforts is to improve water quality,
restore critical habitat, and ensure sustainable populations of fish and shellfish by
balancing environmental protection with the needs of the Bay watershed’s 15 million
residents.
Restoring the Chesapeake Bay
The Chesapeake Bay is North America’s (and possibly the world’s) largest and most
productive estuary. The Bay’s 64,000 square-mile watershed spans portions of six states
and all of the District of Columbia. It is home to more than 3,600 species of plants and
animals. Unfortunately human activities have degraded the Bay’s waters. Nutrient pollution from urban, suburban, and agricultural areas causes harmful algal blooms
which block sunlight from reaching aquatic vegetation and leads to low oxygen
conditions that are toxic to fish, shellfish, and other aquatic life. Sediment from urban
development and agriculture also contribute to pollution. This sediment chokes oyster
beds and further reduces water clarity. Fortunately, there are things we can do to reduce
our impact on the Bay.

7
What is the Urban Forest? Urban Tree Canopy? Urparian? Urban Forests include the trees in our yards, parks, public spaces, and along our streets.
Though we don’t often think of them as forests, they provide many forest benefits, such
as cleaner air and water. In addition to environmental benefits, urban forests increase
property values, reduce home energy costs, block UV radiation, buffer wind and noise,
provide shade and beautify our neighborhoods.
Urban tree canopy (UTC) is defined as the
layer of leaves, branches and stems that
cover the ground when viewed from above.
Urparian describes the vegetated areas
around roads and sidewalks. The term
comes from combining urban and riparian to
form a single word. In less urbanized
systems, the corridor around streams (the
riparian zone) is extremely important for
water quality. This area of vegetation
captures and processes pollutants before they
can make it into surface waters.
In urban areas, however, riparian zones are
often less effective at removing pollutants.
One reason is that urban streams tend to be
deeply incised, causing the riparian zone to
be disconnected from the stream below.
Secondly, the streams in many urban areas
have been functionally replaced with storm
sewers. In this context, the soil and
vegetation around roads and sidewalks is the
new riparian zone. By increasing tree canopy in the urparian zone, we can return some of
the environmental benefits of riparian areas to urban systems.

8
Urban Development and Water Quality
Urban areas cover just 20% of the land area of the Chesapeake Bay Watershed, yet
account for much of the nutrient and sediment pollution to the Bay. When point sources
are included, urban and suburban areas deliver more pollution on a per-area basis than
other major land use types. Forests, on the other hand, cover 58% of the land area yet
only contribute a small fraction of the nutrients entering the Bay. This makes forests the
most beneficial land use for preserving water quality. As urban areas continue to expand,
it is important that we expand urban tree canopy (UTC) in our cities. By slowing and
intercepting rainfall, increasing groundwater infiltration, taking up nutrients, and
transpiring water to the atmosphere, trees can reduce the amount of pollution-carrying
stormwater runoff that enters the Bay.
Figure 1-1. Future Threats to Water Quality: The map (opposite page) shows areas of the Chesapeake Bay watershed that are under high development pressure. As more land in the Bay watershed is converted from forest to urban, water quality will likely decline. Urban Tree Canopy can help mitigate some of the impacts of urbanization.

9
Development Pressure in the Chesapeake Bay Watershed 2000 – 2010
Claggett, P.R., and C. Bisland, 2004. Assessing the Vulnerability of Forests and Farmlands to Development in the Chesapeake Bay Watershed. In Proceedings of the IASTED International Conference on Environmental Modeling and Simulation, November 22-24, St. Thomas, U.S. Virgin Islands.

10
Figure 1-2. Urban areas contribute many times more nitrogen, phosphorus, and sediment to the
Chesapeake Bay than forested areas. These elevated levels of nutrients and sediment contribute to the
environmental problems facing the Bay. (Based on data from the 2004 Chesapeake Bay Model)
Nitrogen Loading to the Bay by Landuse
Forest
Urban
1
2
3
4
5
6
7
an
nu
al
loa
ds
(lb
s/a
cre
)
Phosphorus Loading to the Bay by Landuse
Forest
Urban
0.0
0.1
0.2
0.3
0.4
0.5
0.6
0.7
0.8
an
nu
al
loa
ds
(lb
s/a
cre
)
Sediment Loading to the Bay by Landuse
Forest
Urban
50
70
90
110
130
150
170
190
210
230
250a
nn
ua
l lo
ad
s (
lbs
/ac
re)

11
The Need for Urban Forestry
While we may not think of city trees as a typical forest, these trees provide valued
services to our daily lives. By increasing tree cover in urban areas we can decrease the
volume of pollution-carrying stormwater runoff flowing into the Chesapeake Bay,
while simultaneously reducing air pollution, lowering city temperatures, enhancing
property values, providing wildlife habitat, and adding to the beauty, livability, and
desirability of our communities.
It is important to understand that urban development is increasing rapidly, and as urban
areas grow, so will their contribution to water quality problems in the Chesapeake Bay.
Urban tree canopy (UTC) enhancement can help mitigate some of the harmful effects of
an increasingly developed landscape by providing many of the ecosystem services that
forests would have provided. While a few communities have instituted smart growth
strategies, which help mitigate urban sprawl, fewer still have developed land cover
strategies like UTC to help mitigate the environmental effects of newly urbanized areas.
UTC can play an important part in decreasing our impact on the environment.
Urban Forestry and Ecosystem Services
Urban forests provide numerous ecosystem services that become apparent at different
scales. At the larger watershed scale we look to forests to reduce stormwater runoff,
improve regional air quality, reduce stream channel erosion, reduce summer air and water
temperatures, and provide habitat for terrestrial and aquatic wildlife. At the community
and parcel scale we look to trees to improve public health, decrease home and office
energy usage, provide recreation, buffer wind and noise, provide shade, and increase
community desirability. Figure 1-3 shows the benefits that urban forests provide at the
watershed and parcel scale. Figure 1-4 provides greater detail about the environmental
benefits of urban forests.

12
Figure 1-3. From the Urban Watershed Forestry Manual, Part 1: Methods for Increasing Canopy Cover in
a Watershed. The complete manual is available for download at
http://www.na.fs.fed.us/watershed/publications.shtm

13
Figure 1-4. From the Urban Watershed Forestry Manual, Part 1: Methods for Increasing Canopy Cover in
a Watershed. The complete manual is available for download at http://www.cwp.org/forestry/index.htm

14
The Value of Trees: Getting More than We Pay For
One issue that municipalities may contend with during the goal setting process is the cost
associated with planting and maintaining a healthy urban tree canopy. Fortunately,
research has shown that trees can be a positive economic investment. Below are the
results of street tree analyses done in cities around the country using the STRATUM
(Street Tree Resource Analysis Tool for Urban Forest Managers) tools developed by the
US Forest Service Center for Urban Forest Research. These figures show the annual
economic benefits achieved for each dollar spent on city street trees. Measured benefits
include lower costs for stormwater treatment, energy savings for heating and cooling,
carbon sequestration, air quality improvement and increased property values. The
calculated costs of street trees include pruning, tree and stump removal, pest and disease
control, irrigation, repair of infrastructure damage, litter cleanup, litigation and
settlements for tree-related claims and program administration. The lowest benefit-to-
cost ratio to date was in Berkeley, CA with $1.37 returned for each dollar spent. Other
locations, such as Charlotte, NC, showed more than a $3.00 return in value for each
dollar spent on street trees. In addition to these measurable benefits, trees provide
numerous social, community, health and aesthetic benefits that are difficult to measure in
dollars and cents.
Location Benefit-to-Cost Ratio
(return on each dollar invested)
**Charlotte, NC $3.25
*Bismark, ND $3.09
*Glendale, AZ $2.41
*Fort Collins, CO $2.18
*Cheyenne, WY $2.09
**Modesto, CA $1.85
**Santa Monica, CA $1.52
*Berkeley, CA $1.37
* McPherson, E.G.; Simpson, J.R.; Peper, P.J.; Maco, S.E.; Xiao, Q. 2005. Municipal forest benefits and costs in five U.S. cities. Journal of Forestry. 103(8): 411-416.
** Center for Urban Forest Research Newsletter, Fall 2005/Winter 2006; http://www.fs.fed.us/psw/programs/cufr/products/newsletters/UF632Fall2005Winter2006.pdf
Figure 1-5. Benefit-to-cost ratios for the planting and maintenance of street trees in eight US cities.

15
CHAPTER 2: THE CHESAPEAKE BAY PROGRAM’S URBAN AND COMMUNITY
TREE CANOPY GOALS
In October of 1994, the Chesapeake Executive Council formally recognized the value of
Urban Tree Canopy (UTC) for water quality:
WE FURTHER RECOGNIZE THAT URBAN TREE CANOPY
COVER offers stormwater control and water quality benefits for
municipalities in the Chesapeake Bay watershed and can extend
many riparian forest buffer functions to urban settings.
(Directive #94-1)
In 2003, the Council signed an expanded directive that called for more specific actions to
increase the benefits of urban tree canopy cover in the Bay watershed:
• By 2010, work with at least 5 local jurisdictions and
communities in each state to complete an assessment of urban
forests, adopt a local goal to increase urban tree canopy cover
and encourage measures to attain the established goals in order
to enhance and extend forest buffer functions in urban areas.
• Encourage increases in the amount of tree canopy in all urban
and suburban areas by promoting the adoption of tree canopy
goals as a tool for communities in watershed planning.
This represents a new approach to urban forestry. It asks communities to adopt specific
goals for tree canopy cover to inspire policies and activities that will move communities
toward those goals.
Definition of a Community
The unit of measure for setting a UTC goal is a community. The Executive Council has
allowed for a broad definition of community to encourage goal setting among a wide
range of entities. These entities may include counties, cities, towns, boroughs, school
districts, military facilities, conservation groups, land trusts and others. The key
requirement is that the community has an infrastructure that can support the goal setting
and implementation process. If the community intends to receive grants to support the
UTC goal, then they must also be a legal entity that can enter into contracts.
16
Canopy Assessment Criteria
Communities counting towards the five-per-state goal of the Executive Council will have
to follow some basic guidelines for assessing existing tree cover. The types of
information required for the assessment are: percent of land with tree canopy, percent of
each land cover type, and percent impervious cover. This assessment must be done using
up-to-date (less than 5 years old) remote sensing data with one-meter or better resolution.
The area of the assessment should be clearly defined from the outset. Lastly, the
assessment should be updated at regular intervals (every 5 to 10 years) so communities
can evaluate progress towards their goal.
Goal Setting and Institutionalization
Communities must adopt a goal to increase tree canopy cover and a timeframe for
achieving this goal. This goal must be endorsed by local officials or other authorities.
However, it is important to realize that endorsement is not enough to ensure a successful
program. To ensure that tree canopy goals survive transitions in leadership, these goals
must be institutionalized in other processes. These processes include legislation,
regulation, and modification of a community’s comprehensive plan.
It is also important to realize that for communities where most of the land is in private
ownership (e.g. towns and cities), this is unlikely to be a government-only process. In
these cases, increasing tree canopy cover on public lands alone will not be enough to
achieve UTC goals. Support from the public, non-governmental organizations (NGOs),
the business community, and agencies involved with issues on private lands will be vital
to ensuring the success of the program.
Outcome-based Goal Setting Urban tree canopy goals are most meaningful when tied to specific desired outcomes.
These outcomes may be environmental, social, or economic. Examples of environmental
outcomes include the protection of streams, reduced stormwater runoff, reduced ozone
concentrations, and increased carbon sequestration. Social outcomes may include
improved human health, buffers for wind and noise, increased recreational opportunities,
and neighborhood beautification. Economic outcomes can include reduced heating and
cooling costs and increased property values.
Implementation Plan
Communities adopting a tree canopy goal should submit a one-time implementation plan
to their States (or to the District of Columbia) that includes:
• The percent increase in canopy cover and specified time intervals for
attainment;

17
• The relationship of the canopy goal to other local goals, ordinances or
regulations;
• Identification of priority sites for implementation (e.g., tree planting) and
rationale for selection;
• Any resolutions, motions or minutes from governing bodies or boards
endorsing the participation in the program, the goals set by the community and
plans for implementation.
• Listing of outreach, educational, and funding opportunities (optional).
Reporting, Evaluation and Monitoring
The States and the District of Columbia should report annually on UTC goal setting and
implementation in their model communities. The report should identify canopy
assessments that have been completed, canopy goals that have been established, and
implementation plans that have been approved. The report should also include an annual
evaluation of community progress. This evaluation should include information such as
the number of trees planted, canopy area lost, forest acres protected by easements, or
other measurable indicators.
Please see the document Guidelines for Implementing the Chesapeake Bay Program’s Urban and Community Tree Canopy Goals for further information. This document can be found at
www.chesapeakebay.net/pubs/Guidelines_for_Urban_Tree_Canopy_Goals_11_2004.pdf
18
CHAPTER 3: A BRIEF PRIMER ON REMOTELY SENSED DATA
Before delving into top-down assessment methods, we would like to bring readers up to
speed on the basic principles of remote sensing and the types of remote sensing data that
can be used for urban tree canopy assessment. Users with a strong background in remote
sensing may want to skip ahead.
What is a remote sensor?
We all have some familiarity with remote sensors – for instance, our eyes are a type of
remote sensor. They capture the light that bounces off objects, which is then processed
by our brain to form an image. Most aerial and satellite based sensors work in a similar
fashion.
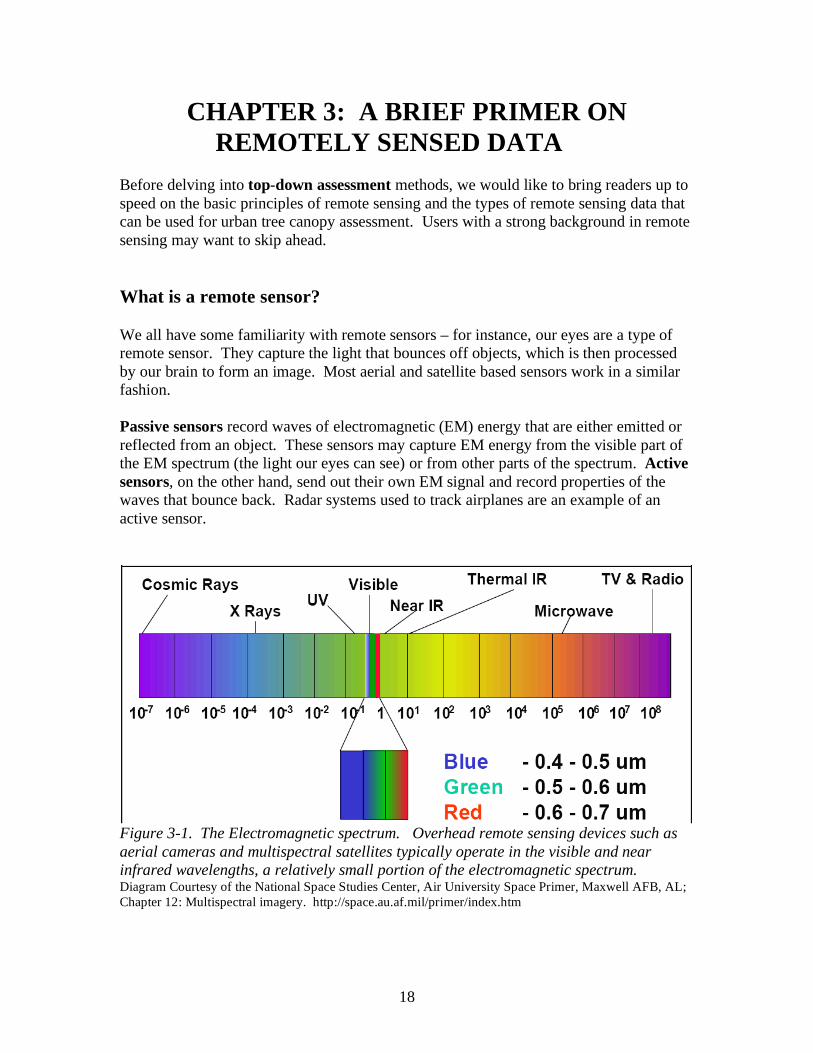
Passive sensors record waves of electromagnetic (EM) energy that are either emitted or
reflected from an object. These sensors may capture EM energy from the visible part of
the EM spectrum (the light our eyes can see) or from other parts of the spectrum. Active sensors, on the other hand, send out their own EM signal and record properties of the
waves that bounce back. Radar systems used to track airplanes are an example of an
active sensor.
Figure 3-1. The Electromagnetic spectrum. Overhead remote sensing devices such as aerial cameras and multispectral satellites typically operate in the visible and near infrared wavelengths, a relatively small portion of the electromagnetic spectrum. Diagram Courtesy of the National Space Studies Center, Air University Space Primer, Maxwell AFB, AL;
Chapter 12: Multispectral imagery. http://space.au.af.mil/primer/index.htm

19
Data Characteristics and Purchasing Decisions
It is crucial that when purchasing remotely sensed imagery the characteristics of the
product deliverable are fully understood. Too often there is an over emphasis on the
spatial resolution of the imagery, when this is only one of many factors that most be
considered.
Spatial Resolution is the “pixel size” associated with the data. For reference, it
generally takes at least 4 pixels to identify a feature. So, while Landsat imagery,
with its 30 square-meter resolution, may be adequate for measuring large areas of
intact forest it will do a poor job of identifying street trees in urban areas. This is
why the Chesapeake Bay Guidelines suggest a minimum resolution of one-meter
or better. As spatial resolution increases so does the storage size of the data.
Radiometric Resolution is the number of brightness levels that the remote
sensing technology can sense. The higher the radiometric resolution, the better
the sensor will be able to distinguish objects with similar spectral properties.
Most remote sensors, such as Landsat, yield 8-bit data (28) where each pixel has a
possible value of 0-255. Newer sensors are capable of collecting data at a much
higher resolution. For example, the IKONOS and QuickBird satellites gather 11-
bit (211
) data, allowing for improved feature recognition when compared to
traditional 8-bit data. Compressing imagery results in a degradation of the
radiometric quality. Automated feature extraction algorithms are particularly
sensitive to the radiometric quality of the data. As radiometric resolution
increases so does the size of the dataset.
Temporal Resolution represents the time frequency for the data. This
component of data quality recognizes that it is not just the image quality that
matters, but also when the information was acquired. The Chesapeake Bay
Program Guidelines recommend that the data used in UTC assessment be less
than five years old. In some communities, where rapid change or development is
taking place, a much higher temporal resolution may be required (i.e. data that is
less than one year old) to accurately reflect the extent of current tree canopy. The
age of the data is not the only important temporal requirement that we must
consider for tree canopy assessment. The time of year the data was collected will
be equally important. For instance, remote imagery acquired in the winter would
not be very useful for quantifying tree canopy cover in a system dominated by
deciduous trees.
Spectral Coverage is another consideration for data acquisition. Certain features
and properties of land cover may be more distinguishable in different bands of the
electromagnetic spectrum. For instance, the inclusion of a NIR (near infrared)
band is optimal for classifying vegetation data as the majority of EM energy
reflected by vegetation is in the NIR portion of the spectrum. Data that spans
several parts of the EM spectrum is referred to as multispectral data.

20
Other considerations
UTC assessment requires the integration of multiple data sources. This necessitates that
any remotely sensed data being used in the UTC assessment have a high enough
horizontal accuracy so that it overlays as precisely as possible with the other layers being
used. Typically this requires that the remotely sensed data meet National Map Accuracy
Standards of 1:12,000 or better.
When a community signs a contract to acquire remotely sensed data they agree to accept
a certain percentage of cloud cover, haze, and other data irregularities. A small amount
of cloud cover may be acceptable, but a large amount of cloud cover would make much
of the data unusable. Similarly, shadows from tall buildings may interfere with UTC
assessment, causing tree canopy to be underestimated. For these reasons, it is very
important to read the fine print before purchasing imagery.
Lastly, communities should realize that remote sensing data can have many potential
users and numerous applications. This opens up the possibility of cost-sharing
partnerships with other agencies or neighboring communities. In some cases, the
coverage area can be expanded at only a small extra cost. This allows neighboring
communities to purchase data together at a lower cost than if they had purchased the
same data separately. Communities should also consider their future data needs. They
may, for instance, choose to acquire multispectral data instead of black-and-white or
natural color data, so the data might be used for natural resource analyses outside the
context of urban tree canopy.

21
[SIDE BAR] Natural Color Composite versus Color Infrared (CIR)
Figure 3-2. While natural color imagery is something that we are used to and generally
comfortable working with, multispectral imagery, such as color infrared CIR, hold
several advantages for users evaluating natural resources. With CIR imagery we can
distinguish between tree types (broadleaf versus conifer), evaluate vegetation stress, and
better identify surface feature types (asphalt versus concrete, forests versus forested
wetlands, etc). The example above shows true color (left) and color infrared (right)
versions of an IKONOS satellite image (© Space Imagine, 2004). The color infrared
version allows for improved detection and discrimination of the vegetation, particularly
in the forested areas where the lighter deciduous species can be distinguished from the
darker coniferous species.
LIDAR
LIDAR (LIght Detection And Ranging) sensors are active sensors that collect extremely
detailed elevation data by way of a laser. By emitting pulses from the laser, then sensing
the time it takes for the pulse to return, the height of objects on the ground can be
inferred. Processed LIDAR typically yields data for both the reflective surface and bare
earth. Processing typically removes man made structures from the bare earth data. By
subtracting the bare earth from the reflective surface a relative surface digital elevation
model (DEM) can be created. A relative surface DEM generated from LIDAR data can
greatly complement imagery when performing a UTC assessment as it allows for features
that have similar spectral and textural properties, to be differentiated based on height.
LIDAR can be particularly useful in separating trees from shrubs and buildings from
parking lots.

22
Remotely Sensed Data Providers While the availability of remote sensing data changes rapidly over time, these are a few
of the current data sources that meet UTC assessment guidelines:
Company Products Web Site GeoEye High-resolution satellite
imagery from the IKONOS
and OrbView satellites
www.geoeye.com
DigitalGlobe High-resolution satellite
imagery from the Quickbird
and WorldView (not yet
operational) satellites
www.digitalglobe.com
EarthData High-resolution digital
aerial imagery and LIDAR
www.earthdata.com
Triathlon High-resolution digital
aerial imagery and LIDAR
www.triathloninc.com
Optimal Geomatics High-resolution digital
aerial imagery and LIDAR
www.optimalgeo.com
Data to Use
Data Type Level Format Use Specifications Source
Building
Footprints
Helps to better define possible UTC by excluding areas occupied by an existing structure
High-resolution planimetric data. Local
Hydrology
Trees cannot be planted here, so these areas must be removed from the analysis when assessing potential planting locations
Open water (lakes, wide streams, coastal features)
Local or National Hydrography Dataset
(NHD)
Imagery Needed to derive land cover data.1m or better spatial resolution, multispectral with near infrared band, digital acquisition
Local
Land CoverDerived from imagery to map existing conditions.
High-resolution; attributes must include grass, canopy, and impervious
Local
ParcelsRequired for computing possible UTC in parcel land versus the public rights of way.
High-resolution; attributes must include land use and PROW
Local
RoadsWhen combined with parcel data, can be used to define the urparian zone
Road polygons that depict the left and right boundaries. In combination with parcel data can be used to delineate the urparian zone.
Local
Target
Geographies
Polygons for performing additional statistical summaries
Wards, neighborhoods, boroughs, critical areas, census block groups, etc.
Local, regional, or national databases
Readily accessible exists for the entire country
Localized data, exists for most major cities
Highly specialized data, limited availability
Vector polygon data
Vector line data
Raster data

23
Data Not to Use Data Type Level Format Reason Not to Use Source
Low Resolution
Imagery
Because of the spatial heterogeneity found in urban systems (patchiness), high resolution data is needed to accurately measure tree canopy cover. A UTC project runs the risk of losing credibility if a projected canopy goal falls within the margin of error for measurement. For this reason, the Chesapeake Bay Program set the minimum standard at 1 meter resolution or better.
Landsat, AVHRR, MODIS, etc.
National Land
Cover DataSee above. NLCD
Outdated data
Measurements of progress will lose credibility if the initial tree canopy assessment is based upon outdated, inaccurate data. The Chesapeake Bay Guidelines suggest using data that is less than 5 years old.
Various
Data not
properly
aligned
The crux of the geoprocessing for a UTC assessment involves overlay analysis. Typically this requires that the remotely sensed data meet National Map Accuracy Standards of 1:12,000 or better. Datasets that do not line up due to differences in horizontal accuracy and/or spatial resolution will result in incomplete or inaccurate conclusions.
Various
It is important to realize that data by itself does not equal information. While acquiring
the data outlined above is an essential first step, a lot of processing is required to turn that
data into information that can support decision-making. It requires time, expertise,
computers and software to make it all work. While some communities have the
necessary expertise on-hand, other communities may need to seek out partnerships with
local and state universities, agencies, or consulting firms to assist with UTC analysis.
Advances in automated feature extraction
As humans we are very adept at interpreting high resolution imagery because we can
incorporate the spectral, spatial, and contextual properties of the image into the
classification process. While manual interpretation is the most accurate method of
extracting features from imagery it is also extremely time consuming. In addition,
manual interpretation allows for little flexibility since all protocols and classification
rules have to be set at the outset.
Fortunately, advances in object-oriented classification systems have made automated feature extraction a much more viable solution. Object-oriented classifiers segment a
Readily accessible exists for the entire country
Localized data, exists for most major cities
Highly specialized data, limited availability
Vector polygon data
Vector line data
Raster data

24
remotely sensed image into objects based on the spatial and spectral properties of the
image. Objects contain substantially more information (such as texture and shape) than
individual pixels. Objects can also have relationships with adjacent objects, thereby
bringing some context into the classification process. Finally, object oriented classifiers
allow multiple data types to be used in classifying an object. Taken together, these
abilities make object-oriented classification a powerful method of interpreting remotely
sensed data.
An example of automated feature extraction
Figure 3-3. In this example, LIDAR and parcel data are integrated into a single
classification. The classification depicts buildings (red), roads (tan), other paved surfaces
(blue), grass (light green), and tree canopy (dark green). The fine scale classification
influences the parcel scale classification by evaluating which parcels are most suitable for
tree planting efforts. Because the classification is based on rules, different scenarios can
be examined by changing the rules.
ObjectObject -- Oriented Clas sificationOriented Clas sification
Classification Rules
Parcels
LIDAR
Imagery
New map with features classified as roads, buildings, grass, trees, and paved (non-road) surfaces

25
CHAPTER 4: URBAN TREE CANOPY ASSESSMENT & GOAL SETTING
This chapter takes a more detailed look at the canopy assessment process. It will look at
the three Ps of natural resource management (Possible, Potential, and Preferable), GIS
methodology, the Forest Opportunity Spectrum (FOS), and application of the FOS to goal
setting. Taken together, these tools provide the theoretical and practical framework for
planning and implementing a successful urban tree canopy program. It should be noted
that while the following approach has been used successfully, it should not be considered
the only approach. Depending on the size of the community and the resources available,
other approaches may be more appropriate. The key is making sure that the community
can answer three basic questions:
• How much tree canopy do we have?
• How much is possible?
• How much do we want to achieve?
1) Assess present condition - How much UTC do I have?
• Use remote sensing to measure existing urban tree canopy
• Identify forestry opportunity types (FOS types) in the community, including:
� Public opportunities - street trees, parks, etc.
� Private opportunities - residential, commercial, and industrial areas
2) Assess potential UTC - How much UTC can I get?
• Assessment of potential UTC by FOS type.
• Assessment of possible, potential, and preferable UTC by FOS type. 3) Adoption of a Goal based on the findings of the assessments
• It is preferable for a community to institutionalize UTC goals in legislation, regulation, or the community’s comprehensive plan to ensure that these long term goals come to fruition.
4) Development of an Implementation Plan
• Requirements for new tree planting, protection and maintenance of existing trees, and predicted canopy loss from tree mortality and land conversion
• Relationship of canopy goals to local ordinances, regulations, and the community’s comprehensive plan
• Strategies for including a range of stakeholders in the implementation process.
HOW DO COMMUNITIES SET UTC GOALS?

26
What are the Three Ps?
“In order for us to be together, we must find some space between us”
(Mark Twain in a letter to his wife)
When moving from a canopy assessment to an implementation plan, it is useful to
separate the process into a sequence of steps. This allows the task to be broken into
manageable components and prevents each step from being bogged-down by details that
belong in later stages of the process. The Three Ps, Possible, Potential, and Preferable,
provide a useful sequence for structuring the goal setting and implementation process.
The three Ps are defined as follows:
1. Possible: Where is it biophysically feasible to plant trees?
• This is the first step in the assessment process. It is not concerned with
costs or the fact that tree planting may not be appropriate or desirable in
some locations.
• For the Baltimore UTC assessment, all land that was not covered by water,
a road, or a building was considered a “possible” planting location.
2. Potential: Where is it economically likely to plant trees?
• Which areas have regulatory constraints that conserve tree cover or have
incentive supports for adding tree cover? (example: Riparian buffer
ordinances near streams or tax incentives for conservation easements)
• Which areas are most cost-effective for achieving water quality or other
goals?
3. Preferable: Where is it socially desirable to plant trees?
For example,
• Where will tree cover make neighborhoods more attractive?
• Where will tree cover address other issues such as cooling and cleaning
the air?
In this report, we focus mainly on the first step of developing a UTC goal, “What is
Possible?” Once the Possible is known, communities will have to work with various
stakeholders to identify Potential and Preferable planting locations.

27
Approaches to Canopy Assessment: Top-down or Bottom-up?
There are two primary types of canopy assessment: top-down and bottom-up. Bottom-up approaches use a plot-based, field sampling scheme to measure tree canopy cover. In
this approach, the amount of tree canopy cover that falls within study plots is
extrapolated and taken to represent the urban tree canopy cover as a whole. This on-the-
ground method may be most appropriate for very small communities, such as a
homeowner’s association or a school district’s properties. Plot data can be collected
using the US Forest Service’s i-Tree tools and methods at www.itreetools.org.
Top-down approaches use remote sensing data, such as satellite imagery, to quantify the
extent of tree cover. For
most communities, a top
down approach is
recommended. This guide
will focus on a top-down
approach for several reasons.
First, the Chesapeake Bay
Program guidelines are based
on tree cover and extent
which are readily assessed
using top-down
methodologies. Second,
percent cover is easy to
conceptualize and
communicate. Third, remote
sensing makes it easy to
track progress over time.
Lastly, these methods are
well documented and have
been used successfully here
and elsewhere.
Figure 4-1. Top-Down Approach: Existing UTC mapped from IKONOS satellite imagery.

28
GIS Methodology
In the following sections we will detail the GIS methodology that was used in the
Baltimore urban tree canopy assessment. This is not the only possible approach to UTC
assessment, but it does provide a useful framework for other communities to follow.
These techniques should be adapted to fit the unique resources, data availability, and
desired goals of each community.
Measuring Existing Tree Cover
Existing UTC can be measured from remotely sensed data by manual interpretation,
pixel-based classification, or object-oriented classification. Each method has its pros and
cons. The land cover data used in the Baltimore UTC assessment came from the MD
DNR Strategic Urban Forests Assessment (SUFA) land cover layer that was created
from high-resolution leaf-on IKONOS satellite imagery in 2001 (Irani and Galvin 2003).
IKONOS imagery of two different types was purchased: (1) 1 m panchromatic (black and
white) imagery and (2) 4 m multispectral (visible + NIR) imagery. These two images
were combined, through a process known as pan-sharpening, to create a 1 m resolution
image that retained the spatial qualities of the 1m panchromatic while incorporating the
spectral properties of 4 m imagery.
To separate vegetation from non-vegetation features a NIR/Red ratio image was created
by dividing the NIR band by the red band. Vegetation reflects high amounts of NIR
energy and low amounts of red light, causing pixels containing vegetation to have
relatively high NIR/Red ratio values compared to other features (impervious and water).
Following this, a texture image of the resulting ratio image was produced to separate
UTC vegetation from non-UTC vegetation pixels (separate trees from other vegetation).
Shadowing in tree canopy results in pixels containing tree canopy having higher texture
values compared to those containing grass and herbaceous vegetation. The resulting
image provides for quantification of existing UTC and non-UTC vegetation.
Measuring the Possible
The first step in computing possible UTC for Baltimore was to determine what UTC
metrics would be computed. These metrics were based on both the desirability of the
information and the feasibility of obtaining the metric based on the available geospatial
data. It was decided that the Baltimore UTC analysis would focus on measuring the
possible UTC, that is, the land that is available for canopy, but that is not currently
canopy. For parcel land, possible UTC was defined as land not occupied by existing
canopy, buildings, or water. For the PROW (Public Right Of Way), possible UTC was
defined as land not occupied by existing canopy or roads (buildings and water were not
present in the PROW). The parcel was selected as the base unit of analysis for
summarizing information, with census block groups as the geographical boundaries for
aggregating the parcel level data for additional analysis.

29
It is important to remember that we are restricting this part of our analysis to the Possible.
We acknowledge that places like baseball diamonds, while considered Possible planting
locations, may not be Preferable. By restricting ourselves to the Possible, we prevent
ourselves from getting bogged down by decision-making that should be done later in the
goal-setting process. At the end of the day, it is up to the community to decide where,
amongst the Possible planting locations, increased tree canopy cover will be desirable.
The relevant geospatial data was assembled in a GIS: building footprints (polygons),
property parcels - including PROW (polygons), surface water (polygons), streets
(polygons), land cover (raster) and census block groups (polygon). Building footprints,
property parcels, and street polygons were obtained from the City of Baltimore. Surface
water polygons were extracted from the National Hydrography Dataset (NHD) and edited
using the 2001 IKONOS satellite imagery. Land cover data came from the MD DNR
SUFA dataset. Census block group boundaries, produced by the Tele Atlas Corporation,
were available on the data media that ships with ArcGIS.
Figure 4-2. Five key data inputs were identified for Baltimore UTC assessment: building
footprints (polygons), property parcels (polygons), surface water (polygons), streets (polygons)
and land cover (raster)
Parcels
Buildings
Canopy
Data Input sData Input s
Water Streets

30
Possible UTC metrics were computed through geoprocessing overlays and database
queries. The methods for computing possible UTC are consolidated in the Possible UTC
model in the FOS toolbox, however they are explained here so that the process can be
replicated if one chooses not to use the model. The principal challenge in computing
possible UTC is the numerous polygons that are created by overlaying the various input
datasets. The limitation of current GIS software packages to deal with extremely large
datasets my necessitate tiling the data by smaller geographical boundaries during the
overlay process.
With the datasets coming from differing sources numerous hours were spent editing the
datasets to ensure that all inputs adhered to a common geographical boundary. For
Baltimore City the base unit of analysis was the parcel data, and thus all data were
clipped or adjusted to adhere to the parcel data. Unfortunately it was not feasible to
correct all alignment errors that existed between the datasets. For example, building
footprints occasionally overlapped parcel boundaries and grass and low lying shrubs were
sometimes misclassified as canopy. Tests for topological and geometry errors were run
for each layer, and any errors were corrected.
Prior to carrying out the overlays each layer had a field added to binary code the layer
according to its source. For example, the roads layer had a Roads field added to it, where
each road was coded as ‘1.’ Having each layer with a binary coded field facilitated
running the queries used to compute the metrics later in the analysis. With all layers
adhering to the parcel boundaries the overlay process involved a step wise application of
the IDENTITY tool. In ArcGIS the IDENTITY tool overlays two layers, creating new
polygons at the intersection, while retaining all polygons from the input layer along with
the attributes from both layers. The result of the step wise application of this tool was a
single layer, called UTC Overlay, containing the polygons and attributes of the parcels,
buildings, roads, water, and land cover layers.
Using the attributes of the UTC Overlay layer, queries were run to compute the UTC
metrics. Land area, existing UTC, and possible UTC were summarized at the city level,
by parcel and urparian, and within the parcel by land use type (Figure 4-3).

31
Figure 4-3. UTC metrics for Baltimore City. A summary of the existing UTC and possible UTC at the city
level. UTC metrics are presented for the urparian and parcel areas, and within parcels by land use. Such
metrics can be generated at various geographies (city, census block, neighborhood, etc.).
Existing UTC
Land Type Acres
Percent of Total
Area
City 10323 20%
Urparian 1192 2% Parcel 9122 18% Parcel Breakout by Land Use Code Unknown 130 0% Commercial 729 1% Commercial Condo 0 0% Commercial Residential 0 0% Exempt 512 1% Exempt Commercial 3187 6% Industrial 551 1% Apartments 382 1% Residential 3628 7% Residential Commercial 0 0%
Residential Condo 4 0%
Possible UTC
Land Type Acres
Percent of Total
Area
City 27605 53%
Urparian 3936 8% Parcel 23897 46% Parcel Breakout by Land Use Code Unknown 344 1% Commercial 3587 7% Commercial Condo 2 0% Commercial Residential 0 0% Exempt 453 1% Exempt Commercial 7203 14% Industrial 4301 8% Apartments 1048 2% Residential 6950 13% Residential Commercial 0 0%
Residential Condo 9 0%
32
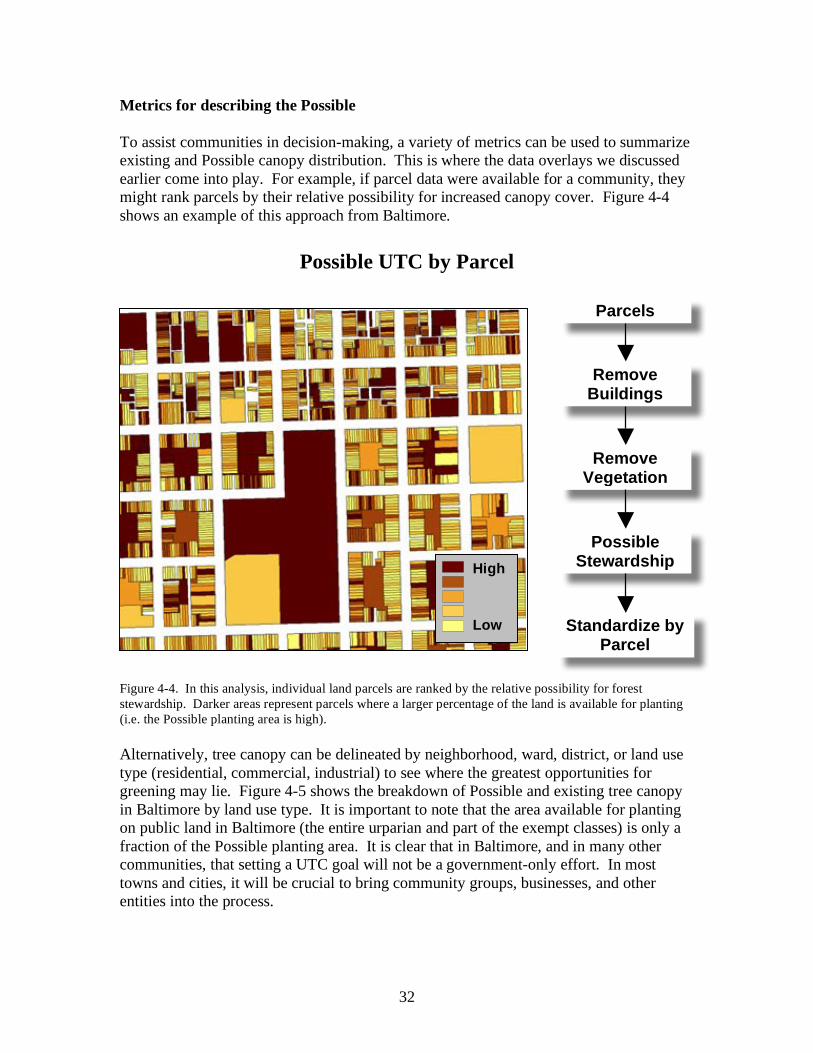
Metrics for describing the Possible To assist communities in decision-making, a variety of metrics can be used to summarize
existing and Possible canopy distribution. This is where the data overlays we discussed
earlier come into play. For example, if parcel data were available for a community, they
might rank parcels by their relative possibility for increased canopy cover. Figure 4-4
shows an example of this approach from Baltimore.
Possible UTC by Parcel
Figure 4-4. In this analysis, individual land parcels are ranked by the relative possibility for forest
stewardship. Darker areas represent parcels where a larger percentage of the land is available for planting
(i.e. the Possible planting area is high).
Alternatively, tree canopy can be delineated by neighborhood, ward, district, or land use
type (residential, commercial, industrial) to see where the greatest opportunities for
greening may lie. Figure 4-5 shows the breakdown of Possible and existing tree canopy
in Baltimore by land use type. It is important to note that the area available for planting
on public land in Baltimore (the entire urparian and part of the exempt classes) is only a
fraction of the Possible planting area. It is clear that in Baltimore, and in many other
communities, that setting a UTC goal will not be a government-only effort. In most
towns and cities, it will be crucial to bring community groups, businesses, and other
entities into the process.
Parcels
Remove Buildings
Remove Vegetation
Possible Stewardship
Standardize by Parcel
High
Low

33
“We will organize an inter-departmental cabinet and a citizen's panel to help write our Urban Forestry Management Plan. But Government can not reach this goal alone. If every household and every business in Baltimore planted a tree in their yard, we might just be there in 30 years.” - Otis Rolley III, Director, Baltimore City Dept of Planning, March 28,
2006
Figure 4-5. This chart shows existing and possible forest cover in Baltimore by land use type. Analyses
like this can help communities in targeting areas for tree planting.
Exi stin g an d Pos si bleExi stin g an d Pos si ble Tre e C an o p y Tre e C an o p y b y L a n d U seb y L a n d U se f or B altif or B alti m or e Ci tym or e Ci ty
0
2,000
4,000
6,000
8,000
10,000
12,000
Re
sid
en
tial
Exe
mp
tC
om
me
rcia
l
Urp
aria
n
Ind
ust
ria
l
Co
mm
erc
ial
Apa
rtm
ents
Exe
mp
t
Unk
now
n
Re
sid
en
tial
Con
do
Re
sid
en
tial
Co
mm
erc
ial
Co
mm
erc
ial
Re
sid
en
tial
Co
mm
erc
ial
Con
do
Possible
Existing
Ac
res

34
The Forest Opportunity Spectrum: Moving Beyond the Possible (to the Potential and the Preferable)
What is the Forest Opportunity Spectrum?
The Forest Opportunity Spectrum provides a framework for organizing data, as well as
for asking and answering urban forestry related questions. This framework may assist
decision-makers as they decide what their tree canopy goal will be and what actions they
can take to achieve that goal. In other words, the FOS framework and data types can help
communities move beyond the Possible and into the realm of the Potential (economically
likely) and the Preferable (socially desirable).
Why was the Forest Opportunity Spectrum developed?
The Forest Opportunity Spectrum was developed to deal with the challenges of forest
management in the urban environment. Urban forestry includes all of the trees in the
community, not just the fraction that exists in parks and public rights of way. Dealing
with this spatially heterogeneous landscape requires a foundation of biophysical and
social data that can inform policymaking, planning, and management. The FOS provides
the data to support these activities.
How can we use the Forest Opportunity Spectrum?
We can use the FOS to:
• Inventory existing forestry opportunities.
• Analyze opportunities to enhance ecosystem services such as air or water quality.
• Link stakeholders’ desires with urban forestry opportunities.
• Identify and assess the effects of different forest opportunities on other
community initiatives.
• Develop inter-organizational partnerships within and among public, NGO, and
private interests.
• Monitor and evaluate urban forestry outcomes.
• Enhance the FOS approach with new capabilities as needs are identified.
• Modify FOS using an Open Source approach to reduce costs, increase the rate at
which tools are developed, and the diversity of those tools.
FOS Data Hierarchy
FOS classifies data needs in terms of “green circles, blue squares, and black diamonds”
using the metaphor from skiing trails to denote difficulty in creating, obtaining, and
processing data. Coding data with these symbols helps to better match the questions we
are asking and the level of data needed to answer them.
35
Green Circle data are easy to work with, readily available, and have already been
collected for other purposes. For the Possible stage of analysis, these data include
topography, streams, roads, land use types, parks, public rights-of-way, and vegetation
cover based on 30 meter satellite data.
The next difficulty level, Blue Square data, has also been acquired for other uses or can
be acquired relatively easily. These data are usually more detailed than Green Square
data and consequently, more difficult to work with. Blue Square data include high
resolution vegetation cover (1m), impervious surface data (from LIDAR), parcel
boundaries, and land use codes by parcel.
Black Diamond data are often local data that must be collected specifically for the
purpose at hand. Because we must collect these data ourselves, it is usually the most
costly data to obtain. An example of black diamond data would be up-to-date
information regarding the health and condition of community trees and vegetation.
The type of data needed for a UTC assessment will depend largely on the questions being
asked. Many questions can be answered in a meaningful way using only Green Circle
and Blue Square data. Other questions may require Black Diamond data. In cases where
we must collect the data ourselves, we must decide whether the information being
collected is worth the time and cost required to collect it. We might also seek creative
ways to answer the question at hand using existing data sources.
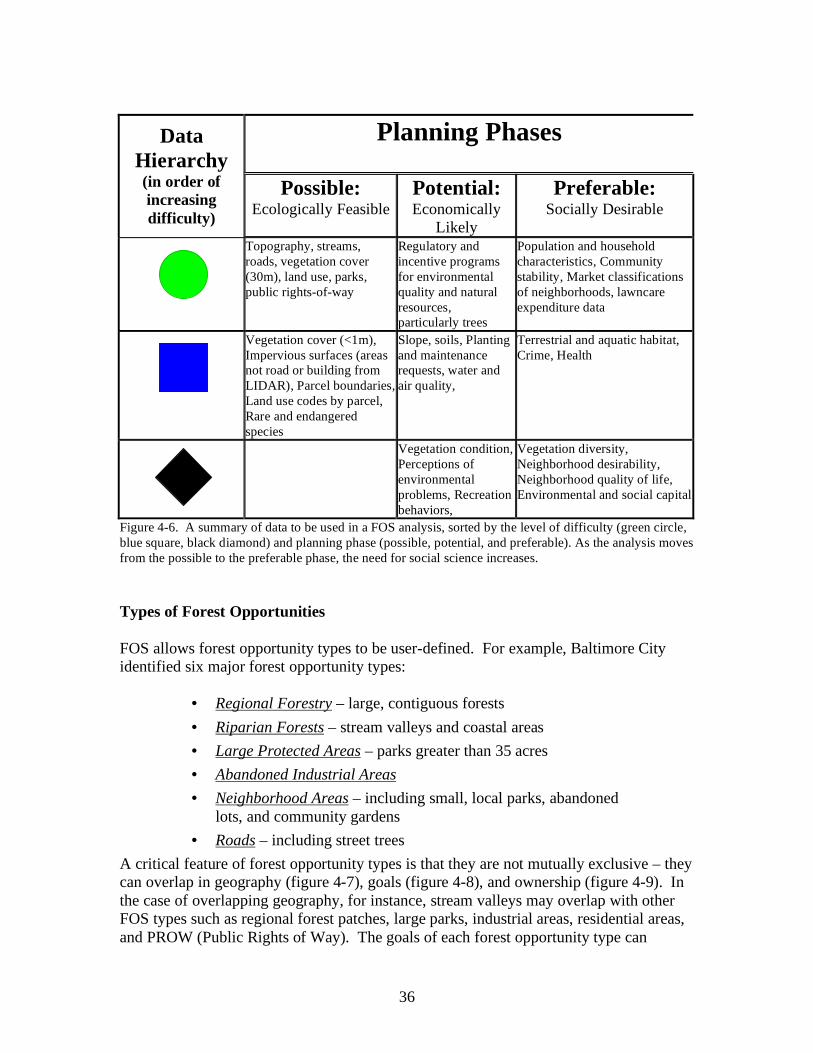
36
Planning Phases Data Hierarchy (in order of increasing difficulty)
Possible: Ecologically Feasible
Potential: Economically
Likely
Preferable: Socially Desirable
Topography, streams,
roads, vegetation cover
(30m), land use, parks,
public rights-of-way
Regulatory and
incentive programs
for environmental
quality and natural
resources,
particularly trees
Population and household
characteristics, Community
stability, Market classifications
of neighborhoods, lawncare
expenditure data
Vegetation cover (<1m),
Impervious surfaces (areas
not road or building from
LIDAR), Parcel boundaries,
Land use codes by parcel,
Rare and endangered
species
Slope, soils, Planting
and maintenance
requests, water and
air quality,
Terrestrial and aquatic habitat,
Crime, Health
Vegetation condition,
Perceptions of
environmental
problems, Recreation
behaviors,
Vegetation diversity,
Neighborhood desirability,
Neighborhood quality of life,
Environmental and social capital
Figure 4-6. A summary of data to be used in a FOS analysis, sorted by the level of difficulty (green circle,
blue square, black diamond) and planning phase (possible, potential, and preferable). As the analysis moves
from the possible to the preferable phase, the need for social science increases.
Types of Forest Opportunities FOS allows forest opportunity types to be user-defined. For example, Baltimore City
identified six major forest opportunity types:
• Regional Forestry – large, contiguous forests
• Riparian Forests – stream valleys and coastal areas
• Large Protected Areas – parks greater than 35 acres
• Abandoned Industrial Areas
• Neighborhood Areas – including small, local parks, abandoned
lots, and community gardens
• Roads – including street trees
A critical feature of forest opportunity types is that they are not mutually exclusive – they
can overlap in geography (figure 4-7), goals (figure 4-8), and ownership (figure 4-9). In
the case of overlapping geography, for instance, stream valleys may overlap with other
FOS types such as regional forest patches, large parks, industrial areas, residential areas,
and PROW (Public Rights of Way). The goals of each forest opportunity type can

37
overlap (Figure 4-8). Several FOS can be used to achieve a specific goal. Or, several
goals can be met with a FOS type. For example, UTC along roads and around residential
areas are particularly important for reducing home energy use (cooling and heating). Or
trees planted along roads can improve stormwater quality, trap particulates from the air,
decrease ground-level ozone formation, add aesthetic appeal, and increase property
values. Because different stakeholder groups are motivated by different sets of goals, we
can use this overlap in goals to bring together diverse stakeholders by examining the full
range of benefits offered by different forest opportunity types. Finally, FOS types often
overlap in ownership. For instance, stream valleys may have public, institutional,
residential, industrial, and commercial owners. Each of these types of owners might have
different motivations and capacities for increasing urban tree canopy in stream valleys.
By combining geography, owners, and goals (figure 4-10), we can:
o link places to owners,
o link owners to goals, and
o link goals to places
Finally, each of the forest opportunity types can be modified or an opportunity can be
added or deleted, depending upon the analyst’s needs. For instance, the buffer width for
riparian areas can be changed from 100’ to 300’ or, in the case of Annapolis; a Critical
Areas Forest Opportunities can be added and defined as the 1,000’ along the shoreline of
the Chesapeake Bay. Or, in the case of New York City, possible and existing UTC areas
along highways and parkways can be identified as a sub-type of all Roads.
0
2000
4000
6000
8000
10000
12000
14000
16000
18000
Coastal StreamValley
ForestPatches
Parks IndustrialParcels
ResidentialParcels
PROWCoastal
Ac
res
Stream Valley
Forest Patches
Large Parks
Industrial Residential PROW
Figure 4-7. This figure demonstrates the possibility for overlap among FOS types. Looking at this chart
we can see, for instance, that stream valleys in Baltimore occupy nearly 18,000 acres and contained within
these stream valleys are forest patches (2800 acres), large parks (2300 acres), industrial areas (1700 acres),
residential areas (4700 acres), and PROW (Public Right of Way) (2900 acres).

38
Figure 4.8. Goals overlap among FOS types. Several FOS can be used to achieve a specific goal.
Alternatively, several goals can be met within an FOS type.
Overlap in Goals:Overlap in Goals:Priority for each goal may vary: water quality may be a high priPriority for each goal may vary: water quality may be a high pri ority for riparian plantings and ority for riparian plantings and
only a moderate priority for road plantings. Because of this ovonly a moderate priority for road plantings. Because of this ov erlap, forest opportunities can be erlap, forest opportunities can be used together, but with different management strategies, to achiused together, but with different management strategies, to achi eve water quality goalseve water quality goals
FOS
Type
Wildlife
Habita
t
Recreation
Fore
st
Produts
Safe
ty
Clean
liness
Social
Capital
Aesthetics
Quality
Of Life
Prop erty
Value
s
Energy
Savings
Carbon
Storage
Ozone
Air
Particulates
Storm
water
Drinking
Wa
ter
RegionalForestry
Stream Valleys &
Coastal Areas
Roads
Neighborhood Areas
Underutilized Industrial Areas
Large , Protected Areas
UTC / FOS Goal
No Effect
Low Effect
High Effect
Medium Effect

39
Figure 4-9. Area, in acres, of parcels by land use within stream valleys for the City of Baltimore. A FOS
type can have multiple types of owners. And each ownership type can have different motivations for
conserving or restoring stream valley UTC, for instance. UTC in stream valleys would require the greatest
interaction with government/nonprofits (exempt) and residential land owners.
Industrial 15% (3964)
Exempt 34% (8933)
Residential 22% (5651)
Unknown 18% (8933)
Commercial 11% (2804)
Diversity of Ownership in Baltimore City Stream Valleys
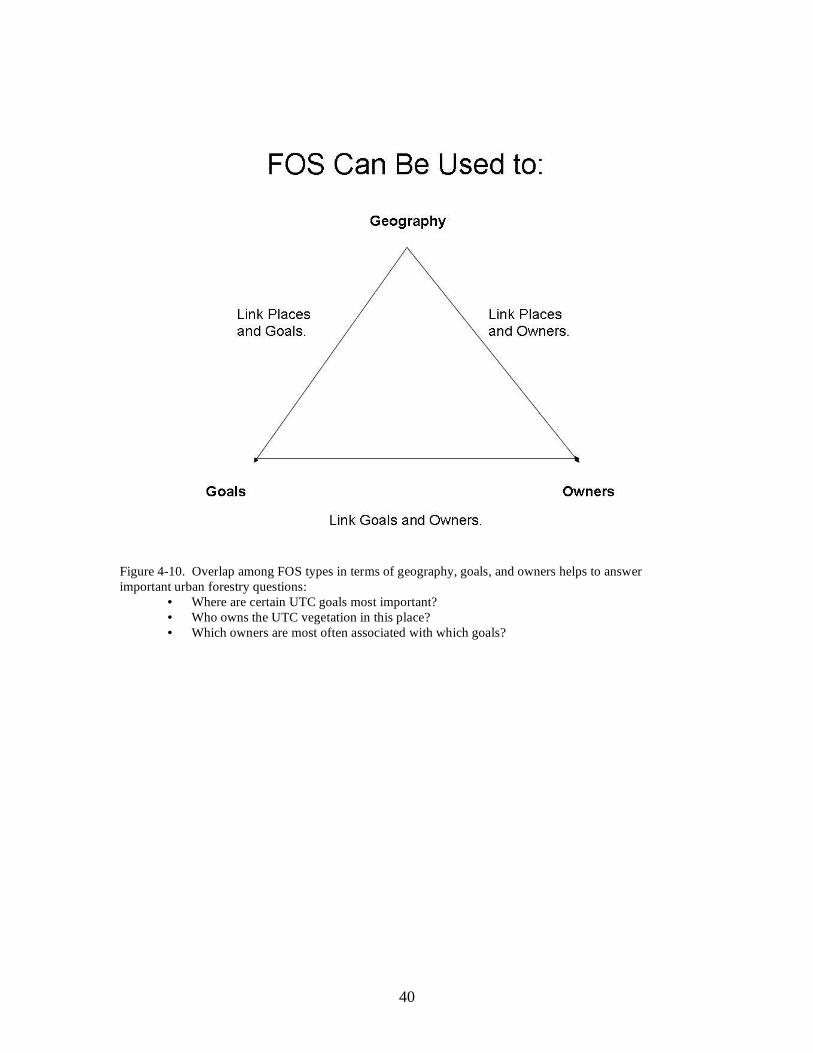
40
Figure 4-10. Overlap among FOS types in terms of geography, goals, and owners helps to answer
important urban forestry questions:
• Where are certain UTC goals most important?
• Who owns the UTC vegetation in this place?
• Which owners are most often associated with which goals?

41
Applications of the FOS to Goal Setting
This section demonstrates potential applications of the Forest Opportunity Spectrum to
UTC goal setting. These applications should not be considered an exhaustive list of the
analyses that FOS has to offer, but rather an example of potential approaches. The FOS
framework is user-definable, offering infinite ways to explore the opportunities for urban
forestry. A set of GIS tools are being developed to assist communities in using the Forest
Opportunity Spectrum. Please see the FOS Toolbox section for more details.
The Priority Planting Index
This analysis illustrates the connection between the Possible to the Preferable phase of the planning process. Communities may differ in their preferences and can adapt their analyses accordingly.
The priority planting index, developed by researchers at the US Forest Service
Northeastern Research Station (D.J. Nowak et al), uses population density, tree stocking
levels, and tree cover per capita to rank tree planting locations. The higher the index
value, the higher the priority of the area for planting. Areas with high population
densities, low tree stocking levels, and few trees per capita are ranked as high priority.
The rationale is that these are the areas where increased tree cover will immediately
benefit the greatest number of people.
Summary of index parameters:
• Population density: Population density is obtained from US census block group
data. The greater the population density, the greater the priority for tree planting;
• Tree stocking levels: The percent of available space that is occupied by tree
canopies. The lower the tree stocking levels, the greater the priority for tree
planting; See the “GIS Methodology” section of this document for ideas on how
to calculate existing and possible tree canopy cover.
• Tree cover per capita: This is the tree canopy area for a census block divided by
the population of the census block (m2/capita). The lower the amount of tree
canopy cover per capita, the greater the priority for tree planting.
A customizable ArcGIS tool has been created to assist communities in using the
Priority Planting Index. See the “FOS Toolbox” section for more information about
these tools and where to find them.

42
Figure 4-11. Census block group analysis of possible UTC and priority planting locations. Extruded on the
z-axis is the area of possible UTC within each block group. The graduated color ramp corresponds to
priority planting index (PPI) values. Higher PPI values indicate a greater need for tree plantings. Such
information can be used to identify areas where there is the most available land to plant trees (high possible
UTC) and the greatest need for tree plantings (high PPI).

43
FOS Toolbox: GIS Tools for Strategic Urban Forests Assessment
The FOS Toolbox is a set of GIS tools that allow communities to apply the Forest
Opportunity Spectrum to their own data. The tools were designed to use readily available
data types (e.g. census block groups) and to streamline the assessment process by
automating many of the geoprocessing steps. The tools run in ArcGIS 9.0 and higher and
include detailed help and information files. Each of the tools is open-source and highly
customizable, so communities can adapt them to meet their needs.
Hydrology
LULC
Cadastral
Boundary
Summary
statistics
Overlap
statistics
FOS Strategic Types
FOS Strategic
Compiles the six FOS types for a target geography and
computes summary statistics and overlap
Figure 4-12. The FOS Strategic Tool assists communities in tallying up the land areas within each FOS
type as well as the overlaps among them. This helps communities to strategically plan their efforts.
Census
LULC
Priority
Planting Index
Priority Planting Index
Calculates the priority planting index based on population density, tree stocking levels , and tree
cover per capita
Figure 4-13. The Priority Planting Index uses population density, tree stocking levels, and tree-stocking-
per-capita to facilitate areas where increased tree cover will immediately benefit the greatest number of
people.

44
Str
ate
gic
Cadastral
LULC
Potential
stewardship
Private land
vegetation
PROW
vegetation
StewardshipStatistics
Computes possible and existing UTC for private lands and summarizes
vegetation for private lands and PROW
Realized
Stewardship
UTC
Figure 4-14. The FOS UTC tool automates many of the processing steps involved with computing possible
and existing tree cover for a given geographic area.
MaintenanceRequests
Transportation
Maintenance
Geocodes maintenance requests based on address. When given a maintenance location or locations finds
nearby requests
Maintenance
request
locations
Nearby
maintenance
requests
Figure 4-15. The FOS Maintenance tool facilitates geocoding the locations of tree maintenance service
requests, and for a given service request finds other service requests within a specified driving time.

45
Planting
Geocodes planting requests and ranks the best areas to plant based on proximity to cultural features (schools ,
social centers) and to volunteers
Planting
Requests
Cultural
Volunteer list
Planting request
locations
Optimum
planting areas
Figure 4-16. The FOS Planting tool assists managers in deciding where to focus planting efforts based on
proximity to socially and culturally important features.
Visit the FOS website for the most up-to-date version of the FOS Toolbox along with tutorials at:
http://www.unri.org/fos/

46
CHAPTER 5: UTC GOAL SETTING EXAMPLES
A handful of communities in the Bay watershed have already committed to the adoption
of urban tree canopy goals. These case histories are intended to provide a feel for how
the process plays out in a real world setting. They are also intended to convey that while
we have focused largely on technical issues, administrative concerns are fundamental to
getting a UTC goal commitment and adoption.
BALTIMORE CITY
Timeline
On April 5, 2005, the UTC Goal Setting Process in Baltimore began with a letter of
invitation sent by Maryland Department of Natural Resources (MD DNR) to Mayor
O’Malley. The letter invited Baltimore to be one of the five communities referred to in
the Chesapeake Executive Council’s Directive of Expanded Riparian Forest Buffer
Goals. In the letter, MD DNR committed to the provision of technical assistance in the
event that the city accepted the invitation.
On August 2, 2005, at the City’s request, a preliminary meeting was held at the Baltimore
Department of Recreation and Parks (BDR&P) offices. The city wanted to review the
roles and responsibilities of both parties, and more importantly, to get a better idea of
what they were committing to.
On August 18, 2005, Mayor O’Malley responded by letter. His letter contained the
following assignment:
1) Begin investigating the impacts of setting an Urban Tree Canopy (UTC) goal; and
2) Start work towards setting a reasonable goal for Baltimore City.
The letter also designated Connie Brown, BDR&P, as the City’s point of contact. This
was important as it established a specific client and an assignment.
On October 18, 2005, the first UTC goal setting meeting was held at BDR&P offices.
The participants included Baltimore City, MD Department of Natural Resources, US
Forest Service, University of Vermont Spatial Analysis lab, and the Parks and People
Foundation. The group reviewed data and methods, agreed upon analyses to be
conducted, and set a date to review the results and recommend a goal. The timeline
called for:
1) An updating of data, methods, analyses, and subsequent report of results
by December 15th, 2005;
2) The development of a goal recommendation in early January, and

47
3) A report to the City by the end of January so the City could have 45 – 60
days for review in order to make an announcement on a UTC Goal before
Maryland Arbor Day (the first Wednesday in April), approximately one
year from the date of the initial invitation.
On January 5, 2006, the final goal setting meeting was held at BDR&P offices.
Participants reviewed and discussed data and analyses and agreed on a goal
recommendation.
On January 19, 2006, the Baltimore City UTC Report (in the appendix of this document)
was issued to the City along with a recommended goal. The report recommended that
Baltimore City adopt a 46.3% UTC goal to be attained by 2030 - 2036, with remote
sensing assessment of progress in attaining the UTC goal at 10-year intervals. This goal
slightly exceeds the UTC targets associated with good water quality as established by
Goetz (2003). It further recommended that the Baltimore Ecosystem Study (National
Science Foundation and US Forest Service) and MD DNR Forest Service work with the
City to:
1) Develop a comprehensive urban forest management plan, and
2) Monitor and assess the social and ecological benefits provided by changes
in the City’s UTC.
At this point it was up to the City to adopt the goal or another goal of their choosing.
On March 28, 2006, Baltimore became the first city in the Bay watershed to announce a
UTC goal. It announced a goal of doubling the city’s UTC over the next 30 years, from
20% to 40%. The City also announced that it will organize an inter-departmental cabinet
and a citizen's panel to help write an Urban Forestry Management Plan to support the
goal.

48
Results of the Baltimore UTC Assessment
The Baltimore UTC assessment revealed that the city’s land area consists of 13% streets,
15% structures and 20% existing tree canopy (figure 5-1). This leaves 52% of the city’s
area available for possible tree planting. Possible planting locations were defined as all
areas not currently occupied by roads or buildings. When the possible tree planting area
is broken down by land use we find that only 8% of the possible planting area falls within
the public right of way. The other 46% of the possible planting area falls within
individual parcels (Figure 4-3). This means that the city will have to involve both public
and private land holders in the goal setting process – planting street trees alone will not
be enough to achieve the goal of doubling UTC.
Figure 5-1. Breakdown of Baltimore City land cover by streets, structures, existing UTC and possible
UTC.

49
Figure 5-2. This map shows existing tree canopy in Baltimore City by census block group. Maps of this
kind can help direct canopy enhancement efforts in the city.
Existing Urban Tree Canopy in Baltimore by Census Block Group
50
ANNAPOLIS
Timeline:
On January 12, 2005, the Maryland Department of Natural Resources (MD DNR)
sent a written invitation to Annapolis Mayor Ellen Moyer. The letter invited Annapolis to
be one of the five (5) communities referred to in the previously noted directive, and
committed MD DNR to the provision of technical assistance in the event that the city
accepted the invitation. On January 28, 2005, Mayor Moyer accepted, making Annapolis
the first city in the Bay watershed to commit to setting a tree canopy goal.
On November 4, 2005, the initial goal-setting meeting was held at Annapolis City Hall.
Attendees reviewed data and methods, agreed upon certain analyses and set a date to
review results and recommend a goal. The timeline called for:
1) An updating of data, methods, analyses, and subsequent report of results
by May 26th, 2005;
2) The development of a goal recommendation in June 2006, and
3) A report to the City by the end of June to provide the basis for a locally-
determined UTC goal.
The City called for two primary units of analysis: lands inside the Critical Area (within
1000’ of tidal waters of the Chesapeake Bay) v. outside the Critical Area; and, by ward.
The UTC assessment for Annapolis has been completed and the report is pending.
Results of the Annapolis UTC Assessment
The Annapolis UTC assessment revealed that the city has 41% tree cover (Figure 5-3).
This is substantially more than Baltimore City due in part to a larger percentage of
residential land use in Annapolis. Most existing UTC is on private land, particularly
residential land, which has more tree cover than all other land uses combined. The
majority of land where new tree planting is possible (possible UTC) is found in the
residential, commercial, and exempt commercial land use categories. Of these, only the
exempt commercial category includes some public land. Furthermore, these possible
planting areas are dispersed throughout the city, rather than in a few large tracts.
Annapolis will have to work with private land owners, particularly home owners, if it
hopes to significantly increase UTC.

51
Figure 5-3. Breakdown of Annapolis land cover by public rights of way, structures, existing UTC and
possible UTC.
Figure 5-4. Existing and possible UTC by ward, for the City of Annapolis. This graphic is useful for
depicting total in addition to relative amounts of existing and possible UTC.
Existing and Possible Urban Tree Canopy in Annapolis by Ward
Possible UTC
Area | Percent
Existing UTC
Percent | Area
*Area is the total existing/possible for the respective ward *Percent is the existing/possible for the respective ward ÷ ward land area
Ward

52
Helping Communities Establish UTC Goals - Summary of Steps:
1. Identify your client. This is very important, particularly in large cities – you have
to know who you are providing the report for.
2. Invite participation. This should be done formally (in writing) and be extended to
an authority that is able to direct fulfillment of the commitment (Mayor or
Council).
3. Meet with the client and identify needs. Agree on tools (GIS data, etc.) and how
they will be shared. Agree on methods to be used and units of analysis
(neighborhood, ward, land use type, etc.).
4. Perform analysis.
5. Meet with client and share results. Determine client needs for the report (items to
be included and excluded).
6. Provide client with a report of findings and a goal recommendation.
7. Client will review by whatever process they establish and announce a goal.
8. Commit to provision of technical assistance for implementation.

53
Glossary:
Active sensor - An active sensor is a measuring instrument that generates a signal,
transmits it to a target, and receives a reflected signal from the target. Information
concerning the target is obtained by comparison of the received signal with the
transmitted signal. Radar systems used to track airplanes are an example of an active
sensor.
Automated Feature Extraction - The identification of geographic features and their
outlines in remote-sensing imagery through postprocessing technology that enhances
feature definition, often by increasing feature-to-background contrast or using pattern
recognition software. (ESRI GIS Dictionary, http://support.esri.com)
Bottom-Up Canopy Assessments - Bottom-up approaches uses data collected on the
ground, frequently a plot-based sampling scheme to measure tree canopy cover. In this
approach, the amount of tree canopy cover that falls within study plots is extrapolated
and taken to represent the urban tree canopy cover as a whole. This on-the-ground
method may be most appropriate for very small communities, such as a homeowner’s
association or a school district’s properties. Plot data can be collected using the US
Forest Service’s i-Tree tools and methods at www.itreetools.org.
Chesapeake Bay Program (CBP) - The Chesapeake Bay Program (CBP) is a
partnership between federal and state agencies, non-profit organizations, and academic
institutions whose aim is to protect and restore the Chesapeake Bay.
Chesapeake Executive Council – A legislative body serving Maryland, Pennsylvania,
and Virginia. The Executive Council establishes the policy direction for the restoration
and protection of the Chesapeake Bay and its living resources. A series of Directives,
Agreements and Amendments signed by the Executive Council set goals and guide policy
for the Bay restoration. The CEC consists of the Governors of Maryland, Pennsylvania,
and Virginia, the Administrator of the U.S. Environmental Protection Agency, the Mayor
of the District of Columbia and the Chair of the Chesapeake Bay Commission.
Color Infrared (CIR) – An example of multispectral data that includes part of the
visible light spectrum as well as the near infrared. CIR is especially useful for vegetation
mapping.
Ecosystem Services – The benefits that people obtain from ecosystems. These benefits
may be environmental, social, or economic. Examples of environmental outcomes
include the protection of streams, reduced stormwater runoff, reduced ozone
concentrations, and increased carbon sequestration. Social outcomes may include
improved human health, buffers for wind and noise, increased recreational opportunities,
and neighborhood beautification. Economic outcomes can include reduced heating and
cooling costs and increased property values.

54
Existing UTC - Any piece of land in the city that was covered by UTC at the time of
satellite data acquisition.
Forest Opportunity Spectrum (FOS) - The Forest Opportunity Spectrum provides a
framework for organizing data, as well as for asking and answering urban forestry related
questions. This framework can assist decision-makers as they decide what their tree
canopy goal will be and what actions they can take to achieve that goal.
Forest Opportunity Types – FOS allows forest opportunity types to be user defined.
For example, Baltimore City identified six major FOS types: regional forestry, riparian
forests, large parks, abandoned industrial areas, neighborhood areas, and roads (which
includes street trees). Forest Opportunity Types are most often defined by and associated
with specific issues identified by government agencies, non-profits, businesses, and
community groups. FOS types overlap in geography, goals, and ownership.
Geographic Information Systems (GIS) - Acronym for geographic information system.
An integrated collection of computer software and data used to view and manage
information about geographic places, analyze spatial relationships, and model spatial
processes. A GIS provides a framework for gathering and organizing spatial data and
related information so that it can be displayed and analyzed. (ESRI GIS Dictionary,
http://support.esri.com)
Geoprocessing - A GIS operation used to manipulate GIS data. A typical geoprocessing
operation takes an input dataset, performs an operation on that dataset, and returns the
result of the operation as an output dataset. Common geoprocessing operations include
geographic feature overlay, feature selection and analysis, topology processing, raster
processing, and data conversion. Geoprocessing allows for definition, management, and
analysis of information used to form decisions. (ESRI GIS Dictionary,
http://support.esri.com)
IKONOS - A commercial satellite that collects high-resolution imagery at 1- and 4-meter
resolution. It offers multispectral (MS) and panchromatic (PAN) imagery. IKONOS
launched on September 24, 1999, and provides imagery beginning January 1, 2000.
Imaging, Inc. distributes IKONOS imagery under the product name CARTERRA.
LIDAR - LIght Detection And Ranging sensors are active sensors that collect extremely
detailed elevation data by way of a laser. By emitting pulses from the laser, then sensing
the time it takes for the pulse to return, the height of objects on the ground can be
inferred. A relative surface DEM generated from LIDAR data can greatly complement
imagery when performing a UTC assessment as it allows for features that have similar
spectral and textural properties, to be differentiated based on height. LIDAR can be
particularly useful in separating trees from shrubs and buildings from parking lots.
Manual Interpretation - Human interpretation is generally considered the most accurate
method of extracting features from imagery, however it is extremely time consuming.

55
Multispectral Data - Data that spans several parts of the EM spectrum is referred to as
multispectral data. Color infrared (CIR) imagery is an example of multispectral data. It
displays light from part of the visible spectrum as well as near infrared (NIR).
Near Infrared (NIR) - Having a NIR (near infrared) band can assist in distinguishing
tree and vegetation types (broadleaf vs. conifer vs. grass), impervious surface types
(concrete vs. asphalt), and other features (forests vs. forested wetlands). NIR can also be
used to assess vegetation condition. This makes NIR data invaluable for natural resource
management.
Nutrient Pollution - Although nutrients, such as nitrogen and phosphorus, are essential
to all plant life within the Chesapeake Bay, an excess of these same nutrients can be
harmful. This is called "nutrient pollution". Excessive nutrient levels in aquatic systems
can lead to harmful algal blooms, reduced sunlight for submerged aquatic vegetation, and
low oxygen conditions that can kill fish and other aquatic life. As the use of the land has
changed and the watershed's population has grown, the amount of nutrients entering the
Bay's water has increased tremendously leading to many environmental problems in the
Bay and its tributaries.
Passive sensor - Passive sensors record waves of electromagnetic (EM) energy that are
either emitted or reflected from an object.
Possible UTC - Where is it biophysically feasible to plant trees? This is the first step in
the assessment process. It is not concerned with costs, logistics or the fact that tree
planting may not be appropriate or desirable in some locations. For the Baltimore UTC
assessment, all land that was not covered by water, a road, or a building was considered a
“possible” planting location.
Potential UTC - Where is it economically likely to plant trees? Which areas have
regulatory constraints that conserve tree cover or have incentive supports for adding tree
cover? Which areas are most cost-effective for achieving water quality or other goals?
Preferable UTC - Where is it socially desirable to plant trees? For example, where will
tree cover make neighborhoods more attractive? Where will tree cover address other
issues such as cooling and cleaning the air?
PROW (Public Right Of Way) - Any sidewalk, planting strip, alley, street, or pathway,
improved or unimproved, that is dedicated to public use. The term includes any strip of
land over which public facilities such as highways, railroads, or power lines are built.
Radiometric Resolution - Radiometric Resolution is the number of brightness levels that
the remote sensing technology can sense. The higher the radiometric resolution, the
better the sensor will be able to distinguish objects with similar spectral properties. Most
remote sensors, such as Landsat, yield 8-bit data (28) where each pixel has a possible
value of 0-255. Newer sensors are capable of collecting data at a much higher resolution.

56
For example, the IKONOS and QuickBird satellites gather 11-bit (211
) data, allowing for
improved feature recognition when compared to traditional 8-bit data.
Resolution – see Spatial Resolution, Radiometric Resolution, Temporal Resolution, and
Spectral Coverage
Riparian Zone – This is the area of vegetation around streams. In less urbanized
systems, the riparian zone is extremely important for water quality. This area of
vegetation captures and processes pollutants before they can make it into surface waters.
In urban areas, however, riparian zones are often less effective at removing pollutants.
One reason is that urban streams tend to be deeply incised, causing the riparian zone to be
disconnected from the stream below. Secondly, the streams in many urban areas have
been functionally replaced with storm sewers.
Smart Growth - This term has many definitions depending on the context. According to
the US Environmental Protection Agency:
Smart growth is development that serves the economy, the community, and the environment. It changes the terms of the development debate away from the traditional growth/no growth question to "how and where should new development be accommodated." Smart Growth answers these questions by simultaneously achieving:
• Healthy communities -- that provide families with a clean environment. Smart growth balances development and environmental protection -- accommodating growth while preserving open space and critical habitat, reusing land, and protecting water supplies and air quality.
• Economic development and jobs -- that create business opportunities and improve local tax base; that provide neighborhood services and amenities; and that create economically competitive communities.
• Strong neighborhoods -- which provide a range of housing options giving people the opportunity to choose housing that best suits them. It maintains and enhances the value of existing neighborhoods and creates a sense of community.
• Transportation choices -- that give people the option to walk, ride a bike, take transit, or drive.
Spatial Resolution - Spatial Resolution is the “pixel size” associated with the data. For
reference, it generally takes at least 4 pixels to identify a feature. So, while Landsat
imagery, with its 30 square-meter resolution, may be adequate for measuring large areas
of intact forest it will do a poor job of identifying street trees in urban areas. This is why
the Chesapeake Bay Guidelines suggest a minimum resolution of one-meter or better. As
spatial resolution increases so does the storage size of the data.
Spectral Coverage - Spectral Coverage is another consideration for data acquisition.
Certain features and properties of land cover may be more distinguishable in different
bands of the electromagnetic spectrum. For instance, the inclusion of a NIR (near
infrared) band is optimal for classifying vegetation data as the majority of EM energy
reflected by vegetation is in the NIR portion of the spectrum.

57
Strategic Urban Forests Assessment (SUFA): UTC assessment process using high-
resolution remote sensing imagery. A vegetation mask is created from the NIR-to-Red,
(Band4:Band3) ratio image. A texture image of the resulting ratio image is produced to
separate UTC vegetation from non-UTC vegetation pixels (separate trees from other
vegetation). The resulting image provides for quantification of existing UTC and non-
UTC vegetation.
Stormwater Runoff – Surface water that fails to infiltrate the soil after a rainstorm. In
developed watersheds it flows off roofs and pavement into storm drains which may feed
directly into streams; Stormwater carries pollutants from urban areas directly into local
waterways. By slowing, intercepting, and treating rainfall, trees can help reduce the
volume of pollution-carrying stormwater runoff.
STRATUM (Street Tree Resource Analysis Tool for Urban forest Managers) - STRATUM is a street tree management and analysis tool for urban forest managers that
uses tree inventory data to quantify the dollar value of annual environmental and
aesthetic benefits. Using an existing inventory of street trees, this software allows
managers to evaluate current benefits, costs, and management needs.
Temporal Resolution - Temporal Resolution represents the time frequency for the data.
This component of data quality recognizes that it is not just the image quality that
matters, but also when the information was acquired. The Chesapeake Bay Program
Guidelines recommend that the data used in UTC assessment be less than five years old.
In some communities, where rapid change or development is taking place, a much higher
temporal resolution may be required (i.e. data that is less than one year old) to accurately
reflect the extent of current tree canopy.
Three Ps - When moving from a canopy assessment to an implementation plan, it is
useful to separate the process into a sequence of steps. This allows the task to be broken
into manageable components and prevents each step from being bogged-down by details
that belong in later stages of the process. The Three Ps, Possible, Potential, and
Preferable, provide a useful sequence for structuring the goal setting and implementation
process. (See Possible, Potential, and Preferable for more information).
Top-Down Canopy Assessments - Top-down approaches use remote sensing data, such
as satellite imagery, to quantify the extent of tree cover. For most communities, a top
down approach is recommended. This guide focuses on a top-down approach for several
reasons. First, the Chesapeake Bay Program guidelines are based on tree cover and
extent which are readily assessed using top-down methodologies. Second, percent cover
is easy to conceptualize and communicate. Third, remote sensing makes it easy to track
progress over time. Lastly, these methods are well documented and have been used
successfully here and elsewhere.
Urban Forests - Urban forests include the trees in our yards, parks, public spaces, and
along our streets. Though we don’t often think of them as forests, they provide many
forest benefits, such as cleaner air and water. In addition to environmental benefits,

58
urban forests increase property values, reduce home energy costs, block UV radiation,
buffer wind and noise, provide shade and beautify our neighborhoods.
Urban Sprawl - The unplanned, uncontrolled spreading of urban development into areas
adjoining the edge of a city.
Urparian - Urparian describes the vegetated areas around roads and sidewalks. The term
comes from combining urban and riparian to form a single word. In less urbanized
systems, the corridor around streams (the riparian zone) is extremely important for water
quality. This area of vegetation captures and processes pollutants before they can make it
into surface waters. In urban areas, however, riparian zones are often less effective at
removing pollutants. One reason is that urban streams tend to be deeply incised, causing
the riparian zone to be disconnected from the stream below. Secondly, the streams in
many urban areas have been functionally replaced with storm sewers. In this context, the
soil and vegetation around roads and sidewalks is the new riparian zone. By increasing
tree canopy in the urparian zone, we can return some of the environmental benefits of
riparian areas to urban systems.
Urban Tree Canopy (UTC) - Urban tree canopy (UTC) is the layer of leaves, branches,
and stems of trees that cover the ground when viewed from above.
Watershed - This is the area that drains to a common waterway, such as a stream, lake,
estuary, wetland, or the ocean. The Chesapeake Bay Watershed stretches across six
states and includes all of the areas that eventually drain into the Bay.

59
Appendix
Sample Letter to Mayor/Community Leader
Fact Sheets
FOS
UTC
Remote Sensing
Baltimore UTC Report
Internet Resources
Forest Service Tools
UFORE (Urban Forest Effects Model) http://www.ufore.org/
iTree (Tools for assessing and managing community forests)
http://www.itreetools.org/
Urban Watershed Forestry Manual Series
Part 1: Methods for Increasing Forest Cover in a Watershed
Part 2: Conserving and Planting Trees at Development Sites
Part 3: Urban Tree Planting Guide http://www.na.fs.fed.us/watershed/publications.shtm