
Urban Transportation System in Seoul - Metropolis · · 2015-10-02Urban Transportation System in...
50
Urban Transportation System in Seoul 2015. 9. Joonho Ko, Ph.D. Research Fellow The Seoul Institute
-
Upload
trankhuong -
Category
Documents
-
view
218 -
download
1
Transcript of Urban Transportation System in Seoul - Metropolis · · 2015-10-02Urban Transportation System in...
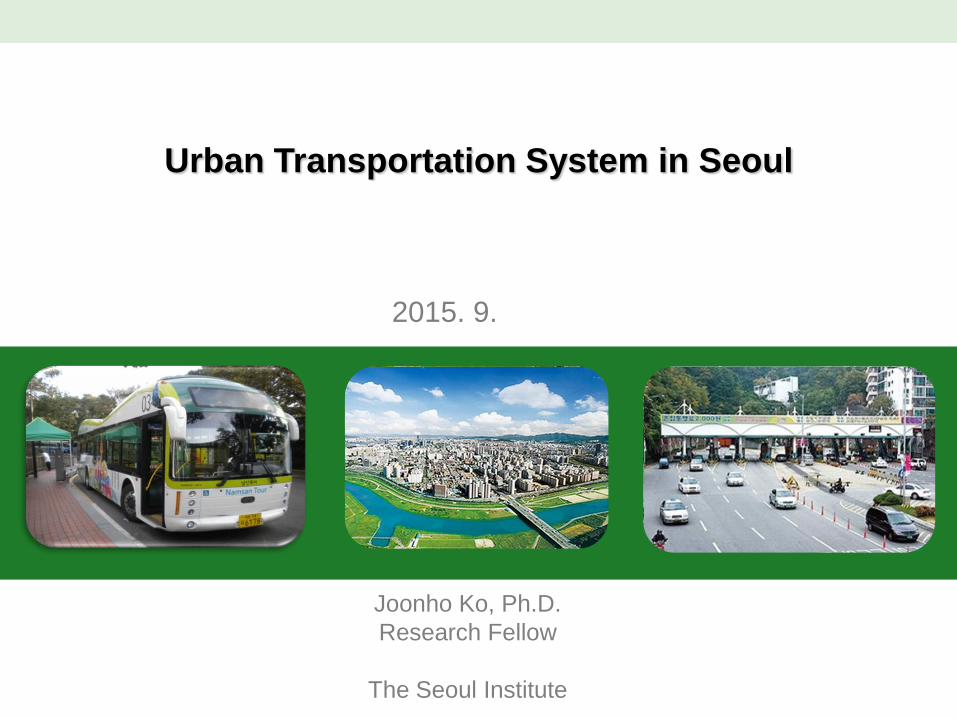
Urban Transportation System in Seoul
2015. 9.
Joonho Ko, Ph.D.
Research Fellow
The Seoul Institute
Contents
Ⅰ _Seoul Transportation Overview
Ⅱ _Subway System
Ⅲ _Bus System
Ⅳ_ Travel Demand Management and Initiatives
Ⅴ_ Big Data
Overview Ⅰ.
4
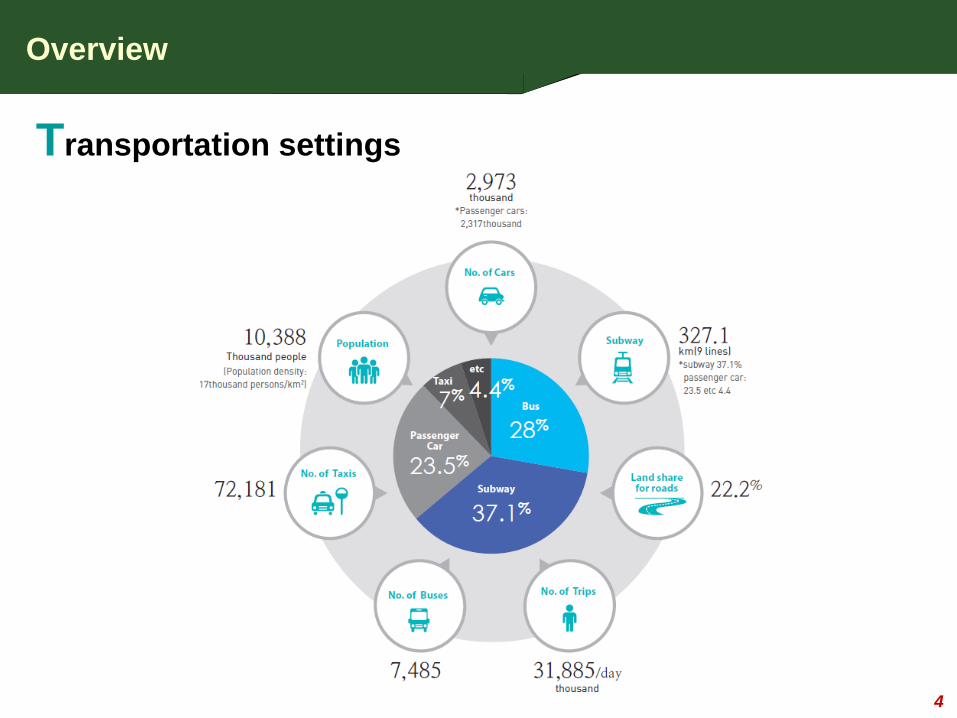
Overview
Transportation settings

5
Overview
Change of travel modes and roadway network
Expansion of Road Network
Mode of transportation
Streetcar (1945~1970) Walk (~ 1945) Bus (1971~1985) Car (1986 ~ 2000)
2000 1972 1966 1936
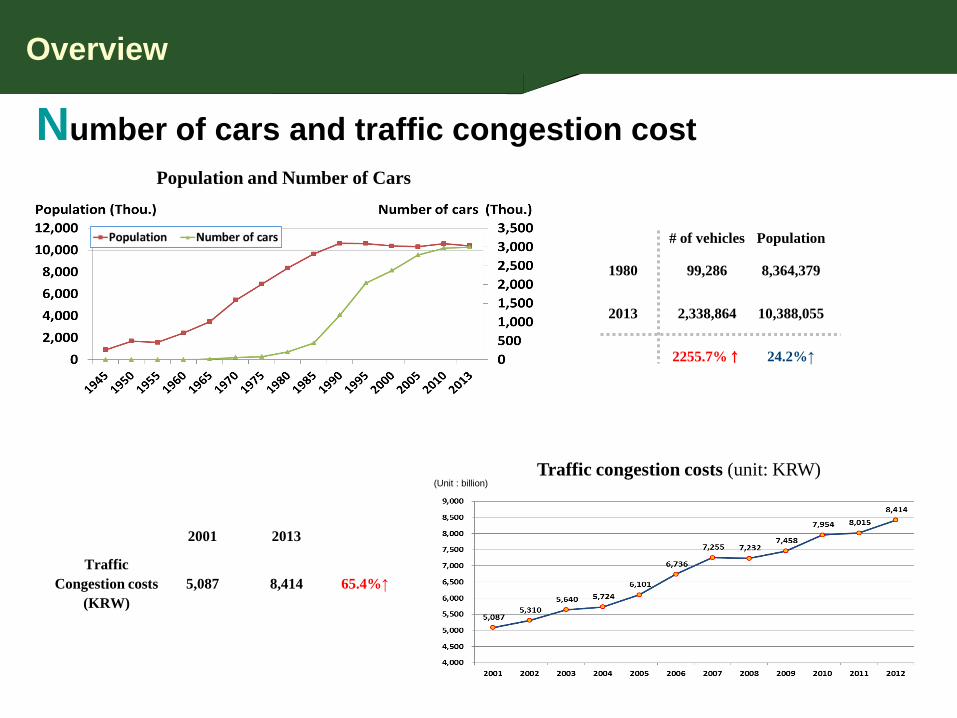
Overview
Number of cars and traffic congestion cost
Population and Number of Cars
Traffic congestion costs (unit: KRW) (Unit : billion)
1980 99,286 8,364,379
# of vehicles Population
2013 2,338,864 10,388,055
2255.7%↑ 24.2%↑
Traffic
Congestion costs
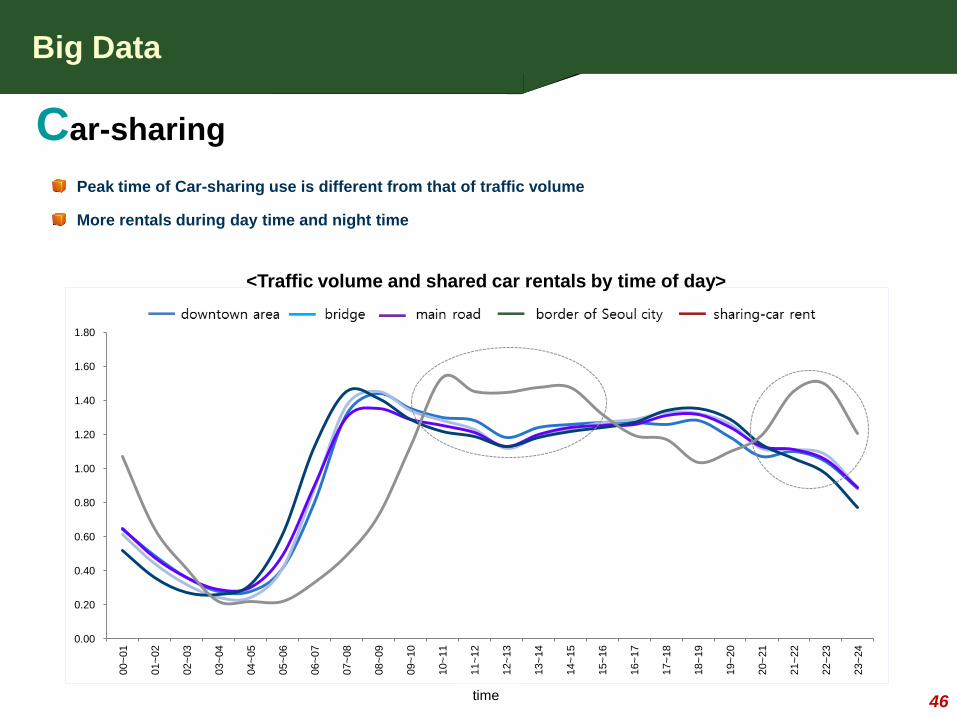
(KRW)
5,087 8,414
2001 2013
65.4%↑
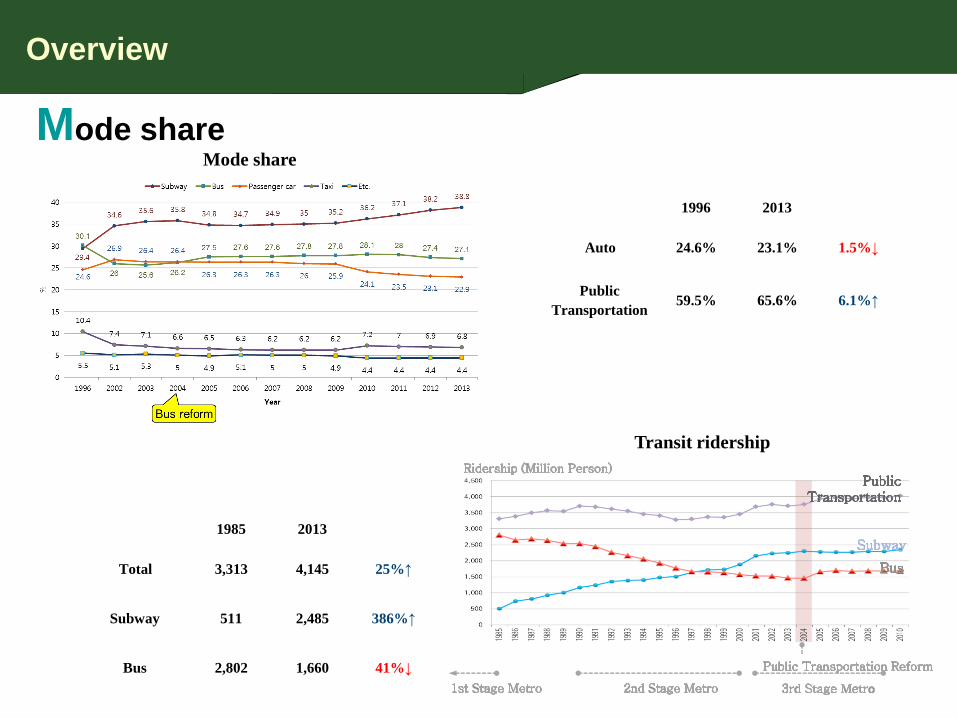
Overview
Mode share Mode share
Transit ridership
1996 2013
Auto 24.6% 23.1% 1.5%↓
Public
Transportation 59.5% 65.6% 6.1%↑
1985 2013
Total 3,313 4,145 25%↑
Subway 511 2,485 386%↑
Bus 2,802 1,660 41%↓
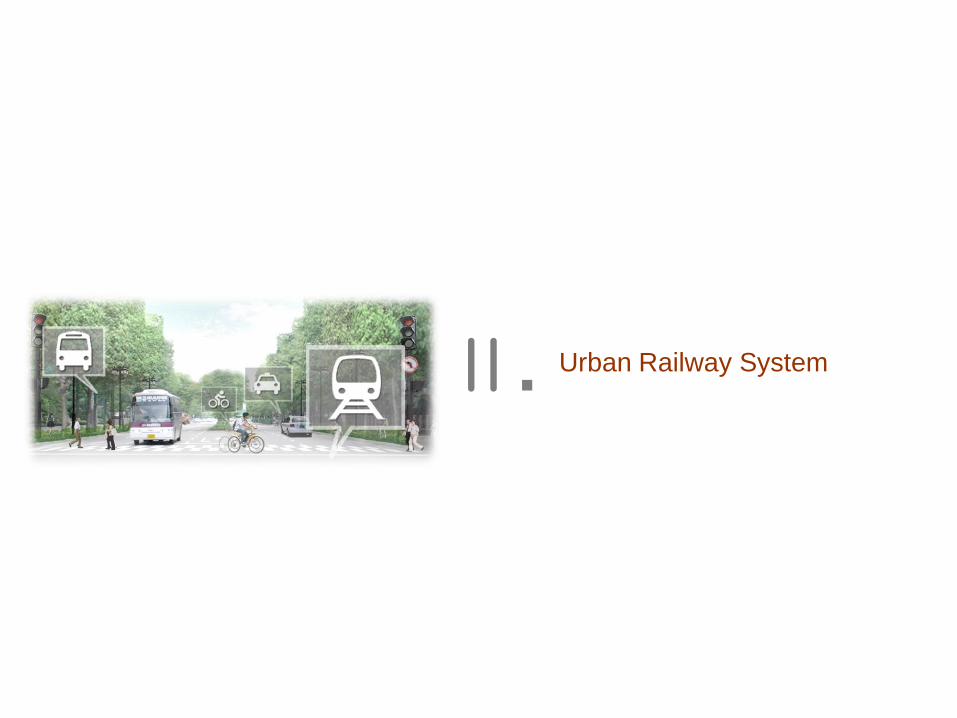
Urban Railway System Ⅱ.

Phase 2
- Line #5: 1990 ~ 1996
- Line #6: 1994 ~ 2001
- Line #7: 1990 ~ 2000
- Line #8: 1990 ~ 1999
Phase 3
- Line #9: 2001 ~ 2009
- Ui-Sinseol Line
Subway System
Subway system
Phase 1
- Line #1: 1971 ~ 1974
(7.8km, Seoul Station – Cheongnangri)
- Line #2: 1978 ~ 1984
- Line #3, #4: 1980 ~ 1985
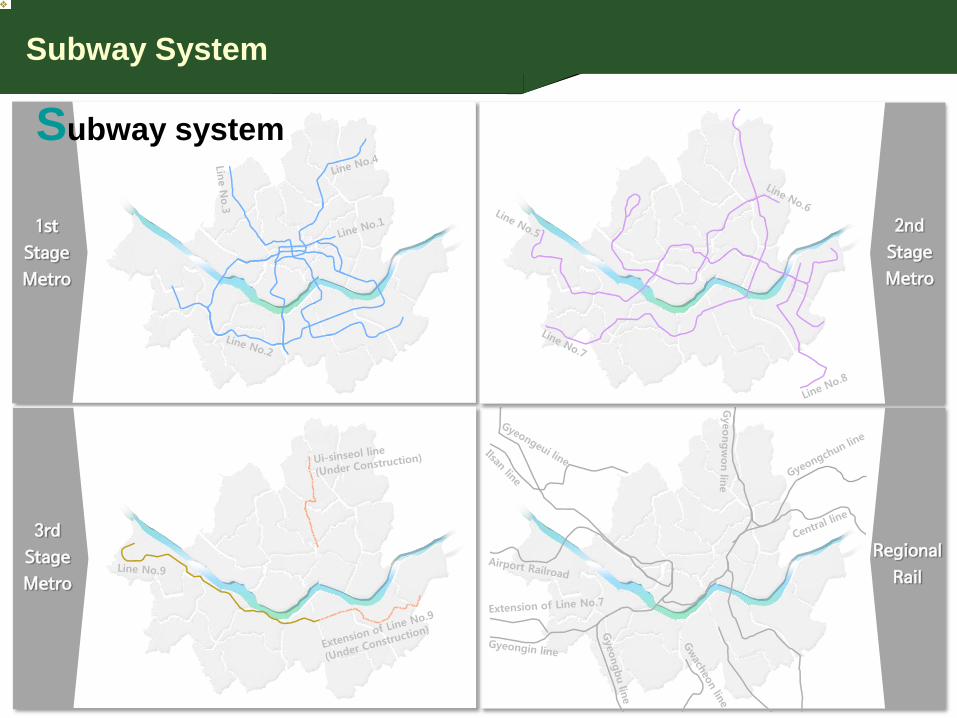
1st
Stage
Metro
3rd
Stage
Metro
2nd
Stage
Metro
Regional
Rail
Subway System
Subway system

Subway System
Subway Extension
Subway system
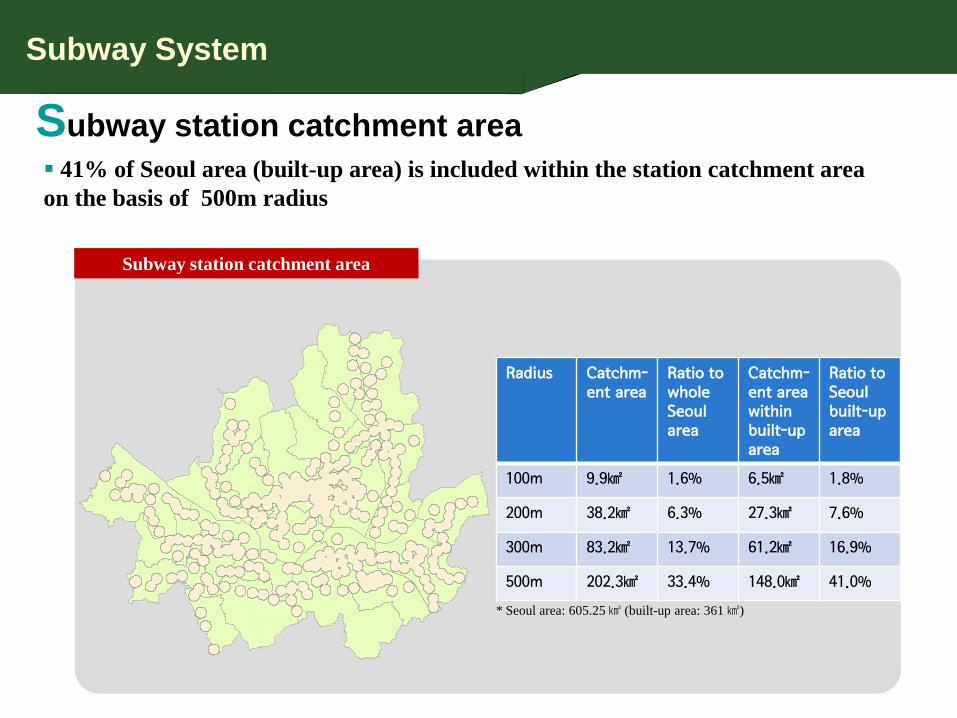
Subway station catchment area
Radius Catchm-ent area
Ratio to whole Seoul area
Catchm-ent area within built-up area
Ratio to Seoul built-up area
100m 9.9㎢ 1.6% 6.5㎢ 1.8%
200m 38.2㎢ 6.3% 27.3㎢ 7.6%
300m 83.2㎢ 13.7% 61.2㎢ 16.9%
500m 202.3㎢ 33.4% 148.0㎢ 41.0%
* Seoul area: 605.25 ㎢ (built-up area: 361 ㎢)
Legend
500m 역세권
구경계_Project
41% of Seoul area (built-up area) is included within the station catchment area
on the basis of 500m radius
Subway station catchment area
Subway System

Crowdedness
Subway System
Overall Line 1 Line 2 Line 3 Line 4 Line 5 Line 6 Line 7 Line 8 Line 9
2009 RH
159% 122% 202% 122% 172% 168% 177% 179% 176%
2011 RH
169% 144% 196% 149% 180% 170% 143% 182% 147% 215%
Difference (2011 – 2009)
+10% +22% -6% +27% +8% +2% -34% +3% -29% -
Tolerable degree of crowdedness = 150%, but current conditions during rush
hour exceed the degree
Note: For line 9, the highest crowdedness is for express services.

Subway operating companies
Established Length (km) # of Stations Boarding (million
persons/day) Revenue (million USD/day)**
Seoul Metro 1981 137.9 120 3.04 2.01
Seoul Metropolitan
Rapid Transit
(SMRT)
1994 152 148 1.73 1.18
Metro 9 2004 25.5 25 0.17* 0.11*
Note: * as of 2010; ** exchange rate: $1.0 = KRW1100
As of 2011
Subway System

Fare vs. operating cost
Subway System
2006 2007 2008 2009 2010 2011 2012
Seoul Metro
Average fare
659 723 736 727 726 725 791
Operating cost
948 1,007 1,018 1,048 1,092 1,051 989
Difference -288 -284 -282 -321 -366 -326 -198
SMRT
Average fare
687 756 760 754 749 750 818
Operating cost
1,285 1,262 1,277 1,283 1,217 1,276 1,207
Difference -598 -506 -517 -529 -468 -525 -388
Unit: KRW/passenger
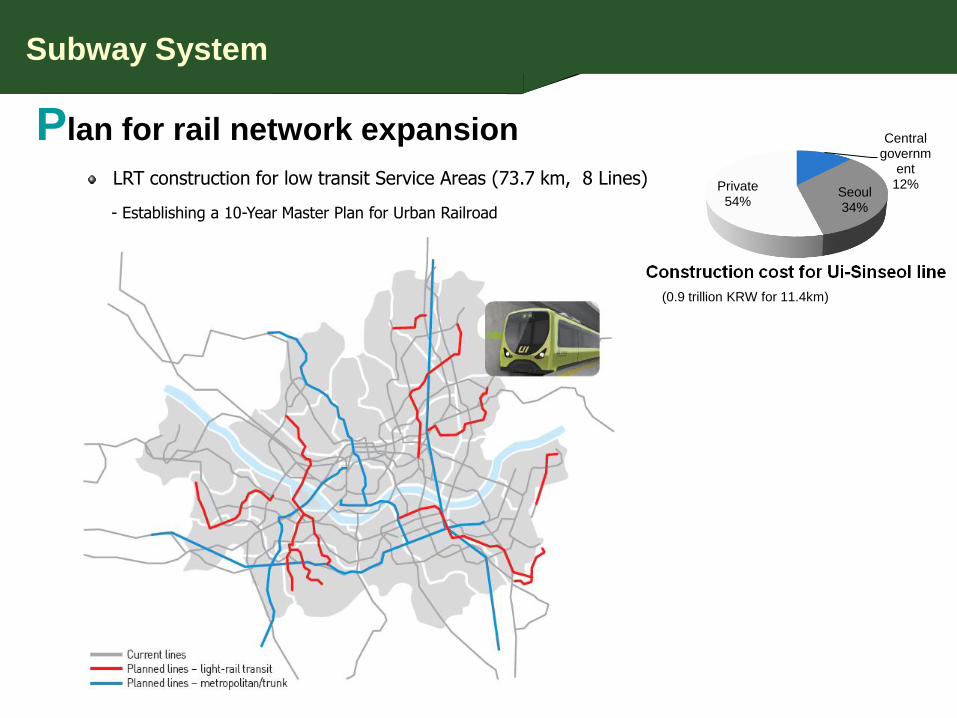
Plan for rail network expansion
LRT construction for low transit Service Areas (73.7 km, 8 Lines)
- Establishing a 10-Year Master Plan for Urban Railroad
Central governm
ent 12%
Seoul 34%
Private 54%
(0.9 trillion KRW for 11.4km)
Subway System
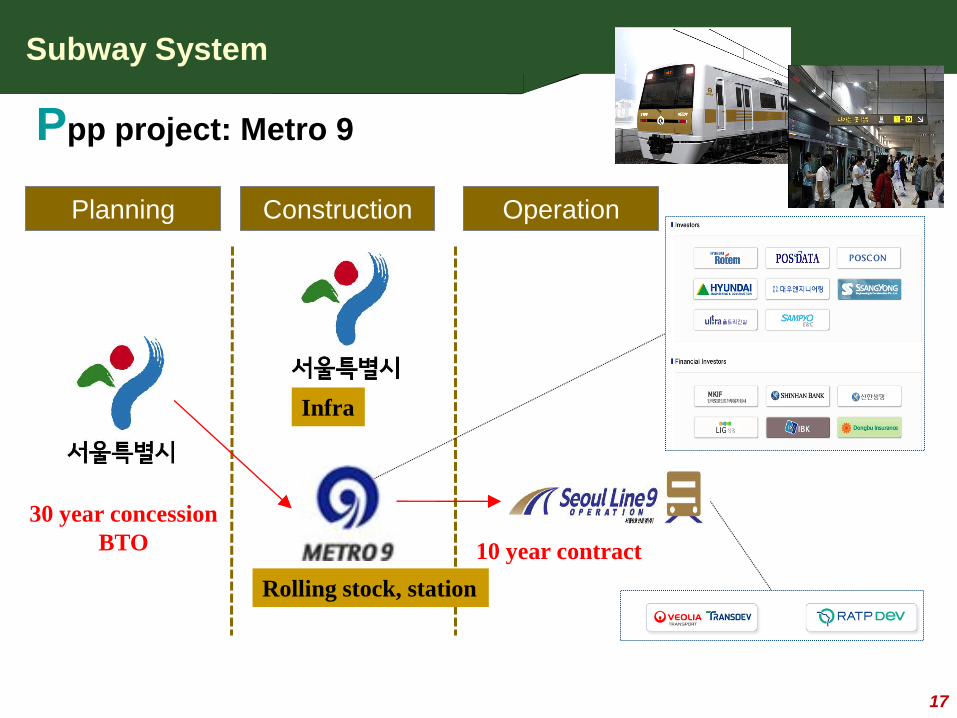
Ppp project: Metro 9
17
Infra
30 year concession
BTO
Planning Construction Operation
Rolling stock, station
10 year contract
Subway System

Bus System Ⅲ.

Bus system City bus : 7,534buses/363 routes, Community bus :1,401 buses/210 routes
No. of passengers in a day (average) 5.7 million
Bus only lane : 52 corridors, 203.6km (Median bus lane : 12 corridors,114.3km)
As of December 2011
Bus System

Color-coded hierarchical bus system
Trunk Lines
Inter-regional Lines
Feeder Lines
Circular Lines
Connecting suburban areas and center cities
Punctuality and speediness.
Link trunk line buses or subways for easy transfer
Satisfy the local needs and securing accessibility.
Circular bus service for business and
shopping in urban areas.
(sub)Urban areas ↔ (sub)Center cities
Meet the demand of private car.
Bus System
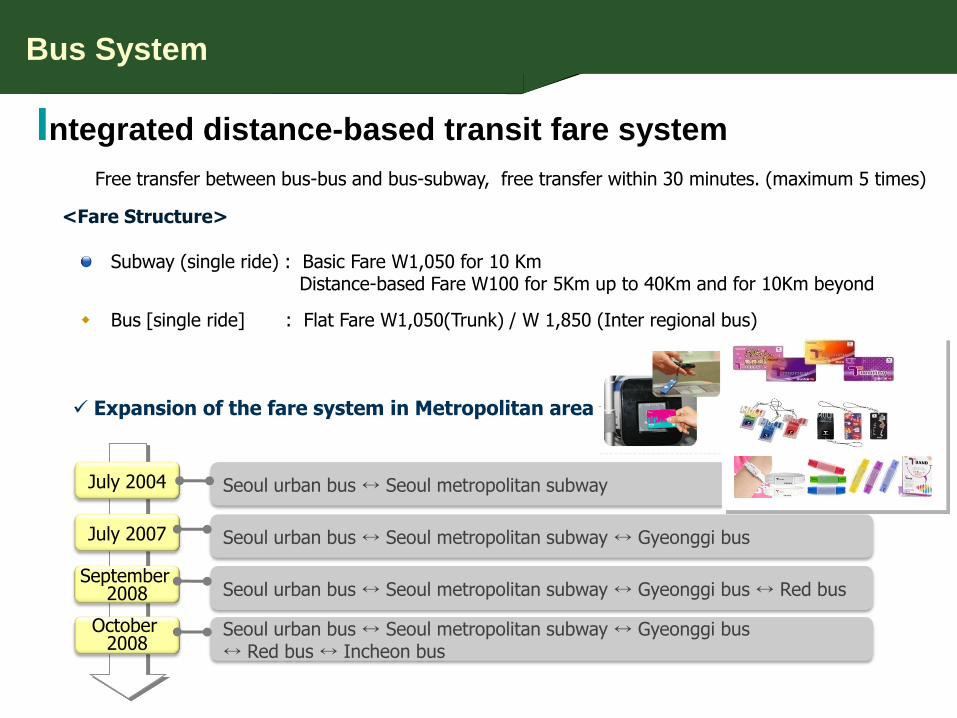
Integrated distance-based transit fare system
Free transfer between bus-bus and bus-subway, free transfer within 30 minutes. (maximum 5 times)
<Fare Structure>
July 2004
July 2007
September 2008
October 2008
Seoul urban bus ↔ Seoul metropolitan subway
Seoul urban bus ↔ Seoul metropolitan subway ↔ Gyeonggi bus
Seoul urban bus ↔ Seoul metropolitan subway ↔ Gyeonggi bus ↔ Red bus
Seoul urban bus ↔ Seoul metropolitan subway ↔ Gyeonggi bus ↔ Red bus ↔ Incheon bus
Expansion of the fare system in Metropolitan area
Subway (single ride) : Basic Fare W1,050 for 10 Km Distance-based Fare W100 for 5Km up to 40Km and for 10Km beyond
Bus [single ride] : Flat Fare W1,050(Trunk) / W 1,850 (Inter regional bus)
Bus System
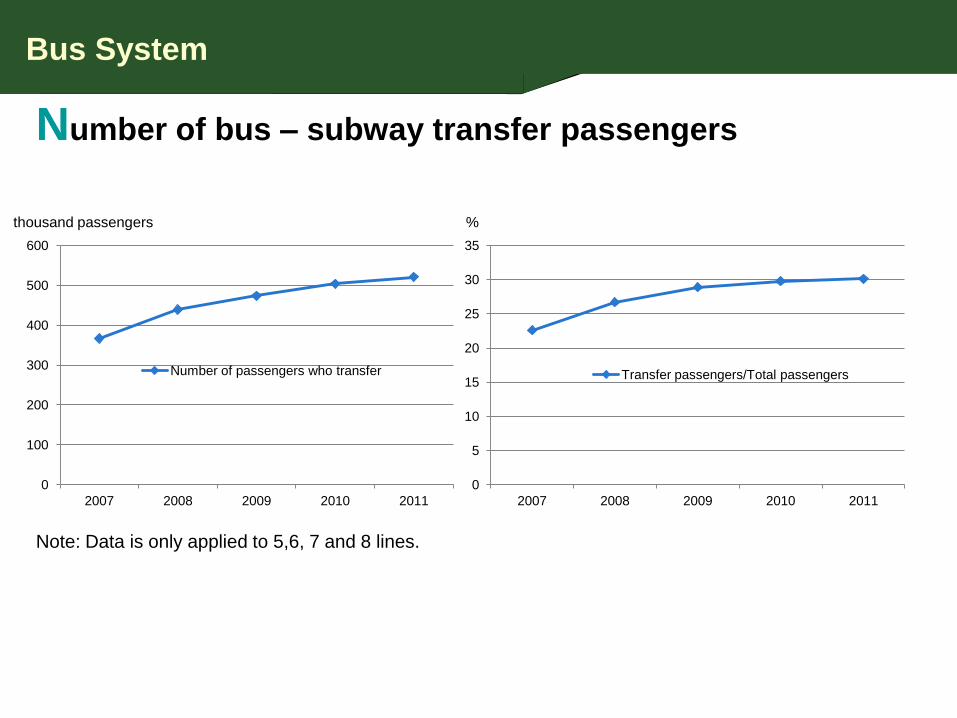
Number of bus – subway transfer passengers
Bus System
0
100
200
300
400
500
600
2007 2008 2009 2010 2011
Number of passengers who transfer
0
5
10
15
20
25
30
35
2007 2008 2009 2010 2011
Transfer passengers/Total passengers
thousand passengers %
Note: Data is only applied to 5,6, 7 and 8 lines.

Bus management system
For Public
• Route and operation Info • Bus Arrival Time
BIT
Internet Mobile ARS
• Real-time Bus location Info •Interval and operation Info
•Bus Interval Info •Bus Operation Info
Bus Company
• Bus Location • Allocating Bus • Notice
-Real-time Bus Operation Info -Bus Operation DB
-Real-time Bus Operation Information
-Route and Transfer Info
Seoul BMS
Bus System

Median bus lanes
For faster and reliable bus operation
To improve passengers’ convenience by comfortable shelter, transfer center
- 12 corridors of 115.3km (210 km including planned corridors)
Under Operation
Plan for 2013
Plan for 2014 - 2016
After 2017
Bus System

Cheongnyangni Transportation Center, July. 2005
Yeoido Transportation Center
Seoul Station Center
Bus System
Transportation centers

Night Bus
26
Implemented on two pilot routes (N37 and N26) using 6 buses for each route
Service hour: from midnight until 3:30am
Service interval: 35 ~ 40 minutes
Fare: 1,850 KRW (higher than regular fare)
Bus System

Electric bus pilot project
EV Bus in Namsan
Type Category Features
Vehicle
Weight 10.7 ton
Size 11m(Length) × 2.49m(Width) ×
3.5m(Height)
Engine Drive Motor 240kW (322hp)
Battery Lithium-ion polymer(80kWh)
Performance
Top speed 100km/h
Gradability* 30%(17˚)
Distance per Charging
110km (Driving at 60km/h)
Charging time 20mins(Rapid charging)
Namsan EV Bus Routes
Line No. 02
Line No. 05
Line No. 03
Bus System

Transit Mall
28
Target road: Yonsei-ro (550 meter)
Opened in Jan. 2014
Provision of more pedestrian and
bike spaces
Allowed to run for buses and
emergency vehicles
Taxies are allowed to travel during
midnight to 6am
Bus System
Travel Demand Management and
Initiatives Ⅳ.
30
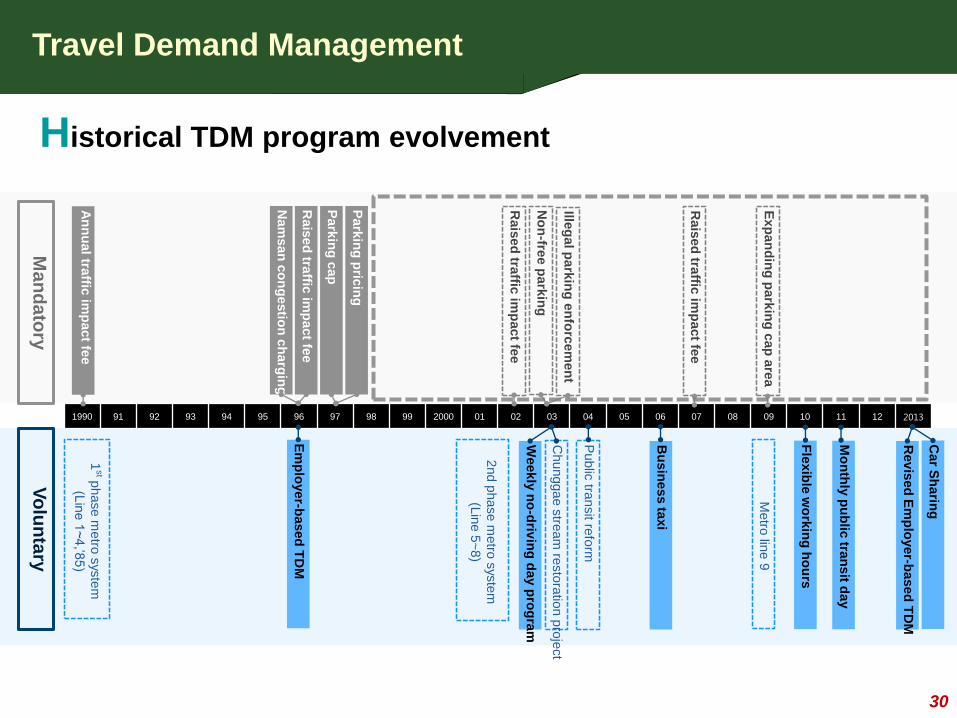
1990 91 92 93 94 95 96 97 98 99 2000 01 02 03 04 05 06 07 08 09 10 11 12 2013
Em
plo
yer-b
ased
TD
M
Rais
ed
traffic
imp
act fe
e
Park
ing
pric
ing
Weekly
no
-driv
ing
day p
rog
ram
Public
transit re
form
Bu
sin
ess ta
xi
Fle
xib
le w
ork
ing
ho
urs
Ma
nd
ato
ry
Vo
lun
tary
An
nu
al tra
ffic im
pact fe
e
1st p
hase m
etro
syste
m
(Lin
e 1
~4,’8
5)
2nd p
hase m
etro
sys
tem
(Lin
e 5
~8)
Metro
line 9
Car S
harin
g
No
n-fre
e p
ark
ing
Rais
ed
traffic
imp
act fe
e
Illeg
al p
ark
ing
en
forc
em
en
t
Mo
nth
ly p
ub
lic tra
nsit d
ay
Exp
an
din
g p
ark
ing
cap
are
a
Chunggae s
tream
resto
ratio
n p
roje
ct
Rais
ed
traffic
imp
act fe
e
Nam
san
co
ng
estio
n c
harg
ing
Park
ing
cap
Rev
ised
Em
plo
yer-b
ased
TD
M
Historical TDM program evolvement
Travel Demand Management
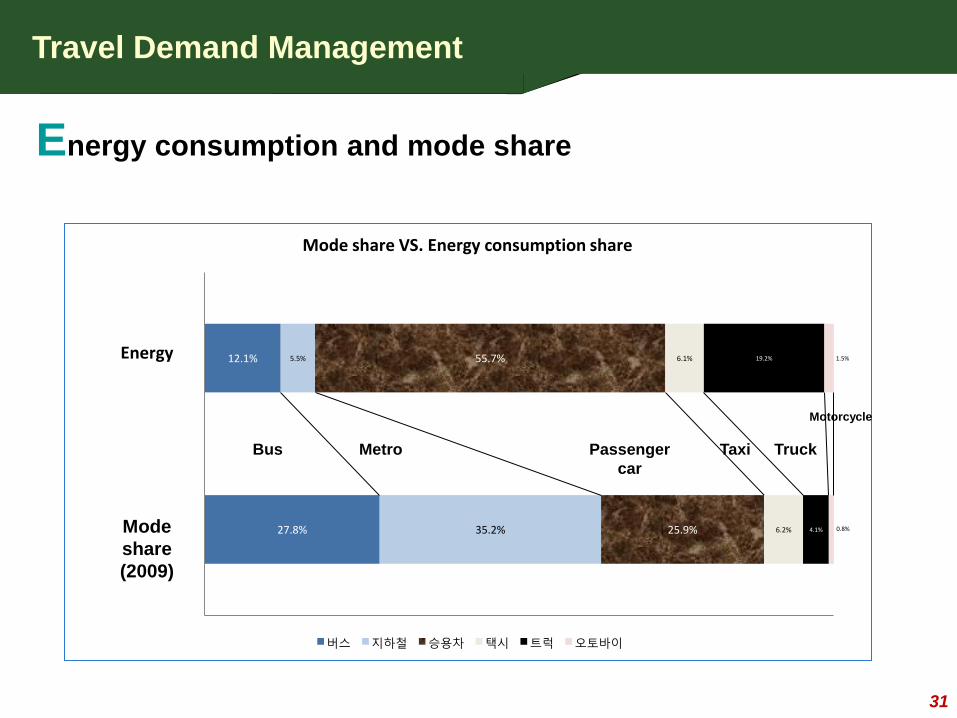
Energy consumption and mode share
31
27.8%
12.1%
35.2%
5.5%
25.9%
55.7%
6.2%
6.1%
4.1%
19.2%
0.8%
1.5%
수단분담률(2009)
에너지
Mode share VS. Energy consumption share
버스 지하철 승용차 택시 트럭 오토바이
Energy
Mode
share
(2009)
Bus Metro Passenger
car
Taxi Truck
Motorcycle
Travel Demand Management

Why?
- Reducing the amount of traffic
- Securing revenue for transit system improvement
Who pays?
- Building owners (≥1,000 ㎡ of Total floor area)
Equation for annual traffic impact fee
- Floor area × Traffic impact fee unit × Coefficient by building type
Note: Revenue (2011) of about 84 billion KRW (70 million USD)
Jan. 1990 May 1995 Oct. 1996
Total floor area <3,000㎡, < 10 parking spaces 350
350 350
Total floor area ≥ 3,000㎡, ≥10 parking spaces 500 700
Traffic impact fee unit (unit: KRW/m2)
32
Travel Demand Management
Annual traffic impact fee

15. Business taxi
16. Shuttle bus operation for customers
17. Commuting bus operation
18. Installment of parking guidance system
21. Elimination of free parking
22. Reduction of parking space
23. Employee parking restriction
24. Others
Incentives for the employer-based TDM: reduction of traffic impact fee
Different reduction rates for different employer-based TMD programs
Employer-Based TDM
⇒ Average traffic impact fee reduction rate: 17.9% (for the applicants; as of 2010)
1. Number plate rationing program (last digit)
2. Voluntary weekly no driving day program
3. Number plate rationing program (weekday)
4. Number plate rationing program (even & odd)
<Traffic impact fee reduction rate>
Tra
ffic
im
pa
ct fe
e r
ed
uctio
n r
ate
(%)
Program
33
Travel Demand Management
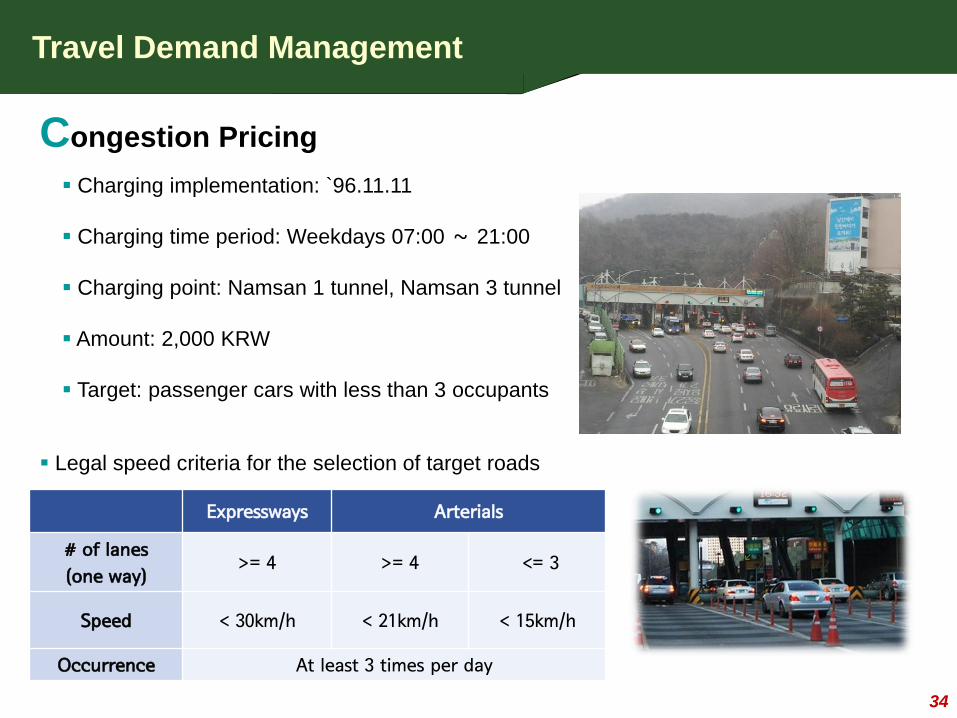
Legal speed criteria for the selection of target roads
Expressways Arterials
# of lanes
(one way) >= 4 >= 4 <= 3
Speed < 30km/h < 21km/h < 15km/h
Occurrence At least 3 times per day
Congestion Pricing
Charging implementation: `96.11.11
Charging time period: Weekdays 07:00 ~ 21:00
Charging point: Namsan 1 tunnel, Namsan 3 tunnel
Amount: 2,000 KRW
Target: passenger cars with less than 3 occupants
Travel Demand Management
34
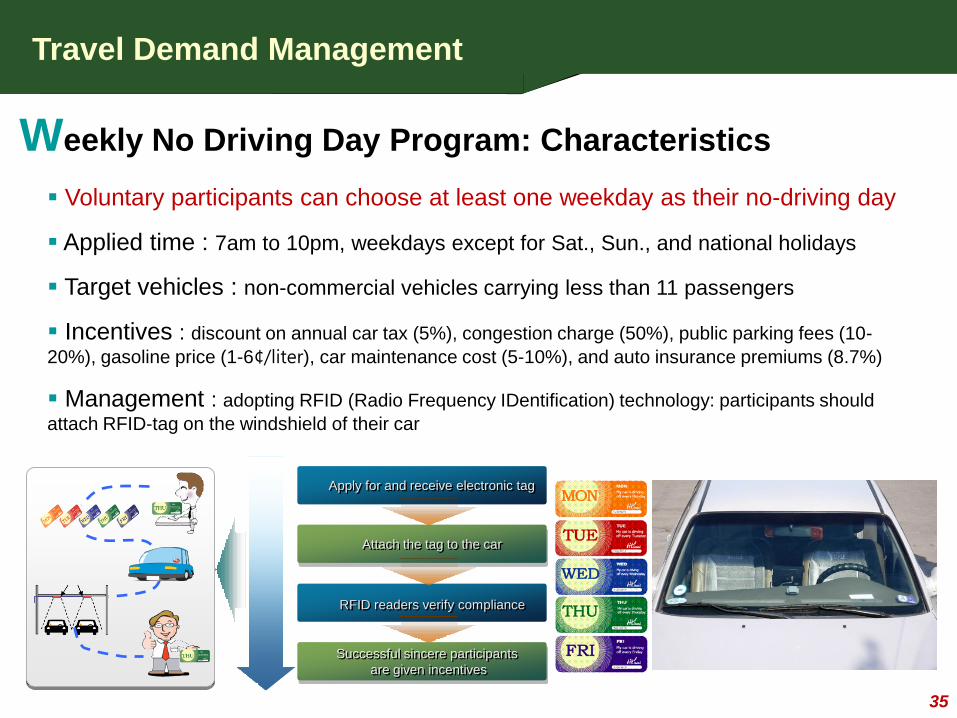
Weekly No Driving Day Program: Characteristics
Voluntary participants can choose at least one weekday as their no-driving day
Applied time : 7am to 10pm, weekdays except for Sat., Sun., and national holidays
Target vehicles : non-commercial vehicles carrying less than 11 passengers
Incentives : discount on annual car tax (5%), congestion charge (50%), public parking fees (10-
20%), gasoline price (1-6¢/liter), car maintenance cost (5-10%), and auto insurance premiums (8.7%)
Management : adopting RFID (Radio Frequency IDentification) technology: participants should
attach RFID-tag on the windshield of their car
35
Travel Demand Management
Apply for and receive electronic tag
Attach the tag to the car
RFID readers verify compliance
Successful sincere participants
are given incentives

Car-sharing system
1대 2대 3~5대 6~10대 11~15대 # of sharing cars :
Sum
Regula
r
Cars
Electric
Cars
Number of
members 349,999 290,222 59,777
Number of cars 1,816 1,474 342
Number of
accumulated users 769,265 691,062 78,203
Number of users
per day 2,775 2,540 202
Number of users
per car each day 1.5 1.7 0.7
Average rental time 4hr 2min 4hr 24min 3hr 49min
Average mileage
per rental (km) 57 74 46
Run by a total of 5 business operators (regular cars : 2, electric cars : 3)
1,816 cars running in 850 sharing stations throughout Seoul (regular car : 1,474, electric car : 342)
# of trips by car-sharing: 7,909 trips/day (0.02% of total trips in Seoul)
36
Travel Demand Management
Big Data in Transportation Ⅴ.

Background
Big Data
2.5 quintillion bytes of data are generated every day!
- A quintillion is 1018
Data come from many quarters
- Social media sites
- Sensors
- Digital photos
- Business transactions
- Location-based data
Source: IBM http://www-01.ibm.com/software/data/bigdata/
Definition
Big Data
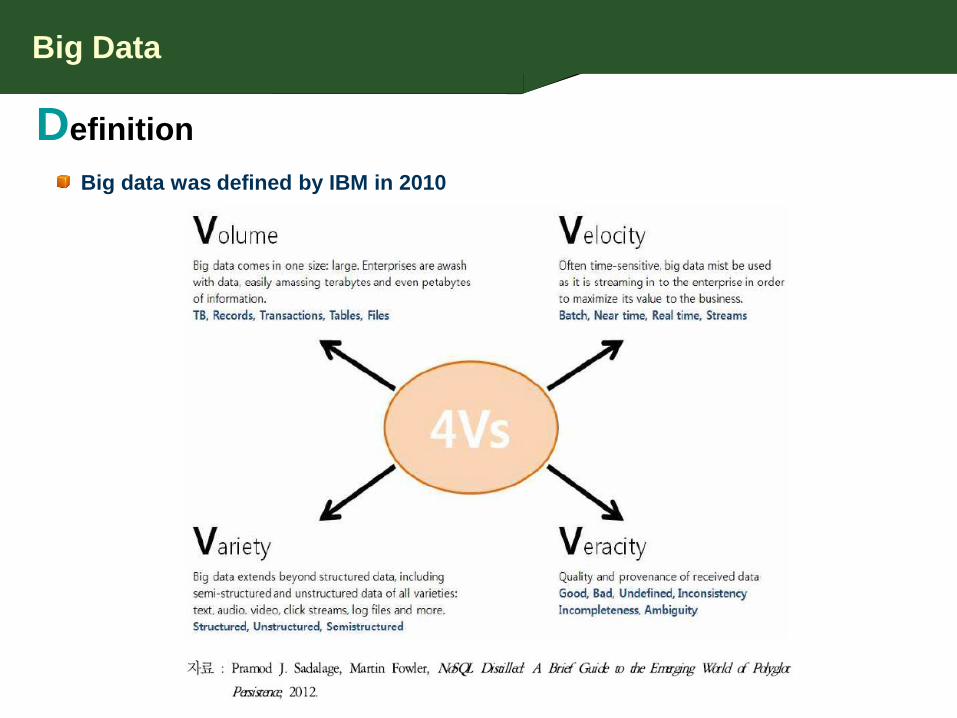
Big data was defined by IBM in 2010
Big Data
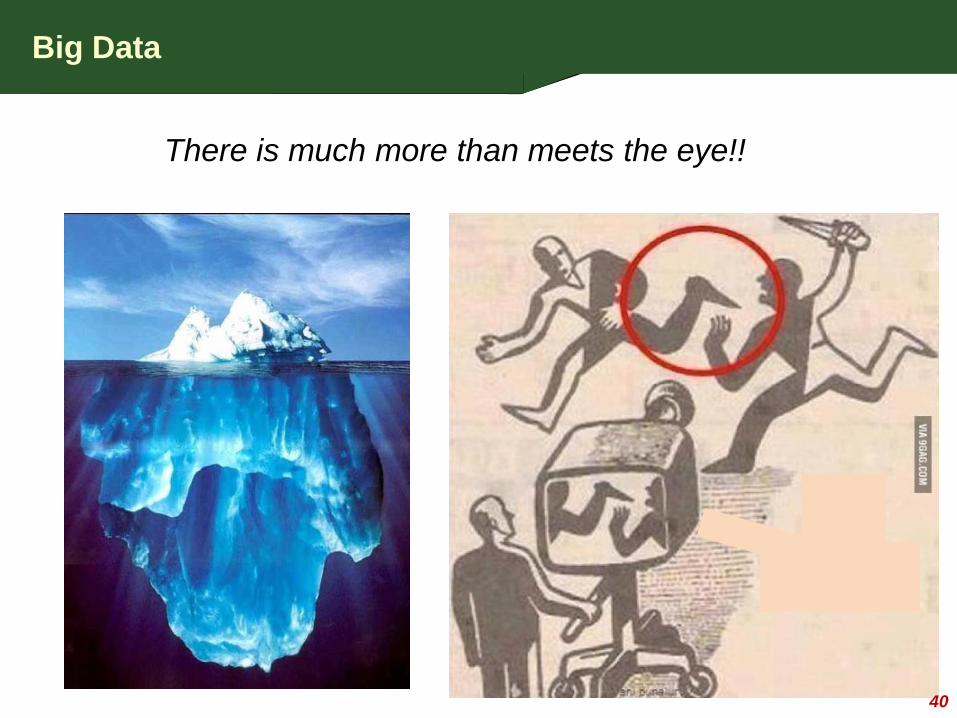
There is much more than meets the eye!!
40
Big Data
41
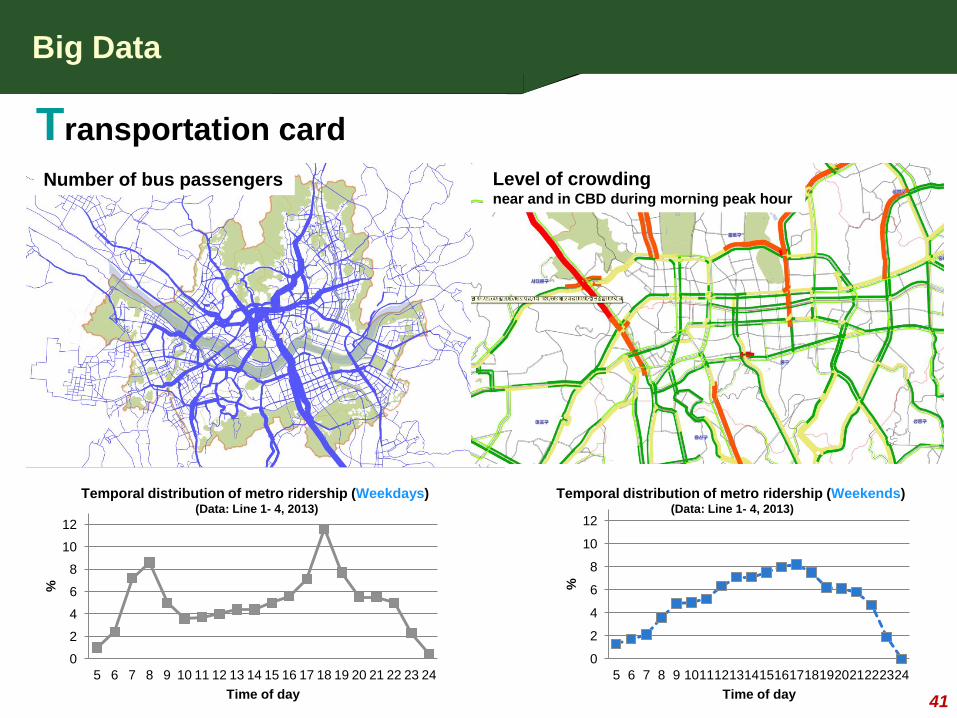
Transportation card
Number of bus passengers Level of crowding near and in CBD during morning peak hour
0
2
4
6
8
10
12
5 6 7 8 9 10 11 12 13 14 15 16 17 18 19 20 21 22 23 24
%
Time of day
Temporal distribution of metro ridership (Weekdays) (Data: Line 1- 4, 2013)
0
2
4
6
8
10
12
5 6 7 8 9 10 11 12 13 14 15 16 17 18 19 20 21 22 23 24
%
Time of day
Temporal distribution of metro ridership (Weekends) (Data: Line 1- 4, 2013)

Big Data
42
Archived traffic speed
Congested road segments with more than
or equal to two hours of congestion per day
(hourly speeds of less than 10 km/h)
Congested road segments with more than
or equal to two hours of congestion per day
(hourly speeds of less than 15 km/h)
0% 2%
19%
46%
63%
73% 79%
84% 87%
0% 1%
12%
39%
58%
70% 76% 81%
85%
0%
20%
40%
60%
80%
100%
5 10 15 20 25 30 35 40 45
Cum
ula
tive
pro
port
ion
Threshold speed (km/h)
평일
주말
weekdays
weekend
Big Data
A device for collecting taxi operation data
- Location, passenger boarding/alighting, fare, operation time
100% installment of DTG for 72,189 Seoul Taxis
No. Type of
Taxi
Data Collected Date/Time
Company Name
Company
ID
Vehicle Registration Number
Driver’s
ID
Boarding Time
Alighting Time
Service Distanc
e Fare
Nighttime Extra
Charge
Type of Paymen
t
Boarding x-coordinate
Alighting y-coordinate
Non-service Distanc
e
1 Corporati
on 2013-03-25
0:00 한양상운(주)
301200006 서울33사14
33 3323
2013-03-24 23:52
2013-03-25 0:00
3005 3700 Normal Credit Card
127057771 37592720 3809
2 Corporati
on 2013-03-25
0:00 삼익택시(주)
301200011 서울34사25
18 4970
2013-03-24 23:41
2013-03-25 0:00
6554 6900 Normal Cash 126907898 37519421 1699
3 Owner-driven
2013-03-25 0:00
301200016 서울33사26
23 5127
2013-03-24 23:55
2013-03-25 0:00
1525 2400 Extra
Charged Cash 126546260 37362755 686
Taxi digital Tachograph (DTG)

Big Data
44
Taxi digital Tachograph (DTG)
1
2
3
4
5
6
7
Time of day
%
0.0
0.2
0.4
0.6
0.8
1.0
0
40
80
12
0
16
0
20
0
24
0
28
0
32
0
36
0
40
0
44
0
48
0
52
0
56
0
60
0
Daily travel distance (km)
Cu
mu
lati
ve
den
sity
Seoul Taxi Operational Characteristics
During 8 a.m. – 9 a.m.
Spatial distribution of Seoul taxi trips
During 12 a.m. – 1 a.m.
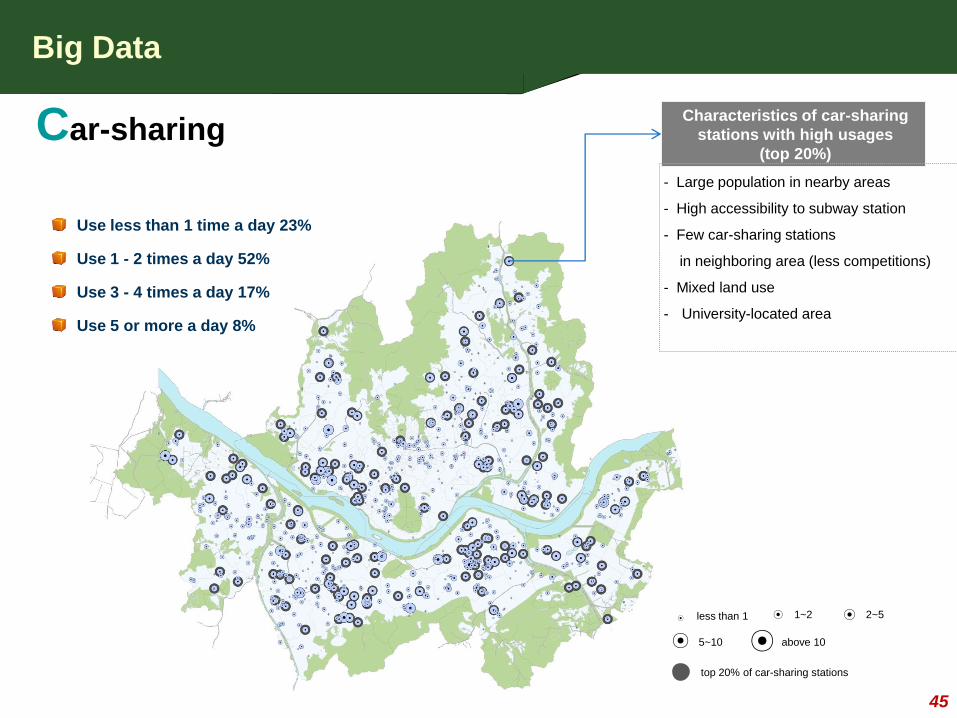
Car-sharing
Big Data
less than 1 1~2 2~5
5~10 above 10
⊙ ⊙ ⊙
⊙ ⊙ top 20% of car-sharing stations
Characteristics of car-sharing
stations with high usages
(top 20%)
- Large population in nearby areas
- High accessibility to subway station
- Few car-sharing stations
in neighboring area (less competitions)
- Mixed land use
- University-located area
Use less than 1 time a day 23%
Use 1 - 2 times a day 52%
Use 3 - 4 times a day 17%
Use 5 or more a day 8%
45
Car-sharing
Big Data
0.00
0.20
0.40
0.60
0.80
1.00
1.20
1.40
1.60
1.80
00~
01
01~
02
02~
03
03~
04
04~
05
05~
06
06~
07
07~
08
08~
09
09~
10
10~
11
11~
12
12~
13
13~
14
14~
15
15~
16
16~
17
17~
18
18~
19
19~
20
20~
21
21~
22
22~
23
23~
24
도심 교량 간선 시계 나눔카 대여
시간
Peak time of Car-sharing use is different from that of traffic volume
More rentals during day time and night time
time
<Traffic volume and shared car rentals by time of day>
46
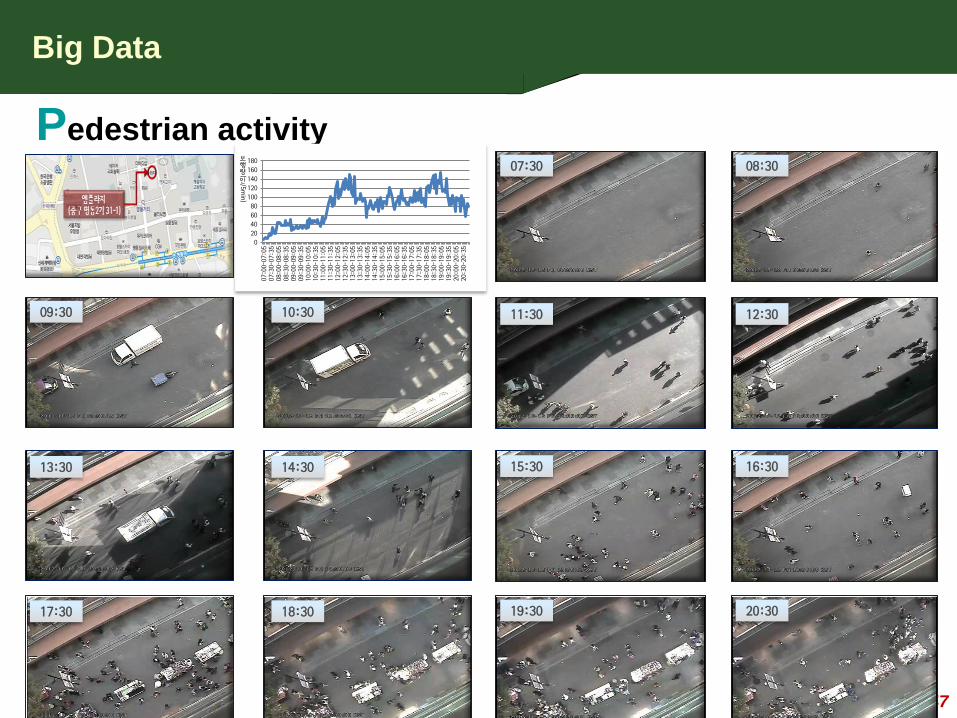
Pedestrian activity
Big Data
47
07:30 08:30
09:30 10:30 11:30 12:30
13:30 14:30 15:30 16:30
17:30 18:30 19:30 20:30
0
20
40
60
80
100
120
140
160
180
07:0
0-07
:05
07:3
0-07
:35
08:0
0-08
:05
08:3
0-08
:35
09:0
0-09
:05
09:3
0-09
:35
10:0
0-10
:05
10:3
0-10
:35
11:0
0-11
:05
11:3
0-11
:35
12:0
0-12
:05
12:3
0-12
:35
13:0
0-13
:05
13:3
0-13
:35
14:0
0-14
:05
14:3
0-14
:35
15:0
0-15
:05
15:3
0-15
:35
16:0
0-16
:05
16:3
0-16
:35
17:0
0-17
:05
17:3
0-17
:35
18:0
0-18
:05
18:3
0-18
:35
19:0
0-19
:05
19:3
0-19
:35
20:0
0-20
:05
20:3
0-20
:35
보행량(
인/5min
)
Big Data
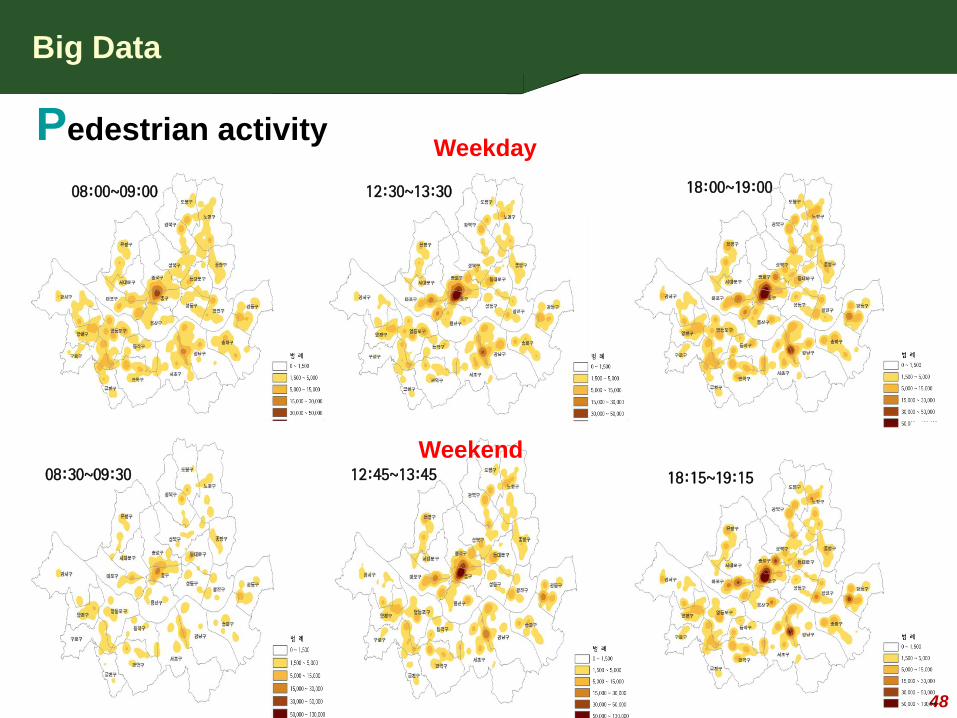
48
Pedestrian activity
08:00~09:00 18:00~19:00 12:30~13:30
08:30~09:30 18:15~19:15 12:45~13:45
Weekday
Weekend
Big Data
49
What can we do with the big data?
Pin-pointing problematic areas
Balancing supply and demand of services
Improving quality of services
Increasing operational efficiency
Facilitating data collection
Saving money + Saving resources + …

Thank you!! [email protected]


![여성과 남성의 15대 직업 - klsi.orgklsi.org/sites/default/files/field/[2018-06]_여성과 남성의 15대 직업... · 둘째, 여성 15대 직업과 남성 15대 직업으로](https://static.fdocuments.net/doc/165x107/5f0890b97e708231d422a3cf/e-e-15eoe-klsi-2018-06e-e-15eoe-.jpg)
![[Seoul e government] seoul map geospatial information platform](https://static.fdocuments.net/doc/165x107/58776db91a28ab5b568b5269/seoul-e-government-seoul-map-geospatial-information-platform.jpg)

