Climate Change – Greenhouse Gases Background Greenhouse Effect Gases absorb heat
Urban Transport Policies andGreenhouse Gases Emissions in Brussels
Paul Safonov +), Vincent Favrel, and Walter HecqCentre for Economic and Social Studies on the Environment (CEESE),
Université Libre de Bruxelles - Free University of Brussels (ULB)44 Avenue Jeanne, CP 124, Brussels, B-1050, Belgium
Tel: +32 2 650-3588, Fax: +32 2 650-4691,E-mail: [email protected]
Abstract
The emissions of the greenhouse gases (GHG) from transportation in Belgium, andespecially in the Brussels area, are observed as a major and increasing factor ofenvironmental pressure. This is linked to a growth of economic activity, especially in thetertiary sectors, which require more and more offices, and thus commuting. In the frame ofKyoto Protocol on Climate Change (1997) a target of 7.5% reduction of GHG emissions bythe year 2010 (from the level of 1990) is an accepted Belgian obligation, for whichfeasibility and implementation measures should be assessed.
The aim of the paper is to analyse the GHG emissions from mobility induced by transportand other urban policies. Among main environmental impacts of mobility, the emission ofcarbon dioxide, and consumption of non-renewable fuel (gasoline and diesel-oil) areassessed for a case study of the Brussels-Capital region, comparing the Kyoto frameworkand business-as-usual scenarios.
For this purpose a system of models is being developed, including: forecasts of populationand employment dynamics in accordance to regional economic development, a mobilitymodel, providing scenarios of traffic intensity and its spatial distribution in the region; amodel linking mobility and greenhouse gases (GHG) emission.
Scenario simulations are based on different groups of assumptions and targets forimprovement of policy making in regional and urban planning in Brussels, in particular, fortransport policy in the urban area and its surroundings, office stock and marketdevelopment, regulations on vehicles use and composition of park of vehicles, road taxationand other environmental instruments, contribution to Kyoto Protocol targets for the GHGemissions abatement.
+) The corresponding author, permanently at the Institute of Control Sciences,
Russian Academy of Sciences, 65 Profsoyuznaya, Moscow, 117806, Russia.E-mail: [email protected]
Sixth Biennial Conference of the International Society for Ecological Economics (ISEE 2000)"People and Nature: Operationalising Ecological Economics", Canberra, Australia, July 5-8, 2000
2
CONTENTS
ABSTRACT ................................................................................................................................................. 1
INTRODUCTION........................................................................................................................................ 3
1. ROAD TRANSPORT AND CLIMATE CHANGE: THE PROBLEM DEFINITION.......................... 4
1.1. GREENHOUSE EFFECT AND CLIMATE CHANGE ........................................................................................ 41.2. MOTOR VEHICLE EXHAUST GASES AND THEIR EMISSIONS INTO THE ATMOSPHERE..................................... 51.3. CATALYTIC CONVERTERS - A SOLUTION TO CAR POLLUTION?................................................................ 61.4. BELGIAN CLIMATE POLICY................................................................................................................... 71.5. GREENHOUSE GASES AND TRANSPORT IN BELGIUM................................................................................ 8
2. MODELLING URBAN DEVELOPMENT, MOBILITY AND AIR POLLUTION.............................. 9
2.1. INTEGRATED LAND-USE AND MOBILITY MODELING .............................................................................. 102.2. PASSENGER TRANSPORT MODELING .................................................................................................... 102.3. TRAFFIC DISTRIBUTION MODELS ......................................................................................................... 102.4. URBAN PLANNING ............................................................................................................................. 112.5. LINKING MOBILITY MODELS WITH AIR POLLUTANT EMISSIONS AND NON-RENEWABLE FUEL
CONSUMPTION. .................................................................................................................................. 11
3. DEVELOPMENT OF THE INTEGRATED MOBILITY MODEL FOR THE BRUSSELS-CAPITAL REGION ............................................................................................................................. 13
3.1. CONCEPTUAL STRUCTURE OF THE MODEL AND STEPS OF IMPLEMENTATION. .......................................... 133.2. URBAN DEVELOPMENT ....................................................................................................................... 143.3. MOBILITY ......................................................................................................................................... 153.4. NETWORK MODEL OF PRIVATE ROAD TRANSPORT................................................................................. 173.5. SIMULATION TOOLS FOR TRANSPORT MODELING.................................................................................. 173.6. A MODEL, LINKING THE MOBILITY AND AIR-POLLUTION IN THE REGION. ............................................... 18
4. PLAN IRIS: CONSIDERATIONS FOR SCENARIOS......................................................................... 23
4.1. ACTIONS ON URBAN STRUCTURE........................................................................................................ 234.2. ACTIONS ON PUBLIC TRANSPORT........................................................................................................ 254.3. ACTIONS ON THE PARKING OF PRIVATE CARS...................................................................................... 264.4. ACTIONS ON AUTOMOBILE TRAFFIC.................................................................................................... 274.5. ACTIONS IN FAVOR OF WALKING AND CYCLING .................................................................................. 27
5. SCENARIO SIMULATIONS AND DISCUSSION OF THE RESULTS ............................................. 28
6. CONCLUSIONS .................................................................................................................................... 34
ACKNOWLEDGEMENTS ....................................................................................................................... 35
REFERENCES........................................................................................................................................... 35
3
Introduction
The earth’s climate has been evolving continuously over many millennia. The last twocenturies, however, have witnessed the development of the greenhouse problem, whichthreatens to change climate in an unprecedented manner. Greenhouse gases (GHG) in theearth’s atmosphere allow incoming solar radiation to pass through relatively unimpeded, butpartially absorb and re-emit outgoing infrared terrestrial radiation. This natural process raisesthe earth’s average temperature from –18 ºC to +15 ºC, and is hence, vital for life on earth.
Since the Industrial Revolution, anthropogenic activities have been increasing theatmospheric concentrations of greenhouse gases beyond their natural levels, resulting in theenhanced greenhouse effect. This causes an increase in global temperatures, which is knownas global warming. This warming can be amplified through positive feedbacks, such asincreases in water vapour, or reduced through negative feedbacks, such as increases instratospheric aerosols. The sum of all these potential changes is referred to as climate change.
In the frame of Kyoto Protocol on Climate Change (1997) a target of 7.5% reduction ofGHG emissions by the year 2010 (from the level of 1990) is an accepted Belgian obligation,for which feasibility and implementation measures should be assessed. The emissions of thegreenhouse gases from transportation in Belgium, and especially in the Brussels area, areobserved as a major and increasing factor of environmental pressure. This is linked to agrowth of economic activity, especially in the tertiary sectors, which require more and moreoffices, and thus commuting.
Road traffic in the Brussels-Capital Region has continuously been increasing during the lastdecade. The reasons of this trend lie mainly in the urban exodus, the growth of employmentin the Brussels area and its peripheral region, and the constantly increasing populationmotorization rate. Recent studies (Plan IRIS, 1993) predict the complete saturation of theroad network before the year 2005 in the Belgian capital.
The assessment of the impacts of this road traffic on the environment in general, and on airquality, in particular, helps not only to evaluate the actual situation but also to assess thepossible effects of measures towards a more sustainable transport system.
Today it is generally accepted that transport policies alone will not achieve a sustainable levelof fuel consumption and emissions. A consensus is also emerging that it is necessary to co-ordinate land use changes with transport measures in order to achieve an environmentally andeconomically sustainable transport system.
Transport and land-use have to be considered as an integrated system. But, as Lobe P.,Duchâteau H. (1998) advise, in many urban areas this system resembles a spiral of urbandecline, caused by potentially vicious interactions of this system at an urban level.
Many traditional ways to reduce the pollution from transport, such as catalytic converters,road pricing, and even improved public transport, do not properly tackle the whole problem:the demand for transport itself needs to be managed rather than try to satisfy a thirst thatcan never be quenched. Urban planning can assist this management process.
This present study is undertaken in the Centre for Economic and Social Studies on theEnvironment (CEESE) of Université Libre de Bruxelles (ULB). As part of the «Sustainablemobility in the Brussels-Capital Region» project, financed by SSTC, CEESE-ULB iscurrently developing a methodology for the assessment of the physical effects and externalcosts caused by air pollution generated by road traffic in an urban area. While considering theimpacts of air pollution (e.g. in terms of building deterioration, health effects, climate change,
4
etc.), the general approach associates to traffic a sequence based on the five following steps:human activities, emissions, immissions, physical impacts and external costs. This is theclassical approach namely used in major studies such as ExternE (European Commission,1995) for the assessment of externalities in the energy sector and which has recently beenupdated for its application to the transport sector.
Within this project a new integrated model is being synthesised for analysis of influence ofurban development and transport policies on the mobility of people in a metropolitan area,and respective air-pollution resulting from this mobility. The software was developed to linkthe mobility model, road traffic assignment with TRIPS (1999) package, and emissionscalculations.
This paper is aimed at describing the above approach to modelling and analysis of thegreenhouse gases (GHG) and other air-pollutant emissions from urban mobility in the ofBrussels-Capital region. After introducing the problem of greenhouse gases and climatechange and surveying recent state of related issues of urban development and mobility, thepaper presents the main concept and the structure of such integrated models system. Themethod of emission calculations is described along with the transportation model. Finally,different scenarios for the year of 2005, based on mainly the assumptions of the RegionalMobility Plan "IRIS" (Plan IRIS, 1993-1997), are considered, assessing the environmentalimpact of actual policy in regional and urban planning and possible measures in order toreduce the air pollution.
1. Road Transport and Climate Change: The Problem Definition
1.1. Greenhouse effect and climate changeThe phenomenon of thermal infrared (IR) radiation absorbance by the Earth's atmosphere ispopularly known as the “greenhouse effect,” and the IR-active gases responsible for the effectare referred to as “greenhouse gases.” The rapid increase in concentrations of greenhousegases since the industrial period began has given rise to concern over potential resultantclimate changes.
The principal six greenhouse gas concentrations that are covered by the Kyoto Protocol onClimate Change (1997) are carbon dioxide (CO2), methane (CH4), nitrous oxide (N2O), andalso hydrofluorocarbons (HFCs), perfluorocarbons (PFCs) and sulfur hexafloride (SF6).
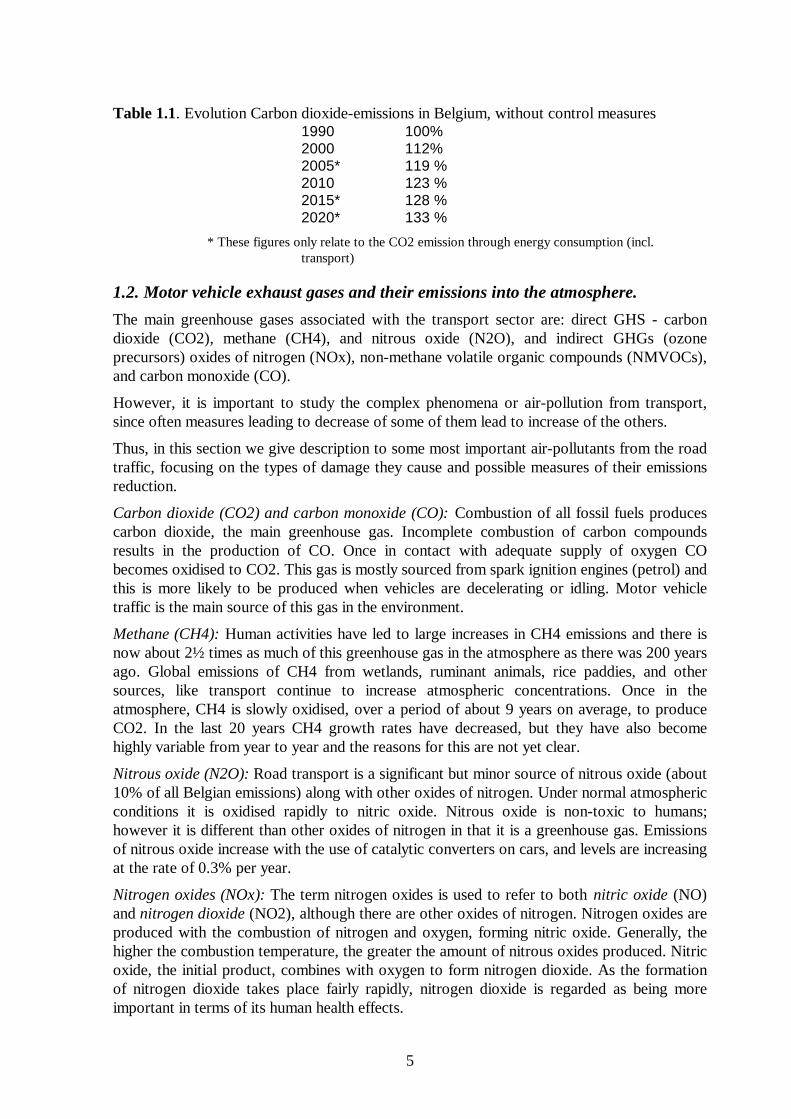
A good indicator for the situation in Belgium are the emissions of carbon dioxide (CO2):indeed, in 1994 that gas accounted for approx. 82% of greenhouse gas emissions. Between1990 and 1994 CO2 emissions increased by approx. 6.3%. If no measures were taken, theemission of CO2 would continue to rise, as is indicated in the table 1.1 below.
Much of the recent debate on transport has been devoid of environmental consideration. Butgiven our responsibilities towards environmental protection, such an approach is partial andunacceptable. Transport has been perhaps the highest profile environmental issue in Belgiumover the past decade. And what has come out clearly of these years, it is that if we do nottackle traffic growth then we will be unable to tackle transport's impact on climate changeand on urban air pollution.
5
Table 1.1. Evolution Carbon dioxide-emissions in Belgium, without control measures1990 100%2000 112%2005* 119 %2010 123 %2015* 128 %2020* 133 %
* These figures only relate to the CO2 emission through energy consumption (incl.transport)
1.2. Motor vehicle exhaust gases and their emissions into the atmosphere.The main greenhouse gases associated with the transport sector are: direct GHS - carbondioxide (CO2), methane (CH4), and nitrous oxide (N2O), and indirect GHGs (ozoneprecursors) oxides of nitrogen (NOx), non-methane volatile organic compounds (NMVOCs),and carbon monoxide (CO).
However, it is important to study the complex phenomena or air-pollution from transport,since often measures leading to decrease of some of them lead to increase of the others.
Thus, in this section we give description to some most important air-pollutants from the roadtraffic, focusing on the types of damage they cause and possible measures of their emissionsreduction.
Carbon dioxide (CO2) and carbon monoxide (CO): Combustion of all fossil fuels producescarbon dioxide, the main greenhouse gas. Incomplete combustion of carbon compoundsresults in the production of CO. Once in contact with adequate supply of oxygen CObecomes oxidised to CO2. This gas is mostly sourced from spark ignition engines (petrol) andthis is more likely to be produced when vehicles are decelerating or idling. Motor vehicletraffic is the main source of this gas in the environment.
Methane (CH4): Human activities have led to large increases in CH4 emissions and there isnow about 2½ times as much of this greenhouse gas in the atmosphere as there was 200 yearsago. Global emissions of CH4 from wetlands, ruminant animals, rice paddies, and othersources, like transport continue to increase atmospheric concentrations. Once in theatmosphere, CH4 is slowly oxidised, over a period of about 9 years on average, to produceCO2. In the last 20 years CH4 growth rates have decreased, but they have also becomehighly variable from year to year and the reasons for this are not yet clear.
Nitrous oxide (N2O): Road transport is a significant but minor source of nitrous oxide (about10% of all Belgian emissions) along with other oxides of nitrogen. Under normal atmosphericconditions it is oxidised rapidly to nitric oxide. Nitrous oxide is non-toxic to humans;however it is different than other oxides of nitrogen in that it is a greenhouse gas. Emissionsof nitrous oxide increase with the use of catalytic converters on cars, and levels are increasingat the rate of 0.3% per year.
Nitrogen oxides (NOx): The term nitrogen oxides is used to refer to both nitric oxide (NO)and nitrogen dioxide (NO2), although there are other oxides of nitrogen. Nitrogen oxides areproduced with the combustion of nitrogen and oxygen, forming nitric oxide. Generally, thehigher the combustion temperature, the greater the amount of nitrous oxides produced. Nitricoxide, the initial product, combines with oxygen to form nitrogen dioxide. As the formationof nitrogen dioxide takes place fairly rapidly, nitrogen dioxide is regarded as being moreimportant in terms of its human health effects.
6
Nitrogen dioxide is a reddish-brown gas and which gives the city smog its colour. Globally,nitrogen oxides resulting from human activity are only 8% of naturally produced nitrogenoxides which are formed by bacterial and volcanic action and lightning. However urban levelsof NOx can elevate this concentration by several hundred times under certain atmosphericconditions. Nitrogen dioxide, when washed out of the atmosphere by rain combines withwater to form nitric acid, one of the sources of acid rain and tropospheric ozone O3.
Modelling studies have shown that the hourly mean concentration of nitrogen dioxide wouldfrequently exceed the EC standard of 200 µg/m3 near any road carrying more than 10 000fast moving vehicles an hour if these are mostly not fitted with catalytic converters. Underconditions of bright sunlight and clear air, nitrogen oxides react with hydrocarbons toproduce photochemical smog. Photochemical smogs contain a wide variety of organiccompounds that are harmful to a varying degree. In still air conditions, the photochemicalsmog concentrates over its source. However as the amount of nitrogen oxides andhydrocarbons increase so the secondary pollutants are produced a long distance away fromtheir original source.
(Tropospheric or Ground level) Ozone (O3): Ozone is produced when sunlight reacts withnitrogen dioxide and radicals derived from hydrocarbons (VOCs). The worst pollutionepisodes are caused by vehicle pollution. When ozone levels are over 100 ppb (200 µg/m3)human reactions are irritated eyes, nose and throat, coughing, chest pain and nausea.
Volatile Organic Compounds (VOCs) are hydrocarbons and their derivatives produced fromthe burning of fuel and from the evaporation of fuel and halogenated compounds derive fromthe manufacture and maintenance of vehicles and aircraft. Benzene is probably the mostimportant VOC from transport, 78% from petrol engine exhaust and 9% from diesel exhaust.No safe level of Benzene is known, although it is generally recommended that the standardshould be 5 parts per billion (ppb) per running average, to be reduced to 1 ppb at a later date.Catalytic converters when working properly can remove up to 90% of VOCs.
Particulates (particulate matters - PM) are a complex mixture of solid and liquid matter, fromroad dusts and industry and burning of coal or incineration. Secondary particulates are thoseformed by reactions with other pollutants, and can be formed by the transformation ofgaseous emissions such as oxides of sulphur and nitrogen and VOCs.
A major source of particulates are diesel exhausts. During last decades emissions of blacksmoke increased significantly related to the growth in road traffic. There is increasing concernover the health effects of Particulates. Road tyres and brakes also contribute Particulates andproduce asbestos, chrome, nickel, copper, zinc, cadmium, cobalt and aluminium. No controlover these emissions can be gained by catalytic converters.
Sulphur dioxide (SO2): The contribution by transport to total sulphur dioxide emission isrelatively small, as the major sources are combustion of coal. However, emissions can besignificant in certain localities such as in harbour areas or in traffic congested streets with ahigh proportion of diesel fuelled vehicles. Sulphur dioxide is particularly harmful when inconcentration with smoke particles or nitrogen dioxide. Acid deposition can affect vegetationas well as damage buildings.
1.3. Catalytic Converters - A solution to car pollution?Catalytic converts increase fuel consumption and therefore carbon dioxide emissions by 3 to10%. In cities, catalytic converters are of little effect as most journeys are below 5 km, andthe catalytic converters are not effective until the exhausts have warmed up. It is predictedthat catalytic converters will continue reducing vehicular emissions until 2006. From that time
7
emissions will increase in line with the growth in vehicle use. However, there is considerablevariation in the emission performance of cars fitted with catalytic converters. A Germangovernment survey found, for instance, that half of the cars monitored failed to meet relevantemissions limits, particularly for carbon monoxide. Cars with high mileage and those driven athigh speeds perform very badly. UK experience has shown that catalysts are being damagedor are failing at a higher rate than predicted. One manufacturer has suggested that a car willon average need a new catalyst every three years.
1.4. Belgian Climate PolicyThere is now widespread acceptance that we must make serious commitment towardstackling climate change through reducing greenhouse gas emissions. The Kyoto Protocol,agreed in December 1997, indicated a global governmental acceptance that climate changewas happening, and that it was likely to have serious implications unless measures were takento combat it. Despite the Belgian Government's clear commitment to greenhouse gasreduction, however, other European states (e.g. Germany, Austria and Denmark) are leadingthe way on emission reduction, with more challenging reduction targets, using shorter timescales for action.
The evolution of the greenhouse gas (GHG) emission reduction target is one of the keycharacteristics of climate policy in Belgium. In 1991, the federal Government took a decisionto adopt as the national target a 5 per cent reduction in energy-related carbon dioxide (CO2 )emissions between 1990 and 2000. In 1994, this target was reiterated by the federal andregional governments and the National Programme for Reducing CO2 Emissions (NPRE)was prepared by a number of working groups, including a Transport group, an Energy group,a CO2 Tax Policy group and a CO2 Science Policy group with the aim of achieving thistarget. Finally, under the EC burden-sharing agreement, the target agreed for Belgium callsfor a 7.5 per cent reduction in the total of all six gases covered by the Kyoto Protocol for thefirst commitment period of 2008-2012.
The National Communication 1 (NC1) clearly indicated that the implementation of theNational Programme for Reducing CO2 Emissions (NPRE) alone will not be sufficient toreach the national target, as almost half of the necessary reduction in emissions was expectedto come from the combined carbon/energy tax. However, this tax has never materialised inBelgium. Furthermore, other measures envisaged in the NPRE have not been implemented,while those implemented have failed to deliver the effect expected (renewables, energyefficiency and natural gas). As a result, emissions have continued to grow. In 1996, theyreached 128,550 Gg CO2 according to the recent inventory, against 115,800 Gg in 1990(121,100 Gg adjusted emissions) given in the NC1, which indicates that it would beunrealistic to expect the 5 per cent reduction target to be reached before 2000. The attentionof policy-makers was geared to the post-2000 period and that a new Policy Plan forReduction of GHG Emissions, due by the end of 1999, was expected to lay down in a singleframework all the policies necessary to achieve the target under the Kyoto Protocol. Anotherplan prepared in 1999 was the Sustainable Development Policy Plan, in which climate changewas one of the key issues.
In the NC2 the total methane (CH4) emissions in Belgium were projected to decrease byabout 22 per cent in 2005 compared to the 1990 level, reflecting the decrease in emissionsfrom agriculture and waste. In contrast, N2O emissions were expected to increase by 16 percent over the same period. This increase was attributed to the growth in emissions fromtransport, the share of which in total N2O emissions was expected to increase from 3 per centin 1990 to 16 per cent in 2005.

8
The total GHG emissions of Belgium for 1990 were estimated at 136,895 Gg of CO2
equivalent in the recent inventory submission, which is equal to the figure reported in theNC2 and is approximately 2 per cent higher than the estimates in the NC1. The differencestems from revisions of CO2 estimates only. CO2 is by far the most important gas in Belgium,with emissions estimated at 114,033 Gg in 1990, or 83 per cent of the total emissions. Thiswas followed by CH4, which made up 9.7 per cent, and N2 O, which accounted for the rest.Between 1990 and 1996, total emissions grew by 7.2 per cent to reach 146,820 Gg, a growthprimarily attributed to the growth of CO2 emissions by 9.2 per cent and N2 O emissions by 14per cent, while CH4 emissions declined by 7.3 per cent.
1.5. Greenhouse gases and Transport in BelgiumAcross the Belgium the transport sector is responsible for about 20% of CO2 emissions (Fig1.2), of which about 85% comes from road traffic. The transport sector has seen one of thefastest growth in emissions in recent years. But the transport sector also offers some of themost clear possibilities for controlling emissions - but only so long as traffic levels can bebrought to sustainable levels. Recent shifts in transport policy have acknowledged thatgreater fuel efficiency, cleaner vehicles and change in public attitudes towards transport arerequired in an attempt to control emissions from transport.
Figure 1.2. CO2 Emissions from Transport in Belgium(line - % to total emissions; histogram - absolute values in thousand Gg)
Source: UNFCCC, FCCC/IDR.2/BEL, 27 July 2000
As in many other EC countries transport was an important and growing source of emissionsin Belgium, and virtually half of the measures envisaged in the National Programme forReducing CO2 Emissions (NPRE), including economic instruments, regulations and physicalplanning, targeted emissions originating from this sector. These measures were implementedby different levels of government, with the primary objective of solving some urgent problemsof the local environment, such as traffic congestion, air pollution, and noise. They wereapplied only partly and the effect achieved was lower than expected, but apart from that, asof 1993, Belgium has seen a slight decrease in transport energy intensity. Even so, Belgiumhas one of the highest road densities in the EC and road transport continued to grow inabsolute terms, with almost unit elasticity between the GDP and the number of cars. At thesame time, rail transport declined.
Measures targeting passenger transport in the NPRE mainly aimed at promoting publictransport and at reducing the traffic in city centres and commuting by car. By imposing strict
0%
5%
10%
15%
20%
25%
30%
1990 1991 1992 1993 1994 1995 1996 1997 19980
5
10
15
20
25
30

9
monitoring of speed limits and by changing price and tariff policy, the NPRE planned toinfluence both the overall efficiency of transportation and the consumption patterns.
In the context of the price and taxation policy, in order to discourage the use of cars forprofessional purposes, limits were set on the deduction of transport costs from professionalincome and higher taxation was imposed on private use of company cars. The use of publictransport was also encouraged by giving exemptions to employer-paid public transport costs.Moreover, as of 1998 the use of bicycles for commuting was stimulated. To counterbalancethe drastic reduction in VAT on car sales from 33 per cent to 19.5 per cent, a new tax onnew cars was introduced in 1992, and in 1993 it was extended to second-hand cars. The taxlevel depends on the car age and engine power, and was believed to be an effective tool topush consumer choice towards smaller and less polluting cars. Finally, in 1995 theEurosticker (Eurovignette) was introduced, as a levy on the use of the road network by heavygoods vehicles (12 tonnes upwards).
Taxes on gasoline and diesel oil in Belgium have risen steadily during the 1990s, virtuallyoffsetting the impact on consumers of declining world oil prices. In 1996, additional excisetaxes were imposed on gasoline, which brought Belgium into the group of EC countrieshaving the highest level of motor fuel taxation. Simultaneously, an excise compensation taxwas levied on diesel cars, which countervailed the lack of a similar increase in the excise taxeson diesel fuel. As a result, in 1999, taxes made up 78 per cent of gasoline prices and 66 percent of diesel fuel prices.
The motor lobby argues that because emissions from cars are falling that manufacturers aredealing with toxic emissions problems, and there is no need to implement traffic reduction inorder to reduce emissions. They argue that the focus should instead be on gross polluters andon buses and lorries, which they claim to be more polluting.
But while emissions may be falling nationally, they are not falling fast enough to meet theGovernment's air quality targets.
As for the relative emission shares of cars, lorries and buses, official emissions inventoriesshow that, for most pollutants in most urban areas, the car is the main source, although inareas where there is still heavy industry this can also be a major factor. A bus with anaverage load is much less polluting per passenger than an average load car. Buses can bemade less polluting through use of low sulphur diesel, which greatly reduces particulateemissions, and conversion to gas-powered vehicles, which reduce pollution still further. In thelonger-term, electric-powered buses and taxis may be required.
The essential fact of air pollution issues in urban areas is that in order to achieve realimprovements in air quality that reductions in traffic volumes are necessary. Improvements topetrol and diesel engines cannot in themselves provide all the solutions to air pollutionproblems. An integrated approach is required to change the demand for mobility and modalchoice.
At regional level, the planning aspects of transport policy were given great importance, whichis also the case of the Brussels-Capital region.
2. Modelling Urban Development, Mobility and Air Pollution
This section presents the approaches and models, which provide the methodological basis ofthe construction of the models system for the Integrated socio-economic-environmentalanalysis of urban mobility, further described in section 3.
10
2.1. Integrated land-use and mobility modelingThere exist several approaches and models, which allow for integrated analysis of three-foldprocess: land-use, mobility, and pollution.
Recent study is implemented with the Professional Transport Planning Package (TRIPS,1999), which includes possibilities of advanced demand modelling, based on informationabout residential areas and main economic activities in the region (using LOGIT models).TRIPS has both road and public transport modules and is open for any exentions, whichmakes it a powerful and rather flexible tool for integrated mobility analysis. TRIPS was usedfor the development of the Brussels Regional Mobility Plan (Plan IRIS, 1993-1997), and thusit is instrumental to carry out extended analysis using already developed data bases andtransport modelling techniques.
Another model in land use-transport modelling forr the Brussels metropolitan area (Lobe P.,Duchâteau H., 1998) was developed within the framework of the ESTEEM research projectto analyse the consequences of implementing different scenarios in urban planning (inparticular the influence of a RER introduction). The model is based on the TRANUSsoftware (T. de la Barra and B. Perez, 1998). The TRANUS provides an intermodaltransport model of passengers’ transport system, and an integrated land-use/transport modelable to simulate the impacts of land-use policies on transport and the impacts of transportpolicies on land-use. Its structure comprises two main components: a land use sub-model anda transport sub-model, which interact dynamically.
Many other approaches and models/packages are known (AMERSFORT, BOYCE ET AL,CALUTAS, CATLAS/NYSYM/METROSIM, DORTMUND, KIM, ITLUP, LILT,MASTER, MEPLAN, OSAKA, POLIS, PSCOG, TRANSLOG, TOPAZ, HAMILTON andother), and we refer to a very substantial review for details (Southworth, Frank, 1995).
2.2. Passenger transport modelingThe number of person/vehicle-trip originating in each zone (trip generation) is treated like afunction of demographic and socio-economic variables: population, car ownership, income,etc. Estimation techniques are handled differently following trip purposes: business trips,journeys to work and social/leisure trips. This classification is not exhaustive and may berefined as needed. Methodology uses econometric tools to assess the number of trips per trippurpose. Input data are, amongst others, based on household surveys. In this frame,estimation is made on the basis of travel behaviour of groups, households or persons. Theperson-category approach, i.e. at the level of the individual, has several advantages as it has abetter compatibility with other steps (modal choice, assignment) which are based more onindividual behaviour of the travellers rather than on households.
2.3. Traffic distribution modelsThis second step estimates where the "produced" trip will go to and where the "attracted"trip comes from. For this purpose, trips leaving or entering a zone are spread into anorigin/destination (O/D) matrix of transport flows (and traffic loads) for the model zone.Matrices O/D represent the number of trips between each centroid node. Each element of theO/D matrix represents the number of vehicles/passengers per modelling time period betweeneach zone of origin i and destination j.
11
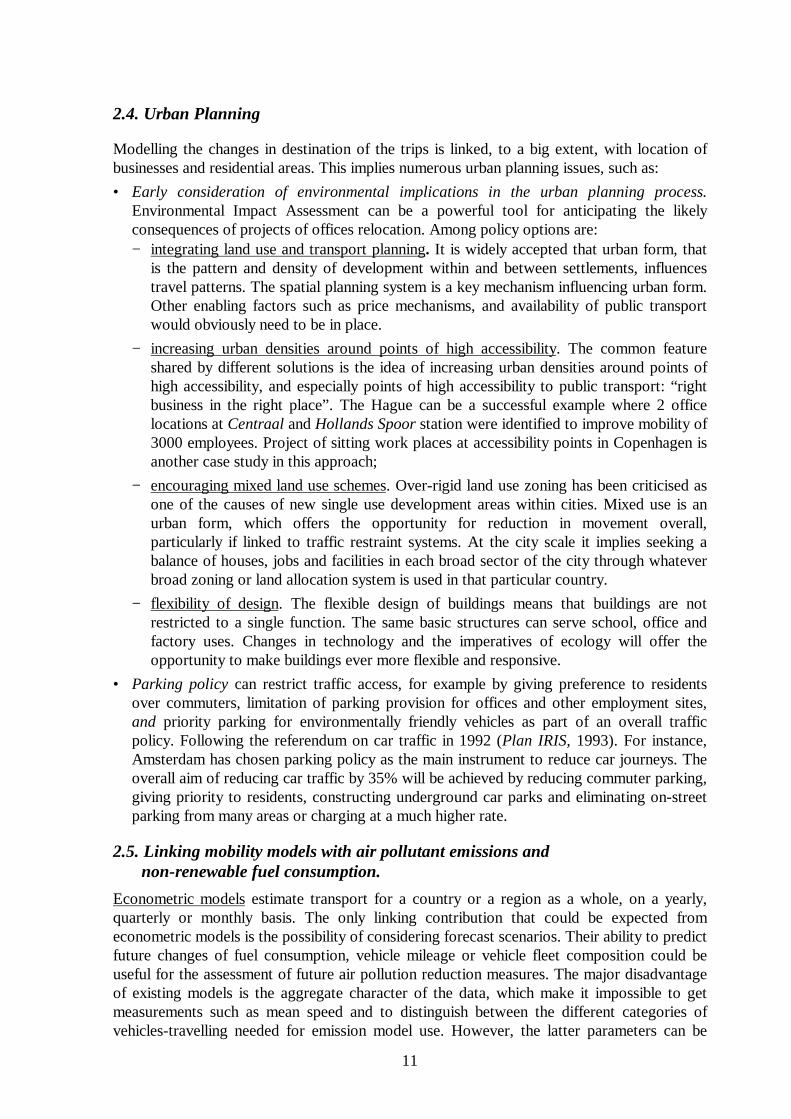
2.4. Urban Planning
Modelling the changes in destination of the trips is linked, to a big extent, with location ofbusinesses and residential areas. This implies numerous urban planning issues, such as:• Early consideration of environmental implications in the urban planning process.
Environmental Impact Assessment can be a powerful tool for anticipating the likelyconsequences of projects of offices relocation. Among policy options are:− integrating land use and transport planning. It is widely accepted that urban form, that
is the pattern and density of development within and between settlements, influencestravel patterns. The spatial planning system is a key mechanism influencing urban form.Other enabling factors such as price mechanisms, and availability of public transportwould obviously need to be in place.
− increasing urban densities around points of high accessibility. The common featureshared by different solutions is the idea of increasing urban densities around points ofhigh accessibility, and especially points of high accessibility to public transport: “rightbusiness in the right place”. The Hague can be a successful example where 2 officelocations at Centraal and Hollands Spoor station were identified to improve mobility of3000 employees. Project of sitting work places at accessibility points in Copenhagen isanother case study in this approach;
− encouraging mixed land use schemes. Over-rigid land use zoning has been criticised asone of the causes of new single use development areas within cities. Mixed use is anurban form, which offers the opportunity for reduction in movement overall,particularly if linked to traffic restraint systems. At the city scale it implies seeking abalance of houses, jobs and facilities in each broad sector of the city through whateverbroad zoning or land allocation system is used in that particular country.
− flexibility of design. The flexible design of buildings means that buildings are notrestricted to a single function. The same basic structures can serve school, office andfactory uses. Changes in technology and the imperatives of ecology will offer theopportunity to make buildings ever more flexible and responsive.
• Parking policy can restrict traffic access, for example by giving preference to residentsover commuters, limitation of parking provision for offices and other employment sites,and priority parking for environmentally friendly vehicles as part of an overall trafficpolicy. Following the referendum on car traffic in 1992 (Plan IRIS, 1993). For instance,Amsterdam has chosen parking policy as the main instrument to reduce car journeys. Theoverall aim of reducing car traffic by 35% will be achieved by reducing commuter parking,giving priority to residents, constructing underground car parks and eliminating on-streetparking from many areas or charging at a much higher rate.
2.5. Linking mobility models with air pollutant emissions andnon-renewable fuel consumption.
Econometric models estimate transport for a country or a region as a whole, on a yearly,quarterly or monthly basis. The only linking contribution that could be expected fromeconometric models is the possibility of considering forecast scenarios. Their ability to predictfuture changes of fuel consumption, vehicle mileage or vehicle fleet composition could beuseful for the assessment of future air pollution reduction measures. The major disadvantageof existing models is the aggregate character of the data, which make it impossible to getmeasurements such as mean speed and to distinguish between the different categories ofvehicles-travelling needed for emission model use. However, the latter parameters can be

12
assessed from surveys and calculations (exogenous character). New econometric models canbe built to distinguish vehicles travelling (or other measures of travel demand) under differentmodes and to split, for example, urban from non urban vehicles travelling, provided statisticsare available. Further investigation would be requested to assess this possibility. The existingeconometric models, which have been constructed for other goals than emission assessment,partly satisfy the requirements of emission models, provided no simplifying assumption ismade. However, econometric models are able to predict fuel consumption, but withoutdifferentiating different fuel types. Once again, if data on total annual fuel consumption foreach type of fuel could be found, models could be built on a time series basis, e.g. using asexplanatory variables the relative price for each type of fuel. Econometric models can belinked with emission models, such as COPERT II (Ahlvik et al, 1997), which calculates thetotal annual fuel consumption as a calibration parameter for estimating uncertain parameters(e.g. average annual mileage driven on each road class and for each vehicle category).
Network flow models. For road networks, there is an asymmetry between individual andpublic transport. Individual transport is measured in the number of vehicles. On the contrary,public transport is usually measured in number of passengers. For linking purposes, onlymeasurement in the number of vehicles can be used. In the case of models dealing with thenumber of passengers, the model must be able to convert this value into the number ofvehicles. From our analysis, in general, mobility models cannot directly provide emissionmodels with usable data. Adjustments and approximations are necessary. According toemission types, three cases are distinguished.
• Hot emissions and fuel consumption. Considering data requirements the main incompletedata for hot emission calculation are the following:
- number of vehicles per category,- kilometres driven per vehicle category on different road section types,- average speed per road type taken into account or allocation of typical traffic situations to
the road network with respect to different road section types. However mobility models provide:
- number of vehicles per mode on each O/D trip and the paths/route chosen for each trip,- average speed of a representative vehicle in function of road link characteristics (bends,
slopes) and in function of the flow on the link.- From mobility models, it is thus possible to infer for each O/D trip: the number of vehicles
travelling per mode and the average speed from the origin to the destination (knowing theaverage speed on each link type travelled). Trip distance, number of kilometres travelledper time period, number of starts can also be deduced from the input and output of themobility models. Matching problems between hot emission or fuel consumptioncalculation and mobility models remain in the calculation of kilometres driven per vehiclecategory and of kilometres driven per road type.
- It is necessary to assess the degree of certitude needed for input data (average speed, tripdistances, etc.) to get acceptable results. Also, the transportation network area studiedwith mobility models is still only partly covering the actual transport network.
• Cold start emissions. Considering cold start emissions and fuel consumption, apart frommeteorological parameters and fuel properties, the data required that could possibly besupplied by mobility models concern:
- average trip length per vehicle trip;- total annual kilometres of the vehicle for each category;- distance travelled by the vehicle;- number of starts per day and per vehicle;

13
- parking duration before the trip.
The travelled distance and the number of starts per day and per vehicle can be supplied bymobility models with the same remarks as for hot emissions while considering the vehiclecategory split.
• Evaporative emission: similar uncertainty with cold start emissions remains with regard tothe parking duration between trips. The same remark as for cold start emission has to bemade concerning parking location.
3. Development of the Integrated Mobility Model for theBrussels-Capital Region
3.1. Conceptual structure of the model and steps of implementation.Based on the existing experience in modelling of different socio-economic issues of mobility,and its environmental impacts (see Favrel and Hecq, 1998), an Integrated System of models(Figure 3.1) is proposed to include several main components:1) Urban development model, including forecasts of population and employment dynamics,
in accordance to different economic and urban planning scenarios. Such forecasts shouldbe based on indicators of economic development by main sectors of activities andrespective demand for labor resources; trends in population dynamics and labor resourcesstructure with respective spatial distribution in the region. Office stock dynamics andother urban factors are to be considered.
2) Mobility model, providing scenarios of road traffic in the region, according to differentorigin-destination matrices, generated on the basis of the different urban developmentscenarios. For transportation network analysis the recent version of TRIPS package(TRIPS, 1999) is used, which provides powerful tools for assignment and graphicalpresentation.
3) A model linking mobility and air pollution. The focus is mainly on global pollution (CO2,
CH4), tropospheric ozone-forming pollutants (NOx, VOC, CO), and local pollutants (PM,SO2). Also consumption of non-renewable fuels is analysed. COPERT methodology(versions II and III) was used for calculation of the emission functions per kilometredriven, taking into consideration climate conditions, private cars fleet composition withspecific speed profiles, as well as new European/Belgian regulations on vehicles,integrated in COPERT III. The emissions are calculated spatially on the transportationnetwork as a function of the assigned traffic intensity, average speed on each link, andlength of the trip.
4) In the final stage, as part of the «Sustainable mobility in the Brussels-Capital region»SSTC project CEESE-ULB is currently developing a methodology for the assessment ofthe physical effects and external costs caused by air pollution generated by road traffic inan urban area (see also Favrel and Hecq, 1998, 2000 for further details).
The data necessary for identification of the proposed complex of models is basically availablefrom different sources, but nevertheless, an in-depth study of the recent literature with afollowing update of the information base is required along with some additional surveying.Main sources of the data include National Statistical Institute, Administration of the Brussels-Capital region (e.g. Regional Mobility Plan "IRIS” reports), Brussels Office Survey (JonesLang Wootton reports), Review of Office Property (by Brussels Capital region), and others.
14
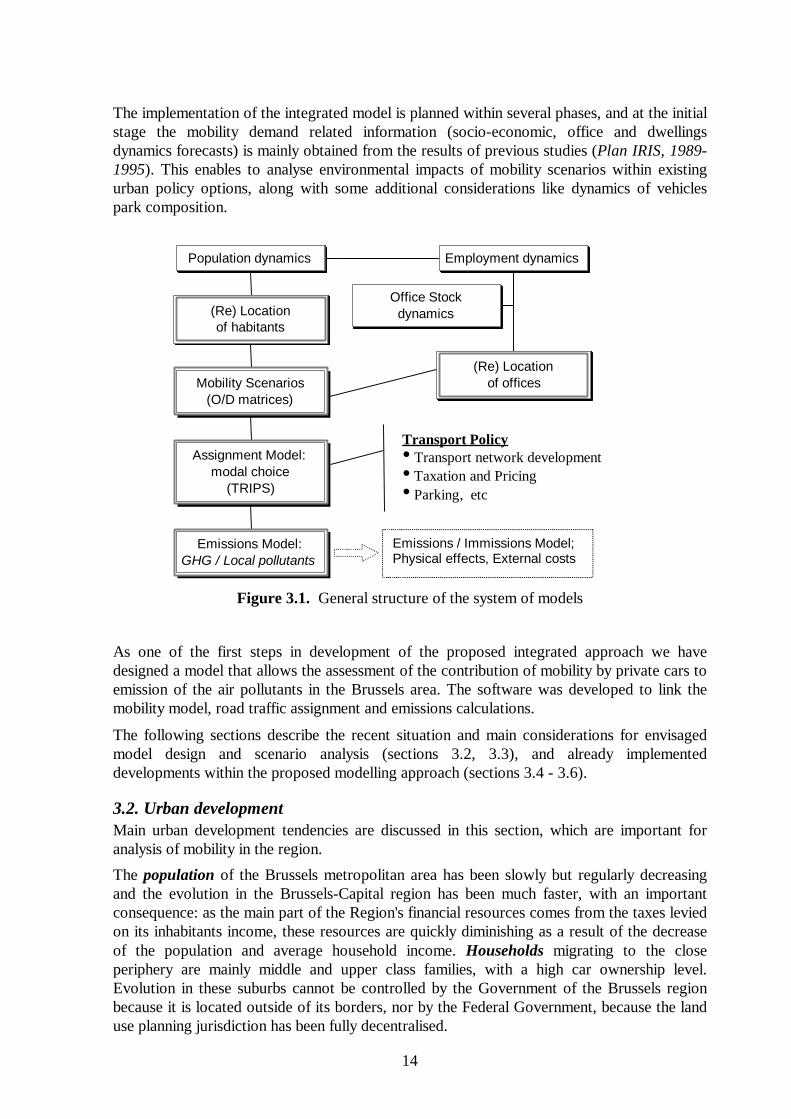
The implementation of the integrated model is planned within several phases, and at the initialstage the mobility demand related information (socio-economic, office and dwellingsdynamics forecasts) is mainly obtained from the results of previous studies (Plan IRIS, 1989-1995). This enables to analyse environmental impacts of mobility scenarios within existingurban policy options, along with some additional considerations like dynamics of vehiclespark composition.
Figure 3.1. General structure of the system of models
As one of the first steps in development of the proposed integrated approach we havedesigned a model that allows the assessment of the contribution of mobility by private cars toemission of the air pollutants in the Brussels area. The software was developed to link themobility model, road traffic assignment and emissions calculations.
The following sections describe the recent situation and main considerations for envisagedmodel design and scenario analysis (sections 3.2, 3.3), and already implementeddevelopments within the proposed modelling approach (sections 3.4 - 3.6).
3.2. Urban developmentMain urban development tendencies are discussed in this section, which are important foranalysis of mobility in the region.
The population of the Brussels metropolitan area has been slowly but regularly decreasingand the evolution in the Brussels-Capital region has been much faster, with an importantconsequence: as the main part of the Region's financial resources comes from the taxes leviedon its inhabitants income, these resources are quickly diminishing as a result of the decreaseof the population and average household income. Households migrating to the closeperiphery are mainly middle and upper class families, with a high car ownership level.Evolution in these suburbs cannot be controlled by the Government of the Brussels regionbecause it is located outside of its borders, nor by the Federal Government, because the landuse planning jurisdiction has been fully decentralised.
Emissions Model:GHG / Local pollutants
Assignment Model:modal choice
(TRIPS)
Mobility Scenarios(O/D matrices)
(Re) Locationof habitants
Population dynamics
Office Stockdynamics
(Re) Locationof offices
Employment dynamics
Emissions / Immissions Model;Physical effects, External costs
Transport Policy• Transport network development• Taxation and Pricing• Parking, etc
15
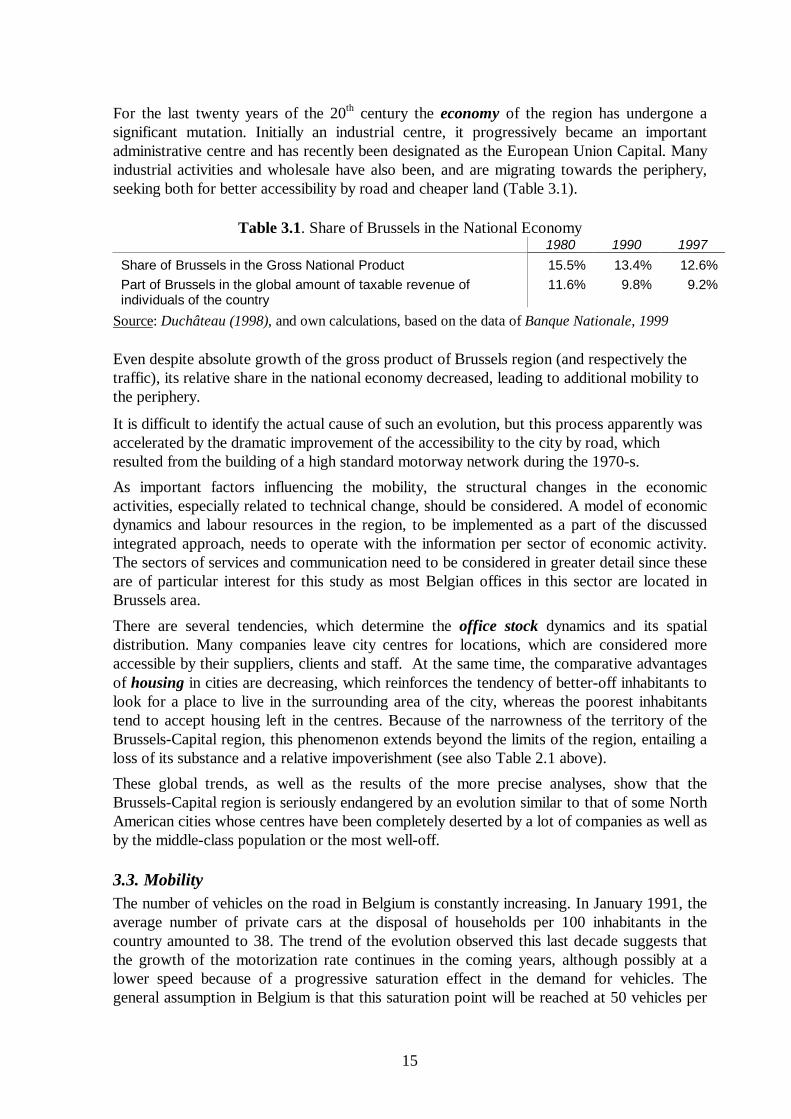
For the last twenty years of the 20th century the economy of the region has undergone asignificant mutation. Initially an industrial centre, it progressively became an importantadministrative centre and has recently been designated as the European Union Capital. Manyindustrial activities and wholesale have also been, and are migrating towards the periphery,seeking both for better accessibility by road and cheaper land (Table 3.1).
Table 3.1. Share of Brussels in the National Economy1980 1990 1997
Share of Brussels in the Gross National Product 15.5% 13.4% 12.6%Part of Brussels in the global amount of taxable revenue ofindividuals of the country
11.6% 9.8% 9.2%
Source: Duchâteau (1998), and own calculations, based on the data of Banque Nationale, 1999
Even despite absolute growth of the gross product of Brussels region (and respectively thetraffic), its relative share in the national economy decreased, leading to additional mobility tothe periphery.
It is difficult to identify the actual cause of such an evolution, but this process apparently wasaccelerated by the dramatic improvement of the accessibility to the city by road, whichresulted from the building of a high standard motorway network during the 1970-s.
As important factors influencing the mobility, the structural changes in the economicactivities, especially related to technical change, should be considered. A model of economicdynamics and labour resources in the region, to be implemented as a part of the discussedintegrated approach, needs to operate with the information per sector of economic activity.The sectors of services and communication need to be considered in greater detail since theseare of particular interest for this study as most Belgian offices in this sector are located inBrussels area.
There are several tendencies, which determine the office stock dynamics and its spatialdistribution. Many companies leave city centres for locations, which are considered moreaccessible by their suppliers, clients and staff. At the same time, the comparative advantagesof housing in cities are decreasing, which reinforces the tendency of better-off inhabitants tolook for a place to live in the surrounding area of the city, whereas the poorest inhabitantstend to accept housing left in the centres. Because of the narrowness of the territory of theBrussels-Capital region, this phenomenon extends beyond the limits of the region, entailing aloss of its substance and a relative impoverishment (see also Table 2.1 above).
These global trends, as well as the results of the more precise analyses, show that theBrussels-Capital region is seriously endangered by an evolution similar to that of some NorthAmerican cities whose centres have been completely deserted by a lot of companies as well asby the middle-class population or the most well-off.
3.3. MobilityThe number of vehicles on the road in Belgium is constantly increasing. In January 1991, theaverage number of private cars at the disposal of households per 100 inhabitants in thecountry amounted to 38. The trend of the evolution observed this last decade suggests thatthe growth of the motorization rate continues in the coming years, although possibly at alower speed because of a progressive saturation effect in the demand for vehicles. Thegeneral assumption in Belgium is that this saturation point will be reached at 50 vehicles per
16
100 inhabitants (Duchâteau, 1998). It is relatively modest compared to the levels alreadyreached in North America (nearly 60 vehicles per 100 inhabitants).
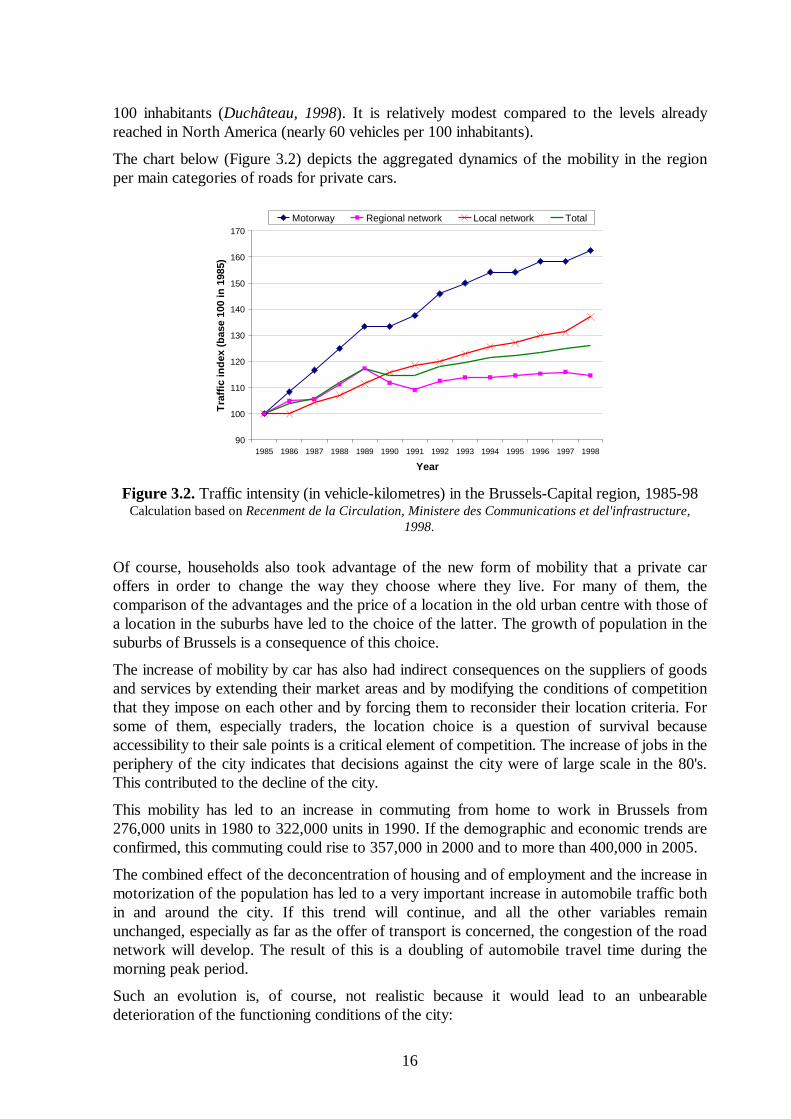
The chart below (Figure 3.2) depicts the aggregated dynamics of the mobility in the regionper main categories of roads for private cars.
90
100
110
120
130
140
150
160
170
1985 1986 1987 1988 1989 1990 1991 1992 1993 1994 1995 1996 1997 1998
Year
Tra
ffic
inde
x (b
ase
100
in 1
985)
Motorway Regional network Local network Total
Figure 3.2. Traffic intensity (in vehicle-kilometres) in the Brussels-Capital region, 1985-98Calculation based on Recenment de la Circulation, Ministere des Communications et del'infrastructure,
1998.
Of course, households also took advantage of the new form of mobility that a private caroffers in order to change the way they choose where they live. For many of them, thecomparison of the advantages and the price of a location in the old urban centre with those ofa location in the suburbs have led to the choice of the latter. The growth of population in thesuburbs of Brussels is a consequence of this choice.
The increase of mobility by car has also had indirect consequences on the suppliers of goodsand services by extending their market areas and by modifying the conditions of competitionthat they impose on each other and by forcing them to reconsider their location criteria. Forsome of them, especially traders, the location choice is a question of survival becauseaccessibility to their sale points is a critical element of competition. The increase of jobs in theperiphery of the city indicates that decisions against the city were of large scale in the 80's.This contributed to the decline of the city.
This mobility has led to an increase in commuting from home to work in Brussels from276,000 units in 1980 to 322,000 units in 1990. If the demographic and economic trends areconfirmed, this commuting could rise to 357,000 in 2000 and to more than 400,000 in 2005.
The combined effect of the deconcentration of housing and of employment and the increase inmotorization of the population has led to a very important increase in automobile traffic bothin and around the city. If this trend will continue, and all the other variables remainunchanged, especially as far as the offer of transport is concerned, the congestion of the roadnetwork will develop. The result of this is a doubling of automobile travel time during themorning peak period.
Such an evolution is, of course, not realistic because it would lead to an unbearabledeterioration of the functioning conditions of the city:

17
• Urban economic players cannot accept such a situation because the worsening of theiraccessibility endangers their very survival; if nothing is done to change the situation, theirreaction will be to leave the city for a more or less far peripheral location.
• The inhabitants will support neither the impediments to mobility due to congestion northe increase in pollution that will result from it; their reaction will be similar to that of theeconomic players: those who can afford it will leave the city in huge numbers.
As far as the regional public authorities are concerned, they either cannot stay put withoutany reaction to the threat of seeing a rise in the exodus of inhabitants and employment.
3.4. Network model of private road transportThe Brussels-Capital region covers the total square of 161 km² with 951,580 inhabitants(1997) and takes the central geographical position in Belgium. Administratively, the region isdivided into 19 municipalities (communes), but the total area under study comprises a widerterritory covering also nearby districts from/to which the traffic is most intensive, and it isdivided into smaller 167 districts. The outer districts within Belgium (from/to whichpassengers’ mobility is about 20% of the total of Brussels area traffic) are numbered from168 till 184.
The road network due to further disaggregation of the administrative districts in the centralpart of Brussels has in total 255 zones, from (to) which the trips are generated, with 2545nodes and 8366 links.
3.5. Simulation tools for transport modelingAs a basic computer tool for spatial analysis of mobility the latest available version of theTRIPS package is used (TRIPS, 1999). It includes a set of inter-related modules: HighwayAssessment; Public Transport Assignment; Demand Modelling; Matrix Estimation; TRIPSGraphics; TRIPS Manager - Graphical Project Management Tool
The private car transportation has been modelled (Plan IRIS, 1989-1995) according to theorigin-destination matrix for the morning peak hour (7.30-8.30) on an average day of 1991.The traffic intensity volumes (number of vehicles), average time and speed per each link arecalculated as a result of traffic assignment with TRIPS Highway Assessment module. Themodel permits different algorithms of traffic assignment (minimal cost paths - so called "all ornothing" assignment or multiple paths for each origin and destination - dial assignment modelor Burrell assignment). For this study the Burrell model was used, which provides sufficientlygood results on the available data.Let us explain the main principles of how a mobility model works in TRIPS. The computerprogram developed in TRIPS includes a sequence of calculation steps.- Origin-destination matrix generation.- Assignment and capacity restraints iterations, consequently solve the assignment problem,
using one of the available algorithms, and finally generating a network file which isprocessed further on.
- Module COPERT (a user-written program) reads this links calculates the emissions andfuel consumption per each link.
- Graphical module MVGRAF is able to plot the results of assignment along withenvironmental and other information on the network (see the plots below on Fig. 3.4).The result of the assignment for the year of 1991 is presented using TRIPS GraphicModule (MVGRAF) on the Figure 3.4a for the central part of the Brussels area.
18
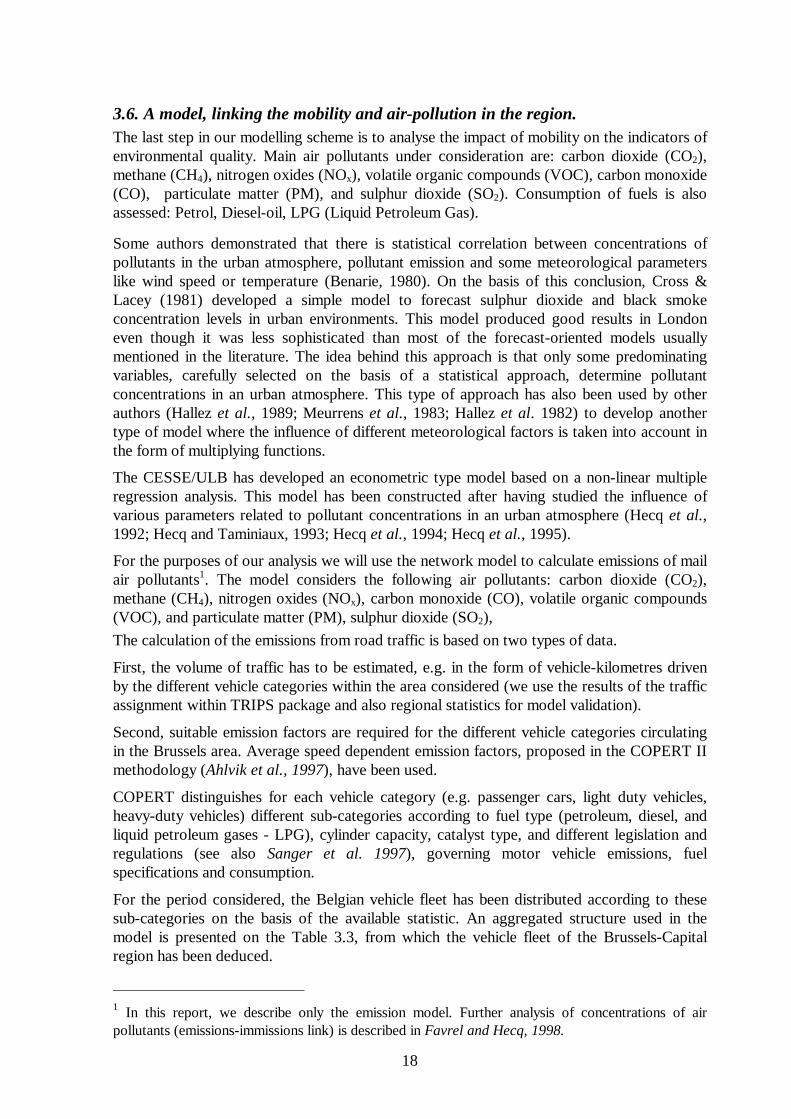
3.6. A model, linking the mobility and air-pollution in the region.The last step in our modelling scheme is to analyse the impact of mobility on the indicators ofenvironmental quality. Main air pollutants under consideration are: carbon dioxide (CO2),methane (CH4), nitrogen oxides (NOx), volatile organic compounds (VOC), carbon monoxide(CO), particulate matter (PM), and sulphur dioxide (SO2). Consumption of fuels is alsoassessed: Petrol, Diesel-oil, LPG (Liquid Petroleum Gas).
Some authors demonstrated that there is statistical correlation between concentrations ofpollutants in the urban atmosphere, pollutant emission and some meteorological parameterslike wind speed or temperature (Benarie, 1980). On the basis of this conclusion, Cross &Lacey (1981) developed a simple model to forecast sulphur dioxide and black smokeconcentration levels in urban environments. This model produced good results in Londoneven though it was less sophisticated than most of the forecast-oriented models usuallymentioned in the literature. The idea behind this approach is that only some predominatingvariables, carefully selected on the basis of a statistical approach, determine pollutantconcentrations in an urban atmosphere. This type of approach has also been used by otherauthors (Hallez et al., 1989; Meurrens et al., 1983; Hallez et al. 1982) to develop anothertype of model where the influence of different meteorological factors is taken into account inthe form of multiplying functions.
The CESSE/ULB has developed an econometric type model based on a non-linear multipleregression analysis. This model has been constructed after having studied the influence ofvarious parameters related to pollutant concentrations in an urban atmosphere (Hecq et al.,1992; Hecq and Taminiaux, 1993; Hecq et al., 1994; Hecq et al., 1995).
For the purposes of our analysis we will use the network model to calculate emissions of mailair pollutants1. The model considers the following air pollutants: carbon dioxide (CO2),methane (CH4), nitrogen oxides (NOx), carbon monoxide (CO), volatile organic compounds(VOC), and particulate matter (PM), sulphur dioxide (SO2),The calculation of the emissions from road traffic is based on two types of data.
First, the volume of traffic has to be estimated, e.g. in the form of vehicle-kilometres drivenby the different vehicle categories within the area considered (we use the results of the trafficassignment within TRIPS package and also regional statistics for model validation).
Second, suitable emission factors are required for the different vehicle categories circulatingin the Brussels area. Average speed dependent emission factors, proposed in the COPERT IImethodology (Ahlvik et al., 1997), have been used.
COPERT distinguishes for each vehicle category (e.g. passenger cars, light duty vehicles,heavy-duty vehicles) different sub-categories according to fuel type (petroleum, diesel, andliquid petroleum gases - LPG), cylinder capacity, catalyst type, and different legislation andregulations (see also Sanger et al. 1997), governing motor vehicle emissions, fuelspecifications and consumption.
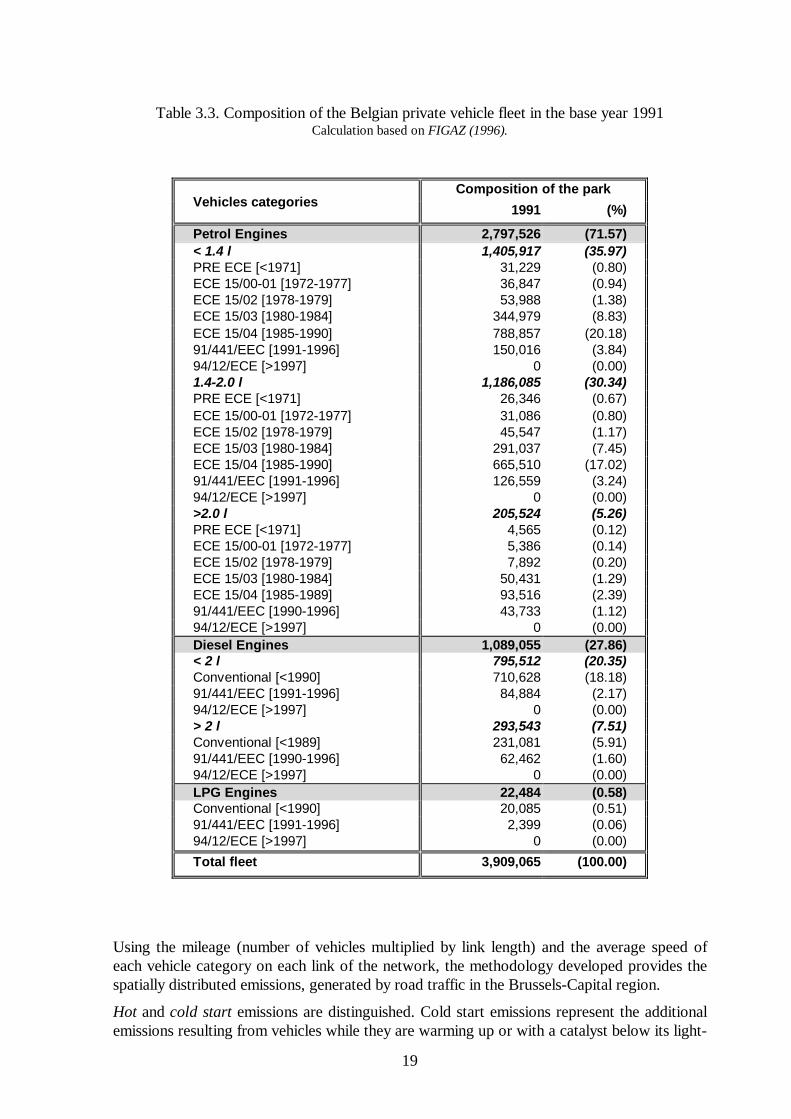
For the period considered, the Belgian vehicle fleet has been distributed according to thesesub-categories on the basis of the available statistic. An aggregated structure used in themodel is presented on the Table 3.3, from which the vehicle fleet of the Brussels-Capitalregion has been deduced.
1 In this report, we describe only the emission model. Further analysis of concentrations of airpollutants (emissions-immissions link) is described in Favrel and Hecq, 1998.
19
Table 3.3. Composition of the Belgian private vehicle fleet in the base year 1991Calculation based on FIGAZ (1996).
Composition of the parkVehicles categories 1991 (%)
Petrol Engines 2,797,526 (71.57)< 1.4 l 1,405,917 (35.97)PRE ECE [<1971] 31,229 (0.80)ECE 15/00-01 [1972-1977] 36,847 (0.94)ECE 15/02 [1978-1979] 53,988 (1.38)ECE 15/03 [1980-1984] 344,979 (8.83)ECE 15/04 [1985-1990] 788,857 (20.18)91/441/EEC [1991-1996] 150,016 (3.84)94/12/ECE [>1997] 0 (0.00)1.4-2.0 l 1,186,085 (30.34)PRE ECE [<1971] 26,346 (0.67)ECE 15/00-01 [1972-1977] 31,086 (0.80)ECE 15/02 [1978-1979] 45,547 (1.17)ECE 15/03 [1980-1984] 291,037 (7.45)ECE 15/04 [1985-1990] 665,510 (17.02)91/441/EEC [1991-1996] 126,559 (3.24)94/12/ECE [>1997] 0 (0.00)>2.0 l 205,524 (5.26)PRE ECE [<1971] 4,565 (0.12)ECE 15/00-01 [1972-1977] 5,386 (0.14)ECE 15/02 [1978-1979] 7,892 (0.20)ECE 15/03 [1980-1984] 50,431 (1.29)ECE 15/04 [1985-1989] 93,516 (2.39)91/441/EEC [1990-1996] 43,733 (1.12)94/12/ECE [>1997] 0 (0.00)Diesel Engines 1,089,055 (27.86)< 2 l 795,512 (20.35)Conventional [<1990] 710,628 (18.18)91/441/EEC [1991-1996] 84,884 (2.17)94/12/ECE [>1997] 0 (0.00)> 2 l 293,543 (7.51)Conventional [<1989] 231,081 (5.91)91/441/EEC [1990-1996] 62,462 (1.60)94/12/ECE [>1997] 0 (0.00)LPG Engines 22,484 (0.58)Conventional [<1990] 20,085 (0.51)91/441/EEC [1991-1996] 2,399 (0.06)94/12/ECE [>1997] 0 (0.00)Total fleet 3,909,065 (100.00)
Using the mileage (number of vehicles multiplied by link length) and the average speed ofeach vehicle category on each link of the network, the methodology developed provides thespatially distributed emissions, generated by road traffic in the Brussels-Capital region.
Hot and cold start emissions are distinguished. Cold start emissions represent the additionalemissions resulting from vehicles while they are warming up or with a catalyst below its light-
20
off temperature. The ratio of cold to hot emissions and the fraction of kilometres driven withcold engines are calculated using the yearly average temperature and an estimate of theaverage trip length following the COPERT methodology.
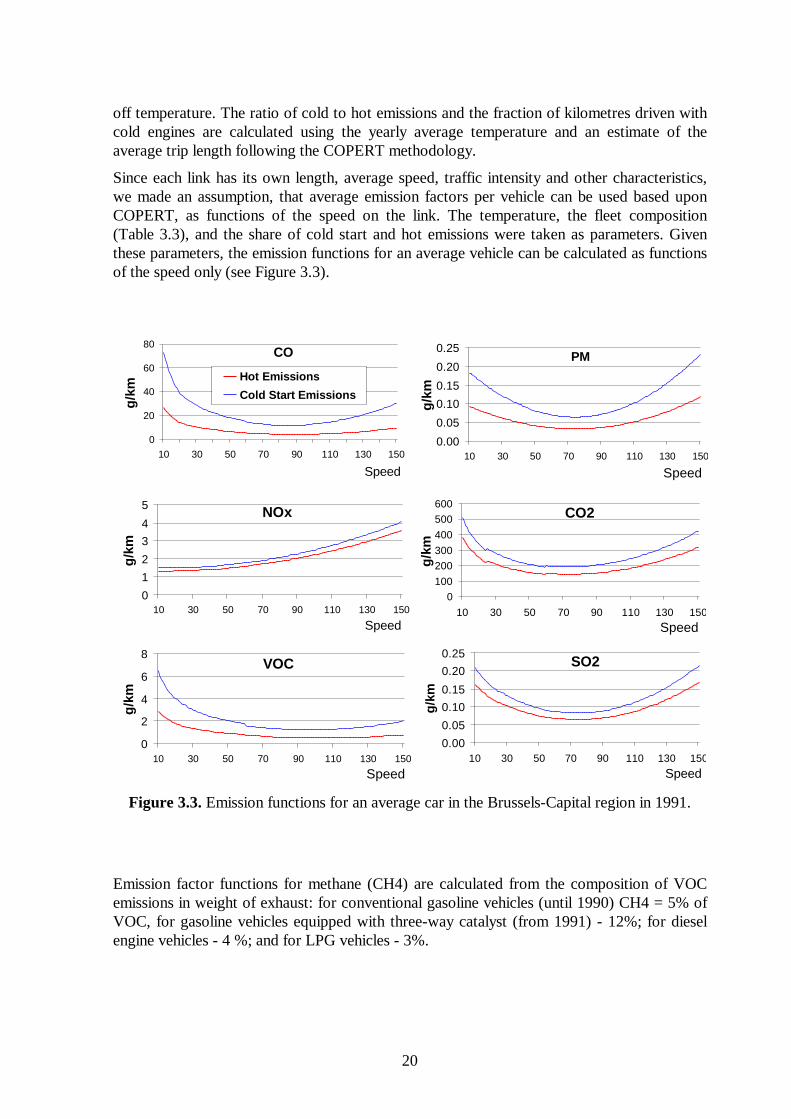
Since each link has its own length, average speed, traffic intensity and other characteristics,we made an assumption, that average emission factors per vehicle can be used based uponCOPERT, as functions of the speed on the link. The temperature, the fleet composition(Table 3.3), and the share of cold start and hot emissions were taken as parameters. Giventhese parameters, the emission functions for an average vehicle can be calculated as functionsof the speed only (see Figure 3.3).
Figure 3.3. Emission functions for an average car in the Brussels-Capital region in 1991.
Emission factor functions for methane (CH4) are calculated from the composition of VOCemissions in weight of exhaust: for conventional gasoline vehicles (until 1990) CH4 = 5% ofVOC, for gasoline vehicles equipped with three-way catalyst (from 1991) - 12%; for dieselengine vehicles - 4 %; and for LPG vehicles - 3%.
CO
0
20
40
60
80
10 30 50 70 90 110 130 150
Speed
g/km
Hot Emissions
Cold Start Emissions
NOx
01234
5
10 30 50 70 90 110 130 150
Speed
g/km
VOC
0
2
4
6
8
10 30 50 70 90 110 130 150
Speed
g/km
CO2
0100200300400500600
10 30 50 70 90 110 130 150Speed
g/km
SO2
0.000.050.100.15
0.200.25
10 30 50 70 90 110 130 150Speed
g/km
PM
0.00
0.05
0.100.15
0.20
0.25
10 30 50 70 90 110 130 150
Speed
g/km

21
Figure 3.4.a. Traffic Intensity (number of cars per link and Saturation Index (1991)
Figure 3.4b. CO2 Emissions (1991) Figure 3.4c. CH4 Emissions (1991)
Figure 3.4d. VOC Emissions (1991) Figure 3.4e. PM Emissions (1991)

22
Figure 3.4f. CO Emissions (1991) Figure 3.4g. NOx Emissions (1991)
Figure 3.4h. SO2 Emissions (1991) Figure 3.4i. Petrol Consumption (1991)
Figure 3.4j. Diesel Consumption (1991) Figure 3.4k. LPG Consumption (1991)
23
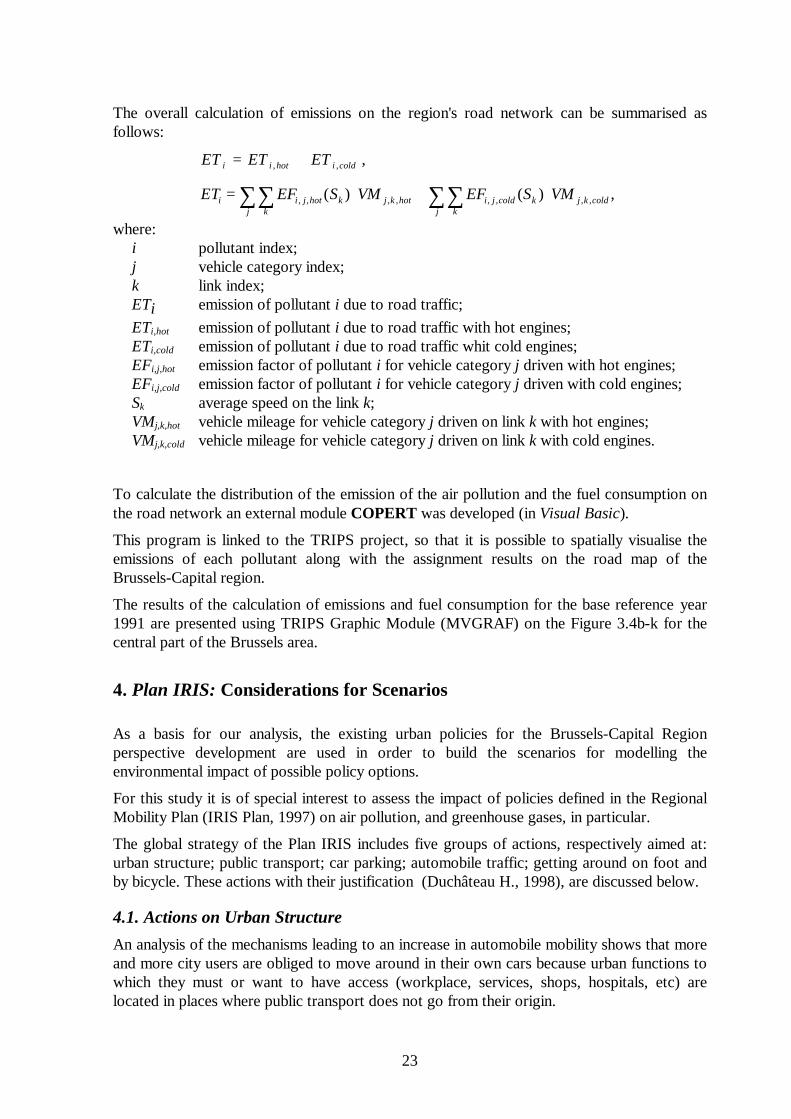
The overall calculation of emissions on the region's road network can be summarised asfollows:
,,, coldihotii ETETET +=
,)()( ,,,,,,,,∑ ∑ ∑ ∑ ⋅+⋅=j k j k
coldkjkcoldjihotkjkhotjii VMSEFVMSEFET
where:i pollutant index;j vehicle category index;k link index;ETi emission of pollutant i due to road traffic;ETi,hot emission of pollutant i due to road traffic with hot engines;ETi,cold emission of pollutant i due to road traffic whit cold engines;EFi,j,hot emission factor of pollutant i for vehicle category j driven with hot engines;EFi,j,cold emission factor of pollutant i for vehicle category j driven with cold engines;Sk average speed on the link k;VMj,k,hot vehicle mileage for vehicle category j driven on link k with hot engines;VMj,k,cold vehicle mileage for vehicle category j driven on link k with cold engines.
To calculate the distribution of the emission of the air pollution and the fuel consumption onthe road network an external module COPERT was developed (in Visual Basic).
This program is linked to the TRIPS project, so that it is possible to spatially visualise theemissions of each pollutant along with the assignment results on the road map of theBrussels-Capital region.
The results of the calculation of emissions and fuel consumption for the base reference year1991 are presented using TRIPS Graphic Module (MVGRAF) on the Figure 3.4b-k for thecentral part of the Brussels area.
4. Plan IRIS: Considerations for Scenarios
As a basis for our analysis, the existing urban policies for the Brussels-Capital Regionperspective development are used in order to build the scenarios for modelling theenvironmental impact of possible policy options.
For this study it is of special interest to assess the impact of policies defined in the RegionalMobility Plan (IRIS Plan, 1997) on air pollution, and greenhouse gases, in particular.
The global strategy of the Plan IRIS includes five groups of actions, respectively aimed at:urban structure; public transport; car parking; automobile traffic; getting around on foot andby bicycle. These actions with their justification (Duchâteau H., 1998), are discussed below.
4.1. Actions on Urban StructureAn analysis of the mechanisms leading to an increase in automobile mobility shows that moreand more city users are obliged to move around in their own cars because urban functions towhich they must or want to have access (workplace, services, shops, hospitals, etc) arelocated in places where public transport does not go from their origin.
24
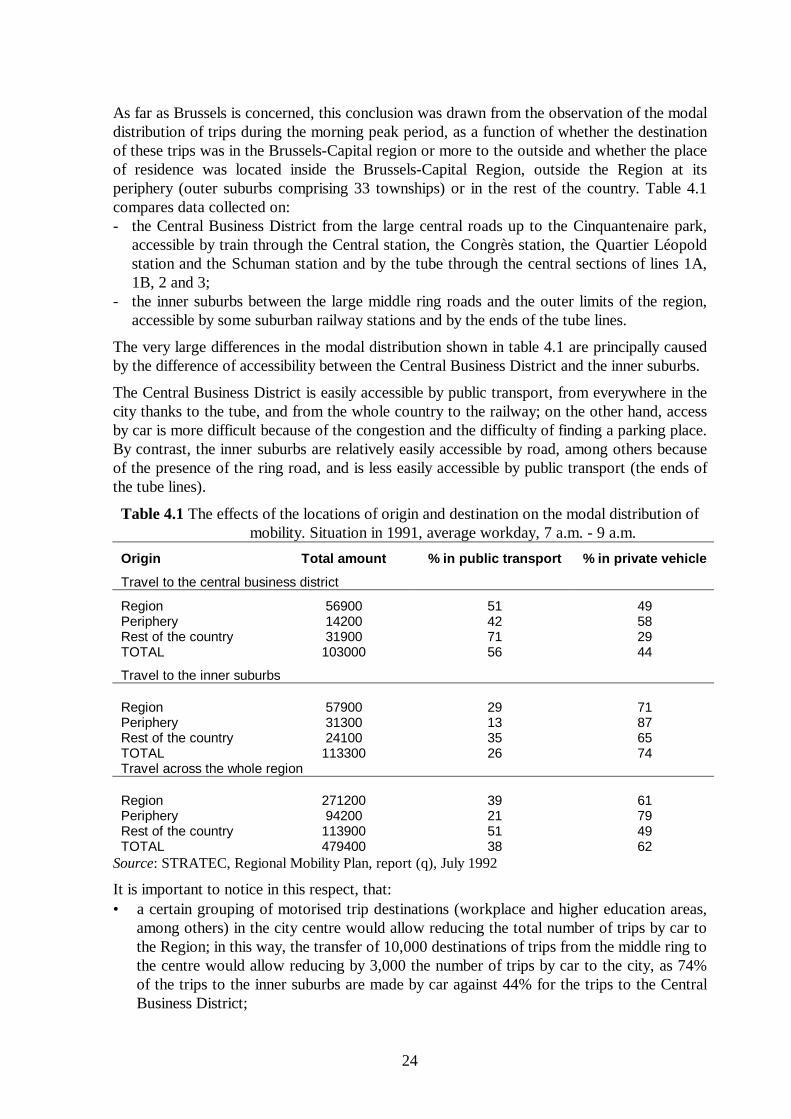
As far as Brussels is concerned, this conclusion was drawn from the observation of the modaldistribution of trips during the morning peak period, as a function of whether the destinationof these trips was in the Brussels-Capital region or more to the outside and whether the placeof residence was located inside the Brussels-Capital Region, outside the Region at itsperiphery (outer suburbs comprising 33 townships) or in the rest of the country. Table 4.1compares data collected on:- the Central Business District from the large central roads up to the Cinquantenaire park,
accessible by train through the Central station, the Congrès station, the Quartier Léopoldstation and the Schuman station and by the tube through the central sections of lines 1A,1B, 2 and 3;
- the inner suburbs between the large middle ring roads and the outer limits of the region,accessible by some suburban railway stations and by the ends of the tube lines.
The very large differences in the modal distribution shown in table 4.1 are principally causedby the difference of accessibility between the Central Business District and the inner suburbs.
The Central Business District is easily accessible by public transport, from everywhere in thecity thanks to the tube, and from the whole country to the railway; on the other hand, accessby car is more difficult because of the congestion and the difficulty of finding a parking place.By contrast, the inner suburbs are relatively easily accessible by road, among others becauseof the presence of the ring road, and is less easily accessible by public transport (the ends ofthe tube lines).
Table 4.1 The effects of the locations of origin and destination on the modal distribution ofmobility. Situation in 1991, average workday, 7 a.m. - 9 a.m.
Origin Total amount % in public transport % in private vehicle
Travel to the central business district
RegionPeripheryRest of the countryTOTAL
569001420031900
103000
51427156
49582944
Travel to the inner suburbs
RegionPeripheryRest of the countryTOTAL
579003130024100
113300
29133526
71876574
Travel across the whole region
RegionPeripheryRest of the countryTOTAL
27120094200
113900479400
39215138
61794962
Source: STRATEC, Regional Mobility Plan, report (q), July 1992
It is important to notice in this respect, that:• a certain grouping of motorised trip destinations (workplace and higher education areas,
among others) in the city centre would allow reducing the total number of trips by car tothe Region; in this way, the transfer of 10,000 destinations of trips from the middle ring tothe centre would allow reducing by 3,000 the number of trips by car to the city, as 74%of the trips to the inner suburbs are made by car against 44% for the trips to the CentralBusiness District;
25
• in the same way, returning to live in the Region by a part of the population which todaylives in the periphery, would have a positive influence as 79% of the trips from theperiphery are made by car against 61% from the Region itself;
• on the other hand, it can be seen that commuting to Brussels from the rest of the countrycontributes to a lesser extent to the automobile traffic in the city than other trips.
These global observations, completed by ideas directed more specifically to the developmentof areas ideal for walking and cycling and with access to public transport, have led to theformulation of a series of recommendations which, through the Land Use Master Plan, canhave determining effects on the needs of trips by car and on the problems these trips cause.These recommendations are listed as follows:
To improve the accessibility of workplaces:- Concentrate the employment, which generates a high traffic of people per m2 in areas
which are easily accessible by public transport.- Favour the development of dense residential areas along zones where there is a good
public transport service.- Reserve dense housing areas within reach by foot of highly concentrated employment
areas.- Facilitate Park & Ride and Kiss & Ride for the access to and from less densely populated
areas.- Preserve the industrial railway lines in order to re-allocate them to passenger transport.
To facilitate movement during the working day:- Accelerate processes of renewed use of the ground in the central areas in order to avoid
an under-utilisation and to avoid “no man’s lands” whose presence increases the need formotorised transport.
- Organise a mix of mutually complementary activities that do not depend on car use, in thecentre of the city.
To facilitate accessibility of shops and services:- Promote small local shopping centres.- Maintain and re-vitalise the big commercial centres in the Central Business District.
To facilitate accessibility to collective facilities:- Locate the regional facilities in the centre.- Promote the growth of local facilities.
To preserve the accessibility of education establishments:- Maintain the network of neighbourhood education establishments.- Discourage the establishment of comprehensive schools at the periphery of urban areas.
4.2. Actions on Public TransportThe analysis of the behaviour of users who have the possibility to use either their car orpublic transport to get around show that the choices they make are indeed strongly linked tothe respective characteristics of the travel they make in one of these two modes. Moreprecisely, the choice of public transport to effect a given trip is most probable if the gapbetween the duration of the trip by public transport and the duration of the trip with a privatecar is small. Improving the quality of the service offered by public transport is therefore not auseless proposition.
26
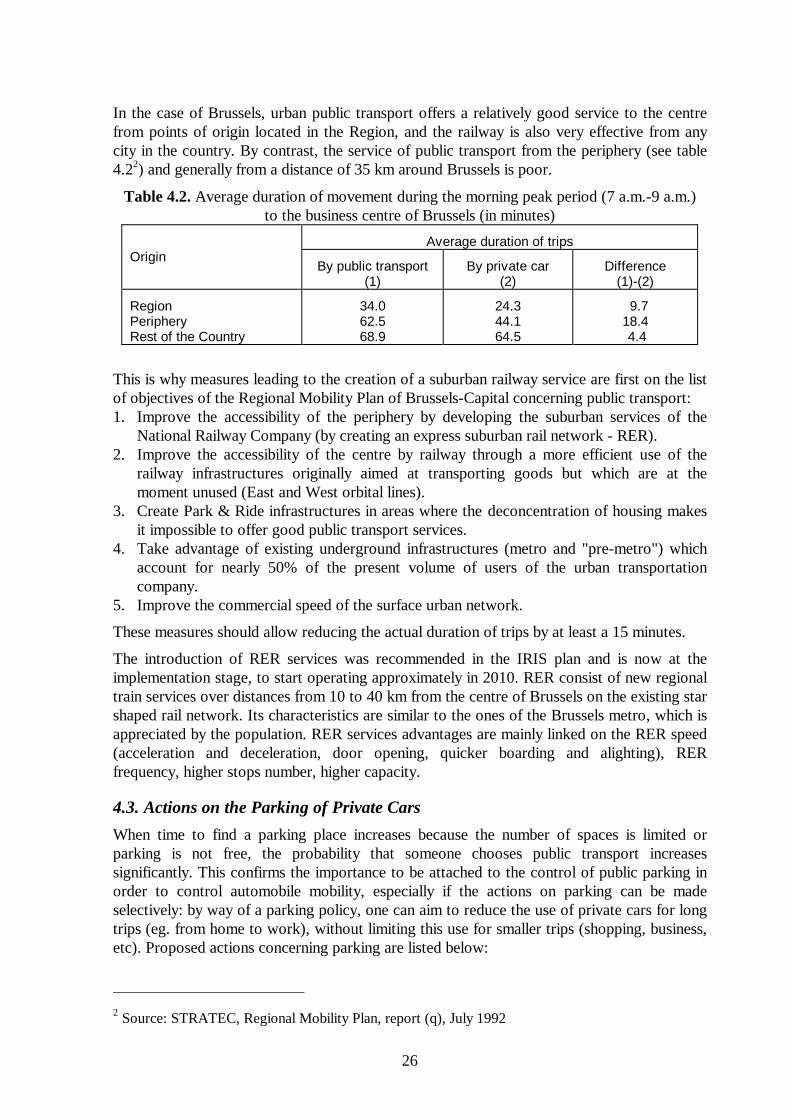
In the case of Brussels, urban public transport offers a relatively good service to the centrefrom points of origin located in the Region, and the railway is also very effective from anycity in the country. By contrast, the service of public transport from the periphery (see table4.22) and generally from a distance of 35 km around Brussels is poor.
Table 4.2. Average duration of movement during the morning peak period (7 a.m.-9 a.m.)to the business centre of Brussels (in minutes)
Average duration of tripsOrigin
By public transport(1)
By private car(2)
Difference(1)-(2)
RegionPeripheryRest of the Country
34.062.568.9
24.344.164.5
9.718.4 4.4
This is why measures leading to the creation of a suburban railway service are first on the listof objectives of the Regional Mobility Plan of Brussels-Capital concerning public transport:1. Improve the accessibility of the periphery by developing the suburban services of the
National Railway Company (by creating an express suburban rail network - RER).2. Improve the accessibility of the centre by railway through a more efficient use of the
railway infrastructures originally aimed at transporting goods but which are at themoment unused (East and West orbital lines).
3. Create Park & Ride infrastructures in areas where the deconcentration of housing makesit impossible to offer good public transport services.
4. Take advantage of existing underground infrastructures (metro and "pre-metro") whichaccount for nearly 50% of the present volume of users of the urban transportationcompany.
5. Improve the commercial speed of the surface urban network.
These measures should allow reducing the actual duration of trips by at least a 15 minutes.
The introduction of RER services was recommended in the IRIS plan and is now at theimplementation stage, to start operating approximately in 2010. RER consist of new regionaltrain services over distances from 10 to 40 km from the centre of Brussels on the existing starshaped rail network. Its characteristics are similar to the ones of the Brussels metro, which isappreciated by the population. RER services advantages are mainly linked on the RER speed(acceleration and deceleration, door opening, quicker boarding and alighting), RERfrequency, higher stops number, higher capacity.
4.3. Actions on the Parking of Private CarsWhen time to find a parking place increases because the number of spaces is limited orparking is not free, the probability that someone chooses public transport increasessignificantly. This confirms the importance to be attached to the control of public parking inorder to control automobile mobility, especially if the actions on parking can be madeselectively: by way of a parking policy, one can aim to reduce the use of private cars for longtrips (eg. from home to work), without limiting this use for smaller trips (shopping, business,etc). Proposed actions concerning parking are listed below:
2 Source: STRATEC, Regional Mobility Plan, report (q), July 1992
27
• Reduce parking possibilities on streets in the city centre by severely limiting long-termparking and by re-allocating the public space thereby gained to short-term parking, topedestrians and to lanes reserved for public transportation and to green areas or plantingareas.
• Strengthen control on the duration of parking in alternating “even-day / odd-day” places.• Implement an effective system of restricting parking along roads to residents living in
housing areas without garages.• Review the rules and regulations relating to the building of off-road parking spaces and
vary their maximum number according to the number of jobs, the kind of activity and thelevel of service offered by public transportation networks in the local area.
4.4. Actions on Automobile TrafficAll actions proposed above will lead to a global reduction of the pressure of the automobilein the city. This decrease must immediately be made to lead to a better control of the rest ofthe traffic and to a suppression of all inter-area transit traffic in residential areas and inshopping and leisure areas where the traffic is most often perceived as an aggression (noise,risks of accidents for the children, pollution, etc.).
Actions of this type are listed below, showing strategic actions on automobile traffic.• Extending to the whole region the concept of dividing the territory into zones inaccessible
to motor transit• Strengthen the hierarchy of the roads (transit ways, local access roads) and at the same
time strengthen the general need for accessibility, respect the areas’ characteristics andprotect those areas from transit traffic.
• Implement in these areas methods of one way traffic and of speed limitations (30 kmareas).
• No increase and even sometimes decrease the capacity of roads giving access to the cityin order to contain the morning congestion out of its limits.
• Regulate the capacity of roads leaving the city in order to limit the risks of congestion ofits internal network during the evening peak hour.
However, collective problems caused by automobile traffic congestion will not necessarilydisappear, at least not until the implementation of a system of charging fees for the use ofroad infrastructures equal to the marginal cost of congestion. Until the time such a user feesystem is implemented, congestion must be brought under control, that is, limited to placeswhere it causes the least problems.
4.5. Actions in Favor of Walking and CyclingAt present, in Brussels about 40% of the people who leave their home during the day onlymove about on foot. The regional Mobility policy must be more attentive to these twocategories of users than it used to be. On the other hand, very few people, about 1%, use a(motor)bike although they are much more numerous in cities such as Brussels wherepromotion campaigns in favour of their use were conducted. These two subjects constitutethe last part of the action proposals for the Regional Mobility Plan, listed below.
Actions in the Field of Pedestrian and two-wheel traffic:• Improve the comfort and safety of pavements and pedestrian crossings on roads by
measures concerning parking.• Develop cycle lanes across “non-transit” areas.• Promote combined “bicycle-public transport” travel.
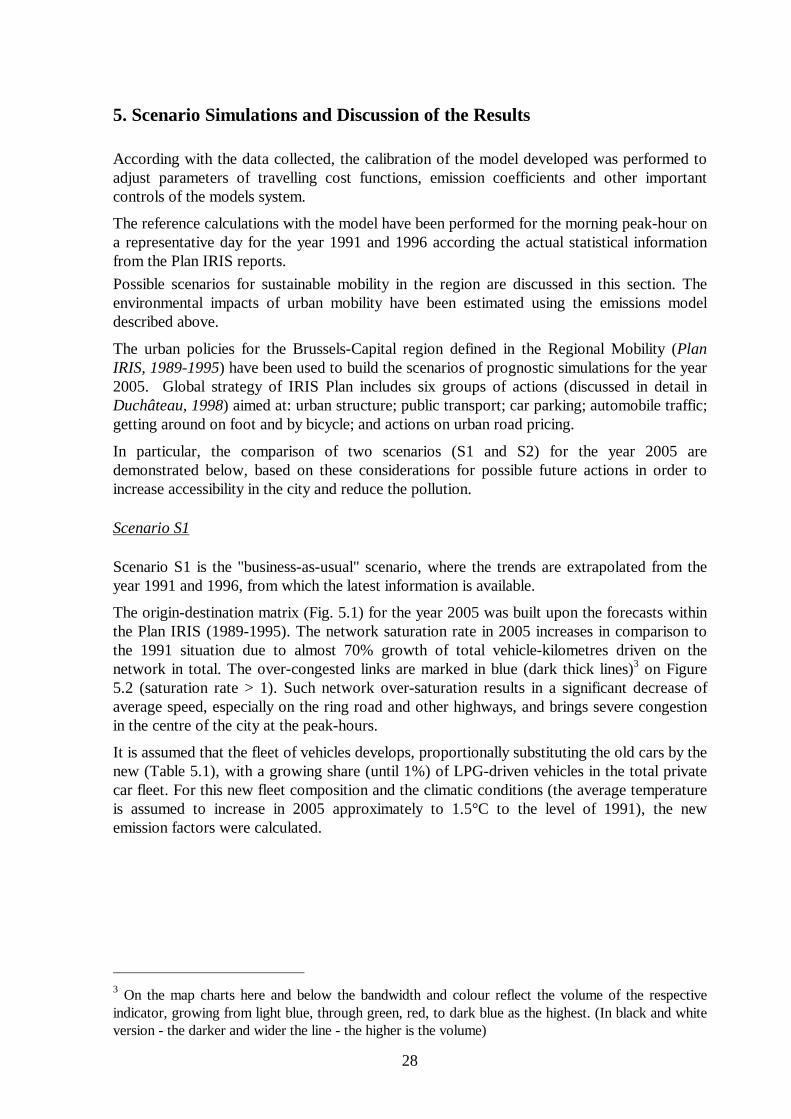
28
5. Scenario Simulations and Discussion of the Results
According with the data collected, the calibration of the model developed was performed toadjust parameters of travelling cost functions, emission coefficients and other importantcontrols of the models system.
The reference calculations with the model have been performed for the morning peak-hour ona representative day for the year 1991 and 1996 according the actual statistical informationfrom the Plan IRIS reports.Possible scenarios for sustainable mobility in the region are discussed in this section. Theenvironmental impacts of urban mobility have been estimated using the emissions modeldescribed above.
The urban policies for the Brussels-Capital region defined in the Regional Mobility (PlanIRIS, 1989-1995) have been used to build the scenarios of prognostic simulations for the year2005. Global strategy of IRIS Plan includes six groups of actions (discussed in detail inDuchâteau, 1998) aimed at: urban structure; public transport; car parking; automobile traffic;getting around on foot and by bicycle; and actions on urban road pricing.
In particular, the comparison of two scenarios (S1 and S2) for the year 2005 aredemonstrated below, based on these considerations for possible future actions in order toincrease accessibility in the city and reduce the pollution.
Scenario S1
Scenario S1 is the "business-as-usual" scenario, where the trends are extrapolated from theyear 1991 and 1996, from which the latest information is available.
The origin-destination matrix (Fig. 5.1) for the year 2005 was built upon the forecasts withinthe Plan IRIS (1989-1995). The network saturation rate in 2005 increases in comparison tothe 1991 situation due to almost 70% growth of total vehicle-kilometres driven on thenetwork in total. The over-congested links are marked in blue (dark thick lines)3 on Figure5.2 (saturation rate > 1). Such network over-saturation results in a significant decrease ofaverage speed, especially on the ring road and other highways, and brings severe congestionin the centre of the city at the peak-hours.
It is assumed that the fleet of vehicles develops, proportionally substituting the old cars by thenew (Table 5.1), with a growing share (until 1%) of LPG-driven vehicles in the total privatecar fleet. For this new fleet composition and the climatic conditions (the average temperatureis assumed to increase in 2005 approximately to 1.5°C to the level of 1991), the newemission factors were calculated.
3 On the map charts here and below the bandwidth and colour reflect the volume of the respectiveindicator, growing from light blue, through green, red, to dark blue as the highest. (In black and whiteversion - the darker and wider the line - the higher is the volume)
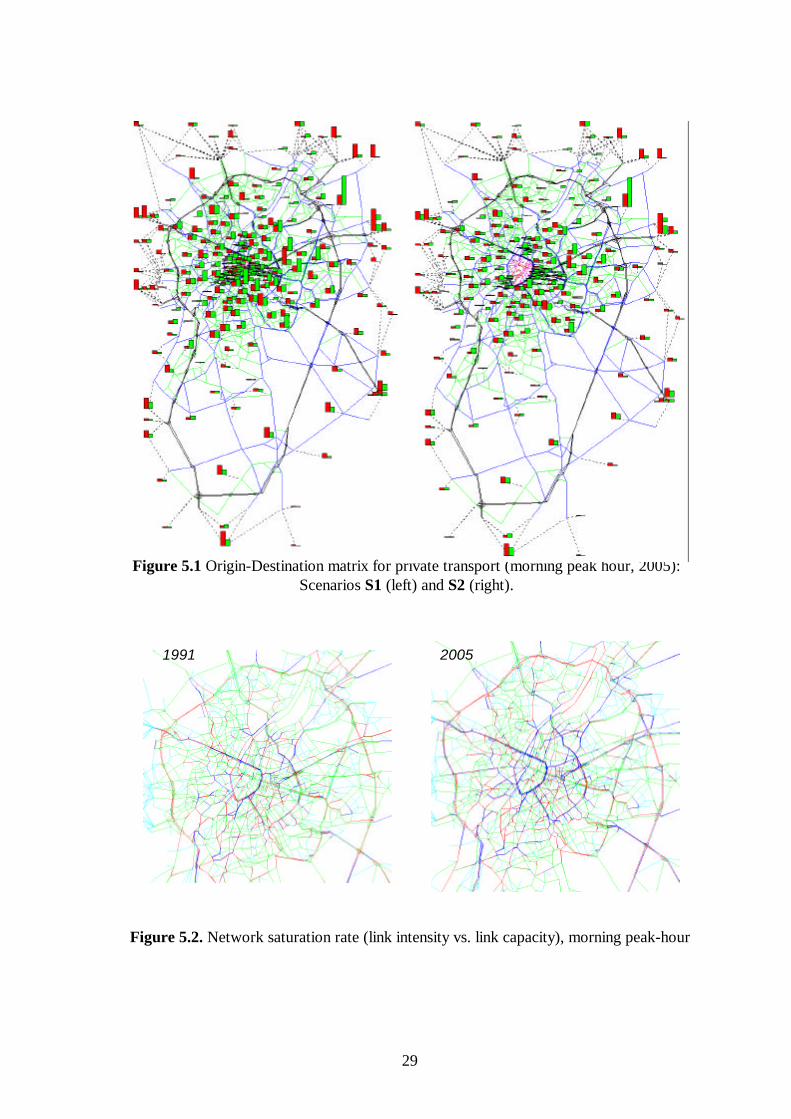
29
Figure 5.2. Network saturation rate (link intensity vs. link capacity), morning peak-hour
1991 2005
Figure 5.1 Origin-Destination matrix for private transport (morning peak hour, 2005):Scenarios S1 (left) and S2 (right).
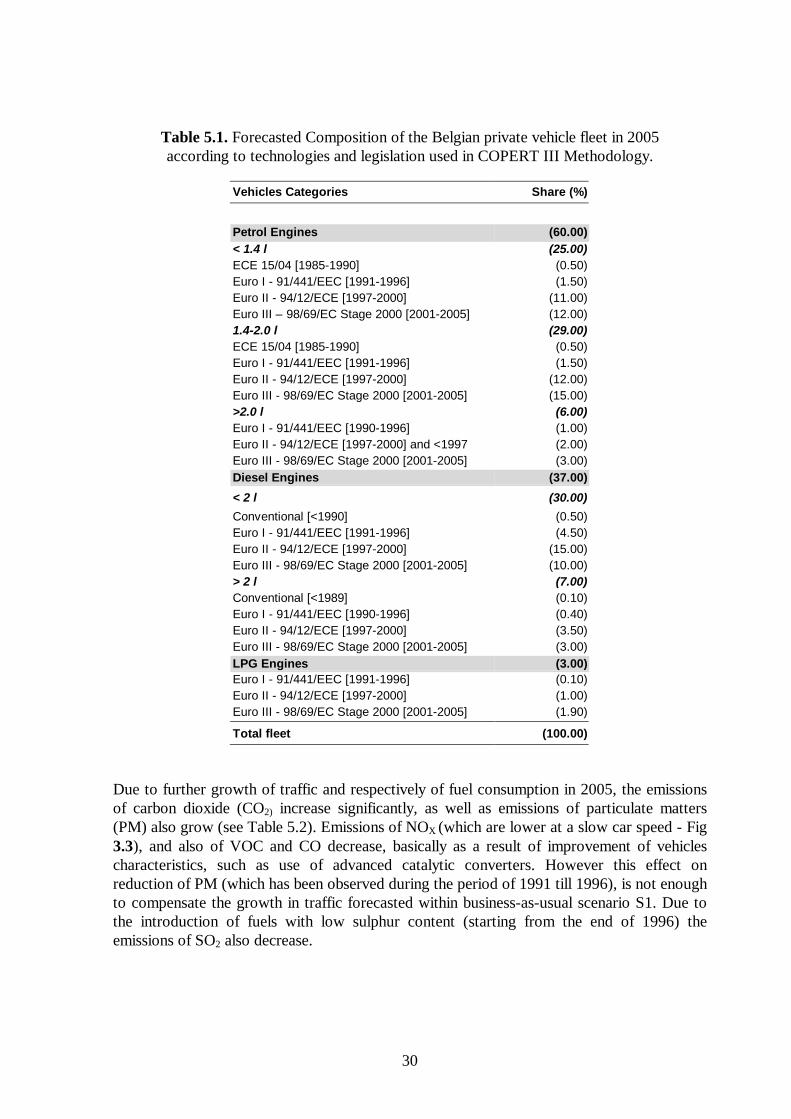
30
Table 5.1. Forecasted Composition of the Belgian private vehicle fleet in 2005according to technologies and legislation used in COPERT III Methodology.
Vehicles Categories Share (%)
Petrol Engines (60.00)< 1.4 l (25.00)ECE 15/04 [1985-1990] (0.50)Euro I - 91/441/EEC [1991-1996] (1.50)Euro II - 94/12/ECE [1997-2000] (11.00)Euro III – 98/69/EC Stage 2000 [2001-2005] (12.00)1.4-2.0 l (29.00)ECE 15/04 [1985-1990] (0.50)Euro I - 91/441/EEC [1991-1996] (1.50)Euro II - 94/12/ECE [1997-2000] (12.00)Euro III - 98/69/EC Stage 2000 [2001-2005] (15.00)>2.0 l (6.00)Euro I - 91/441/EEC [1990-1996] (1.00)Euro II - 94/12/ECE [1997-2000] and <1997 (2.00)Euro III - 98/69/EC Stage 2000 [2001-2005] (3.00)Diesel Engines (37.00)
< 2 l (30.00)Conventional [<1990] (0.50)Euro I - 91/441/EEC [1991-1996] (4.50)Euro II - 94/12/ECE [1997-2000] (15.00)Euro III - 98/69/EC Stage 2000 [2001-2005] (10.00)> 2 l (7.00)Conventional [<1989] (0.10)Euro I - 91/441/EEC [1990-1996] (0.40)Euro II - 94/12/ECE [1997-2000] (3.50)Euro III - 98/69/EC Stage 2000 [2001-2005] (3.00)LPG Engines (3.00)Euro I - 91/441/EEC [1991-1996] (0.10)Euro II - 94/12/ECE [1997-2000] (1.00)Euro III - 98/69/EC Stage 2000 [2001-2005] (1.90)
Total fleet (100.00)
Due to further growth of traffic and respectively of fuel consumption in 2005, the emissionsof carbon dioxide (CO2) increase significantly, as well as emissions of particulate matters(PM) also grow (see Table 5.2). Emissions of NOX (which are lower at a slow car speed - Fig3.3), and also of VOC and CO decrease, basically as a result of improvement of vehiclescharacteristics, such as use of advanced catalytic converters. However this effect onreduction of PM (which has been observed during the period of 1991 till 1996), is not enoughto compensate the growth in traffic forecasted within business-as-usual scenario S1. Due tothe introduction of fuels with low sulphur content (starting from the end of 1996) theemissions of SO2 also decrease.
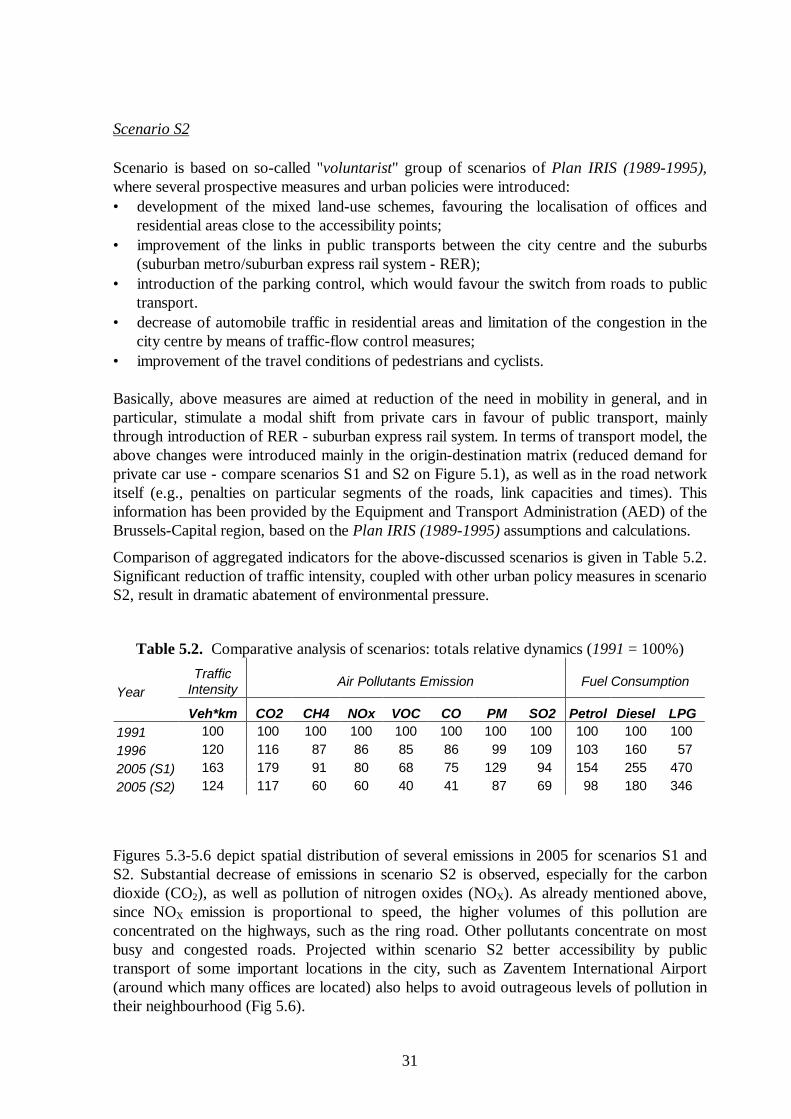
31
Scenario S2
Scenario is based on so-called "voluntarist" group of scenarios of Plan IRIS (1989-1995),where several prospective measures and urban policies were introduced:• development of the mixed land-use schemes, favouring the localisation of offices and
residential areas close to the accessibility points;• improvement of the links in public transports between the city centre and the suburbs
(suburban metro/suburban express rail system - RER);• introduction of the parking control, which would favour the switch from roads to public
transport.• decrease of automobile traffic in residential areas and limitation of the congestion in the
city centre by means of traffic-flow control measures;• improvement of the travel conditions of pedestrians and cyclists.
Basically, above measures are aimed at reduction of the need in mobility in general, and inparticular, stimulate a modal shift from private cars in favour of public transport, mainlythrough introduction of RER - suburban express rail system. In terms of transport model, theabove changes were introduced mainly in the origin-destination matrix (reduced demand forprivate car use - compare scenarios S1 and S2 on Figure 5.1), as well as in the road networkitself (e.g., penalties on particular segments of the roads, link capacities and times). Thisinformation has been provided by the Equipment and Transport Administration (AED) of theBrussels-Capital region, based on the Plan IRIS (1989-1995) assumptions and calculations.
Comparison of aggregated indicators for the above-discussed scenarios is given in Table 5.2.Significant reduction of traffic intensity, coupled with other urban policy measures in scenarioS2, result in dramatic abatement of environmental pressure.
Table 5.2. Comparative analysis of scenarios: totals relative dynamics (1991 = 100%)Traffic
Intensity Air Pollutants Emission Fuel ConsumptionYear
Veh*km CO2 CH4 NOx VOC CO PM SO2 Petrol Diesel LPG1991 100 100 100 100 100 100 100 100 100 100 1001996 120 116 87 86 85 86 99 109 103 160 572005 (S1) 163 179 91 80 68 75 129 94 154 255 4702005 (S2) 124 117 60 60 40 41 87 69 98 180 346
Figures 5.3-5.6 depict spatial distribution of several emissions in 2005 for scenarios S1 andS2. Substantial decrease of emissions in scenario S2 is observed, especially for the carbondioxide (CO2), as well as pollution of nitrogen oxides (NOX). As already mentioned above,since NOX emission is proportional to speed, the higher volumes of this pollution areconcentrated on the highways, such as the ring road. Other pollutants concentrate on mostbusy and congested roads. Projected within scenario S2 better accessibility by publictransport of some important locations in the city, such as Zaventem International Airport(around which many offices are located) also helps to avoid outrageous levels of pollution intheir neighbourhood (Fig 5.6).

32
Figure 5.5. NOX Emissions (2005), Scenarios: S1 and S2
Figure 5.4. CH4 Emissions (2005), Scenarios: S1 and S2
Figure 5.3. CO2 Emissions (2005), Scenarios: S1 and S2
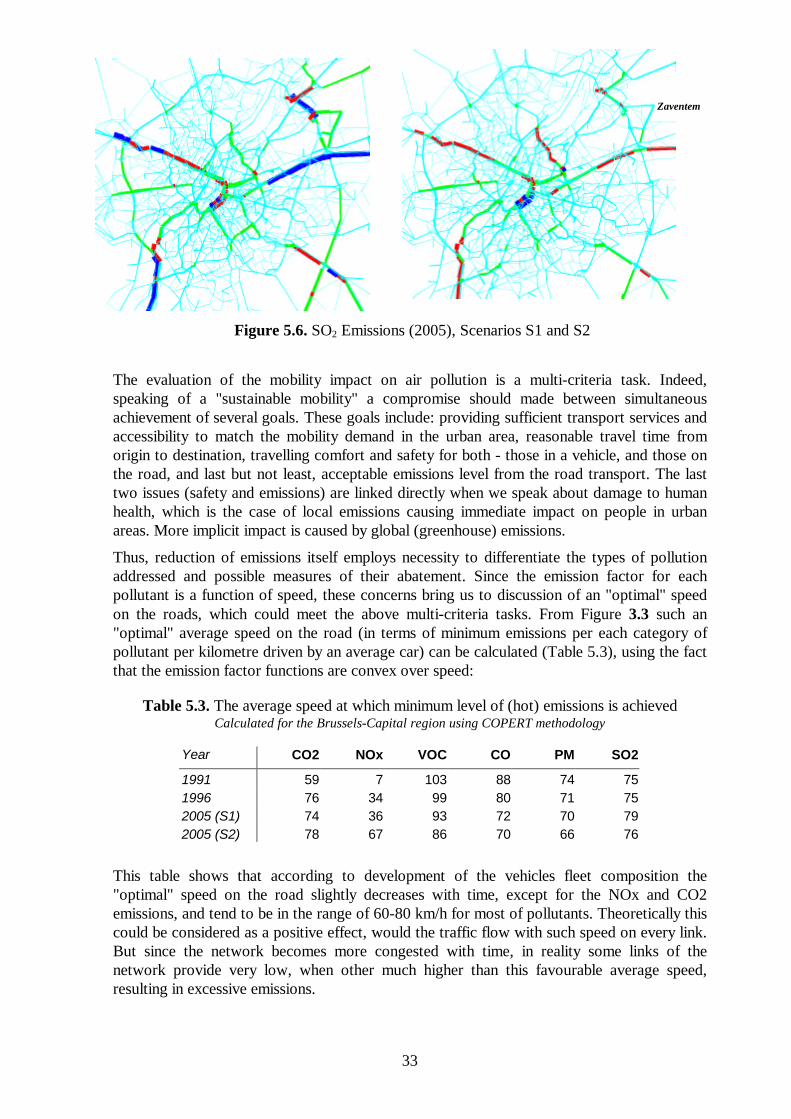
33
The evaluation of the mobility impact on air pollution is a multi-criteria task. Indeed,speaking of a "sustainable mobility" a compromise should made between simultaneousachievement of several goals. These goals include: providing sufficient transport services andaccessibility to match the mobility demand in the urban area, reasonable travel time fromorigin to destination, travelling comfort and safety for both - those in a vehicle, and those onthe road, and last but not least, acceptable emissions level from the road transport. The lasttwo issues (safety and emissions) are linked directly when we speak about damage to humanhealth, which is the case of local emissions causing immediate impact on people in urbanareas. More implicit impact is caused by global (greenhouse) emissions.
Thus, reduction of emissions itself employs necessity to differentiate the types of pollutionaddressed and possible measures of their abatement. Since the emission factor for eachpollutant is a function of speed, these concerns bring us to discussion of an "optimal" speedon the roads, which could meet the above multi-criteria tasks. From Figure 3.3 such an"optimal" average speed on the road (in terms of minimum emissions per each category ofpollutant per kilometre driven by an average car) can be calculated (Table 5.3), using the factthat the emission factor functions are convex over speed:
Table 5.3. The average speed at which minimum level of (hot) emissions is achievedCalculated for the Brussels-Capital region using COPERT methodology
Year CO2 NOx VOC CO PM SO2
1991 59 7 103 88 74 751996 76 34 99 80 71 752005 (S1) 74 36 93 72 70 792005 (S2) 78 67 86 70 66 76
This table shows that according to development of the vehicles fleet composition the"optimal" speed on the road slightly decreases with time, except for the NOx and CO2emissions, and tend to be in the range of 60-80 km/h for most of pollutants. Theoretically thiscould be considered as a positive effect, would the traffic flow with such speed on every link.But since the network becomes more congested with time, in reality some links of thenetwork provide very low, when other much higher than this favourable average speed,resulting in excessive emissions.
Zaventem
Figure 5.6. SO2 Emissions (2005), Scenarios S1 and S2

34
6. Conclusions
Restoring mobility by only decreasing the road traffic congestion, that is, trying to suppressthe traffic bottlenecks, increasing the capacity of the main road networks, creating newparking lots or implementing sophisticated techniques of traffic management, is no longer arealistic strategy in the long term. These are the answers that have been applied for years withonly one objective: increase the flow and fluidity of automobile traffic. They are responsiblefor their own inefficiency because any possibility of an increase in mobility is used byresidential and economic players to increase even further their demand of automobile travel.
Experience has shown that in any city where measures were taken to increase the fluidity oftraffic, the initial problems reappear some years later in an even more acute form. Indeed, incities where road networks are very congested this approach only results in a slight shift ofthe thresholds and a slight postponement of the critical point. It enables a management of thesituation in the short term, but does not modify the fundamental causes of the problem. In anycase, it does not contribute to creating the new conditions required for a sustainabledevelopment of cities. In the case of Brussels, it would be particularly harmful as it wouldfavour the centrifugal powers that would empty it of its substance because of the Region’ssmall area (Duchâteau, 1998).
As a possible way to find solutions to this problem, an integrated approach to modellingurban development, mobility and its environmental impacts is proposed and discussed withinrecent paper. As a first step in its implementation, we have designed a mobility model thatallows spatial assessment of the road traffic contribution to air pollutant emissions on anetwork flow model.
On the basis of the model, the contribution of road traffic to the pollutant emissions in theBrussels-Capital region has been determined. In particular, the comparison of two scenariosfor the year 2005 have been demonstrated, based on statistical trends, and majorconsiderations from Regional Mobility Plan (Plan IRIS, 1993-1997) for possible actions inthe future in order to increase accessibility in the city, reduce demand for mobility and favourmodal shift from private cars to public transport.
The general modelling results approve that these policies also lead to abatement of airpollution. Nevertheless, thought the reduction of carbon dioxide emissions in scenario S2 issignificant in comparison to S1, it is still not a sufficient contribution to general abatement ofgreenhouse gases so that to match the targets defined by Kyoto Protocol for Belgium. Thisconclusion, however, corresponds with many studies that indicate that these targets are fartoo optimistic, and they are likely not to be hit at the levels they are set now. Belgium wouldhave to either reconsider these obligations, or to search for more radical policies, perhapsmainly in energy and industry sectors, but also in transport. However, it is important torealise, that implementation of majority of measures defined in "voluntarist" scenario (S2) ofPlan IRIS would require, above all, serious behavioural changes in mobility patterns andmodal choice.
Stimulation of the use of LPG-driven vehicles is also seen by author as a possible way toreduction of emissions of some pollutants.
Results of modelling and recommendations drawn for regional and urban planning stressimportance of consideration of both local urban pollution and global greenhouse gases as onecomplex problem, rather than tackling them somehow separately. Practically this means that
35
the urban policies should be sought in systemic solutions, which would favour mixed land-useschemes radically reducing demand for mobility and the way people will travel.
Further development of the described system of models and of methods used forenvironmental impact assessment is recently underway within ongoing continuation of thisstudy at the CEESE-ULB in co-operation with the Brussels-Capital region administration.
Acknowledgements
This research project was financed by Federal Office for Scientific, Technical and CulturalAffairs (OSTC) of the Belgian Prime Minister Services within a Scientific and Technical Co-operation Program with Central and Eastern Europe during December 1999 - November2000.
Authors are thankful to The Equipment and Transport Administration (AED) of the Brussels-Capital region, in particular to Mr. Wouters, Mr. Broes, and Mr. Richel, for the informationand technical assistance they provided.
The Network Modelling Center within Statistics Department at Saint Cloud State University(Minnesota, USA) also provided the framework during spring 2001 for an enhanced study ofthe use of routing algorithms within TRIPS package, and the opportunity to accomplish thispaper. We are thankful to Mr. D. Guster for his co-operation and useful discussion.
References
Ahlvik, P. (MTC), et al, (1997), COPERT II, Computer Program to Calculate Emissionsfrom Road Transport - Methodology and Emission Factors (Final Draft Report),European Environment Agency, European Topic Centre on Air Emission.
Benarie M. M. (1980), Urban Air Pollution Modelling. Mac Millan Press, London.
Cross, R. F., and A. J. Lacey (1981). Sulphur Dioxide and Smoke Levels in West London,Atmospheric Environment, 15 (7), pp. 1261-1263.
de la Barra, T. (1998), Integrated land use and transport modelling: Decision Chains andHierarchies. Institute of Urbanism, Central University of Venezuela.
Duchâteau H. (1998), Mobility and Accessibility - The Case of Brussels, in Martine Labbé,Gilbert Laporte, Katalin Tanczos and Philippe Toint (eds.) Operations Research andDecision Aid Methodologies in Traffic and Transportation Management; NATO ASISeries.
European Commission (1995). ExternE: Externalities of Energy, EUR16520, Vol. 1-5,Luxembourg.
Favrel V., and Hecq, W. (1998), A model for the assessment of the contribution of roadtraffic to air pollution in the Brussels urban area, Proceedings of the First InternationalSymposium on Technological, Energy and Environmental Topics in Transports -"Externalities in the Urban Transport: Assessing and Reducing the Impacts", 27-29October 1998, Milan, Italy, 14 pp.
Gayda S. (1998), Stated Preferences Survey on residential location choice and modal choicein Brussels. Stratec, Belgium
36
Gilson B., Favrel V. and Hecq W. (1997), Overview and Analysis of the links between'Models of Mobility' and 'Models of Pollutant Emissions from Transport', Final report forEC DG-VII COST 319 Action, 49 pp.
Hallez, S., A. Derouane and G. Dumont (1982). L’influence du vent et de la température surles concentrations en dioxyde de soufre dans l’air ambiant, The Science of the TotalEnvironment, 26, pp. 87-97.
Hallez, S., L. Thiessen, A. Derouane and G. Verduyn (1989). L’influence du vent et de latempérature sur les concentrations en plomb dans l’air urbain, The Science of the TotalEnvironment, 86, pp. 265-271
Hecq, W., J-M Dupierreux and C. Debever (1992). Modélisation de la pollutionatmosphérique en relation avec les activités économiques de la Région Bruxelloise,Université Libre de Bruxelles, Centre d'Etudes Economiques et Sociales del'Environnement.
Hecq, W., I. Borisov, C. Debever and J-M Dupierreux (1994). An empirical hybrid model forthe assessment of daily SO2 concentrations in an urban environment, Journal ofEnvironmental Management, 42, pp.181-198.
Hecq, W., I. Borisov and Ph. Hautier (1995). An estimate of daily NO and NO2
concentrations in an urban environment, Third International Symposium « Transportand Air Pollution », Avignon, Poster proceedings, pp. 59-64.
Hecq W. (1998), "Contribution of fossil fuels and air pollutants emissions in Belgium since1980. The role of traffic", Catalysis and Automotive Pollution Control IV, Studies inSurface Science and Catalysis, Vol 116, N.Kruse, A.Frennet and J-M.Bastin (Eds.),Elsevier Science, 1998, p.p 5-22.
Jakeman, A.J., R. W. Simpson and J.A. Taylor (1988). Modelling Distributions of AirPollutant Concentrations – The Hybrid Deterministic – statistical Distribution Approach,Atmospheric Environment, 22(1), pp. 163-174.
Kyoto Protocol to the United Nations Framework Convention On Climate Change, UN,1997
Lobe P., Duchâteau H. (1998), Impacts Of Transport Price on Mobility and Land Use in TheBrussels Area, paper at the International Symposium on Technological andEnvironmental Topics in Transports – “Externalities in the Urban Transport: Assessingand Reducing the Impacts”, October 1998.
Ledley T. S., E. T. Sundquist, S. E. Schwartz, D. K. Hall, J. D. Fellows, and T. L. Killeen,Climate Change and Greenhouse Gases, EOS, Vol. 80, No. 39, September 28, 1999, p.453.
Meurrens, A., Y. Lenelle, S. Hallez and G. Verduyn (1983). Modélisation de l’influencemétéorologique sur la formation des sultates atmosphériques en Belgique, The Science ofthe Total Environment, 38, pp. 213-223.
Plan IRIS - Plan Régional de Déplacements (1989-1995), Ministère de la Région deBruxelles-Capitale. Bruxelles (in French), including:
P.R.A.S. - Plan Régional de Affectacion de Sol (1995), Regional Plan of Land Use ,Ministère de la Région de Bruxelles-Capitale. Bruxelles (in French)
PRD - Plan Régional de Dévelopments (1995), Regional Development Plan, Ministère de laRégion de Bruxelles-Capitale. Bruxelles (in French)
37
Proost, S., Braden J.,(eds.) Climate Change, Transport and Environmental Policy - empiricalapplications in a Federal System, Edward Elgar, 1998.
Safonov P., Favrel V., and Hecq W. (2000a), Sustainable Mobility Scenarios for theBrussels-Capital Region: Socio-Economic Factors and Air Polution Analysis,presentation at the 3rd European Society for Ecological Economics Conference (ESEE2000), Vienna, Austria, May, 2000.
Safonov P., Favrel V., and Hecq W. (2000b), Urban Transport Policies and GreenhouseGases Emissions in Brussels, presentation at the 6th International Society for EcologicalEconomics Meeting (ISEE 2000), Canberra, Australia, July, 2000.
Sanger R.P et al. (1997), Motor vehicle emission regulations and fuel specifications. Part 2.Detailed information and historic review (1970-1996), report 6/97, CONCAWE,Brussels, March 1997
Schimel, D., et al., Radiative forcing of climate change, in Climate Change 1995: The Scienceof Climate Change, edited by J. T. Houghton, L. G. M. Filho, B. A.
Southworth, Frank, (1995), A Technical Review of Urban Land Use-Transportation Modelsas Tools for Evaluating Vehicle Travel Reduction Strategies , Center for TransportationAnalysis Energy Division , Oak Ridge National Laboratory, TN, USA
TRIPS - The Professional Transportation Planning Package, Version 32. (1999), MVASystematica, Surrey, UK
UNFCCC, Report on the in-depth review of the first and second national communications ofBelgium, FCCC/IDR.1/BEL, FCCC/IDR.2/BEL, 27 July 2000
UNFCCC, Report on national greenhouse gas inventory data from Parties for 1990 to 1998,FCCC/SBI/2000/11, 5 September 2000