Urban Outdoor Measurement Study of Phased Antenna Array ...
14
1 Urban Outdoor Measurement Study of Phased Antenna Array Impact on Millimeter-Wave Link Opportunities and Beam Misalignment Lars Kuger, Aleksandar Ichkov, Petri Mähönen and Ljiljana Simi´ c Abstract—Exploiting multi-antenna technologies for robust beamsteering to overcome the effects of blockage and beam misalignment is the key to providing seamless multi-Gbps con- nectivity in millimeter-wave (mm-wave) networks. In this paper, we present the first large-scale outdoor mm-wave measurement study using a phased antenna array in a typical European town. We systematically collect fine-grained 3D angle-of-arrival (AoA) and angle-of-departure (AoD) data, totaling over 50,000 received signal strength measurements. We study the impact of phased antenna arrays in terms of number of link opportunities, achievable data rate and robustness under small-scale mobility, and compare this against reference horn antenna measurements. Our results show a limited number of 2–4 link opportunities per receiver location, indicating that the mm-wave multipath richness in a European town is surprisingly similar to that of dense urban metropolises. The results for the phased antenna array reveal that significant losses in estimated data rate occur for beam misalignments in the order of the half-power beamwidth, with significant and irregular variations for larger misalignments. By contrast, the loss for horn antennas is monotonically increasing with the misalignment. Our results strongly suggest that the effect of non-ideal phased antenna arrays must be explicitly considered in the design of agile beamsteering algorithms. Index Terms—Millimeter wave, phased antenna array, beam misalignment, multipath propagation, urban deployments. I. I NTRODUCTION Multi-antenna technologies are the key enabler for unlock- ing the potential of millimeter-wave (mm-wave) spectrum bands in 5G-and-beyond networks [1], [2]. A number of mm-wave outdoor measurement campaigns, predominantly using channel sounder setups with horn antennas, e.g. [3]–[8], have now demonstrated the fundamental feasibility of mm- wave links in urban environments and resulted in mm-wave statistical channel models (see [9] and references therein). This year has also seen the first test commercial mm-wave outdoor deployments, albeit with limited capabilities and per- formance [10]. Directional high-gain antenna beams are used to overcome the high path loss at mm-wave frequencies, but the sensitivity to misalignment of antenna beams [5], [11] and the effect of link blockage due to environmental and mobile obstacles such as buildings [12] and humans [13], remain primary challenges for seamless coverage in large-scale mobile network deployments. The key to making mm-wave All authors are with the Institute for Networked Systems, RWTH Aachen University, Kackertstrasse 9, 52072 Aachen, Germany. E-mail: {lku, aic, pma, lsi}@inets.rwth-aachen.de. cellular networks a reality is thus exploiting multi-antenna technology for robust and precise beamsteering to overcome effects of blockage and beam misalignment caused by large and small-scale mobility, and provide seamless gigabit-per- second (Gbps) connectivity. Great advances have been reported in the literature regarding mm-wave antenna technology and testbeds [14]–[17], but the evaluation of these devices has been largely conducted in controlled indoor environments. The notable exceptions to this are [18]–[21], which demonstrated outdoor coverage measurements using mm-wave phased antenna arrays. How- ever, these works lack fine-grained angle-of-arrival (AoA) and angle-of-departure (AoD) measurements, which are crucial for understanding the impact of beam misalignment on mm- wave link and network performance, and for evaluation of beam training algorithms that are essential for mm-wave initial access and mobility management. Other prior outdoor measurement studies, e.g. [3]–[8], used horn antenna or omni- directional antenna setups. The existing literature thus offers very limited insight on the performance of mm-wave antenna arrays in a real outdoor urban network environment, in partic- ular with respect to the beamsteering opportunities and beam misalignment effects, which is a crucial input for system-level engineering design of future mm-wave networks. In this paper, we present the first large-scale outdoor urban mm-wave measurement study using a state-of-the-art phased antenna array, collecting received signal strength (RSS) data over systematic fine-grained 3D AoA and AoD orientations in a typical European town. We study the impact of phased antenna arrays in terms of the number of link opportunities, achievable data rate and robustness under small-scale mobility – which we emulate based on our fine-grained angular mea- surements – and directly compare this against reference horn antenna measurements. Our results show a limited number of 2–4 available distinct spatial link opportunities per receiver location, indicating that the mm-wave multipath richness in a typical European town center is surprisingly similar to that in dense urban areas as presented in [3], [4], [6], [8]. The results for the phased antenna array reveal that losses in estimated data rate of up to 70% occur for small beam misalignments in the order of the half-power beamwidth (HPBW), with significant and irregular variations in estimated data rate for larger misalignments due to the non-ideal phased antenna array radiation pattern. By contrast, the loss in estimated data rate for the horn antenna setup is monotonically increasing with the orientation error. This shows that earlier measurement studies arXiv:1909.12024v2 [eess.SP] 10 Jan 2020
Transcript of Urban Outdoor Measurement Study of Phased Antenna Array ...

1
Urban Outdoor Measurement Study of PhasedAntenna Array Impact on Millimeter-Wave Link
Opportunities and Beam MisalignmentLars Kuger, Aleksandar Ichkov, Petri Mähönen and Ljiljana Simic
Abstract—Exploiting multi-antenna technologies for robustbeamsteering to overcome the effects of blockage and beammisalignment is the key to providing seamless multi-Gbps con-nectivity in millimeter-wave (mm-wave) networks. In this paper,we present the first large-scale outdoor mm-wave measurementstudy using a phased antenna array in a typical Europeantown. We systematically collect fine-grained 3D angle-of-arrival(AoA) and angle-of-departure (AoD) data, totaling over 50,000received signal strength measurements. We study the impact ofphased antenna arrays in terms of number of link opportunities,achievable data rate and robustness under small-scale mobility,and compare this against reference horn antenna measurements.Our results show a limited number of 2–4 link opportunities perreceiver location, indicating that the mm-wave multipath richnessin a European town is surprisingly similar to that of dense urbanmetropolises. The results for the phased antenna array revealthat significant losses in estimated data rate occur for beammisalignments in the order of the half-power beamwidth, withsignificant and irregular variations for larger misalignments. Bycontrast, the loss for horn antennas is monotonically increasingwith the misalignment. Our results strongly suggest that the effectof non-ideal phased antenna arrays must be explicitly consideredin the design of agile beamsteering algorithms.
Index Terms—Millimeter wave, phased antenna array, beammisalignment, multipath propagation, urban deployments.
I. INTRODUCTION
Multi-antenna technologies are the key enabler for unlock-ing the potential of millimeter-wave (mm-wave) spectrumbands in 5G-and-beyond networks [1], [2]. A number ofmm-wave outdoor measurement campaigns, predominantlyusing channel sounder setups with horn antennas, e.g. [3]–[8],have now demonstrated the fundamental feasibility of mm-wave links in urban environments and resulted in mm-wavestatistical channel models (see [9] and references therein).This year has also seen the first test commercial mm-waveoutdoor deployments, albeit with limited capabilities and per-formance [10]. Directional high-gain antenna beams are usedto overcome the high path loss at mm-wave frequencies, butthe sensitivity to misalignment of antenna beams [5], [11]and the effect of link blockage due to environmental andmobile obstacles such as buildings [12] and humans [13],remain primary challenges for seamless coverage in large-scalemobile network deployments. The key to making mm-wave
All authors are with the Institute for Networked Systems, RWTH AachenUniversity, Kackertstrasse 9, 52072 Aachen, Germany.
E-mail: {lku, aic, pma, lsi}@inets.rwth-aachen.de.
cellular networks a reality is thus exploiting multi-antennatechnology for robust and precise beamsteering to overcomeeffects of blockage and beam misalignment caused by largeand small-scale mobility, and provide seamless gigabit-per-second (Gbps) connectivity.
Great advances have been reported in the literature regardingmm-wave antenna technology and testbeds [14]–[17], butthe evaluation of these devices has been largely conductedin controlled indoor environments. The notable exceptionsto this are [18]–[21], which demonstrated outdoor coveragemeasurements using mm-wave phased antenna arrays. How-ever, these works lack fine-grained angle-of-arrival (AoA) andangle-of-departure (AoD) measurements, which are crucialfor understanding the impact of beam misalignment on mm-wave link and network performance, and for evaluation ofbeam training algorithms that are essential for mm-waveinitial access and mobility management. Other prior outdoormeasurement studies, e.g. [3]–[8], used horn antenna or omni-directional antenna setups. The existing literature thus offersvery limited insight on the performance of mm-wave antennaarrays in a real outdoor urban network environment, in partic-ular with respect to the beamsteering opportunities and beammisalignment effects, which is a crucial input for system-levelengineering design of future mm-wave networks.
In this paper, we present the first large-scale outdoor urbanmm-wave measurement study using a state-of-the-art phasedantenna array, collecting received signal strength (RSS) dataover systematic fine-grained 3D AoA and AoD orientationsin a typical European town. We study the impact of phasedantenna arrays in terms of the number of link opportunities,achievable data rate and robustness under small-scale mobility– which we emulate based on our fine-grained angular mea-surements – and directly compare this against reference hornantenna measurements. Our results show a limited number of2–4 available distinct spatial link opportunities per receiverlocation, indicating that the mm-wave multipath richness in atypical European town center is surprisingly similar to that indense urban areas as presented in [3], [4], [6], [8]. The resultsfor the phased antenna array reveal that losses in estimateddata rate of up to 70% occur for small beam misalignmentsin the order of the half-power beamwidth (HPBW), withsignificant and irregular variations in estimated data rate forlarger misalignments due to the non-ideal phased antenna arrayradiation pattern. By contrast, the loss in estimated data ratefor the horn antenna setup is monotonically increasing with theorientation error. This shows that earlier measurement studies
arX
iv:1
909.
1202
4v2
[ee
ss.S
P] 1
0 Ja
n 20
20

2
[5], [11] or theoretical studies [22] of beam misalignmenteffects on mm-wave link and network performance using hornantennas or idealized directional antenna patterns cannot besimply generalized. Consequently, we analyze the implicationsthat our results have on the design for future beamsteeringalgorithms in mm-wave outdoor network deployments.
The rest of the paper is organized as follows. Sec. II givesthe related work overview. Sec. III presents our measurementsetup and methodology. Our measurement results are presentedand analyzed in Sec. IV. In Sec. V we discuss the engineeringimplication of our findings for outdoor mm-wave networkdeployments. Finally, Sec. VI concludes the paper.
II. RELATED WORK
Recent years have seen great advances in mm-wave phasedantenna arrays and corresponding transceivers for base stations(BSs) and user equipment (UE). For instance, Samsung [14],IBM and Ericsson [15], and Sivers IMA [16] have presentedmm-wave phased antenna array modules, and new mm-wavetestbed using e.g. SiBeam’s phased antenna arrays have beendemonstrated [17]. However, these new mm-wave transceiversand phased antenna array designs have largely been evaluatedin controlled environments [14]–[17], rather than in real out-door urban settings. Notable exceptions to this are the studiesin [18]–[21]. In [18]–[20] data rate measurements with 28GHz multi-antenna arrays were conducted in outdoor mea-surements, analyzing the possible coverage in potential mm-wave cells. In [21] the RSS over AoD was measured at severalreceiver positions in a car park using an omni-directionalantenna at the receiver and a 60 GHz phased antenna array atthe transmitter, finding strong reflected paths for many receiverpositions. Yet, these studies did not include detailed AoA andAoD measurements to thoroughly investigate beamsteeringopportunities and limitations caused by beam misalignment.Table I shows an overview of related mm-wave measurements.By contrast, in this work we present the results of the firstcomprehensive large-scale urban measurement campaign withmm-wave phased antenna arrays systematically collecting RSSover fine-grained AoA and AoD antenna orientations.
Independently from the advances in mm-wave multi-antennatechnology, a number of mm-wave measurement campaignswith horn or omnidirectional antennas have been conducted inoutdoor environments with the aim of establishing statisticalmm-wave channel models (see [2] and references therein).Rappaport et al. [3] conducted seminal measurements in urbanareas using a channel sounder with mechanically steerablehorn antennas to record power delay profiles for a limitedselected range of AoA and AoD combinations at each trans-mitter (TX)/receiver (RX) pair. Similar measurement method-ologies have been employed in other measurement campaigns,e.g. [4], [6]–[8], and measurement-based statistical channelmodels such as the NYU model [23] have consequently beenproposed (see [9] and references therein). Overall, the studiesin [3], [4], [6], [8] reported a limited number of 2–5 mm-wavemultipath clusters per TX/RX pair for urban areas in differentmetropolises. However, as these measurement campaigns usedhorn or omnidirectional antennas and focused on statistical
channel characteristics – rather than on systematic RSS overAoA/AoD measurements as in our work – they do not allowus to study the impact of phased antenna arrays on spatial linkopportunities and beam misalignment in mm-wave networks.By contrast, we conducted our measurement campaign withboth phased antenna arrays and horn antennas to bridge the gapbetween prior measurement campaigns using horn antennas[3], [4], [7], [8] and future mm-wave networks using phasedantenna arrays. Moreover, we conducted measurements in atypical European town with significantly different buildinglayout and materials as compared to big cities as in most prioroutdoor studies (cf. Table I).
Lee et al. [11] studied the effect of beam misalignmentbased on measurements taken with horn antennas. To thatend, mm-wave power measurements were systematically col-lected across azimuth angles in both free-space and urbanenvironments. The conclusion based on these horn antennameasurements was that for a fixed beamwidth, the power lossincreases linearly with increasing beam misalignment untilsaturation is reached. This confirms the results of Simic etal. in [5], where the RSS over AoA/AoD was systematicallymeasured with a horn antenna setup in an urban environmentin the 60 GHz band. The results in [5], [11] stand in contrastto the results of our phased antenna array measurements in thispaper, which show a distinct non-linear relationship betweenmisalignment and power loss. Moreover, our results therebyclarify artifacts that were observed in [17], where a mm-wave testbed using a phased antenna array with 25◦ beamswas used to study the effect of beam misalignment on theSNR in indoor environments. For large misalignments theresults showed artifacts, which the authors speculated wouldnot occur with horn antennas. In our work, we demonstrate thatthis indeed is caused by the non-ideal, phased antenna arraypattern by explicitly comparing our measurements againstthose with a horn antenna in the same outdoor scenarios.Our comparison underlines the paradigm shift that occurs interms of beam misalignment effects – and thus practical beamtraining implications – when moving from horn antennas toreal phased antenna arrays.
We emphasize that while a large number of beam trainingstrategies for initial random access and mobility managementin mobile mm-wave networks have been proposed, their eval-uation has likewise been largely restricted to measurementswith horn antenna setups [24], simulations based on simplifiedbeam models [25], or commercial off the shelf equipmentwith limited control of the actual beam patterns [26]. Yet, forpractical testing and development of high-performing beamtraining algorithms, rich angular data based on real phasedantenna array measurements as presented in this paper isessential. To this end, we provide open access to our data [27].
In addition to empirical research, the effect of beam mis-alignment on mm-wave network performance has also beenaddressed from a theoretical perspective. For instance, Wild-man et al. [22] show that in theory sidelobes can be beneficialto the success probability of a transmission in low densitynetworks and that the spatial throughput and transmission ca-pacity maximizing beamwidth has a nearly linear relationshipwith the mean orientation error for Gaussian and sectored

3
TABLE IOVERVIEW OF RELATED WORK SHOWING THE USED ANTENNA TYPE, WHETHER AOA AND AOD WAS COLLECTED SYSTEMATICALLY OUTDOORS (OUT.)
WITH ANGULAR AZIMUTH RESOLUTION ∆, THE MAXIMUM MEASURED TX-RX BEAM ORIENTATION PAIRS PER TX-RX LOCATION N , AND WHETHERBEAM MISALIGNMENT (MIS.) WAS STUDIED.
Ref. Out. Environment Antenna type AoA AoD ∆ N Mis.Omni Horn Array
[14]–[16] 7 Lab – 7 3 7 7 N/A N/A 7[6] 3 Large European city 3 7 7 7 7 N/A N/A 7[18]–[20] 3 Parking lot/campus/Tokyo – 7 3 7 7 N/A N/A 7[21] 3 Parking lot 3 7 3 7 3 5◦ 133 7[7] 3 Parking lot – 3 7 3 7 10◦ 108 7[11] 3 Large Korean city 3 3 7 3 7 10◦ 36 3[8] 3 Large Korean city – 3 7 3 3 10◦ 36,504 7[3], [4] 3 US cities – 3 7 3 3 5–10◦ 540 7[17] 7 Office – 7 3 3 3 5◦ 625 3[5] 3 Small European city – 3 7 3 3 3.6◦ 64,000 3This paper 3 Small European city – 3 3 3 3 5–9◦ 7,200 3
antenna radiation pattern models. As such idealized radiationpattern models are much more similar to a horn antennaradiation pattern than that of a real phased antenna array,our results strongly suggest that a linear relationship will nothold in real mm-wave deployments and that the consequencesof this idealization on the requirements and opportunitiesof beamsteering algorithms and network system design havebeen underestimated. Therefore, our work forms a basis forrealistic models of beam misalignment effects in urban mm-wave networks.
III. MEASUREMENT SETUP & METHODOLOGY
Our outdoor measurement campaign was conducted in theGerman town of Langenfeld during the summer of 2018. Thestudy area constitutes the central pedestrian zone with mainlyshops in the surroundings. The buildings typically have 2-5floors and are constructed of concrete with large windows andsome metal parts on the facades.
The TX was located at different positions on the rooftop ofa multi-floor car park at a height of 9.7 m. The RX positionsA–D were located in the pedestrian zone, i.e. on ground level,with the mounted antenna at a height of 1.7 m. Fig. 1 shows anaerial image of the area where the TX positions (1, 2) and RXpositions (A, B, C, D) are marked. Fig. 2 shows the differentTX/RX positions during the measurements. The RX is circledin green and the TX in orange. The positions were chosenbased on representative scenarios as follows:• TX1-RXA: Typical scenario with clear LOS and TX-RX
distance of 25 m (Fig. 2a).• TX1-RXB and TX2-RXB: RX-B was chosen to investigate
the effects of an obstructed LOS and evaluate the cover-age from different TX positions for the same RX position.In scenario TX1-RXB the LOS is partially blocked bya building corner, while in scenario TX2-RXB the LOSis partially blocked by a lamp-post with a flower boxmounted on it (Figs. 2b-2c).
• TX1-RXC: Represents a typical street canyon with 18 mwidth and buildings to either side. The LOS path waspredominantly clear despite tree foliage (Fig. 2d).
• TX2-RXD: Scenario chosen to investigate the effect of treefoliage on mm-wave coverage, with a TX-RX distance
Transmitter positionReceiver positionRX C
RX B
RX A
RX D
TX 1
TX 2
Fig. 1. Aerial view of the TX (1-2) and RX positions (A-D). The measurementscenarios are listed in Table II. (Photo courtesy of [28]).
of 28 m and clearly visible trees obstructing the LOS(Fig. 2e).
For our measurement campaign we used two different60 GHz transceiver setups, one using a phased antenna arrayand the other using a horn antenna for comparison. A relativelynarrowband signal transmission was chosen (1 MHz) to obtainfine-grained RSS over AoA/AoD data, allowing us to havea robust setup that does not require extensive calibration asthe gain over the frequency band is flat. Since we are notinterested in a time-characterization of the channel, the nar-rowband power measurements are sufficient for our objectiveof characterizing spatial mm-wave link opportunities in atypical outdoor environment and beamsteering requirementsfor maintaining a reliable link connectivity under small-scalemobility. We note that frequency bands in the range of 24–86 GHz are under consideration for 5G-and-beyond mm-wavecellular networks [29]. In this paper, we report measurementsin the 60 GHz band without the loss of generality and forcomparability with prior mm-wave outdoor urban measure-

4
(a) TX 1 seen from RXA.
(b) TX 1 and RX B. (c) RX B seen from TX2.
(d) RX C seen from TX1.
(e) TX 2 and RX D. (f) 3D turntable withmounted antenna array
transceiver
Fig. 2. TX and RX in different positions during measurements. The RX iscircled in green and TX in orange.
ment studies, e.g. [3], [5], [18], [21].
A. Phased Antenna Array Setup
We used the SiversIMA 57-71 GHz phased antenna arrayradio frequency integrated circuit (RFIC) TRX BF/01 [30]with the corresponding evaluation kit EVK06002 [31]. Theevaluation kit includes a 16+16 (TX/RX) patch antenna mod-ule [16] and based on a codebook with 64 different entries,the beam can be steered in the azimuth plane in the range[+45◦,−45◦]. Fig. 3a shows a schematic drawing of the phasedantenna array board and the RFIC. Figs. 3c-3d compare themeasured phased antenna array radiation pattern with thesimulated one obtained using MATLAB’s Phased Array SystemToolbox based on generic patch antenna elements. We note theconsiderable differences between the ideal, simulated and thereal, measured radiation pattern.
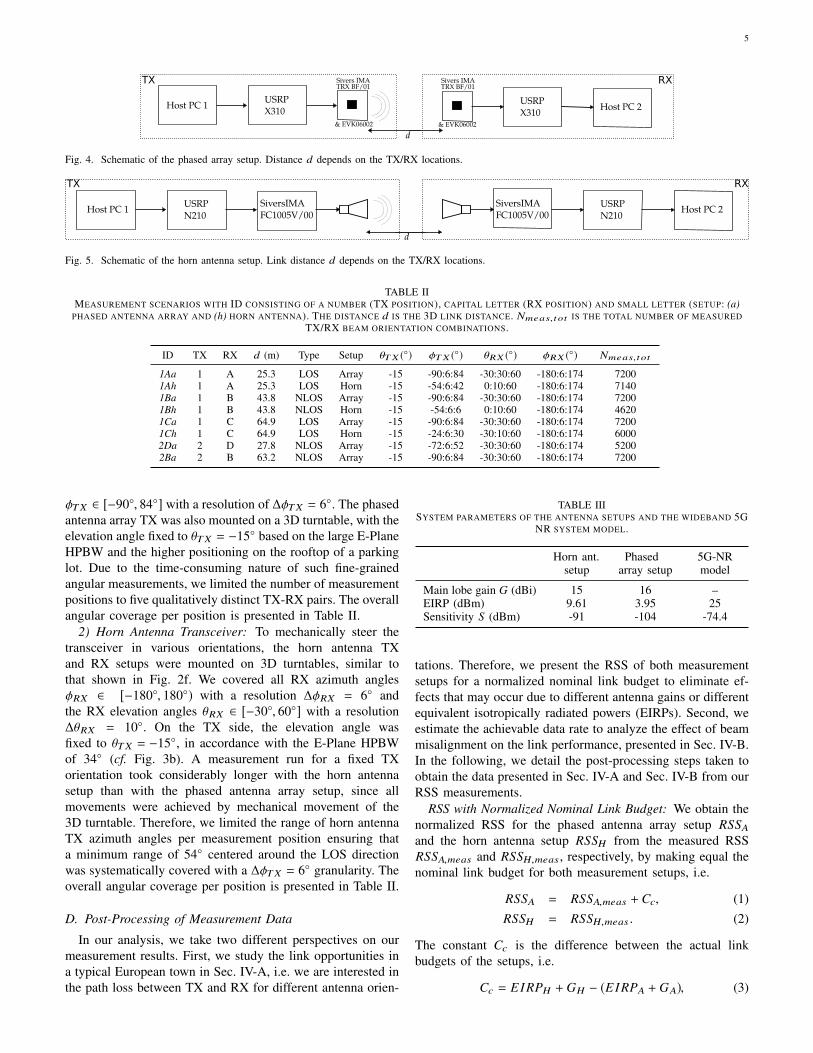
Fig. 4 shows the schematic of the phased antenna arraysetup with the TX including host PC 1, USRP X310 SDRwith LFTX daughterboards, and the phased antenna arraytransceiver, and the RX consisting of an equivalent setup. Atthe TX, the host PC 1 generates a complex sinusoidal signalat the frequency fsin = 250 kHz, which the USRP converts toan analog baseband signal with a sampling rate fs = 1 MHz.The phased antenna array transceiver upconverts the signal toa frequency fc = 58.32 GHz, and transmits the signal over theair. The RX transceiver downconverts the signal before it issampled with sampling rate fs at the USRP. At the host PC 2,the power spectrum of the signal is computed using a flattopwindow. Finally, the signal strength RSSA,meas of the receivedsinusoidal signal is extracted from the power spectrum. Thiswas calibrated against a setup of standard gain horn antenna,Agilent 11970V mixer, and Agilent E4440A spectrum analyzerwith a resolution bandwidth similar to the binwidth of thedigitally computed power spectrum; differences in antennagain and cable losses were accounted for.
y
x2a
(a) Phased antenna arrayboard with a = 0.71mm,y = 2.4mm, x = 2.97mm.
0◦30◦
60◦
90◦
120◦
150◦180◦
210◦
240◦
270◦
300◦
330◦
−40 dBi−30 dBi−20 dBi−10 dBi
0 dBi10 dBi20 dBi
H-planeE-plane
(b) The simulated horn antennapower pattern.
0◦30◦
60◦
90◦
120◦
150◦180◦
210◦
240◦
270◦
300◦
330◦
−50 dB−40 dB−30 dB−20 dB−10 dB
0 dB
MeasurementSimulation
(c) The phased antenna arrayH-plane power pattern normalized
to unity at the maximum.
0◦30◦
60◦
90◦
120◦
150◦180◦
210◦
240◦
270◦
300◦
330◦
−50 dB−40 dB−30 dB−20 dB−10 dB
0 dB
MeasurementSimulation
(d) The phased antenna arrayE-plane power pattern normalized to
unity at the maximum.
Fig. 3. Schematic drawing of the Sivers IMA TRX BF/01 phased antennaarray board and antenna radiation patterns.
B. Horn Antenna Setup
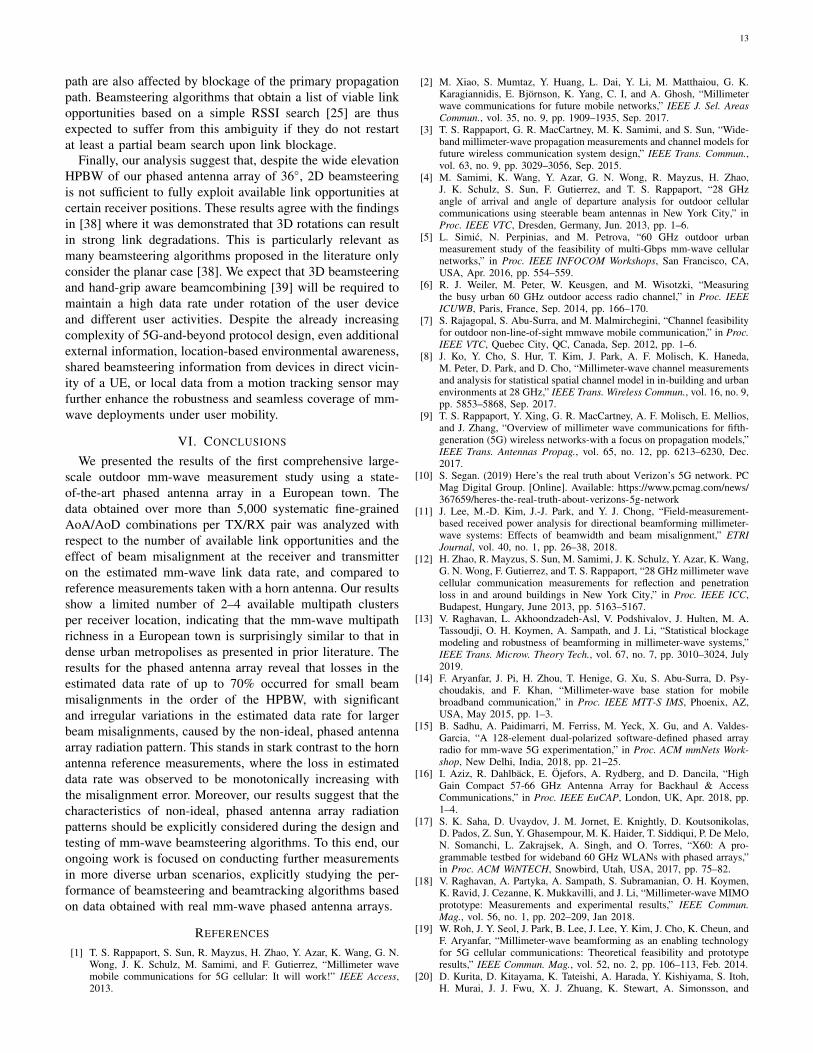
For comparison, our second setup used the FC1005V/00 57-66 GHz converter by SiversIMA [32] and a standard 15 dBigain horn antenna [33]. Fig. 3b shows the correspondingsimulated radiation pattern. The schematic of the horn antennasetup is shown in Fig. 5. The left part of the figure showsthe TX including the host PC 1, USRP N210 with WBXdaughterboard, Sivers IMA FC1005V/00 upconverter and thehorn antenna. The right part of the figure shows the RXconsisting of a similar setup as the TX. The transmission andreception signal chain of the horn antenna setup is equivalentto the phased antenna array setup (cf. Sec. III-A), except thatthe signal between the USRP and up-/downconverter is at theintermediate frequeny fIF = 1.32 GHz and not at baseband.The RSS at the horn antenna setup RSSH,meas was obtainedby the same calibrated procedure as described in Sec. III-A.
C. Measurement Procedure
To identify potential link opportunities and their respectiveAoA and AoD, we systematically swept the angular space bychanging the beam orientations at the TX and RX.
1) Phased Antenna Array Transceiver: For the mea-surements, we covered all orientations within azimuthφRX ∈ [−180◦, 180◦) and elevation (el.) θRX ∈ [−30◦, 60◦]at each RX position using a combination of electronic beam-steering by the phased antenna array and, when the electronicbeamsteering range was exceeded, mechanical movement by a3D turntable (cf. Fig. 2f). The azimuth and elevation resolutionof 6◦ and 30◦ were chosen based on the H- and E-plane HPBWof 6◦ and 36◦, respectively (cf. Figs. 3c–3d). The measurementtime per single RX orientation (φRX, θRX ) was 1 s. A sweepover all RX orientations for a single fixed TX orientation took500 s. This was repeated for all TX orientations in the range
5
Host PC 1 USRP X310
USRP X310 Host PC 2
d
TX RXTRX BF/01TRX BF/01
Sivers IMA Sivers IMA
& EVK06002 & EVK06002
Fig. 4. Schematic of the phased array setup. Distance d depends on the TX/RX locations.
Host PC 1 USRP N210
SiversIMAFC1005V/00
SiversIMAFC1005V/00
USRP N210 Host PC 2
d
TX RX
Fig. 5. Schematic of the horn antenna setup. Link distance d depends on the TX/RX locations.
TABLE IIMEASUREMENT SCENARIOS WITH ID CONSISTING OF A NUMBER (TX POSITION), CAPITAL LETTER (RX POSITION) AND SMALL LETTER (SETUP: (a)
PHASED ANTENNA ARRAY AND (h) HORN ANTENNA). THE DISTANCE d IS THE 3D LINK DISTANCE. Nmeas, tot IS THE TOTAL NUMBER OF MEASUREDTX/RX BEAM ORIENTATION COMBINATIONS.
ID TX RX d (m) Type Setup θTX (◦) φTX (◦) θRX (◦) φRX (◦) Nmeas, tot
1Aa 1 A 25.3 LOS Array -15 -90:6:84 -30:30:60 -180:6:174 72001Ah 1 A 25.3 LOS Horn -15 -54:6:42 0:10:60 -180:6:174 71401Ba 1 B 43.8 NLOS Array -15 -90:6:84 -30:30:60 -180:6:174 72001Bh 1 B 43.8 NLOS Horn -15 -54:6:6 0:10:60 -180:6:174 46201Ca 1 C 64.9 LOS Array -15 -90:6:84 -30:30:60 -180:6:174 72001Ch 1 C 64.9 LOS Horn -15 -24:6:30 -30:10:60 -180:6:174 60002Da 2 D 27.8 NLOS Array -15 -72:6:52 -30:30:60 -180:6:174 52002Ba 2 B 63.2 NLOS Array -15 -90:6:84 -30:30:60 -180:6:174 7200
φTX ∈ [−90◦, 84◦] with a resolution of ∆φTX = 6◦. The phasedantenna array TX was also mounted on a 3D turntable, with theelevation angle fixed to θTX = −15◦ based on the large E-PlaneHPBW and the higher positioning on the rooftop of a parkinglot. Due to the time-consuming nature of such fine-grainedangular measurements, we limited the number of measurementpositions to five qualitatively distinct TX-RX pairs. The overallangular coverage per position is presented in Table II.
2) Horn Antenna Transceiver: To mechanically steer thetransceiver in various orientations, the horn antenna TXand RX setups were mounted on 3D turntables, similar tothat shown in Fig. 2f. We covered all RX azimuth anglesφRX ∈ [−180◦, 180◦) with a resolution ∆φRX = 6◦ andthe RX elevation angles θRX ∈ [−30◦, 60◦] with a resolution∆θRX = 10◦. On the TX side, the elevation angle wasfixed to θTX = −15◦, in accordance with the E-Plane HPBWof 34◦ (cf. Fig. 3b). A measurement run for a fixed TXorientation took considerably longer with the horn antennasetup than with the phased antenna array setup, since allmovements were achieved by mechanical movement of the3D turntable. Therefore, we limited the range of horn antennaTX azimuth angles per measurement position ensuring thata minimum range of 54◦ centered around the LOS directionwas systematically covered with a ∆φTX = 6◦ granularity. Theoverall angular coverage per position is presented in Table II.
D. Post-Processing of Measurement Data
In our analysis, we take two different perspectives on ourmeasurement results. First, we study the link opportunities ina typical European town in Sec. IV-A, i.e. we are interested inthe path loss between TX and RX for different antenna orien-
TABLE IIISYSTEM PARAMETERS OF THE ANTENNA SETUPS AND THE WIDEBAND 5G
NR SYSTEM MODEL.
Horn ant.setup
Phasedarray setup
5G-NRmodel
Main lobe gain G (dBi) 15 16 –EIRP (dBm) 9.61 3.95 25Sensitivity S (dBm) -91 -104 -74.4
tations. Therefore, we present the RSS of both measurementsetups for a normalized nominal link budget to eliminate ef-fects that may occur due to different antenna gains or differentequivalent isotropically radiated powers (EIRPs). Second, weestimate the achievable data rate to analyze the effect of beammisalignment on the link performance, presented in Sec. IV-B.In the following, we detail the post-processing steps taken toobtain the data presented in Sec. IV-A and Sec. IV-B from ourRSS measurements.
RSS with Normalized Nominal Link Budget: We obtain thenormalized RSS for the phased antenna array setup RSSA
and the horn antenna setup RSSH from the measured RSSRSSA,meas and RSSH,meas , respectively, by making equal thenominal link budget for both measurement setups, i.e.
RSSA = RSSA,meas + Cc, (1)RSSH = RSSH,meas . (2)
The constant Cc is the difference between the actual linkbudgets of the setups, i.e.
Cc = EIRPH + GH − (EIRPA + GA), (3)

6
where EIRPH and EIRPA are the EIRPs of the horn antennasetup and the phased antenna array setup during the measure-ments, respectively, and GH and GA are the estimated mainlobe antenna gains of the horn antenna and the phased antennaarray, respectively. The values of these parameters are givenin Table III. We note that the validity of our results is notcompromised by this operation as the sensitivity of the phasedantenna array setup SA,meas was considerably lower than thesensitivity of the horn antenna setup SH,meas . The sensitivityof our overall measurement system after the normalization isstill limited by the horn antenna measurement setup, i.e.
S = max{SH,meas, SA,meas + Cc} = −91 dBm, (4)
which yields a dynamic range of 115 dB. This is sufficient forour study of spatial link opportunities and beam misalignmenteffects on achievable data rate, as very weak signals are notrelevant for stable high-speed mm-wave links and practicalbeamtraining. The normalized RSSs RSSA and RSSH obtainedafter this operation are presented in Sec. IV-A.
Estimating Achievable Data Rate: To analyze the effectof beam misalignment on the link performance, we mappedRSSA,meas and RSSH,meas to the estimated achievable datarate T , assuming a fixed BS EIRP of EIRPBS = 25 dBm,in line with existing regulations at 60 GHz [34]. First, themeasured received signal strengths RSSA,meas and RSSH,meas
were scaled according to the additional power that receiverswould receive for a BS transmitting with EIRPBS , i.e.
RSS′A = RSSA,meas + (EIRPBS − EIRPA), (5)RSS′H = RSSH,meas + (EIRPBS − EIRPH ). (6)
The overall sensitivity S′ of our overall measurement systemis then given by
S′ = max{SH,meas + (EIRPBS − EIRPH ),SA,meas + (EIRPBS − EIRPA)} (7)
= −75.61 dBm. (8)
To then map RSS′A and RSS′H to the estimated, achievabledata rate T for a wideband system, we used the Verizon 5G-NR model which demonstrated a maximum throughput of4 Gbps using an 800 MHz bandwidth [35]. An attenuated andtruncated version of the Shannon bound is used as a mappingfunction, similar to those used for modeling of link adaptionin LTE [36], i.e.
T =
0 for SNR < SNRmin,
αW log2(1 + SNR) for SNRmin ≤ SNRand SNR ≤ SNRmax,
Tmax for SNR > SNRmax,
(9)
where W = 800 MHz denotes the bandwidth, α = 0.75 is thecorrection factor for implementation losses, SNRmin = −4.5dB, and SNRmax = 20 dB. The modeled receiver is assumedto have a noise figure of NF = 10 dB and implementationloss of LI = 5 dB such that
SNR = RSS′A/H − (N + NF + LI ) (10)
where N = 10 log10(kBT) with Boltzmann constant k is thethermal noise for assumed temperature T = 290 K. We note
that this post-processing step does not compromise the validityof our measured data since the sensitivity S′ is still sufficientlylow to ensure detection of all signals that result in a data rategreater than zero, i.e.
SNR(RSS = S′) = −5.61 dB < SNRmin. (11)
The estimated data rate T obtained after this post-processingoperation is presented in Sec. IV-B.
IV. MEASUREMENT RESULTS & ANALYSIS
In this section, we present the results of the measurementcampaign outlined in Sec. III. In Sec. IV-A, we analyze avail-able link opportunities based on measured RSS. In Sec. IV-B,we analyze the effects of beam misalignment on the estimatedachievable mm-wave data rate.
A. Link Opportunities & AoA Analysis
In the following, we study significant link opportunitiesfound during our measurement campaign, trace the corre-sponding physical propagation paths on a map and analyzethe observed differences between the phased antenna array andhorn antenna data. We present our results as follows. Figs. 6-7 present the RSS versus RX orientations in a heatmap fromRX perspective, i.e. the RSS per RX orientation (φRX, θRX ).This allows us to investigate the structure of received multipathclusters. We assume for each RX orientation (φRX, θRX ) thebest corresponding TX orientation φTX found during the mea-surements to show the full set of multipath clusters available ateach RX location. Fig. 8 illustrates the same underlying dataas in Figs. 6-7, showing polar plots of the RSS on a schematicmap. Finally, in Fig. 9 we trace the corresponding independentphysical propagation paths between TX and RX based onthe AoA, AoD, and potential reflectors. In the following, ourresults are presented based on Figs. 6-9 location-by-location.
We start our analysis with a clear LOS scenario, i.e. at RXlocation A. A strong cluster around the LOS, i.e. at φRX = 0◦,is observed for both measurement setups in the heatmaps inFigs. 6a–7a. Nonetheless, we observe the distinct effect of thedifferent antenna patterns on the cluster appearance. While thehorn antenna measurement in Fig. 6a exhibits a smooth cluster,the same cluster appears irregular for the phased antenna arraymeasurement in Fig. 7a1. Studying the AoA polar plot inFig. 8a, we recognize that the non-ideal, phased antenna arrayradiation pattern (cf. Fig. 3c) makes it much more difficult toidentify true independent propagation paths. We can identifythat the first peak around φRX = 0◦ points in the LOS directionand, using AoD information (not shown for brevity), thatthe peaks at φRX = −84◦ and φRX = 127◦ correspond toindependent secondary NLOS paths as shown in Fig. 9a. Bycontrast, the peaks around φRX = −30◦ and φRX = 30◦ aredue to sidelobes that point into the LOS direction, thereby
1In Fig. 7, we note that the measurement points are not spaced equidistantlyover azimuth angles φRX . This is due to the imperfect beam steering withthe manufacturer-supplied beambook, i.e. we observed an offset between thebeam steering angle that we set and the actual angle of the main lobe seen atthe over-the-air interface. We measured the offset for all beamsteering anglesand correct for these offsets during the post-processing of the results.

7
−100 0 100−20
0204060
Azimuth φRx (◦)
El.θRx(◦
)
−90
−80
−70
RSSH
(dB
m)
(a) 1Ah measurement: TX1, RX location A, horn antenna.
−100 0 100−20
0204060
Azimuth φRx (◦)
El.θRx(◦
)
−90
−80
−70
RSSH
(dB
m)
(b) 1Bh measurement: TX1, RX location B, horn antenna.
−100 0 100−20
0204060
Azimuth φRx (◦)
El.θRx(◦
)
−90
−80
−70
RSSH
(dB
m)
(c) 1Ch measurement: TX1, RX location C, horn antenna.
Fig. 6. RSS versus RX orientation for horn antenna measurements at differentTX-RX locations (assuming optimal TX orientation).
falsely indicating independent propagation paths. This is clearwhen looking at the map in Fig. 8a, as there are no reflectorsat φRX = −30◦ and φRX = 30◦. This may cause problems tobeamsteering algorithms that do not have information aboutthe environment and the AoD. For instance, an algorithmmay generate a list of orientations supposedly correspondingto viable independent propagation paths during initial beamtraining. Then in the case of detected blockage on the primarypath, it may switch to a falsely indicated propagation path, i.e.it switches to a sidelobe over the same path. Consequently, itwould fail to overcome the link blockage.
We next consider the NLOS RX location B. Comparing theheatmaps and AoA polar plots of the horn antenna and phasedantenna array measurements in Figs. 6b–7b and Fig. 8b,respectively, we note again the significant differences in thecluster appearance. Combining knowledge of the AoA, theenvironment, and the steered phased antenna array radiationpattern, we can trace two physical propagation paths as shownin Fig. 9a. We point out that AoD information is not helpfulin this scenario to distinguish between a true independentpropagation path and a sidelobe-induced high RSS as the AoDis the same for both the LOS and NLOS path (cf. Fig. 9a).Overall, we draw two conclusions based on these observations.First, the observation of having multiple link opportunities ispromising for mm-wave system designers as it suggests thatmm-wave coverage can also be provided for urban scenarioswith a partly blocked LOS. Second, our results suggest thateven knowing both AoA and AoD may not be sufficient to re-liably identify true independent propagation paths. Instead, weused both environment information and knowledge of the realsteered phased antenna array radiation pattern to identify theindependent propagation paths. In practice, future commercialmobile mm-wave systems may not have such perfect, a priori
−100 0 100−20
0204060
Azimuth φRx (◦)
El.θRx(◦
)
−90
−80
−70
RSSA
(dB
m)
(a) 1Aa measurement: TX1, RX location A, antenna array.
−100 0 100−20
0204060
Azimuth φRx (◦)
El.θRx(◦
)
−90
−80
−70
RSSA
(dB
m)
(b) 1Ba measurement: TX1, RX location B, antenna array.
−100 0 100−20
0204060
Azimuth φRx (◦)
El.θRx(◦
)
−90
−80
−70
RSSA
(dB
m)
(c) 1Ca measurement: TX1, RX location C, antenna array.
−100 0 100−20
0204060
Azimuth φRx (◦)
El.θRx(◦
)
−90
−80
−70
RSSA
(dB
m)
(d) 2Ba measurement: TX2, RX location B, antenna array.
−100 0 100−20
0204060
Azimuth φRx (◦)
El.θRx(◦
)
−90
−80
−70
RSSA
(dB
m)
(e) 2Da measurement: TX2, RX location D, antenna array.
Fig. 7. RSS versus RX orientation for phased antenna array measurementsat different TX-RX locations (assuming optimal TX orientation).
information and consequently, other strategies will be neededto identify true independent propagation paths. For instance,in scenarios with high link budget, using a nearly omni-directional radiation pattern at the receiver to record the powerdelay profile may allow extracting the number of independentpropagation paths based on time of arrival [6]. Alternatively,environment-awareness will be essential for robust mm-wavebeamsteering.
Let us now consider the LOS scenario for RX location C.Despite the increased TX–RX distance as compared to RXlocation A and the fact that RX C is positioned in an 18 mwide street canyon, the heatmaps in Figs. 6c–7c stronglyresemble the heatmaps obtained for RX location A (cf. Fig. 6aand Fig. 7a, respectively). We combine the knowledge of theAoA shown in Fig. 8c, AoD (not shown for brevity) and theknowledge of the environment to trace the independent NLOSpaths shown in the map in Fig. 9a. However, we emphasizethat these are difficult to trace solely based on the AoA polarplot in Fig. 8c due to the irregular, phased antenna array

8
0°
127°
-84°
TX 1
RX A
Pharmacy
(a) 1A measurement.
Shop"fielmann"
0°
-132°RX B
TX 1
(b) 1B measurement.
0°
RX C
TX 1
(c) 1C measurement.
Shop"fielmann"
0°
-71°
RX B
TX 2
115°
(d) 2B measurement.
0°
-30°
TX 2
RX D
60°
(e) 2D measurement.
Concrete object/wall
Metal/window
Lamppost/metal obj.
RSS, horn antenna, TX1
RSS, phased array, TX1
Trees
RSS, phased array, TX2
(f) Legend.
Fig. 8. Illustrated RSS over azimuth angles per TX-RX pair. The RSS polar plots are normalized to the maximum RSS per RX location to focus on the AoAanalysis.
radiation pattern. For instance, the AoA at RX location C(cf. Fig. 8c) looks similar to the AoA at RX location A(cf. Fig. 8a). Yet, at RX location A the high RSS at angleφRX = 30◦ is caused by a sidelobe whereas it correspondsto a true independent propagation path at RX location C.This underlines the difficulty of identifying viable independentphysical propagation paths by one-sided RSS measurements.
We now study measurements that were conducted withthe TX at location TX 2. Fig. 7d shows the heatmap forRX location B, where we note several multipath clusters.Fig. 8d shows the AoA polar plot, where we can see the peaksaround φRX = −71◦, φRX = 115◦, and φRX = 0◦. All threeorientations correspond to true independent propagation pathsas shown in the map in Fig. 9b. The independent propagationpaths were traced and distinguished from sidelobe-inducedhigh RSS using information about the environment and thesteered RX phased antenna array radiation pattern (not shownfor brevity). We emphasize that AoD information cannot helpto distinguish true independent propagation paths from side-lobes, as previously described for measurement 1Ba. Overall,these results support the previous observations that multiplemm-wave link opportunities can be found even in distant andNLOS scenarios in the given environment, but identifyingindependent propagation paths requires combined knowledgefrom different sources, i.e. environmental awareness, beyondpure RSS measurements.
Finally, we show in Fig. 7e the heatmap of the measurementresults from RX location D where the LOS path from thetransmitter in location TX 2 was obstructed by the foliage of atree. Nevertheless, the AoA polar plot in Fig. 8e shows a peaktowards the TX and we can identify additional NLOS paths
(cf. Fig. 9b) based on the AoA polar plot in Fig. 8e, AoD (notshown here for brevity), and knowledge of the environment.
Overall, our measurements show 2–4 multipath clustersper receiver position. Reflections were mainly caused bymetal or glass on facades and, somewhat surprisingly, bylampposts, enabling potential NLOS links in multiple sce-narios. We observed significant differences between phasedantenna array and horn antenna measurements and noted thatdetermining independent propagation paths purely based onone-sided phased antenna array RSS measurements was not areliable approach. Instead, knowledge of AoA, AoD, and theenvironment was needed to identify independent propagationpaths. Additionally, due to small-scale movements of a user ornon-ideal beam training, the transmitter and the receiver maynot be perfectly aligned. In Sec. IV-B we therefore presentan analysis of the effects of beam misalignment at transmitterand receiver on achievable data rates of the mm-wave linkopportunities revealed by our measurements.
B. Analysis of Beam Misalignment Effects
In this section we study the effect of beam misalignmenton the link performance in outdoor mm-wave networks, usingthe estimated achievable data rate as calculated from (9) asthe performance metric. We emphasize that considering theachievable data rate rather than solely RSS measurements(as in Sec. IV-A) allows us to better assess the networkingconsequences of misaligned beams, especially with regard tohigher system layers that need to cope with the resultingchanges in the PHY data rate. To illustrate this, in Fig. 10we show the heatmaps of estimated data rate versus RXorientation for RX location A (cf. Fig. 6a and Fig. 7a for the

9
RX C RX B
RX A
TX 1
Concrete object/wallMetal/windowLamp-/metal post
LOS pathNLOS pathTransmitter positionReceiver position
Trees
(a) Signal paths from transmitter 1.
RX B
RX A
RX D
TX 1
TX 2
(b) Signal paths from transmitter 2.
Fig. 9. Maps showing the LOS/NLOS path traces from the different TX andRX positions. The materials of buildings and other objects are also indicated.
corresponding RSS heatmaps). From Fig. 10b, it is evident thata phased antenna array beam misalignment of a few degreesin the azimuth can result in a dramatic loss in data rate.
In real mm-wave outdoor deployments beam misalignmentscan occur for several reasons, as illustrated in Fig. 11, wherewe consider, without loss of generality, the downlink. Aftersuccessful initial beam training, the BS and UE are ideallyperfectly aligned. However, imperfect beam training due toe.g. stale beam training data or ambiguous information aboutindependent propagation paths (as described in Sec. IV-A)may result in beam misalignments as shown in Fig. 11a. Forinstance, a device rotation may cause a UE beam misalignment(cf. Fig. 11b) and a small-scale lateral movement of the UE outof the BS’s beam may cause a misalignment at both BS andUE (cf. Fig. 11c). The UE may readjust its beam orientationto mitigate the effects of the BS misalignment (cf. Fig. 11d).In the following, we analyze how these beam misalignmentscenarios affect the estimated achievable data rate based onour measured RSS data.
1) BS Beam Misalignment Analysis: A BS beam misalign-ment may occur due to a user moving out of the BS’s beam(cf. Fig. 11c) or imperfect beam training (cf. Fig. 11c). In this
−100 0 100−20
0204060
Azimuth φRx (◦)Ele
vatio
nθRx(◦
)
1234
T(G
bps)
(a) Scenario 1Ah: TX1, RX location A, horn antenna.
−100 0 100−20
0204060
Azimuth φRx (◦)Ele
vatio
nθRx(◦
)
1234
T(G
bps)
(b) Scenario 1Aa: TX1, RX location A, phased antenna array.
Fig. 10. Estimated data rate versus RX orientation for scenario 1A (assumingoptimal TX orientation).
UE
BS
(a) BS and/or UE beammisaligned due to imperfect
beam training.
UEBS
(b) UE beam misaligned afterrotation.
UE
dmove
BS
(c) BS and UE beamsmisaligned after small-scalelateral movement dmove of
UE.
UEdmove
BS
(d) BS beam misaligned aftersmall-scale lateral movement of
UE; UE locally adjusted itsbeam to new optimal
orientation.
Fig. 11. Scenarios illustrating potential beam misalignments at BS and UE.
section, we study the residual loss in estimated achievable datarate for such BS beam misalignments, assuming that the UElocally adjusts its orientation dynamically to mitigate the BSbeam misalignment effects (cf. Figs. 11a and 11d). Namely,we consider
T(∆TX ) = maxφRX,θRX
T(∆TX, φRX, θRX ), (12)
where ∆TX is the beam misalignment with respect to the bestBS orientation φTX,best , i.e.
∆TX = φTX − φTX,best, (13)φTX,best = arg max T(φTX, φRX, θRX ). (14)
We neglect the elevation misalignment assuming that all UEsare in the same plane, such that the BS’s elevation beammisalignment is negligible as compared to its HPBW of 36◦.

10
−50 0 5001234
TX antenna beam misalignment ∆TX (◦)
T(G
bps) 1A
1B1C
(a) Phased antenna array results for TX1.
−50 0 5001234
TX antenna beam misalignment ∆TX (◦)
T(G
bps) 2B
2D
(b) Phased antenna array results for TX2.
−50 0 5001234
TX antenna beam misalignment ∆TX (◦)
T(G
bps) 1A
1B1C
(c) Horn antenna results.
Fig. 12. The estimated data rate T versus the BS (TX) beam misalignment∆TX with respect to the best possible link (assuming optimal φRX , θRX ).
In Fig. 12 we show the estimated achievable data rate T of alink over the BS (TX) beam misalignment ∆TX with respect tothe best BS orientation φTX,best . Based on Figs. 12a–12b wemake three observations for the phased antenna array results.First, we observe that the maximum data rate is only achievedwithout beam misalignment, i.e. there is only one maximumpeak. Second, small beam misalignments in the order of theHPBW cause significant losses in data rate of up to 70%, e.g.a beam misalignment of −7◦ in scenario 1A produces a dropfrom 4 Gbps to 1.4 Gbps and from 2.6 Gbps to 0.8 Gbpsin scenario 2D. Third, the loss in data rate is not increasingmonotonically with increasing beam misalignment. Overall,the results in Figs. 12a–12b demonstrate that a UE locallyadjusting its orientation is not sufficient to fully mitigate theeffects of BS beam misalignment. Consequently, strategies fortracking UE movement at the BS are required to maintainhigh data rates. Moreover, given the observed non-monotonicrelationship between beam misalignment and loss in data rate,we expect that some types of beam tracking algorithms will notwork reliably. For instance, let us consider an RSS-gradient-following beam tracking approach, i.e. an algorithm that triesto find the ideal beam orientation by adapting the beamorientation of its phased antenna array beam to a neighboringorientation that achieves a higher RSS. Due to the observedirregular variation of the achievable data rate over increasingbeam misalignment, it would not be able to find the globaloptimal orientation.
In Fig. 12c, we present the estimated maximum data rateover the horn antenna BS beam misalignment for comparisonwith the phased antenna array results. We observe that the datarates decrease monotonically with increasing misalignmentwhich is in contrast to the observations made in Figs. 12a–12b
0 50 100 150−100−80−60−40−20
0
RX antenna beam misalignment ∆RX (◦)
Los
s∆T
(%)
ArrayHorn
(a) Measurement 1A.
0 50 100 150−100−80−60−40−20
0
RX antenna beam misalignment ∆RX (◦)
Los
s∆T
(%)
ArrayHorn
(b) Measurement 1B.
0 50 100 150−100−80−60−40−20
0
RX antenna beam misalignment ∆RX (◦)
Los
s∆T
(%)
ArrayHorn
(c) Measurement 1C.
0 50 100 150−100−80−60−40−20
0
RX antenna beam misalignment ∆RX (◦)
Los
s∆T
(%)
Array
(d) Measurement 2B.
0 50 100 150−100−80−60−40−20
0
RX antenna beam misalignment ∆RX (◦)
Los
s∆T
(%)
Array
(e) Measurement 2D.
Fig. 13. Loss in estimated data rate T versus UE (RX) beam misalignment∆RX with respect to the best possible link (assuming optimal φTX ).
for the phased antenna array. We emphasize that this starkdissimilarity between the results for the antenna types indicatesthat we cannot simply infer the impact of beam misalignmentson mm-wave links based on measurements taken with hornantennas as in e.g. [5], [11] or calculations based on simplisticdirectional antenna radiation pattern models as in e.g. [22].Instead, realistic phased antenna array radiation patterns haveto be explicitly taken into account in the design of beamtraining and tracking algorithms.
2) UE Beam Misalignment Analysis: In Figs. 11a–11cwe illustrated how imperfect beamtraining, a rotation, or asmall-scale movement of the UE may lead to a UE beammisalignment. In this section, we study the effects of such UEbeam misalignments, assuming that the BS locally adjusts itsorientation dynamically to mitigate the UE beam misalignmenteffects. We thus apply the same principle of considering one-sided misalignment only, as in the previous analysis of the BS

11
-30 0 30 6001234
RX elevation angle θRX (◦)
T(G
bps)
1A1B1C2B2D
Fig. 14. Boxplots of the estimated data rate T that can be achieved withthe phased array over all UE azimuth angles φRX with a fixed UE elevationangle θRX (assuming optimal φTX ).
beam misalignment. Namely, we consider
T(∆RX ) = maxφTX
T(φTX,∆RX ). (15)
where ∆RX is the misalignment with respect to the best UEorientation (φRX,best, θRX,best ), i.e.
∆RX =
√(φRX − φRX,best )2 + (θRX − θRX,best )2, (16)
(φRX,best, θRX,best ) = arg max T(φTX, φRX, θRX ). (17)
In Fig. 13 we present the loss in estimated data rate ∆Tfor a UE (RX) antenna beam misalignment ∆RX with respectto the best UE orientation. Figs. 13a–13c show results forboth measurement setups, where we again observe that amisalignment causes a gradual loss in data rate for the hornantenna results, whereas the phased antenna array results varyrather irregularly. This confirms that we cannot simply inferthe impact of beam misalignments on mm-wave links basedon measurements taken with horn antennas. Moreover, inFigs. 13a–13e we find that a small misalignment of the UEphased antenna array beam of up to 8◦ results in data ratelosses of 6–60%. This demonstrates that even with perfect UEtracking, agile beamsteering at the UE is needed to compensateresidual losses in data rate due to misalignment.
One key to enabling mm-wave networks is to successfullyintegrate UE phased antenna arrays that can reliably maintain aconnection over all 3D orientations. As described in Sec. III-A,the phased antenna array used in our measurements onlyallows azimuth beamsteering while having a wide elevationHPBW of 36◦. To investigate if this is a suitable configurationfor a mm-wave UE, we isolate the effect of the UE elevationangle on estimated data rates. We expect that the best data ratewould be achieved for the measured elevation angles θRX thatare closest to the ideal elevation orientation towards the BS,which can be computed from the distances between BS and UE(cf. Table II). Namely, we expect the scenarios 1A and 2D toachieve approximately equal maximum estimated achievabledata rate for θRX = 0◦ and θRX = 30◦, as the distancesbetween BS and UE were the shortest in these cases, implyinga greater elevation angle. For larger distances between BS andUE, the ideal elevation angle is smaller and we expect to seethe maximum estimated achievable data rate for the scenarios1B, 1C, and 2B at θRX = 0◦.
Fig. 14 shows boxplots of the estimated data rate T over allazimuth angles φRX ∈ [−180◦, 180◦] for UE elevation angleθRX , i.e. we consider
T(θRX ) = maxφTX
T(φTX, φRX, θRX ). (18)
−100 0 10001234
RX azimuth angle φRX (◦)
T(G
bps) φTX
−7◦
0◦
7◦
(a) Measurement 1A.
−100 0 10001234
RX azimuth angle φRX (◦)
T(G
bps) φTX
−7◦
0◦
7◦
(b) Measurement 1B.
Fig. 15. Estimated data rate T versus RX azimuth angles φRX for selectedmeasurements and selected fixed BS orientations φTX , representative ofsmall-scale BS beam misalignment (θRX = 0◦ assumed throughout).
We observe a drop in maximum estimated data rate for allresults except 1A when the elevation angle is not equal to 0◦.This is expected, except for the result 2D which shows anoutlier achieving around 2.6 Gbps for θRX = 0◦, possibly dueto the tree foliage that blocked the LOS (cf. Fig. 2e). Overall,despite the large elevation HPBW of the phased antenna arraypattern of 36◦, the loss in the maximum achievable estimateddata rate ranges between 26% and 70% for a change inelevation angle θRX from 0◦ to 60◦ (cf. Fig. 14). We concludethat 2D beamsteering will not be sufficient to fully exploitavailable UE link opportunities in a 3D environment.
3) Two-sided Beam Misalignment Analysis: In real outdoormm-wave network deployments, a misalignment at BS andUE is likely to occur simultaneously (cf. Fig. 11). We nowstudy this case for the phased antenna array results, i.e.the beamsteering opportunities at the UE for a given BSbeam misalignment. To this end, in Figs. 15-16 we show theestimated data rate T over UE (RX) azimuth angles φRX forselected measurement scenarios and for selected representativeBS (TX) orientations φTX . In Figs. 15-16 we only considerthe UE elevation angle θRX = 0◦, which yielded the highestdata rates over all elevation angles (cf. Fig. 14).
In Fig. 15 the BS orientations φTX were selected to study theeffects of small-scale misalignment in the order of the HPBWof around 6◦. From Fig. 15 it is evident that the UE achievesthe highest estimated data rate and has the maximum numberof viable orientations when the transmitter is well aligned, i.e.φTX = 0◦. A small-scale misalignment of the transmitter of±7◦ produces a significant decrease in the maximum estimateddata rate of up to 54%. For a misalignment in the order of ±7◦at both BS and UE, the loss in estimated data rate is 38%–100% with a median of 70% across all our results. Overall, weconclude that the joint effect of small-scale beam misalignmentat BS and UE results in severe losses in data rate, placing theburden on agile beamtracking algorithms to update BS andUE orientation at a sufficient rate to ensure robustness of highdata rate links for mobile users.
In Fig. 16 the BS orientations φTX were selected to study

12
−100 0 10001234
RX azimuth angle φRX (◦)
T(G
bps) φTX
0◦
30◦
41◦
(a) Measurement 1A.
−100 0 10001234
RX azimuth angle φRX (◦)
T(G
bps) φTX
−37◦
−29◦
3◦
(b) Measurement 1C.
Fig. 16. Estimated data rate T versus RX azimuth angles φRX for selectedmeasurements and selected fixed BS orientations φTX , representative of large-scale BS beam misalignment (θRX = 0◦ assumed throughout).
link opportunities that occur due to sidelobes or independentsecondary propagation paths, i.e. at orientations that deviate atlarge-scale from the best orientation. In Fig. 16a, for φTX =
30◦ the estimated data rates are below those for φTX = 0◦, butthe shape of the curve is similar. This suggests that the TX hasa sidelobe towards the RX when oriented at φTX = 30◦, usingthe same propagation path as for φTX = 0◦. By contrast, weobserve an independent (NLOS) propagation path for φRX =
−84◦ and φTX = 41◦ which was also traced on the map inFig. 9a. Fig. 16b reveals the same trend. The φRX -dependentlink opportunities for φTX = −37◦ are similar to those forφTX = 3◦, suggesting that they resulted from a TX sidelobe.For φTX = −29◦, a distinct signal path with a RX orientationof φRX = 35◦ yields the highest estimated data rate (cf. Fig. 9afor the map). Based on Fig. 16, we conclude that identifyingan independent secondary propagation path solely based onmeasured link quality over either AoD or AoA data is difficult,as sidelobes may also allow good data rates using the primarysignal path. An approach of combining information from BS,UE, and external sources such as environmental awareness,e.g. [37], may therefore be needed to identify independentsecondary propagation paths that can be used to overcomeblockage on the primary path.
V. DISCUSSION
Our mm-wave measurements in a German town centershowed a limited number of 2–4 multipath clusters per receiverposition, which is similar to the results reported for denseurban areas in modern metropolises [3], [4], [8]. This standsin contrast to expectations that the differences in building typesand layout between a European town and modern metropoliseswould have an effect on the number of mm-wave multipathclusters. Our results thus suggest that mm-wave phased an-tenna array deployments are an attractive approach to achieveGbps coverage in town centers at limited infrastructure costthanks to their small area.
However, looking more closely at the structure of thereceived multipath clusters, we observe the paradigm shift
that occurs when moving from horn antennas to real phasedantenna arrays. With horn antennas, the clusters exhibit asmooth structure, giving a good indication of the actual under-lying physical propagation paths. By contrast, with the phasedantenna array the same physical propagation paths appear asirregular clusters due to the non-ideal radiation pattern withsignificant sidelobes and nulls, as shown in Figs. 3c–3d. Wealso note that such strong sidelobes in the radiation patternmay result in significant intra-cell interference, which willhave to be carefully considered during mm-wave networksystem design.
As observed throughout this paper, the antenna radiationpattern plays a similarly crucial role in the effects of mm-wavebeam misalignment. Our measurements with horn antennasshow a monotonic relationship between misalignment andloss in received power, as also presented in earlier studies[5], [11]. By contrast, this does not hold for our phasedantenna array results. For azimuth beam misalignments largerthan the HPBW the degradation of estimated data rate is notmonotonic with increasing beam misalignment for the non-ideal, phased antenna array radiation pattern. Instead, it variesirregularly with increasing beam misalignment. Consequently,measurement results obtained with horn antennas cannot sim-ply be generalized to also hold for phased antenna arrays wheninvestigating the effect of beam misalignment on the expectedperformance of real mm-wave networks. Similar implicationshold for the theoretical works that make use of simplisticidealized antenna patterns, e.g. [22].
Our results also showed that a small-scale beam misalign-ment at one station, i.e. either at BS or UE, caused a significantloss in estimated data rate that cannot be mitigated fully bythe other station. We expect such a one-sided misalignmentto be particularly harmful in uplink situations. As mm-waveUEs will likely not be able to feature phased antenna arrays ofthe same size as BSs, their antenna gain will be more limiteddue to the smaller number of antenna elements. Moreover,due to the limited battery capacity of the UE, also its outputpower will be more limited than the BS’s output power. Whilethe link performance could still be acceptable under beammisalignment when the BS transmits with high EIRP, this maynot be the case under beam misalignments in uplink scenarios,where the UE EIRP is likely to be significantly lower. Thus, weexpect to see a large asymmetry between uplink and downlinkperformance in mm-wave networks. Overall, we conclude thatboth the BS and UE in mm-wave networks will need tofrequently adjust their orientation to counteract even one-sidedsmall-scale beam misalignments.
Furthermore, we note that one of the key challenges for en-abling mm-wave outdoor networks is the handling of dynamicblockages by using an independent secondary unblocked sig-nal path, as e.g. pedestrian blockage typically only concernsone multipath cluster and other multipath clusters remainunaffected [6]. However, due to the strength of sidelobesin non-ideal, phased antenna array radiation patterns, ourresults suggest that it may be difficult to distinguish betweena true independent secondary propagation path and a linkopportunity due to a sidelobe. This distinction is crucial, aslink opportunities due to sidelobes on the primary propagation
13
path are also affected by blockage of the primary propagationpath. Beamsteering algorithms that obtain a list of viable linkopportunities based on a simple RSSI search [25] are thusexpected to suffer from this ambiguity if they do not restartat least a partial beam search upon link blockage.
Finally, our analysis suggest that, despite the wide elevationHPBW of our phased antenna array of 36◦, 2D beamsteeringis not sufficient to fully exploit available link opportunities atcertain receiver positions. These results agree with the findingsin [38] where it was demonstrated that 3D rotations can resultin strong link degradations. This is particularly relevant asmany beamsteering algorithms proposed in the literature onlyconsider the planar case [38]. We expect that 3D beamsteeringand hand-grip aware beamcombining [39] will be required tomaintain a high data rate under rotation of the user deviceand different user activities. Despite the already increasingcomplexity of 5G-and-beyond protocol design, even additionalexternal information, location-based environmental awareness,shared beamsteering information from devices in direct vicin-ity of a UE, or local data from a motion tracking sensor mayfurther enhance the robustness and seamless coverage of mm-wave deployments under user mobility.
VI. CONCLUSIONS
We presented the results of the first comprehensive large-scale outdoor mm-wave measurement study using a state-of-the-art phased antenna array in a European town. Thedata obtained over more than 5,000 systematic fine-grainedAoA/AoD combinations per TX/RX pair was analyzed withrespect to the number of available link opportunities and theeffect of beam misalignment at the receiver and transmitteron the estimated mm-wave link data rate, and compared toreference measurements taken with a horn antenna. Our resultsshow a limited number of 2–4 available multipath clustersper receiver location, indicating that the mm-wave multipathrichness in a European town is surprisingly similar to that indense urban metropolises as presented in prior literature. Theresults for the phased antenna array reveal that losses in theestimated data rate of up to 70% occurred for small beammisalignments in the order of the HPBW, with significantand irregular variations in the estimated data rate for largerbeam misalignments, caused by the non-ideal, phased antennaarray radiation pattern. This stands in stark contrast to the hornantenna reference measurements, where the loss in estimateddata rate was observed to be monotonically increasing withthe misalignment error. Moreover, our results suggest that thecharacteristics of non-ideal, phased antenna array radiationpatterns should be explicitly considered during the design andtesting of mm-wave beamsteering algorithms. To this end, ourongoing work is focused on conducting further measurementsin more diverse urban scenarios, explicitly studying the per-formance of beamsteering and beamtracking algorithms basedon data obtained with real mm-wave phased antenna arrays.
REFERENCES
[1] T. S. Rappaport, S. Sun, R. Mayzus, H. Zhao, Y. Azar, K. Wang, G. N.Wong, J. K. Schulz, M. Samimi, and F. Gutierrez, “Millimeter wavemobile communications for 5G cellular: It will work!” IEEE Access,2013.
[2] M. Xiao, S. Mumtaz, Y. Huang, L. Dai, Y. Li, M. Matthaiou, G. K.Karagiannidis, E. Björnson, K. Yang, C. I, and A. Ghosh, “Millimeterwave communications for future mobile networks,” IEEE J. Sel. AreasCommun., vol. 35, no. 9, pp. 1909–1935, Sep. 2017.
[3] T. S. Rappaport, G. R. MacCartney, M. K. Samimi, and S. Sun, “Wide-band millimeter-wave propagation measurements and channel models forfuture wireless communication system design,” IEEE Trans. Commun.,vol. 63, no. 9, pp. 3029–3056, Sep. 2015.
[4] M. Samimi, K. Wang, Y. Azar, G. N. Wong, R. Mayzus, H. Zhao,J. K. Schulz, S. Sun, F. Gutierrez, and T. S. Rappaport, “28 GHzangle of arrival and angle of departure analysis for outdoor cellularcommunications using steerable beam antennas in New York City,” inProc. IEEE VTC, Dresden, Germany, Jun. 2013, pp. 1–6.
[5] L. Simic, N. Perpinias, and M. Petrova, “60 GHz outdoor urbanmeasurement study of the feasibility of multi-Gbps mm-wave cellularnetworks,” in Proc. IEEE INFOCOM Workshops, San Francisco, CA,USA, Apr. 2016, pp. 554–559.
[6] R. J. Weiler, M. Peter, W. Keusgen, and M. Wisotzki, “Measuringthe busy urban 60 GHz outdoor access radio channel,” in Proc. IEEEICUWB, Paris, France, Sep. 2014, pp. 166–170.
[7] S. Rajagopal, S. Abu-Surra, and M. Malmirchegini, “Channel feasibilityfor outdoor non-line-of-sight mmwave mobile communication,” in Proc.IEEE VTC, Quebec City, QC, Canada, Sep. 2012, pp. 1–6.
[8] J. Ko, Y. Cho, S. Hur, T. Kim, J. Park, A. F. Molisch, K. Haneda,M. Peter, D. Park, and D. Cho, “Millimeter-wave channel measurementsand analysis for statistical spatial channel model in in-building and urbanenvironments at 28 GHz,” IEEE Trans. Wireless Commun., vol. 16, no. 9,pp. 5853–5868, Sep. 2017.
[9] T. S. Rappaport, Y. Xing, G. R. MacCartney, A. F. Molisch, E. Mellios,and J. Zhang, “Overview of millimeter wave communications for fifth-generation (5G) wireless networks-with a focus on propagation models,”IEEE Trans. Antennas Propag., vol. 65, no. 12, pp. 6213–6230, Dec.2017.
[10] S. Segan. (2019) Here’s the real truth about Verizon’s 5G network. PCMag Digital Group. [Online]. Available: https://www.pcmag.com/news/367659/heres-the-real-truth-about-verizons-5g-network
[11] J. Lee, M.-D. Kim, J.-J. Park, and Y. J. Chong, “Field-measurement-based received power analysis for directional beamforming millimeter-wave systems: Effects of beamwidth and beam misalignment,” ETRIJournal, vol. 40, no. 1, pp. 26–38, 2018.
[12] H. Zhao, R. Mayzus, S. Sun, M. Samimi, J. K. Schulz, Y. Azar, K. Wang,G. N. Wong, F. Gutierrez, and T. S. Rappaport, “28 GHz millimeter wavecellular communication measurements for reflection and penetrationloss in and around buildings in New York City,” in Proc. IEEE ICC,Budapest, Hungary, June 2013, pp. 5163–5167.
[13] V. Raghavan, L. Akhoondzadeh-Asl, V. Podshivalov, J. Hulten, M. A.Tassoudji, O. H. Koymen, A. Sampath, and J. Li, “Statistical blockagemodeling and robustness of beamforming in millimeter-wave systems,”IEEE Trans. Microw. Theory Tech., vol. 67, no. 7, pp. 3010–3024, July2019.
[14] F. Aryanfar, J. Pi, H. Zhou, T. Henige, G. Xu, S. Abu-Surra, D. Psy-choudakis, and F. Khan, “Millimeter-wave base station for mobilebroadband communication,” in Proc. IEEE MTT-S IMS, Phoenix, AZ,USA, May 2015, pp. 1–3.
[15] B. Sadhu, A. Paidimarri, M. Ferriss, M. Yeck, X. Gu, and A. Valdes-Garcia, “A 128-element dual-polarized software-defined phased arrayradio for mm-wave 5G experimentation,” in Proc. ACM mmNets Work-shop, New Delhi, India, 2018, pp. 21–25.
[16] I. Aziz, R. Dahlbäck, E. Öjefors, A. Rydberg, and D. Dancila, “HighGain Compact 57-66 GHz Antenna Array for Backhaul & AccessCommunications,” in Proc. IEEE EuCAP, London, UK, Apr. 2018, pp.1–4.
[17] S. K. Saha, D. Uvaydov, J. M. Jornet, E. Knightly, D. Koutsonikolas,D. Pados, Z. Sun, Y. Ghasempour, M. K. Haider, T. Siddiqui, P. De Melo,N. Somanchi, L. Zakrajsek, A. Singh, and O. Torres, “X60: A pro-grammable testbed for wideband 60 GHz WLANs with phased arrays,”in Proc. ACM WiNTECH, Snowbird, Utah, USA, 2017, pp. 75–82.
[18] V. Raghavan, A. Partyka, A. Sampath, S. Subramanian, O. H. Koymen,K. Ravid, J. Cezanne, K. Mukkavilli, and J. Li, “Millimeter-wave MIMOprototype: Measurements and experimental results,” IEEE Commun.Mag., vol. 56, no. 1, pp. 202–209, Jan 2018.
[19] W. Roh, J. Y. Seol, J. Park, B. Lee, J. Lee, Y. Kim, J. Cho, K. Cheun, andF. Aryanfar, “Millimeter-wave beamforming as an enabling technologyfor 5G cellular communications: Theoretical feasibility and prototyperesults,” IEEE Commun. Mag., vol. 52, no. 2, pp. 106–113, Feb. 2014.
[20] D. Kurita, D. Kitayama, K. Tateishi, A. Harada, Y. Kishiyama, S. Itoh,H. Murai, J. J. Fwu, X. J. Zhuang, K. Stewart, A. Simonsson, and

14
P. Ökvist, “Outdoor experiments on 5G radio access using BS and UEbeamforming in 28-GHz frequency band,” in Proc. IEEE CCNC, LasVegas, NV, USA, Jan. 2019, pp. 1–6.
[21] R. J. Weiler, W. Keusgen, A. Maltsev, T. Kühne, A. Pudeyev, LiangXian, J. Kim, and M. Peter, “Millimeter-wave outdoor access shadowingmitigation using beamforming arrays,” in Proc. IEEE EuCAP, Davos,Switzerland, April 2016, pp. 1–5.
[22] J. Wildman, P. H. J. Nardelli, M. Latva-aho, and S. Weber, “On the jointimpact of beamwidth and orientation error on throughput in directionalwireless poisson networks,” IEEE Trans. Wireless Commun., vol. 13,no. 12, pp. 7072–7085, Dec. 2014.
[23] M. K. Samimi and T. S. Rappaport, “3-D millimeter-wave statisticalchannel model for 5G wireless system design,” IEEE Trans. Microw.Theory Tech., vol. 64, no. 7, pp. 2207–2225, Jul. 2016.
[24] S. Sur, X. Zhang, P. Ramanathan, and R. Chandra, “BeamSpy: Enablingrobust 60 GHz links under blockage,” in Proc. USENIX NSDI, Berkeley,CA, USA, 2016, pp. 193–206.
[25] M. Giordani, M. Mezzavilla, N. Barati, S. Rangan, and M. Zorzi,“Comparative analysis of initial access techniques in 5G mmWavecellular networks,” in Proc. IEEE CISS, Princeton, NJ, USA, Mar. 2016,pp. 268–273.
[26] D. Steinmetzer, D. Wegemer, M. Schulz, J. Widmer, and M. Hollick,“Compressive millimeter-wave sector selection in off-the-shelf IEEE802.1lad devices,” in Proc. ACM CoNEXT, Incheon, Republic of Korea,2017, pp. 414–425.
[27] L. Kuger, A. Ichkov, P. MÃd’hÃunen, and L. Simic. (2019) Measure-ment data. iNETS, RWTH Aachen University. [Online]. Available: [Linkwill be inserted in final manuscript, subject to acceptance].
[28] Land NRW, “TIM-online 2.0,” NRW, Germany, 2019. [Online].Available: https://www.tim-online.nrw.de/tim-online2/
[29] ITU-R Resolution 238 (WRC-15), “Studies on frequency-related mattersfor International Mobile Telecommunications identification includingpossible additional allocations to the mobile services on a primary basisin portion(s) of the frequency range between 24.25 and 86 GHz forthe future development of International Mobile Telecommunications for2020 and beyond.” 2015.
[30] SiversIMA, “Product brief: TRX BF/01,” 2018. [Online]. Avail-able: https://www.siversima.com/wp-content/uploads/PB_TRX-BF01_v1-02.pdf
[31] SiversIMA, “Product brief: EVK06002,” 2018. [Online]. Avail-able: https://www.siversima.com/wp-content/uploads/PB_EVK-06002-00_1-02-1.pdf
[32] ——, “Product brief: FC1005V/00 V-band converter with LO,”2017. [Online]. Available: https://www.siversima.com/wp-content/uploads/FC1005V00-Data-Sheet.pdf
[33] Flann Microwave, “Product brief: Standard gain horns series 240,”2016. [Online]. Available: https://flann.com/wp-content/uploads/2016/01/Series-240.pdf
[34] “Frequenzplan gemäß §54 TKG über die Aufteilung des Frequenzbere-ichs von 0 kHz bis 3000 GHz auf die Frequenznutzungen sowie überdie Festlegungen für diese Frequenznutzungen,” BNetzA, Mar. 2018.
[35] K. King. (2018, Sep.) Meanwhile, back in the lab, another 5Gmilestone – Verizon and Samsung reach multi-gigabit throughputover 5G NR and mmwave spectrum. [Online]. Available:https://www.verizon.com/about/news/meanwhile-back-lab-another-5g-milestone--verizon-and-samsung-reach-multi-gigabit-throughput
[36] “LTE; evolved universal terrestrial radio access (E-UTRA); radio fre-quency (RF) system scenarios,” ETSI 3GPP, TR 36.942 version 14.0.0Release 14, Apr. 2017.
[37] L. Simic, J. Arnold, M. Petrova, and P. Mähönen, “RadMAC: radar-enabled link obstruction avoidance for agile mm-wave beamsteering,”in Proc. ACM HotWireless, New York City, NY, USA, 2016, pp. 61–65.
[38] A. Zhou, L. Wu, S. Xu, H. Ma, T. Wei, and X. Zhang, “Followingthe shadow: Agile 3-D beam-steering for 60 GHz wireless networks,”in Proc. IEEE INFOCOM, Honolulu, HI, USA, Apr. 2018, pp. 2375–2383.
[39] A. Alammouri, J. Mo, B. L. Ng, J. C. Zhang, and J. G. Andrews, “Handgrip impact on 5G mmWave mobile devices,” IEEE Access, vol. 7, pp.60 532–60 544, 2019.