Urban metropolitan economy: Milan (Italy) and Shanghai (China)
23
Urban metropolitan economy: Milan (Italy) and Shanghai (China)
-
Upload
angelica-berry -
Category
Documents
-
view
216 -
download
0
Transcript of Urban metropolitan economy: Milan (Italy) and Shanghai (China)
Urban metropolitan economy:Milan (Italy) and Shanghai (China)
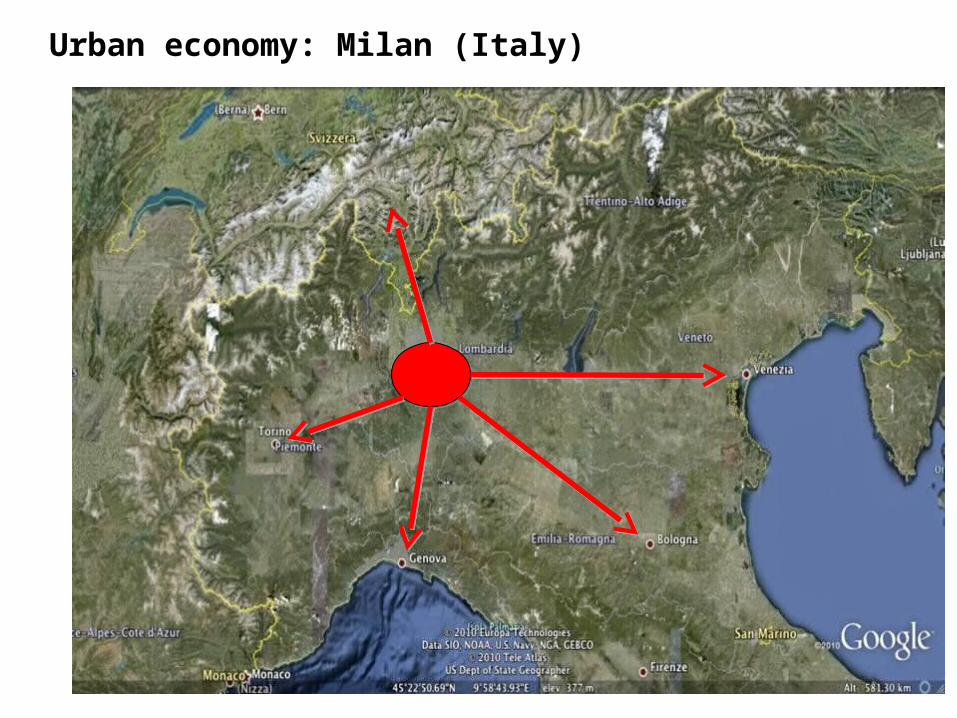
Urban economy: Milan (Italy)

Finance Design
Fashion
Lifestyle
Traffic and pollutionCost vs quality
ETHOS: connotations
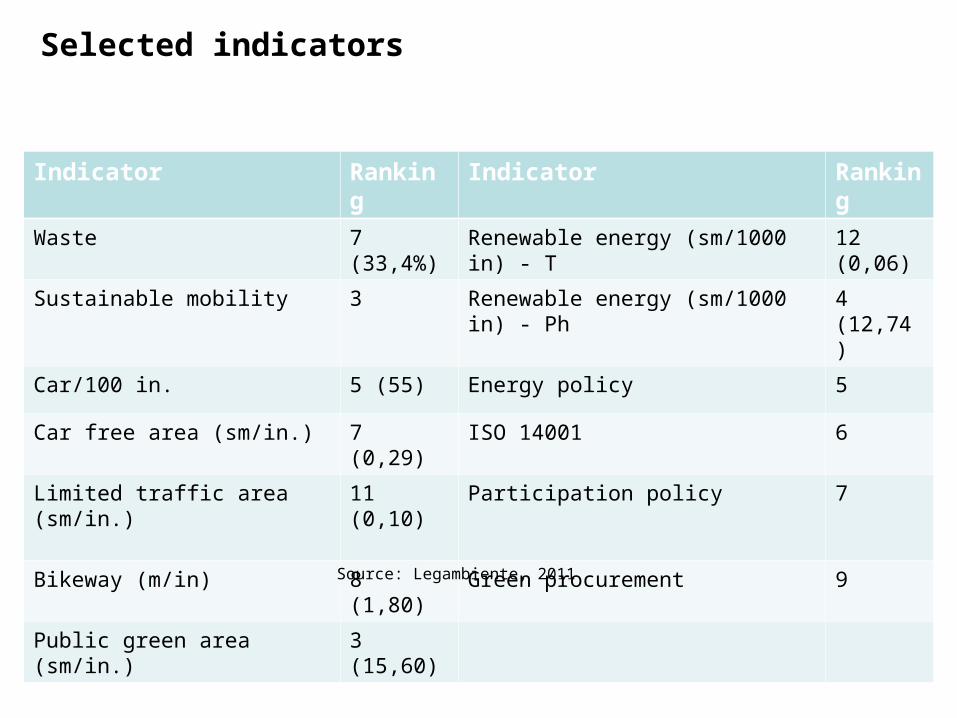
Indicator Ranking Indicator Ranking
Waste 7 (33,4%) Renewable energy (sm/1000 in) - T 12 (0,06)
Sustainable mobility 3 Renewable energy (sm/1000 in) - Ph 4 (12,74)
Car/100 in. 5 (55) Energy policy 5
Car free area (sm/in.) 7 (0,29) ISO 14001 6
Limited traffic area (sm/in.) 11 (0,10) Participation policy 7
Bikeway (m/in) 8 (1,80) Green procurement 9
Public green area (sm/in.) 3 (15,60)
Source: Legambiente, 2011
Selected indicators
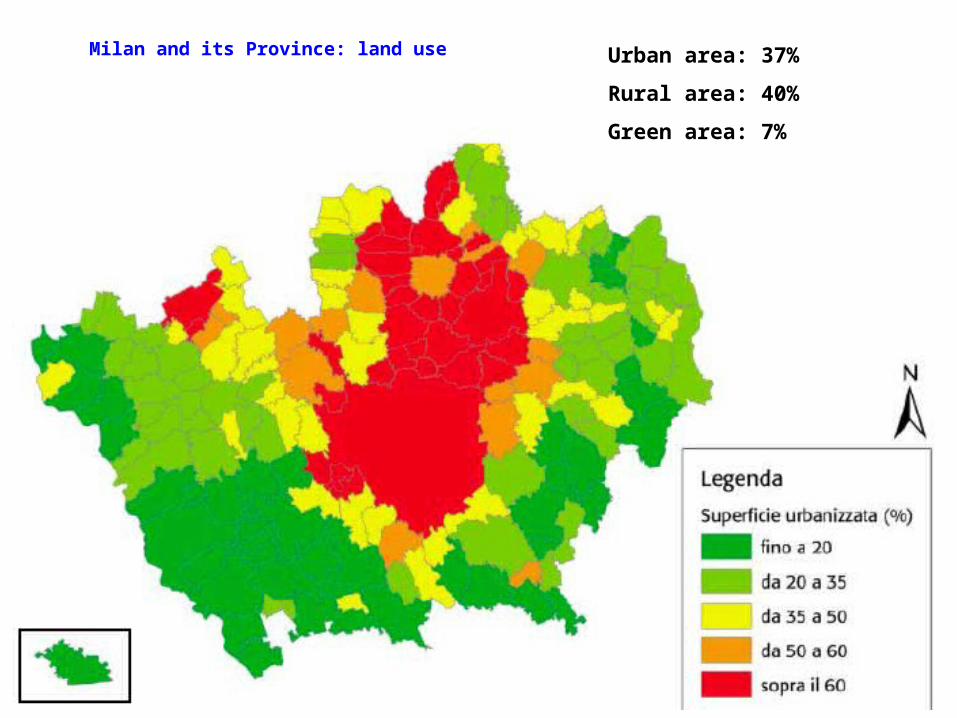
Milan and its Province: land use Urban area: 37%
Rural area: 40%
Green area: 7%
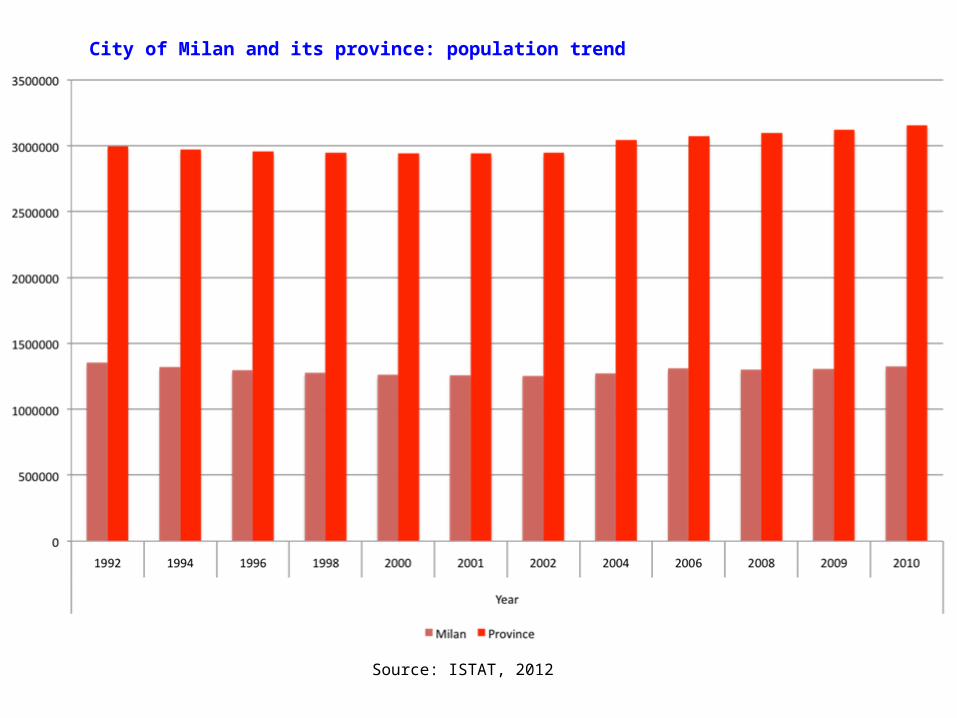
City of Milan and its province: population trend
Source: ISTAT, 2012
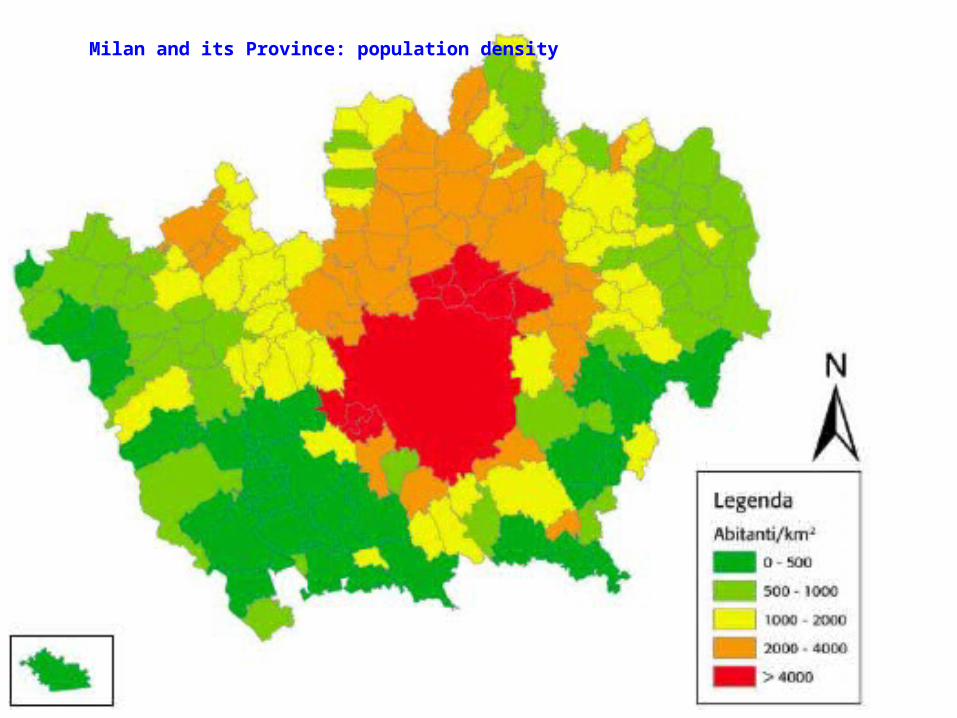
Milan and its Province: population density
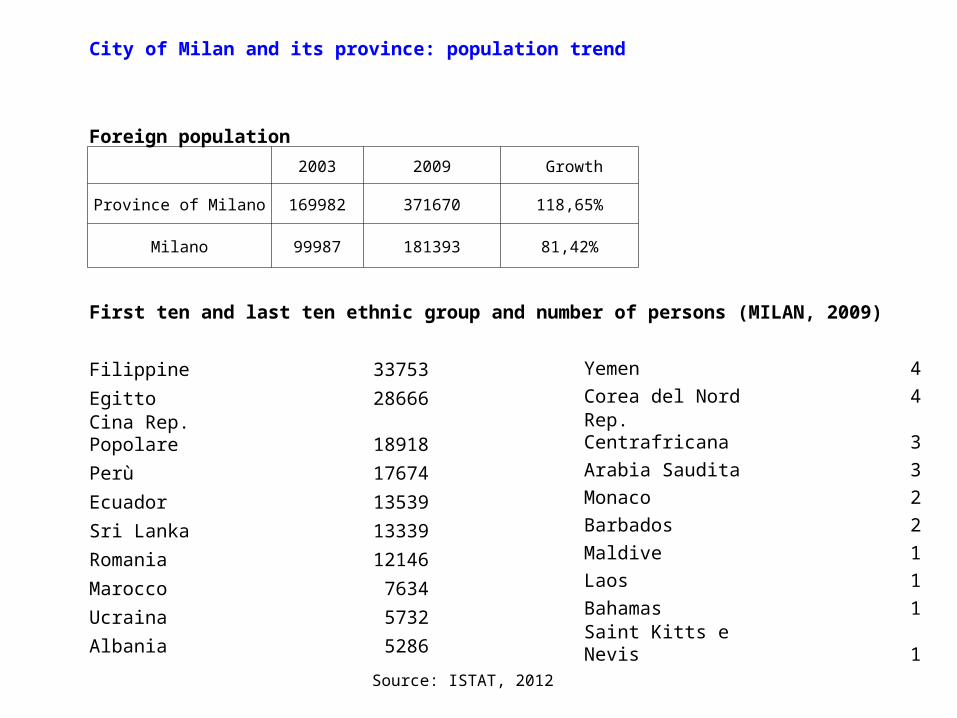
City of Milan and its province: population trend
Foreign population
2003 2009 Growth
Province of Milano 169982 371670 118,65%
Milano 99987 181393 81,42%
First ten and last ten ethnic group and number of persons (MILAN, 2009)
Filippine 33753
Egitto 28666Cina Rep. Popolare 18918Perù 17674
Ecuador 13539Sri Lanka 13339Romania 12146
Marocco 7634Ucraina 5732Albania 5286
Yemen 4Corea del Nord 4Rep. Centrafricana 3Arabia Saudita 3Monaco 2Barbados 2Maldive 1Laos 1Bahamas 1Saint Kitts e Nevis 1
Source: ISTAT, 2012
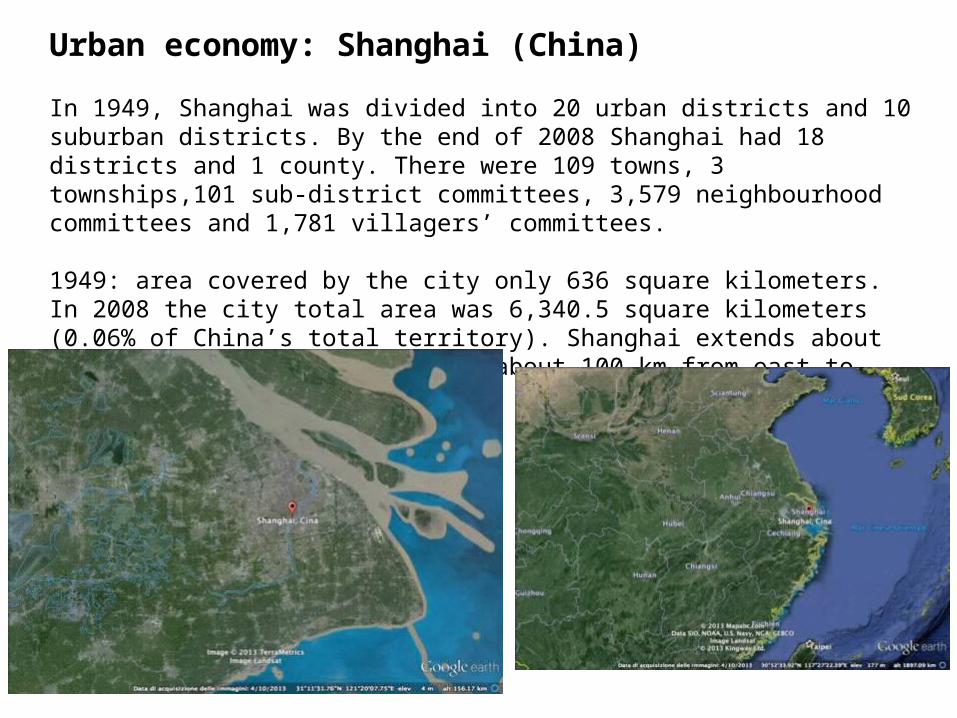
Urban economy: Shanghai (China)
In 1949, Shanghai was divided into 20 urban districts and 10 suburban districts. By the end of 2008 Shanghai had 18 districts and 1 county. There were 109 towns, 3 townships,101 sub-district committees, 3,579 neighbourhood committees and 1,781 villagers’ committees.
1949: area covered by the city only 636 square kilometers. In 2008 the city total area was 6,340.5 square kilometers (0.06% of China’s total territory). Shanghai extends about 120 km from north to south and about 100 km from east to west.
Shanghai and demographic trends
In 2005 a survey conducted by the Shanghai Municipal Government revealed that:
•8.9% of the city’s long-term residents (1.58 million), were aged 0-14;
•79.2% (14.08 million) were aged 15-64;
•11.9% (2.12 million) were aged 65 and above.
Due to the constant inflow of people from other parts of the country, the population in Shanghai keeps growing.
When Shanghai was turned into a city, it had a population of less than 100,000. By 1949, Shanghai had a population of 5.2 million.
By the end of 2008, however, the city’s permanent residents had grown to 13.9104 million (1% of China’s population). On average, the city had 2,978 long-term residents per square kilometre of land.
In 2008, the average life expectancy of local citizens stood at 81.28 years - 79.06 for males and 83.5 for females.

Shanghai: education and employment
•18.1% of population aged six and above had received education at college level;
• those with senior high school education accounted for 24.8% of population;
• in 2008, 99% of school-age children attended the nine-year obligatory education
• 97% of junior middle school graduates entered senior high schools;
• 83.8% of graduates of senior high school enrolled into colleges.
By the end of 2008, Shanghai employed 9.4607 million people.
• 1.4073 million, or 14.9%, were hired by the state enterprises and institutions;
• 1.8888 million, or 20%, were employed by collectively-owned work units;
• 1.3279 million, or 14%, worked in overseas-funded enterprises;
• 2.9968 million, or 31.6%, worked at private businesses.
• the unemployment rate in the city’s urban areas stood at 4.2% in late 2008.
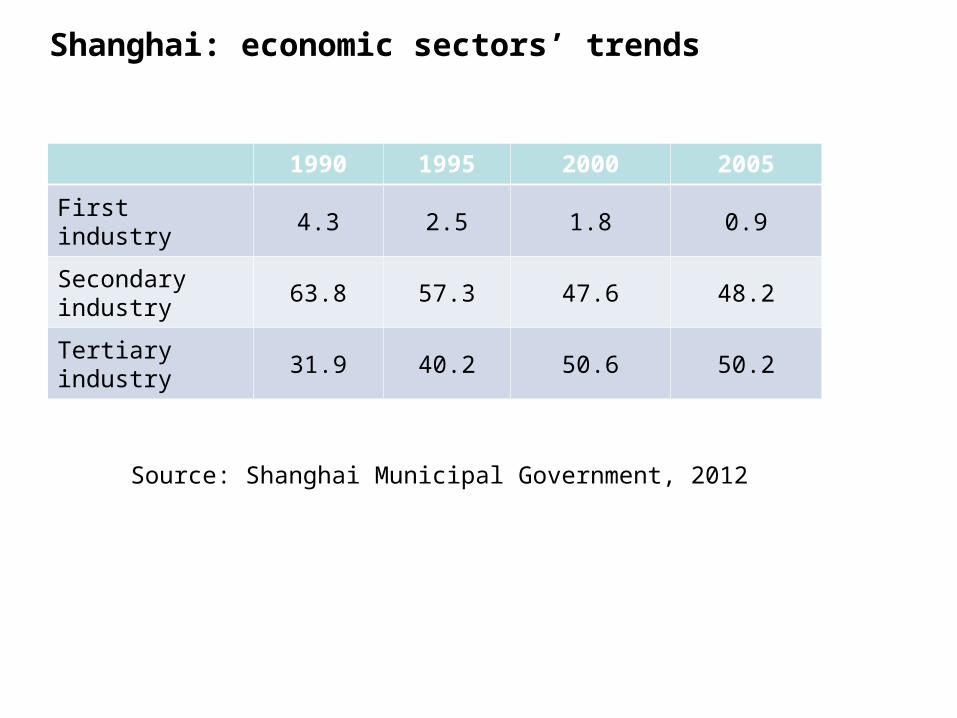
Shanghai: economic sectors’ trends
1990 1995 2000 2005
First industry 4.3 2.5 1.8 0.9
Secondary industry
63.8 57.3 47.6 48.2
Tertiary industry 31.9 40.2 50.6 50.2
Source: Shanghai Municipal Government, 2012
The socialist economic policy model and the economic systems in transition from socialist to
market-oriented systems
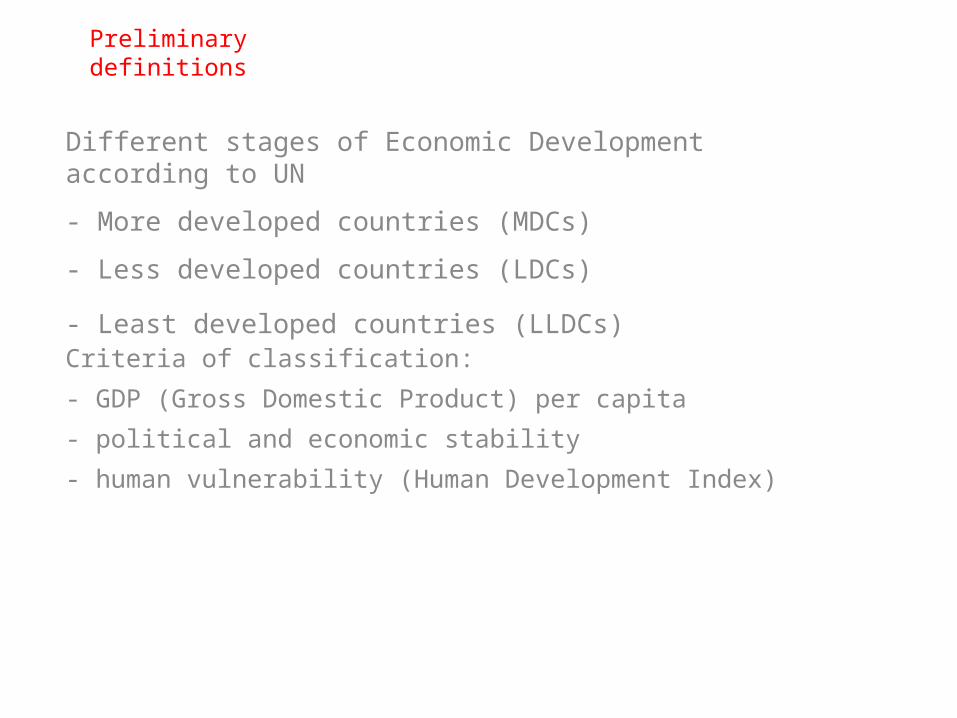
Preliminary definitions
Different stages of Economic Development according to UN
- More developed countries (MDCs)
- Less developed countries (LDCs)
- Least developed countries (LLDCs)Criteria of classification:
- GDP (Gross Domestic Product) per capita
- political and economic stability
- human vulnerability (Human Development Index)
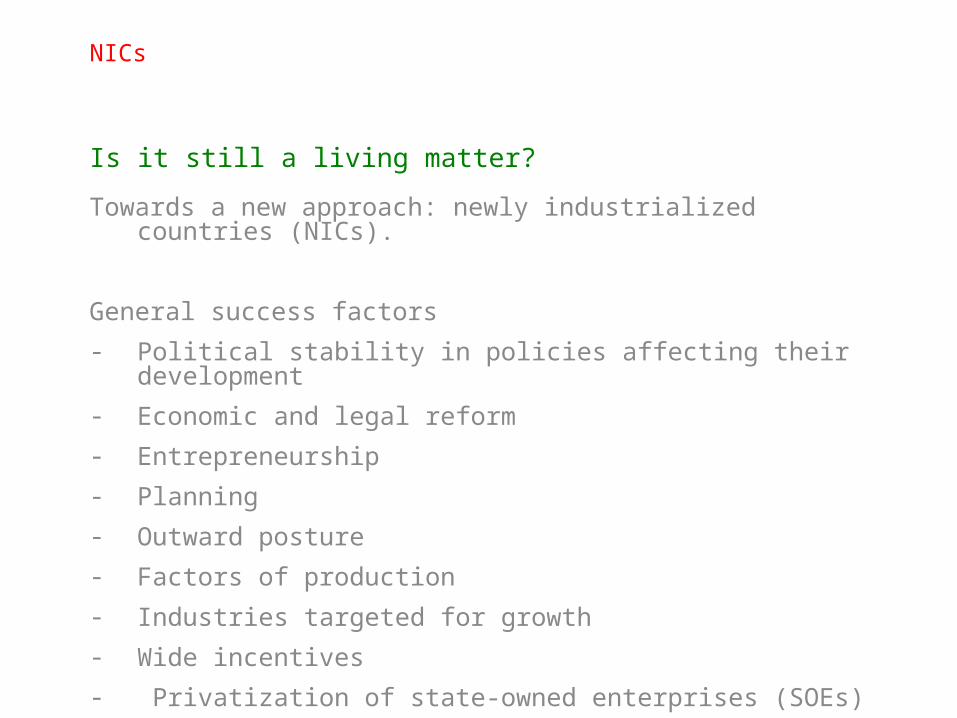
NICs
Is it still a living matter?
Towards a new approach: newly industrialized countries (NICs).
General success factors - Political stability in policies affecting their development- Economic and legal reform- Entrepreneurship- Planning- Outward posture- Factors of production- Industries targeted for growth- Wide incentives- Privatization of state-owned enterprises (SOEs)

Demand: pull factors
Difficulties to estimate market potential due to the coexistence of:
a) Rural/agricultural sector
b) Urban high-income sector
c) Transitional sector (periphery, slum…) Percentage of household expenditures
Country Food
Alcohol/tobacco
Clothing
Housing
Health
Transport
Communications
Leisure
Education
USA 6,9%
2,1% 4,4% 17,3% 19,4% 11,4% 1,6% 9,0% 2,6%
Mexico 24% 2,5% 3,0% 13,7% 4,8% 17,4% 1,7% 2,5% 3,9%
Brazil 24,6%
1,9% 3,5% 15,1% 4,4% 12,9% 5,3% 33,3% 7,1%
Germany 11,5%
3,5% 5,1% 24,6% 4,7% 13,4% 2,9% 9,5% 0,5%
Russia 28,5%
2,3% 9,6% 12,8% 2,7% 12,0% 4,2% 7,3% 2,7%
Turkey 24,8%
4,2% 6,1% 27,0% 2,2% 13,5% 4,2%2,2%
2,2%
Egypt 39% 2,2% 6,7% 20,3% 4,6% 6,5% 2,3% 2,4% 3,8%
Nigeria 39,4%
2,5% 7% 17,6% 4,5% 7,2% 2,2% 2,4% 3,9%
South Africa
20,8%
4,7% 5,4% 12,8% 9,3% 14,1% 3,9% 3,9% 3,3%
India 32,9%
2,3% 5,1% 10,8% 7,1% 19,1% 2,0% 2,0% 2,4%
China 34,8%
2,7% 8,6% 12,1% 7,8% 2,7% 10,1% 2,9% 6,2%
Japan 14,6%
3,2% 3,1% 25,2% 4,4% 10,4% 3,8% 11,4% 2,2%
Source: Cateora, 2009
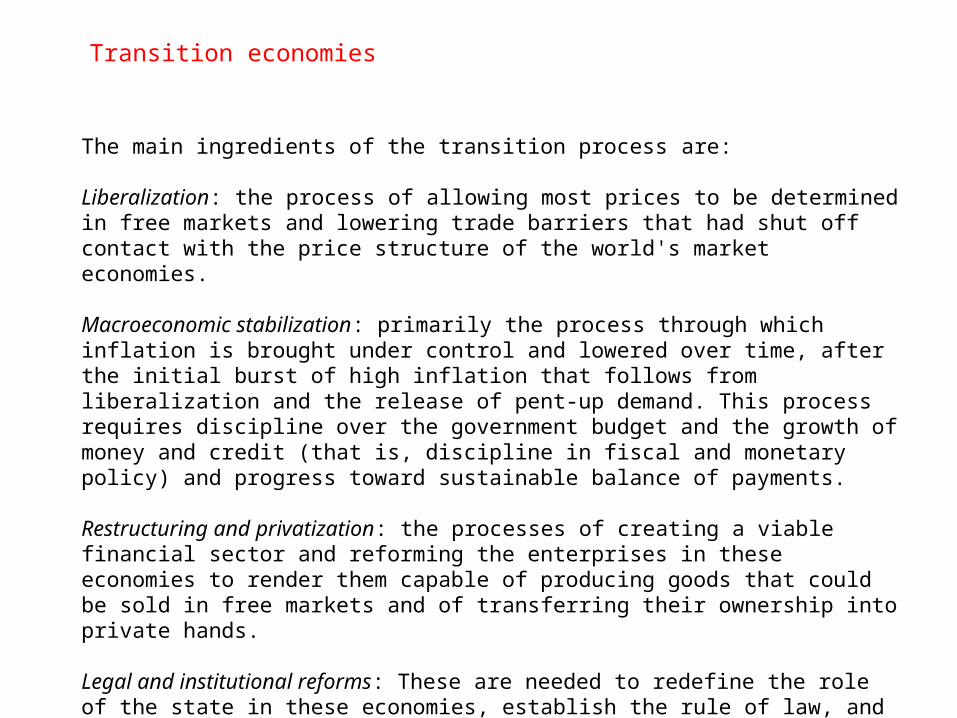
Transition economies
The main ingredients of the transition process are:
Liberalization: the process of allowing most prices to be determined in free markets and lowering trade barriers that had shut off contact with the price structure of the world's market economies.
Macroeconomic stabilization: primarily the process through which inflation is brought under control and lowered over time, after the initial burst of high inflation that follows from liberalization and the release of pent-up demand. This process requires discipline over the government budget and the growth of money and credit (that is, discipline in fiscal and monetary policy) and progress toward sustainable balance of payments.
Restructuring and privatization: the processes of creating a viable financial sector and reforming the enterprises in these economies to render them capable of producing goods that could be sold in free markets and of transferring their ownership into private hands.
Legal and institutional reforms: These are needed to redefine the role of the state in these economies, establish the rule of law, and introduce appropriate competition policies.
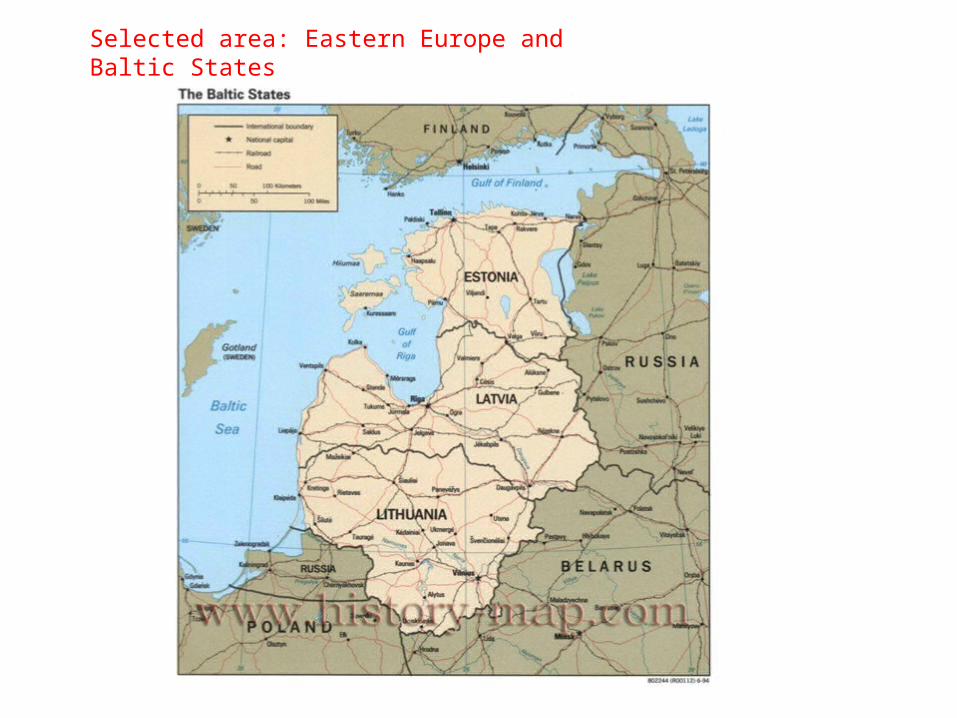
Selected area: Eastern Europe and Baltic States
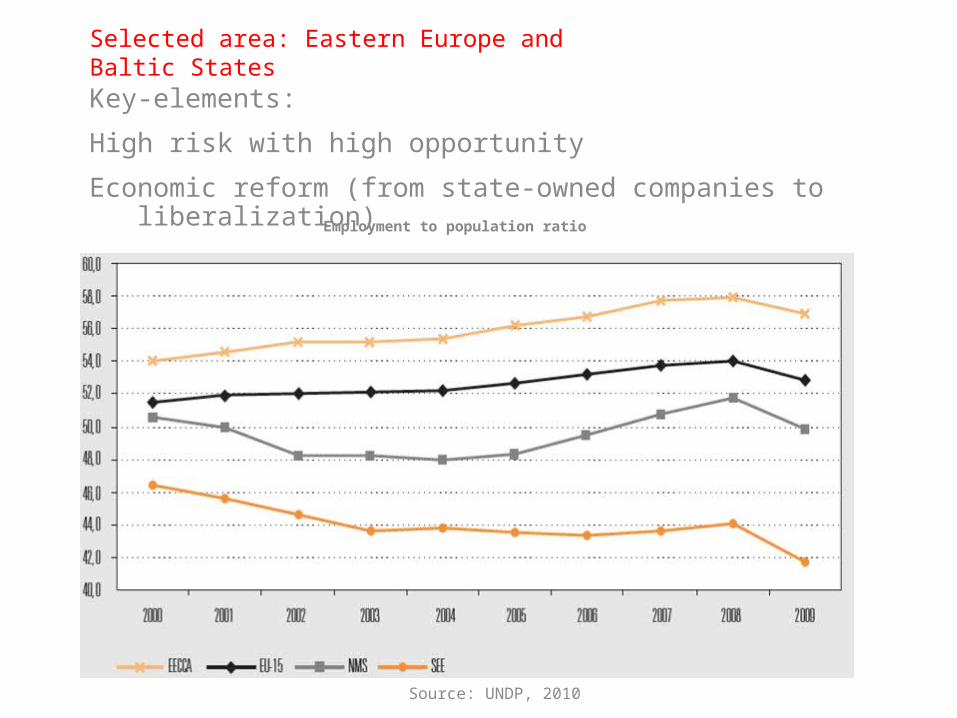
Selected area: Eastern Europe and Baltic StatesKey-elements:
High risk with high opportunity
Economic reform (from state-owned companies to liberalization)
Source: UNDP, 2010
Employment to population ratio
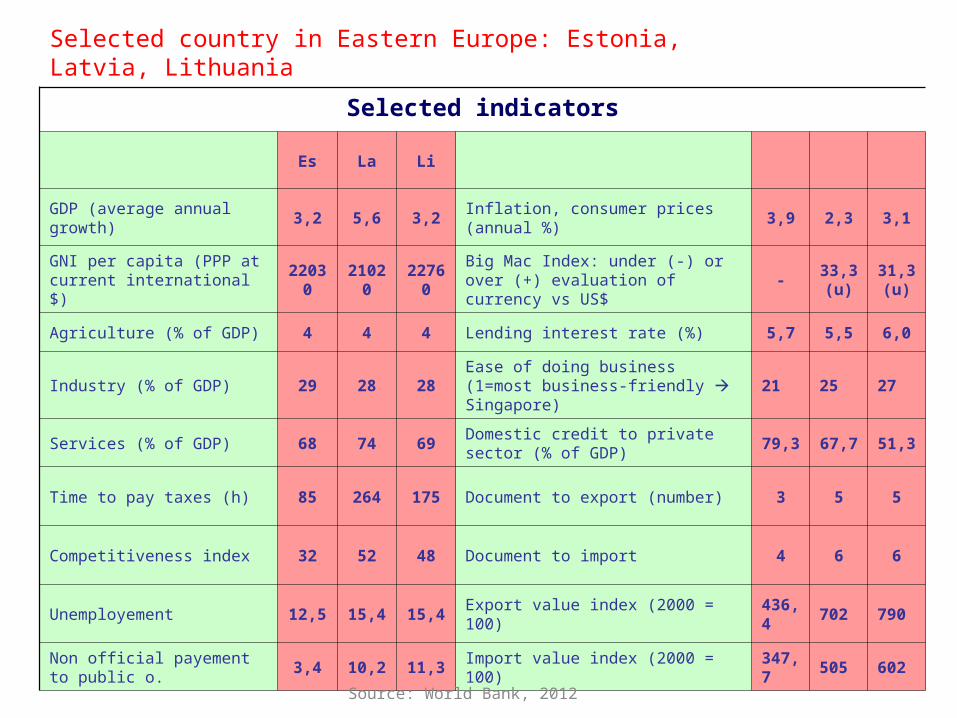
Selected country in Eastern Europe: Estonia, Latvia, Lithuania
Selected indicators
Es La Li
GDP (average annual growth) 3,2 5,6 3,2 Inflation, consumer prices (annual %) 3,9 2,3 3,1
GNI per capita (PPP at current international $)
22030
21020
22760
Big Mac Index: under (-) or over (+) evaluation of currency vs US$
-33,3 (u)
31,3 (u)
Agriculture (% of GDP) 4 4 4 Lending interest rate (%) 5,7 5,5 6,0
Industry (% of GDP) 29 28 28Ease of doing business (1=most business-friendly Singapore)
21 25 27
Services (% of GDP) 68 74 69Domestic credit to private sector (% of GDP)
79,3 67,7 51,3
Time to pay taxes (h) 85 264 175 Document to export (number) 3 5 5
Competitiveness index 32 52 48 Document to import 4 6 6
Unemployement 12,5 15,4 15,4 Export value index (2000 = 100)436,4
702 790
Non official payement to public o.
3,4 10,2 11,3 Import value index (2000 = 100)347,7
505 602
Source: World Bank, 2012
The emergent economic powers (Brazil, Russia, India, China and South Africa = BRICS)
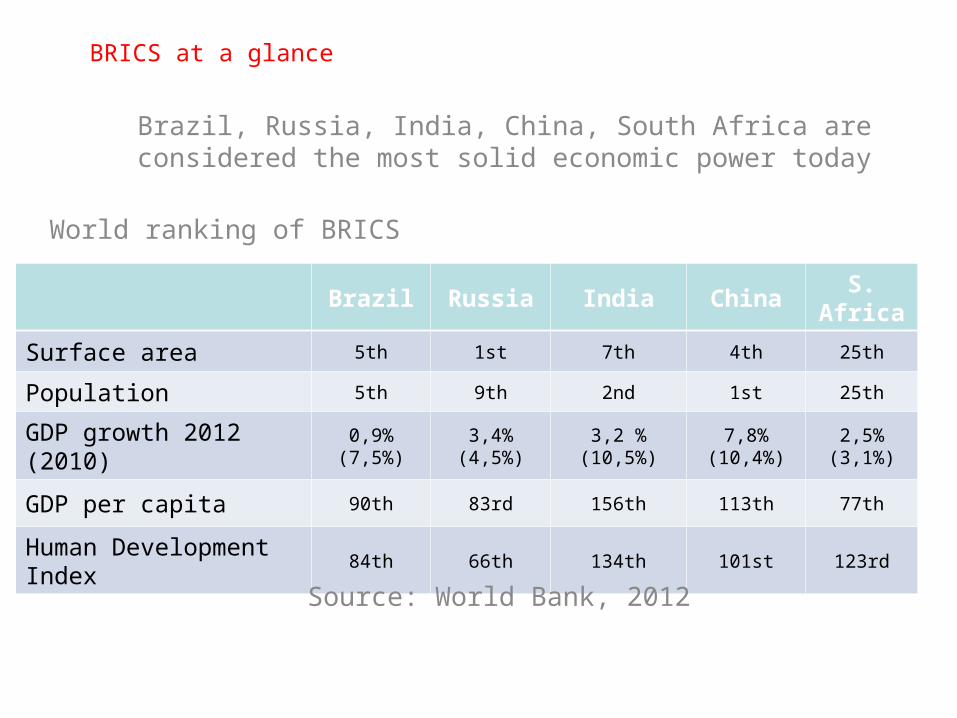
BRICS at a glance
Brazil, Russia, India, China, South Africa are considered the most solid economic power today
Brazil Russia India ChinaS.
Africa
Surface area 5th 1st 7th 4th 25th
Population 5th 9th 2nd 1st 25th
GDP growth 2012 (2010) 0,9% (7,5%)
3,4% (4,5%)
3,2 % (10,5%)
7,8% (10,4%)
2,5% (3,1%)
GDP per capita 90th 83rd 156th 113th 77th
Human Development Index
84th 66th 134th 101st 123rd
Source: World Bank, 2012
World ranking of BRICS
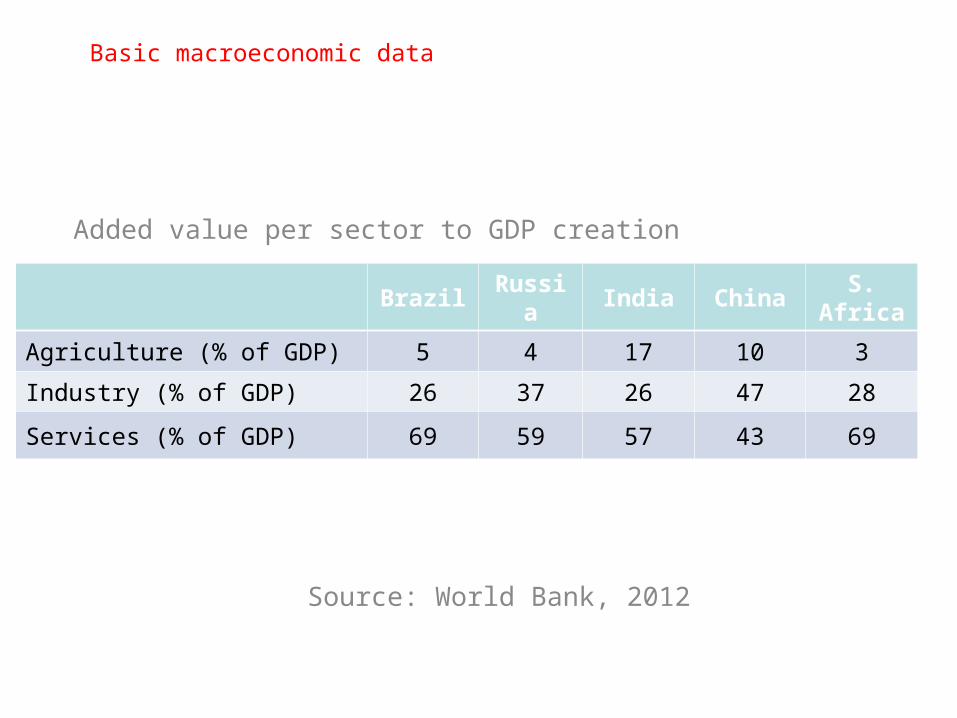
Basic macroeconomic data
Added value per sector to GDP creation
Brazil Russia India ChinaS.
Africa
Agriculture (% of GDP) 5 4 17 10 3
Industry (% of GDP) 26 37 26 47 28
Services (% of GDP) 69 59 57 43 69
Source: World Bank, 2012