Urban HEART tool - St. Michael's is a matter of life and death.” ... Urban health is infl uenced...
48
Urban HEART Urban Health Equity Assessment and Response Tool Urban HEART
Transcript of Urban HEART tool - St. Michael's is a matter of life and death.” ... Urban health is infl uenced...

Urban HEARTUrban Health Equity Assessment and Response Tool
U
rba
n H
EA
RT

WHO Library Cataloguing-in-Publication Data
Urban HEART: Urban Health Equity Assessment and Response Tool.
1.Health services accessibility. 2.Outcome and process assessment (Health care). 3.Consumer participation. 4.Socioeconomic factors. 5.National health programs. 6.Urban health. I.WHO Centre for Health Development (Kobe, Japan).
ISBN 978 92 4 150014 2 (NLM classifi cation: W 84.4)
© World Health Organization, The WHO Centre for Health Development, Kobe, 2010
All rights reserved. Requests for permission to reproduce or translate WHO publications – whether for sale or for noncommercial distribution – should be addressed to WHO Press, World Health Organization, 20 Avenue Appia, 1211 Geneva 27, Switzerland (fax: +41 22 791 4806; email: [email protected]) or to the WHO Centre for Health Development, Kobe, Japan (phone: +81 78 230 3100; email: [email protected]).
The designations employed and the presentation of the material in this publication do not imply the expression of any opinion whatsoever on the part of the World Health Organization concerning the legal status of any country, territory, city or area or of its authorities, or concerning the delimitation of its frontiers or boundaries. Dotted lines on maps represent approximate border lines for which there may not yet be full agreement.
The mention of specifi c companies or of certain manufacturers’ products does not imply that they are endorsed or recommended by the World Health Organization in preference to others of a similar nature that are not mentioned. Errors and omissions excepted, the names of proprietary products are distinguished by initial capital letters.
The World Health Organization does not warrant that the information contained in this publication is complete and correct and shall not be liable for any damages incurred as a result of its use.
Printed in Japan.
Available online at www.who.or.jp/urbanheart
Publication designed by: Big Yellow Taxi, Inc.

PREFACE ..................................................................................................................2ACKNOWLEDGEMENTS ..............................................................................4
A. CONCEPTS AND PRINCIPLES ...................................................6A.1 INEQUITY IN HEALTH
A.2 THREE MAIN APPROACHES TO REDUCE
HEALTH INEQUITIES
A.3 TACKLING HEALTH INEQUITIES IN URBAN AREAS
B. INTRODUCING URBAN HEART ..........................................10B.1 WHAT IS URBAN HEART?
B.2 WHY SHOULD YOU USE URBAN HEART?
B.3 WHAT IS URBAN HEART EXPECTED TO ACHIEVE?
B.4 CORE ELEMENTS OF URBAN HEART
C. PLANNING URBAN HEART ....................................................18C.1 PLANNING AND IMPLEMENTATION CYCLE
C.2 URBAN HEART USER MANUAL
D. ASSESSMENT .................................................................................... 22D.1 INDICATORS
D.2 DATA PRESENTATION
E. RESPONSE ............................................................................................ 30E.1 IDENTIFYING PRIORITIES AND RESPONSE STRATEGIES
E.2 SELECT RELEVANT INTERVENTIONS
F. CONCLUSION .................................................................................... 38
ANNEX 1 URBAN HEART INDICATORS .........................................40ANNEX 2 REFERENCES AND USEFUL SOURCES ......................44
TABLE OF CONTENTS
World Health Organization 1

In the words of World Health Organization (WHO) Director-
General, Dr Margaret Chan, “When health is concerned, equity
really is a matter of life and death.” Tackling differentials in
health across population groups is regaining prominence in the
agenda of national and local governments, and international
organizations. In 2005, WHO established the Commission
on Social Determinants of Health to support countries and
global health partners and to draw their attention to the social
determinants of health, which are signifi cant factors in poor
health and inequities in health between and within countries.
Earlier, in 1978, at the International Conference on Primary
Health Care at Alma-Ata, world governments had endorsed
the notion that health is linked to living and working conditions
of the population, and acknowledged the role of community
participation. Despite the commitment to “Health for All” at
Alma-Ata, evidence shows that gaps between rich and poor
countries and between the rich and poor within countries have
since widened.
The impact of the urban setting on health and, in particular,
inequity in health has been widely documented. Evidence
shows that while, on average, public services, including
health and health service provision, in urban areas may be
better than in rural areas, these averages often mask wide
disparities between more and less disadvantaged populations.
One key factor is the exclusion of the marginalized and
vulnerable in public health planning and response systems
(1). Urban health is infl uenced by a dynamic interaction
between global, national and subnational policies; within
that wider context, city governments and local communities
can play an instrumental role in closing the gap between the
better off and the worse off.
Regardless of the evidence, only a few countries have
examined their inter- or intra-city health inequities, and few
do so regularly. Information that shows the gaps between
PREFACE
2 Urban HEART
1 Cities from the following 10 countries pilot-tested an initial version of the tool: Brazil, Indonesia, Islamic Republic of Iran, Kenya, Malaysia, Mexico, Mongolia, Philippines, Sri Lanka and Viet Nam.
cities or within the same city is a crucial requirement to
trigger appropriate local actions to promote health equity.
Evidence should be comprehensive enough to provide hints
on key health determinants, and concise enough to facilitate
policy-making and prioritization of interventions.
In order to facilitate the process of proactively addressing
health inequities, WHO collaborated with 17 cities from 10
countries1 in 2008–2009 to develop and pilot-test a tool
called the Urban Health Equity Assessment and Response
Tool (Urban HEART). Urban HEART guides local policy-
makers and communities through a standardized procedure
of gathering relevant evidence and planning effi ciently for
appropriate actions to tackle health inequities. This collective
effort towards a common goal has galvanized both city
governments and communities to recognize and take action
on health inequities. It is envisaged that cities in varied
contexts can locally adapt and institutionalize Urban HEART,
while maintaining its core concepts and principles.
The aspiration for closing the health gap in cities can be met by
guiding public health policies through evidence and in-depth
analysis of inequities, using a participatory and intersectoral
approach. Urban HEART provides an opportunity for policy-
makers from different sectors, and communities, to cooperate
in using evidence to identify and prioritize interventions for
tackling health inequities. Local chief executives are provided
with a tool to lead and engage their governments in more
effi cient allocation of resources with a broad-based support
for action. Importantly, the tool empowers local communities
to use evidence and take action on their priorities with the
support of local and national authorities.
World Health Organization 3

4 Urban HEART
The Urban Health Equity Assessment and Response Tool
(Urban HEART) is a collective effort and has been jointly
developed by the WHO Centre for Health Development,
Kobe (Japan), in collaboration with regional offi ces of WHO,
and city and national offi cials from across the world. Inputs
from the teams in cities who pilot-tested the tool have been
critical in the development of Urban HEART:
• Guarulhos (Brazil)
• Jakarta, Denpasar (Indonesia)
• Tehran (Islamic Republic of Iran)
• Nakuru (Kenya)
• State of Sarawak (Malaysia)
• Mexico City (Mexico)
• Ulaanbaatar (Mongolia)
• Davao, Naga, Olongapo, Paranaque, Tacloban, Taguig,
Zamboanga (Philippines)
• Colombo (Sri Lanka)
• Ho Chi Minh City (Viet Nam).
In particular, the enthusiasm of community groups in various
pilot sites and their leadership in building broad-based
support for applying the tool to address health inequities
in their cities were vital. Their inputs and emphasis on a
participatory approach have been a key building block of
Urban HEART.
ACKNOWLEDGEMENTS
World Health Organization 5
The development of the tool has also benefi ted much from the
expertise of offi cials at WHO headquarters in Geneva, especially
from the Noncommunicable Diseases and Mental Health
Cluster and the Information, Evidence and Research Cluster.
Finally, the 12 members of the Urban HEART Ad Hoc Advisory
Group brought in a variety of expertise to contribute to the
development of the tool. The advisors, a mix of academics,
policy-makers and experts from international organizations,
provided much-needed technical inputs and advice to
strengthen both the scientifi c validity and the practical
applicability of the tool.

6 Urban HEART
A.1 – INEQUITY IN HEALTH A.2 – THREE MAIN APPROACHES TO REDUCE HEALTH INEQUITIES A.2.1 – Targeting disadvantaged population groups or social classes A.2.2 – Narrowing the health gap A.2.3 – Reducing inequities throughout the whole populationA.3 – TACKLING HEALTH INEQUITIES IN URBAN AREAS
A.1 INEQUITY IN HEALTHDifferences in health across the population can be observed
in any city. Genetic and constitutional variations ensure
that the health of individuals varies, as it does for any other
physical characteristic. Older people tend to be sicker than
younger people, because of the natural ageing process.
However, three features, when combined, turn a mere
difference in health into an inequity in health. A difference in
health that is systematic, socially produced (and, therefore,
modifi able) and unfair 2 is an inequity in health (2).
A. CONCEPTS AND PRINCIPLES
Figure 1 Under-fi ve mortality rates per 1000 live births by urban wealth quintiles in selected countries
Bolivia Cameroon India Egypt Philippines Turkey0
20
40
60
80
100
120
140
160Poorest 20%
Q2
Q3
Q4
Richest 20%
Source: Demographic and Health Surveys 2003–2005 (WHO estimates).

A.1 – INEQUITY IN HEALTH A.2 – THREE MAIN APPROACHES TO REDUCE HEALTH INEQUITIES A.2.1 – Targeting disadvantaged population groups or social classes A.2.2 – Narrowing the health gap A.2.3 – Reducing inequities throughout the whole populationA.3 – TACKLING HEALTH INEQUITIES IN URBAN AREAS
World Health Organization 7
Systematic differences in health are not distributed randomly but show
a consistent pattern across the population. One of the most striking
examples is the systematic differences in health between different
socioeconomic groups. This social pattern of disease is pervasive,
though its magnitude and extent vary among countries. Figure 1
shows that in each of the selected countries from different regions of
the world systematic differences in under-fi ve mortality exist in urban
areas across socioeconomic groups represented by wealth quintiles.
No law of nature decrees that the children of poor families should
die at a higher rate than that of children born into rich families.
This difference is, therefore, largely produced by differential social circumstances and is not biologically determined. If existing social
and economic policies maintain these gaps then they must be
recognized as inequitable and changed to reduce inequities.
Inequity in health is considered to be unfair because it is generated
and maintained by “unjust social arrangements”. Inequity is
unfair because (a) we know how to reduce inequities with known
interventions and to not take action is unjust; and (b) inequities are
avoidable and preventable. Although ideas about what is unfair
may differ to a certain degree from place to place, there is much
common ground. For example, it would be widely considered
unfair if the chance of survival was much poorer for the children of
some socioeconomic groups, compared with that of others.
EQUITY IN HEALTHThe World Health Organization Constitution, adopted in 1946, asserted then that “the highest standards of health should be within reach of all, without distinction of race, religion, political belief, economic or social condition”. Echoing these sentiments more than 60 years later, equity in health implies that ideally everyone could attain their full health potential and that no one should be disadvantaged from achieving this potential because of their social position or other socially determined circumstance.
2 The main reference for this section is Whitehead and Dahlgren (2).
8 Urban HEART
A.2 THREE MAIN APPROACHES TO REDUCE HEALTH INEQUITIESGlobally, multiple strategies have been used to address health
inequities. Three main approaches applied to measure and
tackle inequities in health are:
• targeting disadvantaged population groups or social classes
• narrowing the health gap
• reducing inequities throughout the whole population.
It is likely that the approaches are interdependent and should
build on one another. The relative merits of the different
ways of addressing health inequities are discussed briefl y.
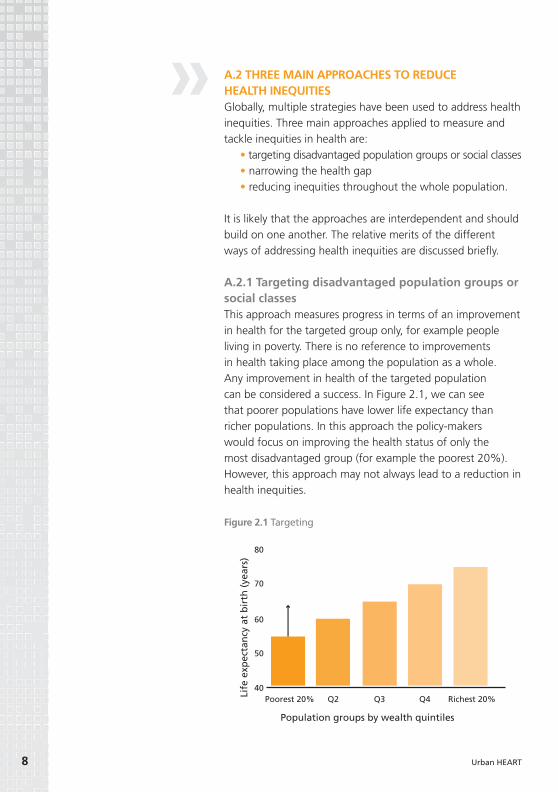
A.2.1 Targeting disadvantaged population groups or social classesThis approach measures progress in terms of an improvement
in health for the targeted group only, for example people
living in poverty. There is no reference to improvements
in health taking place among the population as a whole.
Any improvement in health of the targeted population
can be considered a success. In Figure 2.1, we can see
that poorer populations have lower life expectancy than
richer populations. In this approach the policy-makers
would focus on improving the health status of only the
most disadvantaged group (for example the poorest 20%).
However, this approach may not always lead to a reduction in
health inequities.
80
70
60
50
40
Life
exp
ecta
ncy
at
bir
th (
year
s)
Population groups by wealth quintiles
Poorest 20% Q2 Q3 Q4 Richest 20%
2.1
Figure 2.1 Targeting
World Health Organization 9
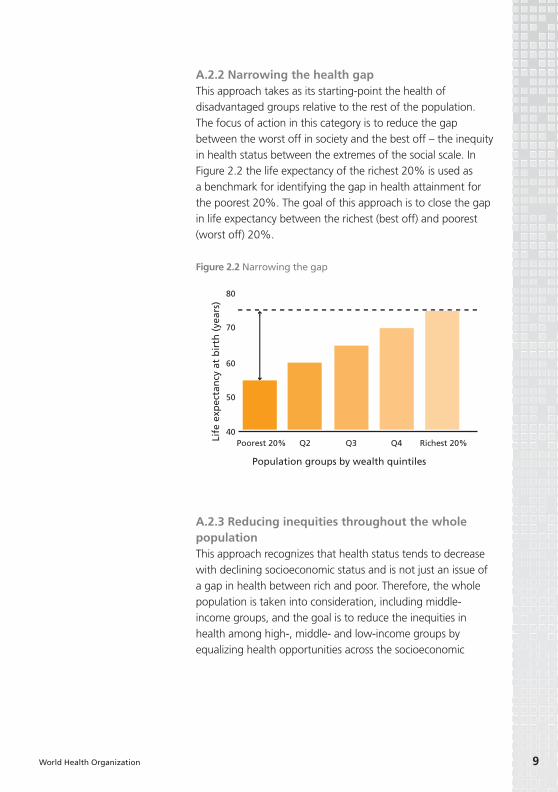
A.2.2 Narrowing the health gapThis approach takes as its starting-point the health of
disadvantaged groups relative to the rest of the population.
The focus of action in this category is to reduce the gap
between the worst off in society and the best off – the inequity
in health status between the extremes of the social scale. In
Figure 2.2 the life expectancy of the richest 20% is used as
a benchmark for identifying the gap in health attainment for
the poorest 20%. The goal of this approach is to close the gap
in life expectancy between the richest (best off) and poorest
(worst off) 20%.
A.2.3 Reducing inequities throughout the whole populationThis approach recognizes that health status tends to decrease
with declining socioeconomic status and is not just an issue of
a gap in health between rich and poor. Therefore, the whole
population is taken into consideration, including middle-
income groups, and the goal is to reduce the inequities in
health among high-, middle- and low-income groups by
equalizing health opportunities across the socioeconomic
80
70
60
50
40
Life
exp
ecta
ncy
at
bir
th (
year
s)
Population groups by wealth quintiles
Poorest 20% Q2 Q3 Q4 Richest 20%
2.2
Figure 2.2 Narrowing the gap

10 Urban HEART
spectrum. In Figure 2.3 the life expectancy of the richest
group is taken as a benchmark of health attainment for the
other groups. The goal here is to reduce the gap across all
population groups in comparison to the best off.
A.3 TACKLING HEALTH INEQUITIES IN URBAN AREASIn 2007, for the fi rst time all over the world, more people
lived in cities and towns than in rural areas. The city’s promise
lies in proximity: to health-supporting physical and social
infrastructure, to technology, and to jobs, schools and health-
care services. Action to turn proximity into accessibility and
to improve health, education and social services in cities
is a priority outlined by the WHO Commission on Social
Determinants of Health.
The work of the Commission has contributed to increasing
global awareness for health equity. In its fi nal report in 2008,
the Commission defi nes health inequity as follows: “Where
systematic differences in health are judged to be avoidable by
reasonable action they are, quite simply, unfair. It is this that we
label health inequity.” The Commission adds: “Putting right
these inequities – the huge and remediable differences in health
between and within countries – is a matter of social justice” (3).
Further, the Commission recognized that principles alone are
insuffi cient. Evidence is required on what is likely to work in
80
70
60
50
40
Life
exp
ecta
ncy
at
bir
th (
year
s)
Population groups by wealth quintiles
Poorest 20% Q2 Q3 Q4 Richest 20%
2.3
Figure 2.3 Acting on the whole population

World Health Organization 11
practice to improve health and reduce health inequities. Evidence
should be collected not only on the immediate causes of disease
but also on the “causes of the causes” – the fundamental
national and global structures of social hierarchy and the socially
determined conditions these create in which people grow, live,
work and age. With respect to this the Commission has called
upon multilateral agencies, including WHO, to:
• use a common global framework of indicators to
monitor development progress;
• adopt a stewardship role, including strengthening the
technical capacity of Member States and developing
mechanisms for intersectoral action for health;
• monitor progress on health equity;
• support the establishment of global and national health
equity surveillance systems;
• convene global meetings.
In May 2009, the World Health Assembly of WHO, at its 62nd
session, passed a resolution based on the recommendations
of the Commission titled Reducing health inequities through action on the social determinants of health (4).

12 Urban HEART
B.1 – WHAT IS URBAN HEART? B.2 – WHY SHOULD YOU USE URBAN HEART?B.3 – WHAT IS URBAN HEART EXPECTED TO ACHIEVE?B.4 – CORE ELEMENTS OF URBAN HEART B.4.1 – Sound evidence B.4.2 – Intersectoral action for health B.4.3 – Community participation
B.1 WHAT IS URBAN HEART?The Urban Health Equity Assessment and Response Tool
(Urban HEART) is a user-friendly guide for policy- and
decision-makers at national and local levels to:
• identify and analyse inequities in health between people
living in various parts of cities, or belonging to different
socioeconomic groups within and across cities;
• facilitate decisions on viable and effective strategies,
interventions and actions that should be used to reduce
inter- and intra-city health inequities.
Implementing Urban HEART will equip policy-makers with the
necessary evidence and strategies to reduce inter- and intra-
city health inequities. Inter-city health inequities are those that
occur across two or more cities; Intra-city health inequities3 are
those that exist across wards or districts or across socioeconomic
groups (for example by income or education level) within a city.
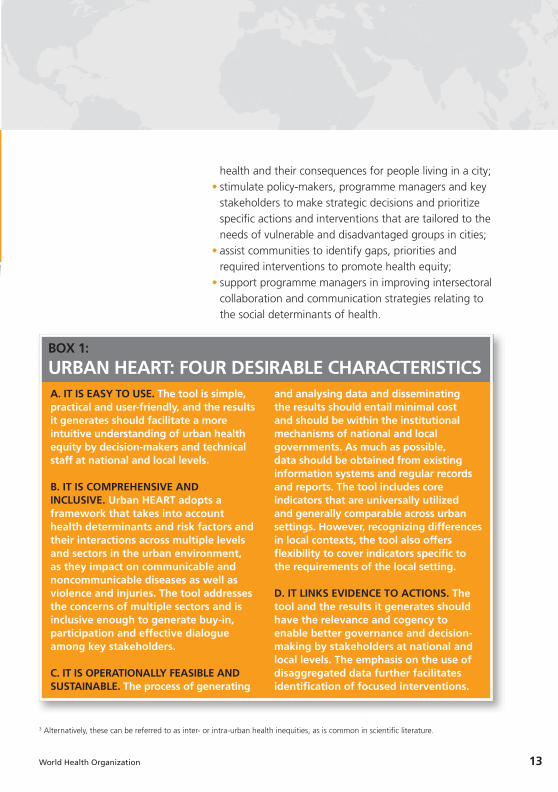
Urban HEART has four characteristics that are desirable in such a
tool: (a) it is easy to use; (b) it is comprehensive and inclusive; (c) it
is operationally feasible and sustainable; and (d) it links evidence
to actions. These positive features are further described in Box 1.
B.2 WHY SHOULD YOU USE URBAN HEART?The adoption and use of Urban HEART by national and local
governments, community organizations and urbanized or
rapidly urbanizing communities is intended to:
• guide policy-makers and key stakeholders to achieve
a better understanding of the social determinants of
B. INTRODUCING URBAN HEART
B.1 – WHAT IS URBAN HEART? B.2 – WHY SHOULD YOU USE URBAN HEART?B.3 – WHAT IS URBAN HEART EXPECTED TO ACHIEVE?B.4 – CORE ELEMENTS OF URBAN HEART B.4.1 – Sound evidence B.4.2 – Intersectoral action for health B.4.3 – Community participation
World Health Organization 13
A. IT IS EASY TO USE. The tool is simple, practical and user-friendly, and the results it generates should facilitate a more intuitive understanding of urban health equity by decision-makers and technical staff at national and local levels.
B. IT IS COMPREHENSIVE AND INCLUSIVE. Urban HEART adopts a framework that takes into account health determinants and risk factors and their interactions across multiple levels and sectors in the urban environment, as they impact on communicable and noncommunicable diseases as well as violence and injuries. The tool addresses the concerns of multiple sectors and is inclusive enough to generate buy-in, participation and effective dialogue among key stakeholders.
C. IT IS OPERATIONALLY FEASIBLE AND SUSTAINABLE. The process of generating
and analysing data and disseminating the results should entail minimal cost and should be within the institutional mechanisms of national and local governments. As much as possible, data should be obtained from existing information systems and regular records and reports. The tool includes core indicators that are universally utilized and generally comparable across urban settings. However, recognizing differences in local contexts, the tool also offers fl exibility to cover indicators specifi c to the requirements of the local setting.
D. IT LINKS EVIDENCE TO ACTIONS. The tool and the results it generates should have the relevance and cogency to enable better governance and decision-making by stakeholders at national and local levels. The emphasis on the use of disaggregated data further facilitates identifi cation of focused interventions.
BOX 1:
URBAN HEART: FOUR DESIRABLE CHARACTERISTICS
3 Alternatively, these can be referred to as inter- or intra-urban health inequities, as is common in scientifi c literature.
health and their consequences for people living in a city;
• stimulate policy-makers, programme managers and key
stakeholders to make strategic decisions and prioritize
specifi c actions and interventions that are tailored to the
needs of vulnerable and disadvantaged groups in cities;
• assist communities to identify gaps, priorities and
required interventions to promote health equity;
• support programme managers in improving intersectoral
collaboration and communication strategies relating to
the social determinants of health.
14 Urban HEART
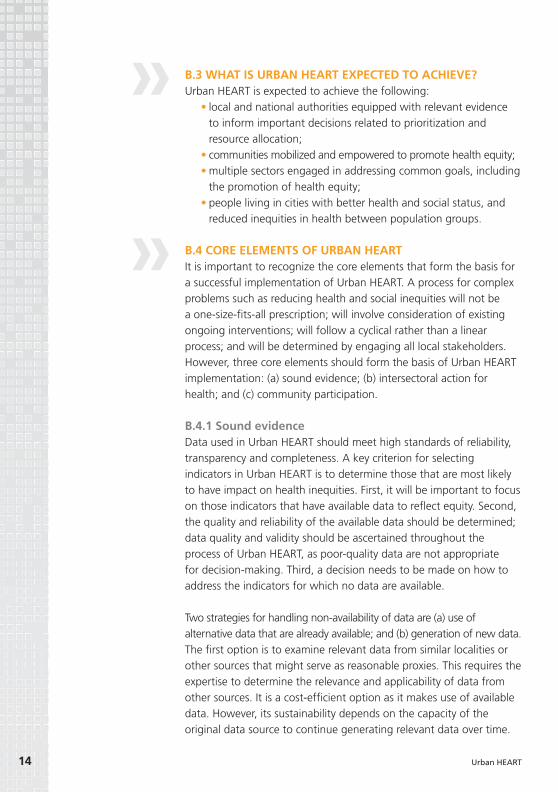
B.3 WHAT IS URBAN HEART EXPECTED TO ACHIEVE?Urban HEART is expected to achieve the following:
• local and national authorities equipped with relevant evidence
to inform important decisions related to prioritization and
resource allocation;
• communities mobilized and empowered to promote health equity;
• multiple sectors engaged in addressing common goals, including
the promotion of health equity;
• people living in cities with better health and social status, and
reduced inequities in health between population groups.
B.4 CORE ELEMENTS OF URBAN HEARTIt is important to recognize the core elements that form the basis for
a successful implementation of Urban HEART. A process for complex
problems such as reducing health and social inequities will not be
a one-size-fi ts-all prescription; will involve consideration of existing
ongoing interventions; will follow a cyclical rather than a linear
process; and will be determined by engaging all local stakeholders.
However, three core elements should form the basis of Urban HEART
implementation: (a) sound evidence; (b) intersectoral action for
health; and (c) community participation.
B.4.1 Sound evidenceData used in Urban HEART should meet high standards of reliability,
transparency and completeness. A key criterion for selecting
indicators in Urban HEART is to determine those that are most likely
to have impact on health inequities. First, it will be important to focus
on those indicators that have available data to refl ect equity. Second,
the quality and reliability of the available data should be determined;
data quality and validity should be ascertained throughout the
process of Urban HEART, as poor-quality data are not appropriate
for decision-making. Third, a decision needs to be made on how to
address the indicators for which no data are available.
Two strategies for handling non-availability of data are (a) use of
alternative data that are already available; and (b) generation of new data.
The fi rst option is to examine relevant data from similar localities or
other sources that might serve as reasonable proxies. This requires the
expertise to determine the relevance and applicability of data from
other sources. It is a cost-effi cient option as it makes use of available
data. However, its sustainability depends on the capacity of the
original data source to continue generating relevant data over time.

World Health Organization 15
The second, more resource-intensive option involves conducting a survey
or a qualitative assessment. Generation of new data may be expensive or
unsustainable as it requires substantial expertise and resources. Conducting a survey is not recommended unless there is strong local willingness and
capacity – in terms of resources – to do so. Appropriate technical experts
for survey design, sampling and instrument development should be
involved in the process. Similarly, if the option of a qualitative assessment is chosen for some indicators, appropriate experts with experience in
conducting focus group discussions or key informant interviews should
be involved. It is important to gauge the local availability of expertise,
information and resources before selecting the relevant option(s).
Irrespective of the method used for collecting information every
effort should be made to maintain the scientifi c validity of the
process. Given issues of sustainability with the two strategies,
local government and communities should aim to establish in a
simultaneous and phased approach the systems and capacity to
ensure that disaggregated data become available over time, even
though they may not be available in the fi rst instance. Some key
issues to consider while collecting data are:
• Disaggregation. The statistics made available should be
stratifi ed by sex, age, socioeconomic status, major geographical
or administrative region and ethnicity, as appropriate.
• Validation. The fi nal data used must be adequately vetted by
relevant local and national authorities and experts. The data
should maintain the highest standards of quality and should be
collected from standard reliable sources.
• Consistency. There should be internal consistency of data
within a dataset as well as consistency between datasets
and over time. Data revisions should follow a regular, well-
established and transparent schedule and process.
• Representativeness. Data should adequately represent the
population and relevant subpopulations.
• Confi dentiality, data security and data accessibility. Practices should be in accordance with guidelines and other
established standards for storage, back-up, transport of
information and retrieval.

16 Urban HEART
• Adjustment methods. Crude data need to be adjusted
to take into account confounding factors. For example, for
comparison of the prevalence of age-sensitive conditions such
as diabetes, data must be adjusted to allow for variations in the
age structure of different populations. Adjustment requires that
data transformation and analysis methods follow sound and
transparent statistical procedures.
B.4.2 Intersectoral action for healthIntersectoral action involves building upon constructive relationships
with people and agencies from outside the health sector in an effort
to infl uence a broad range of health determinants. These include
other sectors in the government, such as education, transport
and public works, and community groups and nongovernmental
organizations addressing relevant issues.
First, the nature of the problem that Urban HEART is trying to address
is such that actions cannot be taken within the health sector alone.
The roots of health inequities often lie outside the direct reach of
the health-care system and, for this reason, it is vital for all relevant
sectors to take action in order for interventions to be effective.
Second, sharing of information and data resources across sectors
is essential to the successful implementation of Urban HEART. If
information systems are not centralized, the ownership of indicators
for various determinants of relevance to the health sector may
remain the responsibility of other sectors. It will be critical to have
early engagement and buy-in of all relevant stakeholders.
Third, the interventions and actions proposed through the
implementation of Urban HEART will require intersectoral action
through the close engagement of all relevant sectors. For example,
interventions proposed to address youth violence and crime in the
city will require the support of the local or national law enforcement
departments, such as the police, as well as the education sector and
perhaps community groups that provide after-school programmes.
The challenge of intersectoral action is that it requires excellent
communication, rhetorical and team-building skills; interdisciplinary
knowledge; and fl exibility in administrative and management
arrangements to steer the process for assessing, prioritizing and then
delivering on policy formulation and programme implementation.

World Health Organization 17
B.4.3 Community participationCommunity participation should be a process that involves community
members in all aspects of the intervention process, including planning,
designing, implementing and sustaining the project. It enables
communities to become active participants in decisions concerning
their health, and promotes simultaneous use of community resources.
First, it is important to recognize that social exclusion is a key
determinant of health inequities. Cities and urban areas, in general,
have unequal outcomes and opportunities because some population
groups are systematically excluded from participating in decision-
making processes. For example, gender and ethnicity-related barriers
to participation in decision-making result in unequal access to
resources, capabilities and rights, leading in turn to health inequities.
The Urban HEART process requires remedying this issue and engaging
affected communities strongly both in the identifi cation of issues and
in the development and implementation of actions.
Second, empowering communities to identify priorities using evidence,
and then initiating actions to address these priorities, ensures
sustainability of the broader objective of addressing health inequities
in urban areas. Whereas government structures and leadership are
likely to change over time, a well-informed demand for action from
communities will enable sustained implementation of actions.

18 Urban HEART
C.1 – PLANNING AND IMPLEMENTATION CYCLE C.2 – URBAN HEART USER MANUAL
To ensure feasible, effi cient and sustainable application
of Urban HEART it is important that its implementation is
integrated into the planning cycle of the local governments
or authorities, such as planning and budgeting exercises.
Therefore, the nature of Urban HEART implementation will
be cyclical rather than linear.
C.1 PLANNING AND IMPLEMENTATION CYCLEAlthough policy-making processes can differ depending
on the country or even city context, there are common
underlying aspects. In brief, the policy-making process is
a system – of mechanisms and rules – that allows both
policy formulation (what can be done) and programme
implementation (how to make it work). The outputs of this
system involve actors from various groups (for example
community, lobbies, multiple sectors) who participate in,
infl uence, act upon and impact the policy-making process.
C. PLANNING URBAN HEART

C.1 – PLANNING AND IMPLEMENTATION CYCLE C.2 – URBAN HEART USER MANUAL
Figure 3 presents the cyclical nature of the planning and
implementation of Urban HEART. It ensures consistency
with local governance processes, allows the integration of
the results of the assessment in the local political debate,
facilitates linkages with other sectors, ensures better chances
of infl uencing budget allocation and, most importantly, puts
health equity issues at the heart of the local policy-making
process. It is likely that there are already existing assessments
and interventions ongoing in the cities in which Urban HEART
will be implemented. Urban HEART can complement existing
social and health initiatives by providing an equity lens.
Figure 3 Urban HEART integrated into the local planning cycle
World Health Organization 19
Assessment Response
Programme Policy
Urban HEARTMonitoring
and Evaluation
Defining theproblem
Setting theagenda
Implementingthe programme
Developingpolicy
20 Urban HEART
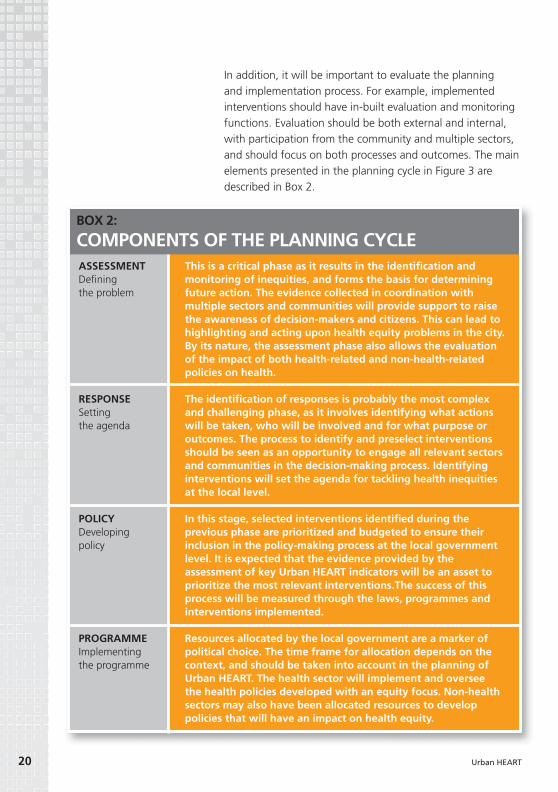
In addition, it will be important to evaluate the planning
and implementation process. For example, implemented
interventions should have in-built evaluation and monitoring
functions. Evaluation should be both external and internal,
with participation from the community and multiple sectors,
and should focus on both processes and outcomes. The main
elements presented in the planning cycle in Figure 3 are
described in Box 2.
This is a critical phase as it results in the identifi cation and monitoring of inequities, and forms the basis for determining future action. The evidence collected in coordination with multiple sectors and communities will provide support to raise the awareness of decision-makers and citizens. This can lead to highlighting and acting upon health equity problems in the city. By its nature, the assessment phase also allows the evaluation of the impact of both health-related and non-health-related policies on health.
The identifi cation of responses is probably the most complex and challenging phase, as it involves identifying what actions will be taken, who will be involved and for what purpose or outcomes. The process to identify and preselect interventions should be seen as an opportunity to engage all relevant sectors and communities in the decision-making process. Identifying interventions will set the agenda for tackling health inequities at the local level.
In this stage, selected interventions identifi ed during the previous phase are prioritized and budgeted to ensure their inclusion in the policy-making process at the local government level. It is expected that the evidence provided by the assessment of key Urban HEART indicators will be an asset to prioritize the most relevant interventions.The success of this process will be measured through the laws, programmes and interventions implemented.
Resources allocated by the local government are a marker of political choice. The time frame for allocation depends on the context, and should be taken into account in the planning of Urban HEART. The health sector will implement and oversee the health policies developed with an equity focus. Non-health sectors may also have been allocated resources to develop policies that will have an impact on health equity.
ASSESSMENTDefi ning the problem
RESPONSESetting the agenda
POLICYDeveloping policy
PROGRAMMEImplementing the programme
BOX 2:
COMPONENTS OF THE PLANNING CYCLE

World Health Organization 21
C.2 URBAN HEART USER MANUALWhile recognizing the critical nature of each component of the
local planning cycle, the tool itself focuses its guidance on the
fi rst two elements presented in Figure 3: (a) assessment, and (b)
response. The steps to be undertaken in developing policy and
implementing the programme phases are likely to be strongly
locally specifi c and, therefore, are beyond the scope of guidance
to be included in this document. However, based on the piloting
experience of cities in 2008–2009, broad steps for implementing
Urban HEART have been identifi ed in cooperation with city
offi cials and communities. These steps are further described for
practitioners in the Urban HEART User Manual.
The Urban HEART User Manual is a companion volume to Urban
HEART. It is for organizations, teams and individuals who will play a
front-line role in launching, coordinating and managing the Urban
HEART process in their home cities. The manual is intended to lead
the Urban HEART team through the steps of the assessment and
response process. It should be used in tandem with Urban HEART
and associated online resources. The manual provides guidance
based on research evidence, best practices and past experience from
cities that have already used Urban HEART. For instance, it includes
guidance for constructing and reading the Urban HEART data
presentation tools: Matrix and Monitor. It also includes a checklist
for each step, to help teams using the tool to decide if they have
met their objectives for that step.
Successful implementation of Urban HEART requires taking the
follow-up steps as indicated in the planning cycle.
• The immediate next step (after “response”) is related to
budgetary and other resource allocation, and passing local laws
and ordinances – where relevant – for the implementation of the
identifi ed actions.
• In the implementation stage it is important to involve all relevant
sectors, especially community groups. While the health sector is
likely to take the lead on health-related interventions, leadership
for implementation of the interventions of other sectors should
be their respective responsibilities.
• Finally, the implementation of the tool and interventions cannot
be complete without an evaluation of the entire process and
outcomes. Implemented interventions should have in-built
monitoring and evaluation functions.

22 Urban HEART
D.1 – INDICATORS D.1.1 – Organization of indicators D.1.2 – Core indicatorsD.2 – DATA PRESENTATION D.2.1 – Urban health equity matrix D.2.2 – Urban health equity monitor D.2.3 – Data quality
D.1 INDICATORSD.1.1 Organization of indicatorsThe assessment component of Urban HEART is an indicator
guide designed to identify differences between various
population groups within the city or across cities using
indicators of key health outcomes, and major social
determinants grouped into four policy domains. Figure 4
shows the organization of indicators in Urban HEART.
D. ASSESSMENT
HEALTH OUTCOMES
Summary indicators
Disease specific mortality/morbidity
SOCIAL DETERMINANTS
OF HEALTH
Physical environmentand infrastructure
Social and humandevelopment
Economics
Governance
Figure 4 Indicator grouping in Urban HEART

World Health Organization 23
D.1 – INDICATORS D.1.1 – Organization of indicators D.1.2 – Core indicatorsD.2 – DATA PRESENTATION D.2.1 – Urban health equity matrix D.2.2 – Urban health equity monitor D.2.3 – Data quality
Health outcome indicators include those that are indicative
of the major outcomes or impacts of multiple factors and
drivers in the performance of the health system and other
sectors associated with the social determinants of health.
Health outcome indicators are further divided into:
• summary indicators, for example infant mortality rate;
• disease-specifi c mortality and morbidity indicators, for example age-standardized diabetes
death rate per 100 000 population.
Social determinants of health have been categorized
according to the following four policy domains:
• Physical environment and infrastructure consists of
indicators related to environmental and physical hazards
associated with living conditions, such as access to
safe water and sanitation services, and environmental
conditions in the neighbourhood, community and
workplace, such as exposure to work-related hazards.
• Social and human development includes determinants
and interactions that infl uence aspects of human
development and issues of social exclusion, such as
access to education and health services, nutrition and
food security, and other social services. Also included
are the obstacles to better health-seeking behaviour and
improved personal lifestyle and health practices associated
with low health literacy.
• The economics domain contains indicators that measure
economic status and barriers to economic opportunities
faced by the population in general or by specifi c
population groups. This domain includes indicators
measuring access to credit and capital, job opportunities,
24 Urban HEART
potential for generating income and other stumbling
blocks to moving out of poverty.
• The governance domain includes aspects related to
people’s rights and political exclusion, such as those
associated with participation in decision-making
processes, and priorities in the allocation of resources to
improve health and its determinants.
Disaggregating each indicator by population group or
geographical area is encouraged to provide specifi c measures
of equity. Depending on the indicator, data could be
disaggregated by population group (sex or age category),
location (neighbourhood or district) or socioeconomic group
(education or income group).
D.1.2 Core indicatorsThe objective of determining core indicators is to provide a
clear direction to local governments on key issues to assess
when tackling health inequities. These core indicators are
recommended to be collected universally for Urban HEART.
The indicators are limited in number but have been selected to
represent a broad picture of the performance of urban health
systems, especially in relation to inequities. They are intended
to ease the process of applying the tool, and to be comparable
across cities and countries. Recognizing the limitations of
relying on a restricted set of indicators, the core indicators are
further complemented with “strongly recommended” and
“optional” indicators that are locally adaptable.
Five key criteria were used for identifying core indicators:
• Availability of data*
• Strength of indicator to measure inequalities*
• Coverage of a broad spectrum of issues
• Comparability and universality of indicator
• Availability of indicator in other key urban and health tools.4
* Based on the experience and recommendations of cities that
pilot-tested Urban HEART, and international experts
Core indicators of Urban HEART should be collected as indicated
in the tool. However, it is reasonable to assume that for other
indicators, cities and countries may prefer the use of proxy

World Health Organization 25
indicators. For example, instead of the indicator “percentage of
households with access to secure tenure (owned or rented)”, it
may be more feasible to use “percentage of owned dwellings”.
This process of adaptation of the tool should be conducted with
the various stakeholders. In addition, cities may consider using
indicators that are locally more relevant.
Figure 5 lists the core indicators of Urban HEART for health
outcomes and the social determinants of health. In Annex 1,
detailed defi nitions of indicators and suggested stratifi ers for
disaggregation are provided. In addition to core indicators,
a list of strongly recommended and optional indicators is
also included to assist implementers of the tool in identifying
other indicators to collect in their equity assessment.
SOCIAL &HUMAN
DEVELOPMENT
Completion of primary education
Skilled birthattendance
Fully immunized
children
Prevalence of tobacco
smoking
PHYSICAL ENVIRONMENT &INFRASTRUCTURE
Access to safe water
Access to improvedsanitation
ECONOMICS
Unemployment
GOVERNANCE
Government spending on health
HEALTH OUTCOMES
Infant mortality Diabetes Tuberculosis Road traffic
injuries
Figure 5 Core indicators
4 Urban Info (UN-Habitat), EURO-URHIS (European Union), Big Cities Health Inventory (National Association of County and CityHealth Offi cials, United States of America), Health Inequities Intervention Tool (London Health Observatory), Urban Audit.

26 Urban HEART
D.2 DATA PRESENTATIONAn important component of conducting a successful
assessment is to achieve stakeholder consensus on the key
results of the assessment. To aid the process of analysis,
Urban HEART recommends organizing the data in simple
visual formats that can enable a broad variety of stakeholders
to identify key equity problems:
• Urban Health Equity Matrix
• Urban Health Equity Monitor
D.2.1 Urban Health Equity MatrixThe Urban Health Equity Matrix is an organization of
indicators in a simplifi ed visual format to inform policy-
makers and key stakeholders on:
• local-level performance, to guide the prioritization of
local and national policies and strategic interventions;
• where to focus national assistance on given specifi c
weaknesses at the local level;
• comparison of performance, between different parts of
a city and between cities.
The Matrix can be applied in the following areas:
• Comparative performance of cities or neighbourhoods within cities. The Matrix summarizes
the performance of cities or urban areas in the different
policy domains, and presents in a simple visual form a
relative comparison of city accomplishments.
• Comparative effectiveness of policies and programmes. The Matrix provides a broad picture
of the effectiveness of policies and programme
interventions as denoted by their indicators.
Figure 6 gives an example of the Matrix where the
performance of neighbourhoods within a city is plotted
against their respective indicators of health determinants.
A similar approach can be applied to health outcome
indicators. The colour codes in each square indicate the level
of accomplishment, with green denoting good performance
and red denoting poor performance (in relation to defi ned
location-specifi c, national or international goals or averages),
while yellow denotes performance below the intended goal
but better than the lower benchmark.

World Health Organization 27
• Columns represent the performance of neighbourhoods
or cities based on the different determinants. For
example, a city or local urban area with many green
squares is performing better than a counterpart scoring
many red squares.
• Rows provide a broad picture of the effectiveness of a
particular policy or programme intervention.
D.2.2 Urban Health Equity MonitorThe Urban Health Equity Monitor is designed primarily
to inform and guide local and national political leaders,
programme managers and technical staff on:
• tracking the performance of health indicators over
time, within or across cities, in relation to specifi c
benchmarks, for example Millennium Development
Goals or national targets;
• determining the trends in the magnitude of inequities in
health indicators within or across cities.
PHYSICAL ENVIRONMENT & INFRASTRUCTURE
SOCIAL & HUMAN DEVELOPMENT
ECONOMICS
GOVERNANCE
INDICATORSPOLICYDOMAIN
NEIGHBOURHOODS
Access to improved sanitation
Access to safe water
#1 #2 #3 #4 #5 #6
Completion of primary education
Skilled birth attendance
Poverty
Unemployment
Voter participation
Government spending on health
Prevalence of tobacco smoking
Figure 6 Urban Health Equity Matrix (illustration for an intra-city health equity assessment)

28 Urban HEART
Based on evidence from the Monitor (illustrated in
Figure 7), key stakeholders should be able to identify which
health indicators need to be addressed critically and which
population groups are specifi cally disadvantaged.
Figure 7 gives an example of the Monitor where the
performance of the best and worst neighbourhoods within
a city is plotted for under-fi ve mortality rate over time. The
Monitor shows the magnitude of inequities between the
best and worst performing neighbourhoods within a city in
comparison to the two benchmarks – urban average and the
Millennium Development Goal target for 2015.5
Un
der
-fiv
e m
ort
alit
y ra
te p
er 1
000
live
bir
ths
80
70
60
50
40
30
20
10
0
1985 1990 1995 2000 2005 2010 2015
Figure 7 Urban Health Equity Monitor (for illustration purposes only)
5 Millennium Development Goal 4: reduce child mortality. Target 5: Reduce by two thirds, between 1990 and 2015, the under-fi ve mortality rate.

World Health Organization 29
Poor-quality data are not appropriate for decision-making. Therefore, it is of utmost importance to continuously assess the quality of data being used. Two key issues to consider are:
1. SELECT THE MOST RELIABLE DATA SOURCES. A key source of available data is routine information systems. While routine systems are useful and mostly reliable, caution must be exercised when interpreting certain data. For example, in some cities data on road traffi c accidents are obtained from the police department. However, it is likely that accidents are underreported to the police department. This can bias the interpretation, which may have implications for whether or not to prioritize the specifi c issue. Also, caution must be applied when comparing data from different sources. For example, immunization rates from Demographic and Health Surveys quite often differ from the offi cial data sources. Therefore, it is extremely important to select the best available data from the most reliable source. Developing an inventory of available data sources will be a useful fi rst step.
2. VALIDATE DATA. While it will be useful to have data experts conduct validity checks, some simple checks can be undertaken by all team members. First, checks can be made to determine whether data are within their specifi ed range. For example, immunization rates are expressed as a percentage and should, therefore, be in the range 0–100. However, in some cases immunization rates of more than 100% have been reported from routine systems. This is likely to be an issue of using an inappropriate denominator. Second, the value of some indicators may be related to that of other indicators. For instance, infant mortality rate cannot be higher than under-fi ve mortality rate. Third, caution should be exercised when considering the denominator size for certain indicators. For example, indicators such as maternal mortality rate require large denominators, as they are relatively rare events. This makes such indicators less useful to calculate for small geographical areas as estimates may vary substantially across years.
BOX 3:
DATA QUALITY
D.2.3 Data qualityIt is important to stress that the effectiveness of the Matrix and
Monitor are dependent upon the quality of the data input. Data
quality needs to be carefully checked before it is presented in
the Matrix and Monitor (Box 3).
30 Urban HEART
E.1 – IDENTIFYING PRIORITIES AND RESPONSE STRATEGIES E.1.1 – Identify equity gaps E.1.2 – Identify relevant response strategiesE.2 – SELECT RELEVANT INTERVENTIONS
E. – RESPONSEIn the response component of Urban HEART interventions
and actions are grouped under fi ve response strategies. These
are not meant to be prescriptive and are intended as a basis
for reviewing how current policies, strategies, programmes
and projects may be improved or what further interventions
would be required to address the equity gaps identifi ed
through the assessment component.
The response strategy packages will guide prioritization and
development of context-specifi c interventions or actions. They
are primarily derived from a qualitative review of case studies and
include best-practice recommendations from WHO and UN-
HABITAT and fi eld experiences from implementing Urban HEART.
E.1 – IDENTIFYING PRIORITIES AND RESPONSE STRATEGIESBefore proceeding to identify an appropriate strategy and
intervention based on the equity assessment, it is important
to note that there is no universal algorithm to identify
the most effective response. Each country has its own
key target areas, setting, funding sources, stakeholders
and other factors that vary by municipality. In considering
an intervention design, policy-makers should also keep
in mind that each city or town has its own advantages
and disadvantages in the politics, resources, fi nance,
infrastructure, geography and many other factors. For each
case, interventions should be adapted to maximize the use of
E. RESPONSE

World Health Organization 31
E.1 – IDENTIFYING PRIORITIES AND RESPONSE STRATEGIES E.1.1 – Identify equity gaps E.1.2 – Identify relevant response strategiesE.2 – SELECT RELEVANT INTERVENTIONS
these advantages. As such, it is crucial that interventions be
customized case by case.
This section is intended as a generic guide on the link between
assessment and response of Urban HEART: how to identify appropriate interventions that can address inequities in urban health based on the results of the assessment.
E.1.1 – Identify equity gapsUrban HEART urges users to determine policies, programmes
and projects that can be introduced, continued, expanded,
improved, changed or stopped to achieve the equity goals.
Based on the assessment, decision-makers can prioritize which
issues to address in counteracting inequity in health and its
determinants. It is important to decide whether a specifi c
issue of poor performance, as indicated in the Matrix, will be
addressed, or the inequalities in performance indicated by the
Monitor and Matrix within or across cities are to be addressed,
or a combination of both. Prioritizing the issues through the
assessment charts should be strategic and thoughtful and can
be done in a number of ways.
There are a variety of ways of analysing the Matrix and Monitor
to identify priorities. It is expected that each Urban HEART team
will deal with the analysis based on their best understanding
of the issues. However, for the purposes of illustration a brief
example has been prepared.6 Figure 8 shows that prevalence of
tobacco smoking is higher than the national average in three
of the six neighbourhoods (in red). At the same time, the other
three neighbourhoods have achieved the desired target level
(in green). If addressing tobacco smoking is a priority for the
communities or the local authorities then it may be one of the
issues the local Urban HEART team members choose to address.
This is just one of the many methods through which the Matrix
6 More examples have been described in the Urban HEART User Manual.

32 Urban HEART
can be analysed to identify priorities. In most cases the team will
be able to identify multiple priorities for action.
Based on the experience of cities that have tested the tool,
all teams preferred to identify priority issues by focusing
on the “red” issues in the Matrix and Monitor. This was
considered to be an easy and attractive method of identifying
priorities. However, a few general principles have also been
recommended based on the pilot experiences:
• Go beyond the colour coding. The colour coding
in the Matrix and Monitor is intended to simplify the
analysis of data. However, it will be useful to examine
the actual numeric values of indicators when deciding
on priority equity gaps.
• Go beyond the “reds”. While it may be tempting to
focus only on the reds in the Matrix it is important to
closely monitor the indicators (or groups) in yellow to
make sure they do not deteriorate and change to red
in the future.
• Bring out the positives. In addition, it is useful to
discuss what is going well and encourage those areas or
groups in green to sustain their good performance for
specifi c indicators, where appropriate.
• Interpret data cautiously. An effi cient interpretation
of data can only be done by involving all relevant
stakeholders in the analysis. Local communities, for
example, may be better placed to understand whether
a certain issue is really a priority in their context.
Further, in some cases an increasing equity gap or
worsening performance may mainly be a result of
better reporting of data. This is not to say that an
increasing equity gap will not be of concern but it
is important to fl ag the issue that data need to be
carefully interpreted while setting priorities.

World Health Organization 33
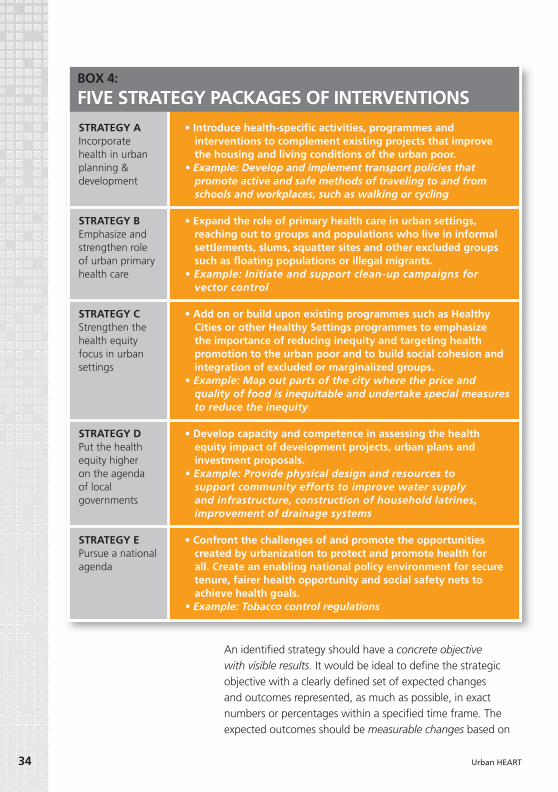
E.1.2 – Identify relevant response strategiesInterventions in Urban HEART have been further
categorized under fi ve response strategies which are
further described in Box 4.7
A. Incorporate health in urban planning and development
B. Emphasize and strengthen the role of urban primary
health care
C. Strengthen the health equity focus in urban settings
D. Put health equity higher on the agenda of local
governments
E. Pursue a national agenda.
The strategy packages have been listed in no particular order
and the sequence must not be viewed as a prioritization. Best-
practice interventions corresponding to different strategies are
listed in the annex of the Urban HEART User Manual.
PHYSICAL ENVIRONMENT & INFRASTRUCTURE
SOCIAL & HUMAN DEVELOPMENT
ECONOMICS
GOVERNANCE
INDICATORSPOLICYDOMAIN
NEIGHBOURHOODS
Access to improved sanitation
Access to safe water
#1 #2 #3 #4 #5 #6
Completion of primary education
Skilled birth attendance
Poverty
Unemployment
Voter participation
Government spending on health
Prevalence of tobacco smoking
7 The interventions are listed in the annex of the Urban HEART User Manual.
Figure 8 Select an issue considered a priority by communities and the government using the
assessment results (for illustration purposes only)
34 Urban HEART
An identifi ed strategy should have a concrete objective with visible results. It would be ideal to defi ne the strategic
objective with a clearly defi ned set of expected changes
and outcomes represented, as much as possible, in exact
numbers or percentages within a specifi ed time frame. The
expected outcomes should be measurable changes based on
• Introduce health-specifi c activities, programmes and interventions to complement existing projects that improve the housing and living conditions of the urban poor.
• Example: Develop and implement transport policies that promote active and safe methods of traveling to and from schools and workplaces, such as walking or cycling
• Expand the role of primary health care in urban settings, reaching out to groups and populations who live in informal settlements, slums, squatter sites and other excluded groups such as fl oating populations or illegal migrants.
• Example: Initiate and support clean-up campaigns for vector control
• Add on or build upon existing programmes such as Healthy Cities or other Healthy Settings programmes to emphasize the importance of reducing inequity and targeting health promotion to the urban poor and to build social cohesion and integration of excluded or marginalized groups.
• Example: Map out parts of the city where the price and quality of food is inequitable and undertake special measures to reduce the inequity
• Develop capacity and competence in assessing the health equity impact of development projects, urban plans and investment proposals.
• Example: Provide physical design and resources to support community efforts to improve water supply and infrastructure, construction of household latrines, improvement of drainage systems
• Confront the challenges of and promote the opportunities created by urbanization to protect and promote health for all. Create an enabling national policy environment for secure tenure, fairer health opportunity and social safety nets to achieve health goals.
• Example: Tobacco control regulations
STRATEGY AIncorporate health in urban planning & development
STRATEGY BEmphasize and strengthen role of urban primary health care
STRATEGY CStrengthen the health equity focus in urban settings
STRATEGY DPut the health equity higher on the agenda of local governments
STRATEGY EPursue a national agenda
BOX 4:
FIVE STRATEGY PACKAGES OF INTERVENTIONS

World Health Organization 35
the indicators used in the Matrix or Monitor of the assessment
component. This will include both the expected changes in the
social determinants of health and the expected resulting effect
on health. The measurements will give a tangible gauge of the
progress and achievements of the intervention.
In setting the time frame, it is crucial to consider the reality of
the problem at hand within the politics and policy context of the
city, including the timing for securing the budget and the timing
for obtaining approvals from all necessary parties, as well as the
sustainability of the programme in terms of resources and political
support within the set time frame. The planning cycle of the local
or national government is a key input to the time frame.
In development of the strategic objective, it is also crucial that
all key stakeholders are involved and agree on the specifi cations.
The emphasis on the value of a shared vision and urgency of
collaboration will bring cohesion to the project, as each sector
has its own individual interests. Although the ultimate common
goal is to reduce inequities in health, identifying other common
themes between the health sector’s objectives and other sectors’
objectives as an overarching, whole-of-government goal will
create links to a successful intersectoral action for health (1,2).
EXAMPLEIf tobacco smoking was identifi ed as one of the priority issues
to address, Urban HEART implementers would then need to
identify which strategies to apply, taking particular account of
areas where inequity may exist. For example, the targeting of
tobacco advertising at vulnerable groups such as adolescents,
or failure of certain workplaces to enforce smoking bans. Based
on these strategies appropriate interventions could be identifi ed.
Figure 9 provides an indication of how teams can identify a set
of interventions once they have managed to prioritize issues. The
fi rst step would be to map the indicator(s) back to their policy
domain(s), then refer to the intervention packages for that domain
categorized by the fi ve response strategies (available in the annex
of the Urban HEART User Manual). The strategies should be based
on a clearly defi ned strategic objective. In order to identify the
best-suited intervention method through intersectoral action,
brainstorming sessions with all the sectors and communities
involved are recommended. This will allow identifi cation of the

36 Urban HEART
capacity and available resources of each sector (for example
fi nance), tools and mechanisms, and human resources.
Further, while identifying groups of action, decision-makers
should also assess possible linkages with similar programmes of interest that are already existing or ongoing. This may prevent
duplication of efforts, minimize costs and encourage collaboration
with other stakeholders. It will also be much easier than to
start from scratch, as the organizational structure and funding
are already in place. Community participation is also a key to
identifying appropriate interventions and achieving successful
outcomes from the programme. For example, by engaging
the community in focus group discussions for identifying key
interventions, a solid communication and understanding with the
community regarding priorities can be ensured.
E.2 – SELECT RELEVANT INTERVENTIONSIt is crucial to implement cost-effective interventions with
appropriate technologies and available resources. Therefore, a fi nal
selection of interventions should be prioritized according to the
importance and changeability of the target issue, and determined
by fi nance, time allowed, human resources and dynamics of
existing programmes and the circumstances of the problem
identifi ed. To prioritize interventions, six criteria are suggested:
Prevalence of tobacco smoking
Policy domain 2:Social and human
development
Strategy A
Strategy B
Strategy C
Strategy D
Strategy E
E.g. support quitlines and other community initiatives in conjunction with easily accessible, low-cost pharmacological treatment
E.g. ban smoking in public places, especially enclosed spaces
E.g. develop an urban focus for adaptation of the Framework Convention on Tobacco Control and provide resources and support for local implementation
E.g. work with key community opinion leaders to change perceptions of tobacco’s acceptability
Example of prioritized issue
Figure 9 Identifying strategies and interventions (illustration based on addressing tobacco
smoking as a priority)

World Health Organization 37
In selecting a feasible intervention, transparency in
communication with the stakeholders will lead to the right
selection. Only with a true, honest assessment of available
resources and priorities among sectors can the policy-makers
select feasible and appropriate interventions. Further, the
criteria suggested should be applied in a stringent manner so
that the team is able to discern whether or not an intervention
is feasible. Local communities should have a strong role in
identifying priorities for action. The identifi cation of feasible
interventions using the criteria provided in Urban HEART
results in achieving a core objective. However, the next phases
– policy, programme, and monitoring and evaluation – are
critical in ensuring the desired cyclical nature of the tool, and
for sustained action on health inequities.
• Will the intervention address the gaps in health determinants and outcomes?
• Does it address the target as outlined in the strategic objective’s expected outcomes?
• Will there be any unintended adverse outcomes as a result of the intervention?
• Is there commitment from other sectors and stakeholders regarding resources?
• Does the intervention require more than the current collected resources?
• Has accountability been set for each party involved?
• Is the intervention culturally sensitive?• Have the community members shared their views on
the priority of needs and appropriate interventions?
• Given available resources (fi nancial, human, organizational), can the intervention be implemented within a time frame that will be socially, politically and economically acceptable?
• Is the intervention proven to be of minimal cost for the maximum effect on health inequities?
• Is it proven to be cost-effective or is it shown through outcome evaluation studies to be of proven or promising effectiveness?
• Is the intervention’s goal aligned with the local or national political agenda?
• Is there political support from the local government?
REDUCES HEALTH INEQUITIES
AVAILABLE LOCAL RESOURCE
ACCEPTABLE BY AFFECTED COMMUNITIES/OTHER KEY PLAYERS
ACHIEVABLE WITHIN TIME FRAME
LIKELY TO BE EFFECTIVE & EFFICIENT
COMPLIES WITH LOCAL/NATIONAL PRIORITIES

38 Urban HEART
The focus of Urban HEART is to provide guidance on the
assessment and response components of the planning
cycle. In addition, Urban HEART is primarily a tool to
enhance current interventions, with the intention that it is
mainstreamed and integrated in national and local health
planning and programme implementation.
Policy development and programme implementation are
complex processes and providing guidance is beyond
the scope of the tool. However, given their critical role in
ensuring successful and sustained implementation of Urban
HEART, a brief reference is once again made here. In the
policy development phase, selected interventions identifi ed
during the response phase are budgeted and prioritized to
ensure their inclusion in the policy-making process at the
local government level. Programme implementation ensures
the application of policy to practice through various levels of
administrative and political bodies. Though Urban HEART is
not an implementation tool, it is expected at this stage that
the health unit in charge will implement and oversee the
health policies developed with an equity focus. Non-health
sectors may also at this stage have been allocated resources
to develop policies that will have an impact on health equity.
What has been described and illustrated are indications on
how the implementation should be managed. However,
there are many ways to manage such processes, and each
institutional arrangement with its own framework will
infl uence the process accordingly.
F. CONCLUSION
Urban HEARTUrban Health Equity Assessment and Response Tool

World Health Organization 39
A support system of political will and fi nancial commitment
is crucial to the monitoring and evaluation function and the
overall sustainability of the intervention. It will be important to
evaluate the planning and implementation process. Implemented
interventions should have in-built evaluation and monitoring
functions. Evaluation should be both external and internal, with
participation from the community and focus on both processes
and outcomes. Further, the local government and communities
should aim to establish the systems and capacity to ensure that
disaggregated data become available over time, even though
they may not be available initially.
The effi ciency of Urban HEART is derived from the fact that it is
feasible to implement within existing institutional frameworks.
Its uniqueness lies in its focus on addressing health inequities in
cities. Further, it provides a platform for intersectoral dialogue and
policy-making. As such, Urban HEART should not be seen as an
analytical tool disconnected from the policy-making process at the
local level. Though the supervision and lead of Urban HEART is the
responsibility of the health sector, it is important from the start to
involve essential stakeholders who will help identify the problems
that require action to be taken at the local level.
It is likely that there are already existing assessments and
interventions ongoing in the cities in which Urban HEART will be
implemented. Urban HEART can complement existing social and
health initiatives by providing an equity lens. The tool provides
an assessment of the steps and processes to promote or add
an equity perspective to existing processes and a link to the
relevant interventions. It is strongly encouraged to embody the
Urban HEART planning and implementation process into the
local policy-making process. Through the pilot-testing process,
a number of cities across the world have already demonstrated
how Urban HEART can be used to assist local communities and
governments, both local and national, to proactively tackle
health inequities.

40 Urban HEART
ANNEX 1. URBAN HEART INDICATORS
# HEALTH CARE OUTCOME
CORE INDICATOR DEFINITION RECOMMENDED
DISAGGREGATION BY:
1. Summary indicator Infant mortality The number of infant deaths between birth and exactly one year of age,
expressed as a rate per 1000 live births8
Sex, income level, mother’s education, local area
2. Disease-specifi c indicator
Diabetes Diabetes prevalence and death rates per 100 000 population (age-standardized)9
Sex, income level, education, local area
3. Disease-specifi c indicator
Tuberculosis A. Proportion of tuberculosis cases detected and cured under directly
observed treatment, short course (DOTS)10 B. Prevalence and death rates associated
with tuberculosis11
Sex, income level, education, local area
4. Disease-specifi c indicator
Road traffi c injuries
Road traffi c death rate per100 000 population (5)
Sex, age groups, income level, education, local area
CORE INDICATOR LIST
NOTE: A detailed description of each indicator in Annex 1 is provided in the Urban HEART User Manual.
# POLICY DOMAIN CORE INDICATOR DEFINITION RECOMMENDED
DISAGGREGATION BY:
1. Physical environment and infrastructure
Access to safe water
Percentage of population with sustainable access to an improved water source12
Income level, education, local area
2. Physical environment and infrastructure
Access to improved sanitation
Percentage of population with access to improved sanitation13
Income level, education, local area
3. Social and human development
Completion of primary education
Completion of primary education, expressed as a percentage14
Sex, income level, local area
4. Social and human development
Skilled birth attendance
Proportion of births attended by skilled health personnel15
Income level, education, local area
5. Social and human development
Fully immunized
children
Percentage of fully immunized children16 Income level, education, local area
6. Social and human development
Prevalence of tobacco smoking
Percentage of population who currently smoke cigarettes and other forms of
tobacco products
Sex, age group, income level, education, local area
7 Economics Unemployment Percentage of population who are currently unemployed17
Sex, age group,education, local area
8. Governance Government spending on
health
Percentage of local government spending allocated to health
Local area
Table 1.B Core indicators: health determinants
Table 1.A Core indicators: health care outcomes

World Health Organization 41
# INDICATOR DEFINITION RECOMMENDED DISAGGREGATION BY:
SUMMARY INDICATORS
1. Under-fi ve mortality rate
The number of child deaths between birth and exactly fi ve years of age, expressed as a rate per 1000 live births18
Sex, age group, income level, education, local area
2. Maternal mortality ratio
The number of maternal deaths19 per 100 000 live births, during a specifi ed time period, usually one year20
Local area
3. Life expectancy at birth
The number of years a newborn infant would live if prevailing patterns of age-specifi c mortality rates at the time
of birth were to stay the same throughout the child’s life
Sex, income level, education, local area
DISEASE-SPECIFIC INDICATORS (MORBIDITY/MORTALITY RATES)
4. A. All cancerB. Cardiovascular
diseaseC. Respiratory
diseasesD. HIV and AIDSE. Homicide rateF. Mental illness
Age-standardized morbidity/mortality rates to be expressed per 100 000 population over a certain period of time. For
example, cardiovascular disease mortality rate per 100 000 population in the last year21
Sex, age groups, income level, education, local area
Table 2 Strongly recommended indicators: health care outcomes
# INDICATOR DEFINITION RECOMMENDED DISAGGREGATION BY:
1. Households served by municipal solid
waste management system
Percentage of households served by municipal solid waste management system
Income level, education,local area
2. Solid fuels Percentage of households using solid fuels22 Sex, income level, education, local area
3. Work-related injuries Incidence rate of work-related injuries or diseases: fatal or non-fatal, per 100 000 working population
Sex, income level, education, local area
Table 3 Strongly recommended indicators: physical environment and infrastructure

42 Urban HEART
# INDICATOR DEFINITION RECOMMENDED DISAGGREGATION BY:
1. Literacy The proportion of the adult population aged 15 years and older that is literate, expressed as a percentage of the
corresponding population
Sex, income level, local area
2. Underweight children
Prevalence of underweight children23 under fi ve years of age Sex, income level, mother’s education, local area
3. Overweight and obesity
Prevalence of overweight and obesity24 in the population Sex, age group, income level, education, local area
4. Breastfeeding Infants exclusively breastfed for six months Income level, mother’s education, local area
5. Teenage pregnancy Prevalence of teenage pregnancies Sex, age group, income level, education, local area
6. Physical activity Percentage of people with low levels of physical activity (< 600 MET minimum per week)25
Breastfeeding
# INDICATOR DEFINITION RECOMMENDED DISAGGREGATION BY:
1. Poverty Percentage of population living below the nationally determined poverty line26
Sex, education, local area
2. Women in workforce Participation of women in the workforce, expressed as a percentage27
Income level, education, local area
3. Secure tenure Percentage of households with access to secure tenure (owned or rented)28
Sex, age group, income level, education, local area
8 Millennium Development Goal indicator 14 [infant mortality rate].9 Caution must be exercised when reporting “notifi cation” rates
as opposed to “prevalence” rates.10 Millennium Development Goal indicator 24.11 Millennium Development Goal indicator 23.12 Millennium Development Goal indicator 30; improved water
sources include piped water, public tap, borehole or pump, protected well, protected spring or rainwater (UN-Habitat, urban indicator guidelines).
13 Millennium Development Goal indicator 31; improved sanitation sources include sewers or septic tanks, pour-fl ush latrines and ventilated improved pit latrines, provided they are not public (UN-Habitat, urban indicator guidelines).
14 Primary completion measured by the gross intake ratio to last grade of primary education is the total number of new entrants in the last grade of primary education (according to the International Standard Classifi cation of Education or ISCED-97), regardless of age, expressed as a percentage of the total population of the theoretical entrance age to the last grade of primary.
15 Millennium Development Goal indicator 17; skilled health personnel include doctors, nurses and trained midwives.
Traditional midwives are not included in this category (WHO).16 A fully immunized child is one who has received doses of the
“standard eight” antigens – BCG, DTP (3 doses), polio (3 doses), and measles vaccines – by one year of age, and the administration of each dose was valid (WHO).
17 The “unemployed” comprise all persons above a specifi ed age who during the reference period were (a) “without work”, i.e. were not in paid employment or self-employment; (b) “currently available for work”, i.e. were available for paid employment or self-employment; and (c) “seeking work”, i.e. had taken specifi c steps to seek paid employment or self-employment (6).
18 Millennium Development Goal indicator 13.19 Maternal death is defi ned as the death of a woman while
pregnant or within the 42 days after termination of that pregnancy, regardless of the length and site of the pregnancy, due to any cause related to or aggravated by the pregnancy itself or its care, but not due to accidental or incidental causes (WHO).
20 Millennium Development Goal indicator 16.21 Users should be careful in identifying the differences between
notifi cation and morbidity rates.22 Millennium Development Goal indicator 29.
Table 4 Strongly recommended indicators: social and human development
Table 5 Strongly recommended indicators: economics

World Health Organization 43
# INDICATOR DEFINITION RECOMMENDED DISAGGREGATION BY:
1. Voter participation Percentage of eligible voters who voted in the most recent local/national elections
Sex, age group, local area
2. Insurance coverage Percentage of population covered by any insurance29 Sex, income level, education, local area
# POLICY DOMAIN INDICATOR DEFINITION RECOMMENDED DISAGGREGATION BY:
1. Physical environment and
infrastructure
Alcohol outlets Number of alcohol outlets per 100 000 population
Income level, education, local area
2. Physical environment and
infrastructure
Green spaces Proportion of land area covered by green spaces30 (including parks, playing fi elds,
other open spaces)
Local area
3. Social and human development
Domestic violence
Prevalence rate of domestic violence against women and/or children
Income level, education, local area
4. Social and human development
Low birthweight
Percentage of liveborn infants who weigh less than 2500 grams (8), for a given time
period
Sex of child, income level, education, local area
5. Economics Slum population
Proportion of urban population living in slum households31
Income level, education, local area
6. Economics Informal employment
Percentage of working population in informal employment32
Income level, education, local area
7. Governance Government spending on education
Percentage of local government budget allocated to education
Local area
23 Millennium Development Goal indicator 4; includes moderate underweight (defi ned as 2–3 standard deviations below the median weight-for-age of the reference population), and severe underweight (defi ned as more than 3 standard deviations below the median).
24 Obesity is commonly defi ned as a body mass index (BMI) of 30 kg/m2 or higher. Overweight is defi ned as a BMI of 25–30 kg/m2.
25 MET = metabolic equivalent: one MET is defi ned as 1 kcal/kg/h and is equivalent to the energy cost of sitting quietly. A MET is also defi ned as oxygen uptake in ml/kg/min with one MET equal to the oxygen cost of sitting quietly, around 3.5 ml/kg/min (7).
26 Millennium Development Goal indicator 1 “Proportion of population below $1 (PPP) per day” was the originally proposed indicator. However, based on the recommendations of the pilot sites, the nationally determined poverty line was considered more appropriate.
27 This is similar but not identical to Millennium Development Goal indicator 11 “Share of women in wage employment in the non-agricultural sector”. Given the low contribution of agriculture to the economic output of an urban area, in general, it was not considered necessary to differentiate by sectors.
28 Secure tenure is “the right of all individuals and groups to effective protection by the State against unlawful evictions” (UN-Habitat): Millennium Development Goal indicator 32.
29 Insurance includes all social, private and community-based insurance schemes.
30 The Centers for Disease Control (United States) defi nes a green space as “open, undeveloped land with natural vegetation”. This excludes domestic gardens and areas of green space less than 5 m2.
31 A slum household is defi ned as a group of individuals living under the same roof lacking one or more of the following conditions: access to improved water, access to improved sanitation, suffi cient living area, durability of housing, and security of tenure. This indicator is linked to Millennium Development Goal 7.
32 “Informal employment” comprises the total number of informal jobs as defi ned by the International Labour Organization, whether carried out in formal or informal sector enterprises, or households, during a given reference period (for full list of informal jobs defi ned by ILO see Urban HEART User Manual annex).
Table 6 Strongly recommended indicators: governance
Table 7 Optional indicators
HEALTH (EQUITY) IN URBAN SETTINGS• Knowledge Network on Urban Settings. Our cities,
our health, our future: acting on social determinants of health equity in urban settings. Report to the WHO Commission on Social Determinants of Health. Geneva, World Health Organization, 2008 (http://www.who.or.jp/knusp/KNUS_fi nal_report.pdf, accessed 30 January 2010).
• Harpham T. Urban health in developing countries: what do we know and where do we go? Health and Place, 2009, 15:107–116.
SOCIAL DETERMINANTS OF HEALTH• Closing the gap in a generation: health equity
through action on the social determinants of health. Final Report of the Commission on Social Determinants of Health. Geneva, World Health Organization, 2008 (http://www.who.int/social_determinants/thecommission/fi nalreport/en/index.html, accessed 30 January 2010).
TACKLING SOCIAL INEQUITIES IN HEALTH• Bambra C et al. Tackling the wider social determinants
of health and health inequalities: evidence from
systematic reviews. Journal of Epidemiology and Community Health, 2009 (http://dx.doi.org/10.1136/jech.2008.082743, accessed 22 January 2010).
• Whitehead M, Dahlgren G. Levelling up (part 1): concepts and principles for tackling social inequities in health. Copenhagen, WHO Regional Offi ce for Europe, 2006.
THE STATE OF THE WORLD’S CITIES• United Nations Human Settlements Programme
(UN-Habitat). The state of the world’s cities 2008/09: harmonious cities. Nairobi, UN-Habitat, 2008 (http://www.unhabitat.org/pmss/listItemDetails.aspx?publicationID=2562, accessed 30 January 2010).
HEALTH INDICATORS• The good indicators guide: understanding how to
use and choose indicators. Coventry, NHS Institute for Innovation and Improvement, 2008 (http://www.apho.org.uk/resource/item.aspx?RID=44584, accessed 30 January 2010).
WORLD HEALTH STATISTICS• World health statistics 2009. Geneva, World Health
Organization, 2009 (http://www.who.int/whosis/whostat/2009/en/index.html, accessed 30 January 2010).
44 Urban HEART
ANNEX 2. REFERENCES & USEFUL SOURCESREFERENCES1. Knowledge Network on Urban Settings. Our cities,
our health, our future: acting on social determinants of health equity in urban settings. Report to the WHO Commission on Social Determinants of Health. Geneva, World Health Organization, 2008 (http://www.who.or.jp/knusp/KNUS_fi nal_report.pdf, accessed 30 January 2010).
2. Whitehead M, Dahlgren G. Levelling up (part 1): concepts and principles for tackling social inequities in health. Copenhagen, WHO Regional Offi ce for Europe, 2006.
3. Closing the gap in a generation: health equity through action on the social determinants of health. Final Report of the Commission on Social Determinants of Health. Geneva, World Health Organization, 2008 (http://www.who.int/social_determinants/thecommission/fi nalreport/en/index.html, accessed 30 January 2010).
4. Reducing health inequities through action on the social determinants of health. World Health Assembly Resolution WHA62.14. Geneva, World Health Organization, 2009. (http://apps.who.int/gb/ebwha/pdf_
fi les/A62/A62_R14-en.pdf, accessed 30 January 2010).5. Global status report on road safety. Geneva, World
Health Organization, 2009.6. Hussmanns R. Measurement of employment,
unemployment and underemployment: current international standards and issues in their application. International Labour Organization, Bureau of Statistics (http://www.ilo.org/wcmsp5/groups/public/---dgreports/---integration/---stat/documents/publication/wcms_088394.pdf, accessed 19 January 2010).
7. A framework to monitor and evaluate the implementation: global strategy on diet, physical activity and health. Geneva, World Health Organization, 2008 (http://www.who.int/dietphysicalactivity/DPASindicators/en/index.html, accessed 19 January 2010).
8. Low birthweight: country, regional and global estimates. World Health Organization, 2004 (http://www.who.int/reproductivehealth/publications/monitoring/9280638327/en/index.html, accessed 19 January 2010).
USEFUL SOURCES

Urban HEART aids decision-makers in planning action on inequities in health. The tool guides users through a process to identify health inequities in their city by assessing indicators on health outcomes and health determinants, and then developing actions based on the evidence generated.
ISBN 978 92 4 150014 2
U
rba
n H
EA
RT