
Urban Effects on the Precipitation of Benin, Nigeria
14
American Journal of Climate Change, 2014, 3, 8-21 Published Online March 2014 in SciRes. http://www.scirp.org/journal/ajcc http://dx.doi.org/10.4236/ajcc.2014.31002 How to cite this paper: Efe, S.I. and Eyefia, A.O. (2014) Urban Effects on the Precipitation of Benin, Nigeria. American Jour- nal of Climate Change, 3, 8-21. http://dx.doi.org/10.4236/ajcc.2014.31002 Urban Effects on the Precipitation of Benin, Nigeria S. I. Efe 1 , A. O. Eyefia 2 Department of Geography and Regional Planning Delta State University, Abraka, Nigeria Email: [email protected] , [email protected] Received 21 October 2013; revised 23 November 2013; accepted 22 December 2013 Copyright © 2014 by authors and Scientific Research Publishing Inc. This work is licensed under the Creative Commons Attribution International License (CC BY). http://creativecommons.org/licenses/by/4.0/ Abstract This study is designed to examine the urban effects on the precipitation of Benin City, Edo State, Nigeria. This was to ascertain the differences within urban precipitation and urban-rural differ- ences in precipitation. The study adopted a survey design in which data used for this study were generated from direct field measurement of precipitation for the period of one year. A total of 25 rain gauges were established in the various landuse types in existence in the city in line with the World Meteorological Organization (WMO) standard for the collection of the precipitation amounts. Thirty-one years’ archival precipitation data were also extracted from the archive of the Nigerian Meteorological Agency Benin and Nigeria Institute of Oil Palm Research (NIFOR). Analy- sis of variance (ANOVA), paired t-test and trend analysis were used in this study. The result showed 2541 mm mean annual precipitation with 43% increase in precipitation in urban area over the country sides. Precipitation amounts differ significantly within the urban canopy from the high density areas to the natural parks. Rainfall in all months with double precipitation maxima is in the months of July and September, indicating the presence of August hiatus in the city, and it also showed that Fridays and Sundays are the wettest and driest days of the weeks. The study revealed that the precipitation of Benin-City is strong and heavy with 2311 mm and 2541 mm which has strong implications on hydrological cycle, properties and social-economic activities of the dwellers. It is therefore recommended that program on urban climatology should be initi- ated soon by the state and federal government of Nigeria. Keywords Precipitation; Urban Area; Rural Areas; Benin City 1. Introduction Urban climate is the climate of an urbanized area/cities or area of the world with population of 20,000 and above
-
Upload
hoangduong -
Category
Documents
-
view
226 -
download
0
Transcript of Urban Effects on the Precipitation of Benin, Nigeria

American Journal of Climate Change, 2014, 3, 8-21 Published Online March 2014 in SciRes. http://www.scirp.org/journal/ajcc http://dx.doi.org/10.4236/ajcc.2014.31002
How to cite this paper: Efe, S.I. and Eyefia, A.O. (2014) Urban Effects on the Precipitation of Benin, Nigeria. American Jour-nal of Climate Change, 3, 8-21. http://dx.doi.org/10.4236/ajcc.2014.31002
Urban Effects on the Precipitation of Benin, Nigeria S. I. Efe1, A. O. Eyefia2 Department of Geography and Regional Planning Delta State University, Abraka, Nigeria Email: [email protected], [email protected] Received 21 October 2013; revised 23 November 2013; accepted 22 December 2013
Copyright © 2014 by authors and Scientific Research Publishing Inc. This work is licensed under the Creative Commons Attribution International License (CC BY). http://creativecommons.org/licenses/by/4.0/
Abstract This study is designed to examine the urban effects on the precipitation of Benin City, Edo State, Nigeria. This was to ascertain the differences within urban precipitation and urban-rural differ-ences in precipitation. The study adopted a survey design in which data used for this study were generated from direct field measurement of precipitation for the period of one year. A total of 25 rain gauges were established in the various landuse types in existence in the city in line with the World Meteorological Organization (WMO) standard for the collection of the precipitation amounts. Thirty-one years’ archival precipitation data were also extracted from the archive of the Nigerian Meteorological Agency Benin and Nigeria Institute of Oil Palm Research (NIFOR). Analy-sis of variance (ANOVA), paired t-test and trend analysis were used in this study. The result showed 2541 mm mean annual precipitation with 43% increase in precipitation in urban area over the country sides. Precipitation amounts differ significantly within the urban canopy from the high density areas to the natural parks. Rainfall in all months with double precipitation maxima is in the months of July and September, indicating the presence of August hiatus in the city, and it also showed that Fridays and Sundays are the wettest and driest days of the weeks. The study revealed that the precipitation of Benin-City is strong and heavy with 2311 mm and 2541 mm which has strong implications on hydrological cycle, properties and social-economic activities of the dwellers. It is therefore recommended that program on urban climatology should be initi-ated soon by the state and federal government of Nigeria.
Keywords Precipitation; Urban Area; Rural Areas; Benin City
1. Introduction Urban climate is the climate of an urbanized area/cities or area of the world with population of 20,000 and above

S. I. Efe, A. O. Eyefia
9
[1]. In urban climate studies, there are lots of studies that have confirmed urban heat island (that is increasing in temperature of cities over its countryside’s) (See [2]-[21]). These studies have demonstrated that urban devel-opment causes a rise in local surface temperature [22] [23]. However, urban atmospheric effects on local pre-cipitation, airflow, subsurface and rainwater quality are less clearly established [1]. Studies on urban effects on the precipitation are challenging one [1] [24].
According to these scholars, precipitation process is affected by various factors; it is rather difficult to clearly detect urban effects on the precipitation either in observation or in numerical simulation which can change de-pending on the situation [24]. Second, the establishment of precipitation stations within the built-up area of cit-ies without frequent interference from the inhabitants, most especially children, is another difficulty [1]. But de-spite these problems, attempts have been made to established the effect of urbanization on its precipitation in some cities of the world (See [1] [25] [33]). In these investigations, though there were divergent view points, it was discovered that both the number of precipitation amount/days and the intensity of precipitation have in-creased due to urbanization. However, the impact of urbanization on precipitation varies with time and area [1] [33]. Others however showed divergent viewpoints (See [34]-[36]).
[34] presented statistical evidence from four Houston area precipitation-recording stations that the 24-h 100-yr storm depth had increased by 15% in suburban areas when compared with the 24-h 100-yr storm depth published in 1961 by the National Weather Service. They are of the view that the change is linked to heavy ur-ban development in Houston, which covers an area of 937 km2. [35] investigated the effect of urbanization on the regional climate change in four big cities in Turkey. They found no relationship between annual precipitation and urbanization. Hence, they argued that the cities are not big enough to affect the precipitation trend. In the same vein, [36] investigated the influence of urbanization on precipitation in the Marmara region and found that there was an increase in the number of precipitation days because of the increase in the number of condensation nuclei in the cities. He further observed that the number of heavy precipitation days (>30 mm·day−1) decreased. He explained this decrease as a result of the fact that the number of the precipitation days decreases, the water vapour falls down more often, and that its concentration in the atmosphere does not reach to a point that is enough to feed heavy rain. The Metropolitan Meteorological Experiment (METROMEX) was an extensive study that took place in the 1970s in the United States [37]. [38] showed that there is the need to further investi-gate the modification of mesoscale and conceptive precipitation by major cities. In general, the results from METROMEX have showed that urban effects leading to increased precipitation during the summer months was typically observed within and downwind 50 - 75 km of the city reflecting increases of 5% - 25% over back-ground values [29] [39] [41].
More studies have continued to validate and extend the findings from pre METROMEX and post METROMEX investigations [30] [31] [42]-[47]. After a hiatus in research in the last few years, there has been resurgence in stu- dies of urban effects on precipitation, clouds and storms. This has been driven in part by new technologies; for example, the application of data from the Tropical Precipitation Measuring Mission (TRMM) satellite’s precipi-tation radar [47]-[49] and Doppler radar [50]. Such technologies allow precipitation, which can be highly variable spatially, to be more easily quantified, though ground-based rain gauges still remain the absolute reference point.
[51] confirmed previous understanding that urbanization has an effect on precipitation through increases in hygroscopic nuclei, turbulence via surface roughness, convection because of changes in the urban heat budget, convergent wind flow over the urban area which may lead to rain producing clouds, and the addition of water vapour from combustion from anthropogenic sources. In the same vein, in his studies of urban effects on pre-cipitation and rainwater quality in Warri metropolis, [1] confirmed that precipitation in the urban area is 18.5% higher than that in the rural areas. With the exception of [1], these studies are concentrated in cities of developed nations to the neglect of tropical African cities [1]. Based on this neglect, the US weather research panel report [52] called for more observational and modelling work in other cities of the world because previous results were heavily based on a few specific cities and statistical inferences. [1] also called for more studies in Nigeria and African cities to aid comparison. Thus this study is one of the responses to these calls, and it is aimed at exam-ining urban effects on precipitation of Benin City Nigeria.
2. Conceptual Issues Adopted This study is based on the concept of urban precipitation. Urban precipitation is the occurrence of increased pre-cipitation in urban area/cities as a result of urbanization processes and anthropogenic activities of man in that
S. I. Efe, A. O. Eyefia
10
urban area [1] [31]-[33]. The presence of condensation nuclei over urban landscapes can lead to cities been wet-ter and having more precipitation amount and rainy days than the surrounding rural areas. According to the Na-tional Meteorological Library and Archive’s online catalogue they opined however that, other factors play a major role, especially the heat islands which enhance convectional uplift, and the strong thermal heat that are generated during the summer months may serve to generate or intensity thunderstorms over or downwind of ur-ban areas. They also stressed further that storms cells’ passing over cites can be “refueled” by contact with the warm surface and the addition of hygroscopic particles which can lead to enhanced precipitation, that usually occurs downwind of the urban area [53]. [54] summarized the probable effects of cities on precipitation under three main headings, such as the mechanic turbulence caused by the increasing surface roughness, additional sensible heat caused by urban heat islands, and plenty of condensation nuclei in the atmosphere of cities. [55] found that this increase tends to be greater in summer than in the winter and is more likely to result from the in-tensification, not the initialization of the precipitation process. Urban climate, including urban precipitation, has important implications for the residents of urban areas, urban areas have been found to influence many attributes of urban precipitations both increases and decreases in precipitation have been observed, as well as variation in the location of influence. However, more commonly there is an increase that occurs over the city and downwind of the city, with possible effects up to 80 km downwind [55] [56]. [57] indicated that human activities produce a great number of particles, condensation nuclei, in and around cities. This fact contributed greatly to the in-creased dampness and precipitation noted over cities. In many cases the prevailing wind causes the maximum precipitation area to be moved downwind of the city centre or industrial regions. In some cites there is an appre-ciable increase in amount of precipitation of 5 - 10 percent. Early investigations [58]-[60], found evidence of warm seasonal precipitation increase of 9% - 17% over and downwind of major cities.
[35] Investigated the effect of urbanization on the regional climate change in four big cities in Turkey. They found no relationship between annual precipitation and urbanization. Hence, they argued that the cities are not big enough to affect the precipitation trend. In the same vein, [36] investigated the influence of urbanization on precipitation in the Marmara region and found that there was an increase in the number of precipitation days because of the increase in the number of condensation nuclei in the cities. He further observed that the number of heavy precipitation days (>30 mm·day−1) decreased. He explained this decrease as a result of the fact that the number of the precipitation days, the water vapour falls down more often, and its concentration in the atmos-phere does not reach to a point that is enough to feed heavy rain. [34] presented statistical evidence from four Houston area precipitation-recording stations that the 24-h 100-yr storm depth had increased by 15% in subur-ban areas when compared to the 24-h 100-yr storm depth published in 1961 by the National Weather Service. They are of the view that the change was linked to heavy urban development in Houston, which covers an area of 937 km2.
The Metropolitan Meteorological Experiment (METROMEX) was an extensive study that took place in the 1970s in the United States [37] [61] to further investigate the modification of mesoscale and conceptive precipi-tation by major cities. In general, the results from METROMEX have showed that urban effects lead to in-creased precipitation during the summer months was typically observed within and 50 - 75 km downwind of the city reflecting increases of 5% - 25% over background values [29] [39]-[41]. More recent studies have continued to validate and extend the findings from pre METROMEX and Post METROMEX investigation [30] [31] [42]-[47]. However, a recent US weather research panel report [52] indicated that more observational and mod-elling work is required because of previous results were heavily based on a few specific cities and statistical in-ferences. It is reported that urban areas reduce precipitation due to cloud microphysics, in contradiction with other studies. The mechanisms of urban effects on precipitation are complex on the one hand; cloud microphys-ics in response to increased urban aerosols may reduce precipitation as suggested by Rosenfield [62] [63]. On the other hand, local dynamics and thermodynamics associated with an UHI-induced convergence zone and a destabilized boundary layer may enhance urban precipitation [46] [47] [49] [64]. [32] have established that in Chicago, a significant increase in the number of heavy precipitation days was recorded in spring and summer and a 12% increase in precipitation was observed in the urban area when compared to the rural areas.
[65] stressed that there is an increase in precipitation in urban area compared to their rural surrounding. He opined further that precipitation amounts are 5% - 10% more in urban areas than in the rural suburb, and [1] ob-served 18.5% more precipitation in urban area of Warri than its periphery. He attributed the urban effect on pre-cipitation to the following factors:
1) Orographic and turbulent effect of urban built landscape on airflow.

S. I. Efe, A. O. Eyefia
11
2) Increased particulate matters in the urban atmosphere in relation to the country sides. 3) Greater availability of condensation nuclei in urban atmosphere compared to the rural atmosphere. 4) Increased frequency of thermal convection in urban areas as a result of higher urban temperature. 5) Increased water vapour from industrial release thus, urban areas record more precipitation than their rural
suburbs because urban air is more buoyant and contains more condensation nuclei as well as water vapour than the rural air.
[49] recently established that space based precipitation observing systems might be able to detect UHI-in- duced precipitation variability. This is particularly intriguing because understanding urban effects on precipita-tion is far from complete. First, previous research used ground observations to study one or a few selected cities. However, urban effects vary with micro to mesoscale features of individual cities. Global assessment of urban climates is necessary to generalize the most important characteristics of urban effects. Second, previous studies, via different approaches, reached conflicting understanding on urban precipitation relations. The UHI affect the global water cycle through the development of clouds and precipitation in and around cities, several observa-tional and Climatological studies have theorized that the UHI can have a significant influence on mesoscale cir-culations and resulting convection [47].
Also there has been resurgence in studies of urban effects on precipitation, clouds and storms. This has been driven in part by new technologies; for example the application of data from the Tropical Precipitation Measur-ing Mission (TRMM) satellite’s precipitation radar [47]-[49] and Doppler radar [50]. Such technologies allow precipitation, which can be highly variable spatially, to be more easily quantified, though ground-based rain gauges still remain the absolute reference point. Recent studies [66] serve to confirm previous understanding that urbanization has an effect on precipitation through increases in hygroscopic nuclei, turbulence via surface roughness, convection because of changes in the urban heat budget, convergent wind flow over the urban area which may lead to rain producing clouds, and the addition of water vapour from combustion from anthropogenic sources (See Figures 1 and 2).
precipitation
retention
evapotranspiration
Surface run-off
Ground-water
run-off
Figure 1. Elements of precipitation in a rural area. Source: Adopted from [67].

S. I. Efe, A. O. Eyefia
12
precipitation
retention
evapotranspiration
Surface run-off
Ground-water run-off
Figure 2. Elements of precipitation in an urban area. Source: Adopted from [67].
Figures 1 and 2 showed that as rural area attract development and increased population, it gradually grow
into an urban area with increase in anthropogenic activities, and hygroscopic nuclei. This lead to the generation of rain forming cloud that gave rise to higher precipitation in urban area than its surrounding rural area, which is known as urban effect on precipitation.
3. Methods of Data Collection The study adopted expo facto research design in which field survey method was employed. This involves direct field measurement of precipitation amount within the built-up areas of Benin City, and Egor and Ugbekun-Oka the suburb of Benin. The study is based on stratified sampling technique. This was used to divide the urban area into six strata based on the existing zones (See Table 1). Five precipitation sites each were established in each land use types in the urban areas and two sites in Egor and Ugbekun-oka being the rural area, and one in each parks (See Table 1). A total of 25 rain gauges were established in the various land use types in Benin. The rain amount caught by the rain gauges were read at 0900GMT (10 am Nigeria time) and the amounts of precipitation measured are credited to the preceding 24 hours period. This was done for a period of one year. This method corroborated those of [1] [68]-[70]. It should be noted that study of urban climate has often been accomplished through the use of a few hours or days of intensive measurements [71]-[74]. [75] asserted that, study of urban climate through the use of longer periods (30 years) of data at urban and rural sites is difficult because of the changes in observation time and changes in instrument location that are so often encountered when a long cli-mate time series is examined. Differences in the landscape position of the urban and rural sites may lead to dif-ferent climate that will mask the effects or the rural site may not be entirely outside the region of urban effects [76]. Archival precipitation data on precipitation amount were collected from the Nigerian Meteorological Agency and the Nigerian Institute for Oil Palm Research (NIFOR) Agro-meteorological Station Benin-City this is to complement the precipitation data collected.
The data generated were summarized with descriptive statistics, and least square trend analysis and paired test

S. I. Efe, A. O. Eyefia
13
Table 1. Various land use types.
Land Use Types Settlement Numbers of Gauges
High-Density Areas Iwegie, Eguddase, Ogbelaka, Igbesanwa, Urubi, Wire Road, Upper Mission Area, Iyaro. 5
Medium-Density Areas
Uguisi, Ugbeku, Uzebu, G.R.A, Evbuoriaria, Aduwawa, Ugbowo, Okhoro Quarters, Ikpoba Slope, Ikpoba Hill, Airport Road, Ekewan Road, Second East Cicrcular Road, Ewe, Lawani, Murtala Mohammed Way, Siluko Road,Textile Mill Road, Agbor Road, Saponba Road, Oka.Oliha, Uselu, Ehaipen.
5
Low-Density Areas Ihimmwinin, Iyekoba, Upper Sapoba Road, Channel 55, Ogida, Upper Siluko, Uwelu, Ekinosodi. 5
Commercial Areas Mission Road, New Benin, Lagos Street, Forestry Road. Akpakpava Road, Ogboka, Ibiwe 5
Parks Amusement Park, Ogba Zoological Gardens and Ramat Park. 3
Rural Areas Egor, Ugbekun-oka. 2
were used to determine the level of precipitation variation in the urban areas and the country sides. The Statisti-cal Packages for the Social Science (SPSS) version 15.0 was used to analyze the paired t’ test and the least square trend analysis. The trendlines were derived in the following ways: With Microsoft excel office 2003 in your system, insert chat bar and right click on the bar and add trend line
Then select exponential for your least square/ or moving Averages/polynomial trendline. Right click on your trend line and do the other settings such as show the equation. The least square express the trend line in a straight line. And the polynomial express the trend line in a curve shaped, thus it depict the years with the high-est precipitation at the peak.
These statistical techniques have been adopted by [1] [77] and with high level of precision. The choice of the SPSS in analyzing the data is based on the accuracy, ease and ability to accommodate voluminous data set.
4. Results and Discussion The data generated for this study were presented in Tables 2 and 3 and Figures 3-9 and discussed below. This section discusses the annual, spatial and monthly distribution of precipitation in Benin.
4.1. Annual and Spatial Distribution of Precipitation The annual distribution of precipitation in Benin-City for the past thirty is shown in Figure 3. From Figure 3, annual precipitation in Benin City showed a fluctuating pattern with a mean of 2311 mm for the past 30 years. However the highest and lowest precipitation (3328 mm and 1622 mm) were observed in 1987 and 1988 which indicate 1706 mm increase in rainfall. Generally 2002 to 2013 showed an increase in precipitation and indicate above average precipitation during these years (See Figure 4). This epoch corroborated those of [77] that con-firmed these periods as wet period and correspond with years of above normal average temperatures which is an indication of the impact of global warming on rainfall patterns in Benin City. However there was a near persis-tent departure of annual precipitation (See Figure 4). Benin City experienced a general decrease in precipitation from 1983-1987; and 1994-2000 with the exception of 1997 that had precipitation above the normal rainfall of 2311 mm in the area (See Figure 4), and indicating a drought period in the city. On the other hand, there is a general increase in precipitation above the normal from 1988-1993; and 2001-2013, indicating a wet period. This corroborated [77] who had earlier noted this in their study.
However the trend lines in Figures 3 and 4 showed an upward trend, indicating a gradual increase in precipi-tation amount over the past thirty years.
The spatial distribution of precipitation in Benin City showed 2541.2 mm mean annual precipitation, which span 1833 mm in the rural area of Egor, Ugbekun-Oka etc. to 3232 mm in the central business district (CBD) of ring road area, Oba market, Sakpoba road, Mission road, Akpakpava road etc (See Figure 5). This revealed 1399 mm precipitation differentials, and accounted for over 43% urban-rural precipitation differentials in the areas. However, there was 233 mm gradual decrease in precipitation from the CBD to country sides (See Table 2

S. I. Efe, A. O. Eyefia
14
Table 2. Paired t explaining the Urban-Rural precipitation differentials.
Paired Differences 95% Confidence Interval of the Difference t Critical t Df R
Mean Std. Deviation Std. error Mean Lower Upper
Urban-Rural 51.95 38.69 11.17 27.37 76.37 4.652 2.201 11 0.985
Table 3. Monthly precipitation distributions (mm) in Benin-City.
Variables J F M A M J J A S O N D Total
High Density Areas 26.4 29.5 160.1 393.3 400.8 473.4 487.6 402.5 497 237 86.2 37.9 3231.7
Commercial Areas 25.7 28.7 155.6 354.5 361.7 343.9 384.4 388.9 388 236 75.4 33.6 2776.4
Medium Density Areas 23.6 26.8 151.7 305.1 330 301.1 362.7 316.9 364 233 70.5 30.7 2516.1
Low Density Areas 20 23.5 152 303 312.2 266.7 289 262.4 290 230 56 27.5 2232.3
Natural Parks and Gardens 17.9 19.3 143.1 280.3 244.3 242.3 239.9 233.2 243 228 38 20 1949.3
Mean 22.72 25.56 152.5 327.24 329.8 325.48 352.72 320.78 356.4 232.8 65.22 29.94 2541.16
Rural 10.4 21.4 85..2 232.6 244.96 256.47 263.77 236.1 268.0 225.7 48.5 24.6 1832.5
Figure 3. Annual precipitation distribution (mm) in Benin-City.
Figure 4. Standard anomalies of mean precipitation (1983-2013).
y = 19.52x + 1997.4
0500
100015002000250030003500
1983
1986
1989
1992
1995
1998
2001
2004
2007
2010
2013
Years
Prec
ipita
tion
y = 24.397x - 340.89
-1000
-500
0
500
1000
1500
1983
1985
1987
1989
1991
1993
1995
1997
1999
2001
2003
2005
2007
2009
2011
Years
Prec
ipita
tion
(mm
)

S. I. Efe, A. O. Eyefia
15
Figure 5. Spatial annual distribution of rainfall in Benin City. and Figure 6). This result corroborated [34] who observed 15% in their studies of Houston area precipitation and [1] who recorded 23% in the city of Warri. From Figure 6, the high density area has the highest annual pre-cipitation value of 3231.7 mm and the surrounding rural areas recorded 1832.5 mm of precipitation. This showed that there is a significant difference in precipitation amount recorded in the urban-rural areas of Benin
1
EVBOTUBU
OKO
OGBA
EVBORIARIA
UGBEKUN-OKA
USELU UWELU
OGIDA
UGBOWO
ADUWAWA UNIVERSITY OF BENIN
EKINOSODI
2232 Govt. Reservation Area
BENIN AIRPORT
0 400 800 1200kms
Inner City
Benin Mout
Roads (Tarred)
Roads (Untarred)
6021’N
6014’N
6021’N
6014’N 5034’E 5034’E
5034’E 5034’E
EGOR
Ramat Park
1832.7
1949.3
2989
3232
2756
1832.6
OREGBENI
2nd East C
ircular Rd.
Ugboka
2523 2756

S. I. Efe, A. O. Eyefia
16
Figure 6. Precipitation distribution in the various land uses in Benin City.
Figure 7. Convective Rainfall precipitated by convective uplift. Source: Internet Geography http://www.geography.learnontheinternet.co.uk/topics/rain.html accessed 08/11/13.
Figure 8. Monthly precipitation distribution (mm) in the urban and rural areas of Benin City.
0
500
1000
1500
2000
2500
3000
3500
HD CA MDA LDA NPA Rural
Prec
ipita
tion
(mm
)
Land use
0
50
100
150
200
250
300
350
400
J F M A M J J A S O N D
Months
Prec
ipita
tion
(mm
)
Urban
Rural
S. I. Efe, A. O. Eyefia
17
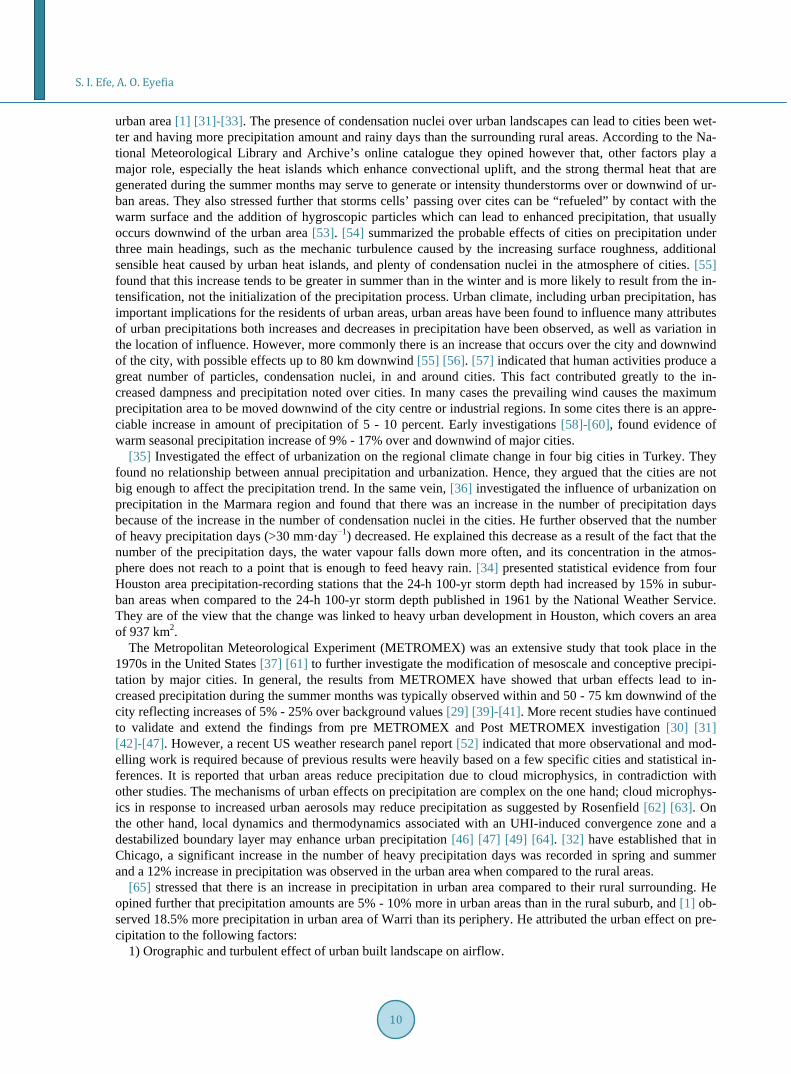
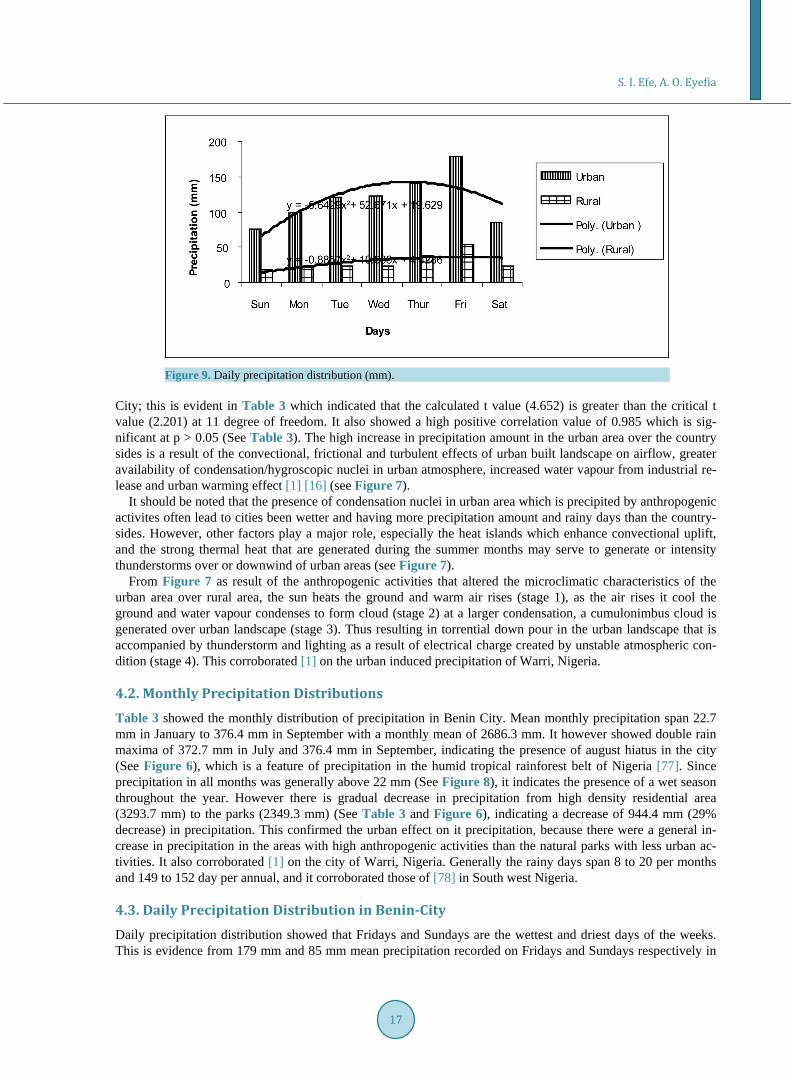
Figure 9. Daily precipitation distribution (mm).
City; this is evident in Table 3 which indicated that the calculated t value (4.652) is greater than the critical t value (2.201) at 11 degree of freedom. It also showed a high positive correlation value of 0.985 which is sig-nificant at p > 0.05 (See Table 3). The high increase in precipitation amount in the urban area over the country sides is a result of the convectional, frictional and turbulent effects of urban built landscape on airflow, greater availability of condensation/hygroscopic nuclei in urban atmosphere, increased water vapour from industrial re-lease and urban warming effect [1] [16] (see Figure 7).
It should be noted that the presence of condensation nuclei in urban area which is precipited by anthropogenic activites often lead to cities been wetter and having more precipitation amount and rainy days than the country-sides. However, other factors play a major role, especially the heat islands which enhance convectional uplift, and the strong thermal heat that are generated during the summer months may serve to generate or intensity thunderstorms over or downwind of urban areas (see Figure 7).
From Figure 7 as result of the anthropogenic activities that altered the microclimatic characteristics of the urban area over rural area, the sun heats the ground and warm air rises (stage 1), as the air rises it cool the ground and water vapour condenses to form cloud (stage 2) at a larger condensation, a cumulonimbus cloud is generated over urban landscape (stage 3). Thus resulting in torrential down pour in the urban landscape that is accompanied by thunderstorm and lighting as a result of electrical charge created by unstable atmospheric con-dition (stage 4). This corroborated [1] on the urban induced precipitation of Warri, Nigeria.
4.2. Monthly Precipitation Distributions Table 3 showed the monthly distribution of precipitation in Benin City. Mean monthly precipitation span 22.7 mm in January to 376.4 mm in September with a monthly mean of 2686.3 mm. It however showed double rain maxima of 372.7 mm in July and 376.4 mm in September, indicating the presence of august hiatus in the city (See Figure 6), which is a feature of precipitation in the humid tropical rainforest belt of Nigeria [77]. Since precipitation in all months was generally above 22 mm (See Figure 8), it indicates the presence of a wet season throughout the year. However there is gradual decrease in precipitation from high density residential area (3293.7 mm) to the parks (2349.3 mm) (See Table 3 and Figure 6), indicating a decrease of 944.4 mm (29% decrease) in precipitation. This confirmed the urban effect on it precipitation, because there were a general in-crease in precipitation in the areas with high anthropogenic activities than the natural parks with less urban ac-tivities. It also corroborated [1] on the city of Warri, Nigeria. Generally the rainy days span 8 to 20 per months and 149 to 152 day per annual, and it corroborated those of [78] in South west Nigeria.
4.3. Daily Precipitation Distribution in Benin-City Daily precipitation distribution showed that Fridays and Sundays are the wettest and driest days of the weeks. This is evidence from 179 mm and 85 mm mean precipitation recorded on Fridays and Sundays respectively in

S. I. Efe, A. O. Eyefia
18
the urban areas of Benin; and 54 mm and 24 mm recorded on Fridays and Sundays respectively in the surround-ing areas of Benin (See Figure 8). This is in contrast to the view of [79]-[82] that Thursdays and Sundays were the wettest and sunniest days in the city of London respectively.
On the same vein, the study also contradicts [33] that Sundays were days with the highest precipitation in Ankaran; and that of [1] who observed that Mondays and Fridays are the wettest days and driest days respec-tively in the urban and the surrounding rural areas of Warri metropolis. The polynomial trend lines on Figure 9 showed clearly that there was a gradual increase in precipitation from Sundays to Fridays, there after there was a recession in precipitation on Saturdays in both the urban and rural areas of Benin City. Thus the working days were generally wetter than the weekends. This trend could be ascribed to the high level of anthropogenic and socio economic activities taking place during the working days than the weekends [1].
5. Conclusions The study revealed an urban effect on the precipitation of Benin City, with 43% increase in precipitation in ur-ban area over the country sides. Precipitation amounts differ significantly within the urban canopy from the high density areas to the natural parks. There is a double precipitation maximum in the months of July and September, indicating the presence of August hiatus in the city. There is rain in all months with no distinct dry season; as such there is wet season throughout the year. Also Fridays and Sundays are the wettest and driest days of the weeks. It also revealed that the precipitation of Benin-City is strong and heavy with 2311 mm and 2541 mm which has strong implications on the hydrological cycle, properties and social-economic activities of the dwell-ers.
The result of this study has confirmed the concept of urban precipitation and urban climate which can be ap-plied to urban environmental planning in any region of the world, and it also has wide applicability in the field of applied climatology, hydrological issues and climate change studies.
Based on this, it is recommended that before implementing any project such as infrastructural development which requires great investment, the frequency and rate of intense precipitation should be determined in the ur-ban areas. Also, since the city in the future will get bigger as a result of increasing population and economic de-velopment, the impact of urbanization on precipitation will also increase.
Therefore, it is recommended that investigations on the urban climatology should be initiated soon by the state and federal government of Nigeria.
References [1] Efe, S.I. (2013) Urban Effects on Precipitation and Rainwater Quality in Warri Metropolis, Nigeria. LAP Lambert
Academic Publishing Germany, Saarbrücken. [2] Buechley, R., Van Bruggen, W. and Trippi, L.E. (1972) Heat Island Death Island? Environmental Research, 5, 85-92.
http://dx.doi.org/10.1016/0013-9351(72)90022-9 [3] Clarke, J.F. (1972) Some Effects of the Urban Structure on Heat Mortality. Environmental Research, 5, 93-104.
http://dx.doi.org/10.1016/0013-9351(72)90023-0 [4] Alestalo, M. (1975) Esimerkkeja ns. Lamposaarekeilmiosta Helsingin Alueela. Report 7, Department of Meteorology,
University of Helsinki, 15. [5] World Meteorological Organization (1984) The International Satellite Cloud Climatology Project (ISCCP) Data Man-
agement Plan, Geneva. [6] Oke, T.R. (1987) Boundary Layer Climates. 2nd Edition, Methuen Co., London, New York, 435. [7] Hansen, J.R. and Lebedeff, S. (1987) Global Trends of Measured Surface Temperature. Journal of Geophysical Re-
search, 92, 345-372. [8] Balling, R.C. and Idso, S.B. (1989) Historical Temperature Trends in the United States and the Effects of Urban Popu-
lation Growth. Journal of Geophysical Research, 94, 3359-3363. http://dx.doi.org/10.1029/JD094iD03p03359 [9] Wang, W.C., Zeng, Z. and Karl, T.R. (1990) Urban Heat Island in China. Geophysical Research Letters, 17, 2377-
2380. http://dx.doi.org/10.1029/GL017i013p02377 [10] Chow, S D. (1992) The Urban Climate of Shanghai. Atmospheric Environment, 20B, 9-15. [11] Lee, H.Y. (1993) An Application of NOAA AVHRR Thermal Data to the Study of Urban Heat Islands. Atmospheric
Environment, 27, 1-13.

S. I. Efe, A. O. Eyefia
19
[12] Moreno-Garcia, M.C. (1994) Intensity and Form of the Urban Heat Island in Barcelona. International Journal of Cli-matology, 14, 705-710. http://dx.doi.org/10.1002/joc.3370140609
[13] Peterson, T.C., Gallo, K.P., Kawrinvre, J., Owen, T.W., Huang, A. and Mckiltrick, D.A. (1999) Global Rural Tem-perature Trends. Geophysical Research Letters, 26, 328-332. http://dx.doi.org/10.1029/1998GL900322
[14] Hansen, J.R., Ruedy, R., Sato, M., Imhoff, M., Lawrence, W., Easterling, D., Peterson, T. and Karl, T. (2001) A Closer Look as United States and Global Surfaces Temperature Change. Journal of Geophysics Research, 106, 3947-23963.
[15] IPCC (2001) Intergovernmental Panel on Climate Change. Published online. http://www.grida.no.climate/ipcc_tar/wgi/052.html#221
[16] Efe, S.I. (2001) Urban Effects on Temperature in the Warri Metropolitan Area. Urban and Regional Affairs, 5, 31-34. [17] Peterson, T.C. (2003) Assessment of Urban Versus Rural in Situ Surface Temperatures in the Contiguous United States:
No Difference Found. Journal of Climate, 16, 2941-2959. http://dx.doi.org/10.1175/1520-0442(2003)016<2941:AOUVRI>2.0.CO;2
[18] Parker, D.E. (2004) Climate: Large Scale Warming Is Not Urban. Nature, 432, 290. http://dx.doi.org/10.1038/432290a [19] Coutts, A.M., Beringer, J., Tapper, N.J. and Cleugh, H. (2004) The Influence of Housing Density and Urban Design on
the Surface Energy Balance and Local Climates of Melbourne. Australia and the Impact of Melbourne 2030’s Vision. Published on line. http://ams.confex.com/ams/afapurbbio/techprogram/paper_79351.html
[20] Parker, D.E. (2006) A Demonstration That Large Scale Warming Is Not Urban. Journal of Climate, 19, 2882-2895. http://dx.doi.org/10.1175/JCLI3730.1
[21] Gill, S.E., Handley, J.F., Ennos, A.R. and Pauleit, S. (2007) Adapting Cities for Climate Change: The Role of the Green Infrastructure. Built Environment, 33, 115-133. http://dx.doi.org/10.2148/benv.33.1.115
[22] Houghton, J.T. Jenkins, J.G. and Ephraums, J.J. (1990) Climate Change, the IPCC Scientific Assessments. Cambridge University Press, Cambridge.
[23] Houghton, J.T., Meira Filho, L.G., Callander, B.A., Harris, N.A., Kattenberg, A. and Maskell, K. (1996) Climate Change 1995; the Science of Climate Change. Cambridge University Press, Cambridge.
[24] Seino, N. and Aoyagi, T. (2009) Urban Influences on Precipitation in the Tokyo Area: Numerical Simulation of a Heavy Precipitation. The 7th International Conference on Urban Climate, Yokohama, 29 June-3 July 2009.
[25] Atkinson, B.W. (1971) The Effect of an Urban Area on Precipitation from a Moving Thunderstorm. Journal of Applied Meteorology, 10, 47-55. http://dx.doi.org/10.1175/1520-0450(1971)010<0047:TEOAUA>2.0.CO;2
[26] Lowry, W.P. and Probald, F. (1978) An Attempt to Detect the Effect of a Steelwork on Precipitation Amounts in Cen-tral Hungary. Journal of Applied Meteorology, 17, 964-975. http://dx.doi.org/10.1175/1520-0450(1978)017<0964:AATDTE>2.0.CO;2
[27] Yonetani, T. (1982) Increase in Number of Days with Heavy Precipitation in Tokyo Urban Area. Journal of Applied Meteorology, 21, 1466-1471.
[28] Shafir, H. and Alpert, P. (1990) On the Urban Orographic Precipitation Anomaly in Jerusalem: A Numerical Study. Atmospheric Environment, 24, 365-375.
[29] Changnon, S.A., Shealy, R. and Scott, R. (1991) Precipitation Changes in Fall Winter and Spring Caused by St. Louis. Journal of Applied Meteorology, 30, 126-134. http://dx.doi.org/10.1175/1520-0450(1991)030<0126:PCIFWA>2.0.CO;2
[30] Jauregui, E. and Romales, E. (1996) Urban Effects on Convective Precipitation in Mexico City. Atmospheric Environ-ment, 30, 3383-3389. http://dx.doi.org/10.1016/1352-2310(96)00041-6
[31] Bornstein, R. and Lin, Q. (2000) Urban Heat Island and Summer Time Convective Thunderstorms in Atlanta: Three Case Studies. Atmospheric Environment, 34, 507-516. http://dx.doi.org/10.1016/S1352-2310(99)00374-X
[32] Changnon, S.A. (2001) Assessment of Historical Thunderstorm Data for Urban Effects: The Chicago Case. Climatic Change, 49, 161-169. http://dx.doi.org/10.1023/A:1010797013336
[33] Cicek, I. and Turkoglu, N. (2005) Urban Effects on Precipitation in Ankara. Atmosfera, 18, 173-187. [34] Bouvette, T., Lambert, L.J. and Bedient, P.B. (1982) Revised Precipitation Frequency Analysis for Houston. Proceed-
ings of the American Society of Civil Engineers, 108, 515-528. [35] Tayanc, M. and Toros, M. (1997) Urbanization Effect on Regional Climate Change in the Case of Four Large Cities in
Turkey. Climate Change, 35, 501-524. http://dx.doi.org/10.1023/A:1005357915441 [36] Kadioglu, M. (1997) Schirlesmenin Marmara Bolgesindeki Yagislara Etkisi. Su ve Cevre Sempozyumu’97, 2-5
Haziran 1997. TMMOB JMO, 1, 37-46. [37] Changnon, S.A., Huff, F.A., Schickedanz, P.T. and Vogel, J.L. (1977) Summary of METROMEX: Weather Anomalies
and Impacts. Illinois State Water Survey, Bulletin 62, Champaign, 260.

S. I. Efe, A. O. Eyefia
20
[38] Huff, F.A. (1986) Urban Hydrological Review. Bulletin of the American Meteorological Society, 67, 65-712. [39] Huff, F.A. and Vogel, J.L. (1978) Urban, Topographic and Diurnal Effects on Precipitation in the St. Louis Region.
Journal of Applied Meteorology, 17, 565-577. http://dx.doi.org/10.1175/1520-0450(1978)017<0565:UTADEO>2.0.CO;2
[40] Changnon, S.A. (1979) Precipitation Changes in Summer Caused by St. Louis. Science, 205, 402-404. http://dx.doi.org/10.1126/science.205.4404.402
[41] Changnon, S.A., Semonim, R.G., Auer, A.H., Braham, R.R. and Hales, J. (1981) METROMEX: A Review and Sum- mary. Mateormonogr, No 40, American Meteorological Society, 81.
[42] Balling, R.C. and Brazel, S. (1987) Recent Changes in Phoenix Summertime Diurnal Precipitation Patterns. Theoreti- cal and Applied Climatology, 38, 50-54. http://dx.doi.org/10.1007/BF00866253
[43] Kusaka, H., Kimura, F., Hirakuchi, H. and Mizutori, M. (2000) The Effects of Land-Use Alteration on the Sea Breeze and Daytime Heat Island in the Tokyo Metropolitan in Texas. Monthly Weather Review, 118, 2634-2648.
[44] Thielen, J., Wobrock, W., Gradian, A., Mestayer, P.G. and Creutin, J.D. (2000) The Possible Influence of Urban Sur- faces on Rainfall Development: A Sensitivity Study in 2D in the Meso Gramma Scale. Atmospheric Research, 54, 15-39. http://dx.doi.org/10.1016/S0169-8095(00)00041-7
[45] Baik, J.J., Kim, Y.H. and Chun, H.Y. (2001) Dry and Moist Convection Forced by an Urban Heat Island. Journal of Applied Meteorology, 40, 1462-1475. http://dx.doi.org/10.1175/1520-0450(2001)040<1462:DAMCFB>2.0.CO;2
[46] Ohashi, Y. and Kida, H. (2002) Local Circulation Developed in the Vicinity of both Coastal and Inland Urban Areas: Numerical Study with a Mesoscale Atmosphere Model. Journal of Applied Meteorology, 41, 30-45. http://dx.doi.org/10.1175/1520-0450(2002)041<0030:LCDITV>2.0.CO;2
[47] Shepherd, J.M. and Burian, S.J. (2003) Detection of Urban-Induced Precipitation Anomalies in a Major Coastal City. Earth Interactions, 7, l-17. http://dx.doi.org/10.1175/1087-3562(2003)007<0001:DOUIRA>2.0.CO;2
[48] Lowry, W.P. (1998) Urban Effects on Precipitation Amount. Progress in Physical Geography, 22, 477-520. [49] Shepherd, J.M., Pierce, H.F. and Negri, A.J. (2002) Rain Fall Modification by Major Urban Areas. Observations from
Spaceborne Rain Radar on the TRMM Satellite. Journal of Applied Meteorology, 41, 689-701. http://dx.doi.org/10.1175/1520-0450(2002)041<0689:RMBMUA>2.0.CO;2
[50] Russo, F., Napolitano, F. and Gorgucci, E. (2005) Precipitation Monitoring Systems over an Urban Area: The City of Rome. Hydrological Processes, 19, 1007-1019. http://dx.doi.org/10.1002/hyp.5642
[51] Shepherd, J.M. (2005) A Review of Current Investigations of Urban-Induced Precipitation and Recommendations for the Future. Earth Interactions, 9, l-27. http://dx.doi.org/10.1175/EI156.1
[52] Dabberdt, W.F., Hales, J., Zubrick, S., Crook, A., Krajewski, W. and Doran, J.C. (2000) Forecast Issues in the Urban Zone: Report of the 10th Prospectus Development Team of the US Weather Research Program. Bulletin of the Ameri- can Meteorological Society, 81, 2047-2064. http://dx.doi.org/10.1175/1520-0477(2000)081<2047:FIITUZ>2.3.CO;2
[53] www.metoffice.gov.uk/media/pdf/c/e/No._14_-_Microclimates [54] Chandler, T.J. (1965) The Climate of London. Hutchinson, London, 292. [55] Huff, F.A. and Changnon, S.A. (1973) Precipitation Modification by Major Urban Areas. Bulletin of the American
Meteorological Society, 54, 220-1232. http://dx.doi.org/10.1175/1520-0477(1973)054<1220:PMBMUA>2.0.CO;2 [56] Diab, R.D. (1978) Urban Effects on Precipitation: A Review. South African Journal of Science, 74, 87-91. [57] Griffiths, J.F. (1976) Applied Climatology: An Introduction. 2nd Edition, Oxford University Press, London. [58] Changnon, S.A. (1968) The LaPorte Weather Anomaly-Fact or Fiction? Bulletin of the American Meteorological Society,
49, 4-11. [59] Landsberg, H.E. (1970) Man-Made Climate Changes. Science, 170, 1256-1274. [60] Huff, F.A. and Changnon Jr., S.A. (1972) Climatological Assessment of Urban Effects on Precipitation at St. Louis.
Journal of Applied Meteorology, 11, 823-842. [61] Huff, F.A. and Changnon, S.A. (1972) A Climatological Assessment of Urban Effects on Precipitation in St. Lious.
Journal of Applied Meteorology, 49, 4-11. [62] Rosenfield, D. (1999) TRMM Observed First Direct Evidence of Smoke from Forest Fire Inhibiting Precipitation.
Geophysical Research Letters, 26, 3105-3108. http://dx.doi.org/10.1029/1999GL006066 [63] Ramanathan, V., Crutzen, P.J., Kiehl, J.T. and Rosenfield, D. (2001) Aerosols, Climate and the Hydrological Cycle.
Science, 294, 2119-2124. http://dx.doi.org/10.1126/science.1064034 [64] Changnon, S.A. and Westcott, N.E. (2002) Heavy Rainstorms in Chicago: Increasing Frequency, Altered Impacts, and
Future Implications. Journal of the American Water Resources Association, 38, 1467-1475.

S. I. Efe, A. O. Eyefia
21
http://dx.doi.org/10.1111/j.1752-1688.2002.tb04359.x [65] Ayoade, J.O. (2004) Introduction to Climatology for the Tropics. 2nd Edition, Spectrum Books Limited, Ibadan. [66] Burian, S.J. and Shepherd, J.M. (2005) Effects of Urbanization on the Diurnal Rainfall Pattern in Houston. Hydrologi-
cal Processes: Special Issue on Rainfall and Hydrological Processes, 19, 1089-1103 [67] Wypych, S. (2003) Urban Effects on Precipitation Amount. Published online.
http://journals.tums.ac.ir/ upload_files/pdf/12614. Pdf [68] Oluwamimo, S. (2006) The Temporal Structure of the Urban Heat Island in Lagos State, Nigeria. European Geosci-
ences Union, Geophysical Research Abstracts, 8. [69] Unger, J. and Markra, L. (2007) Urban-Rural Differences in the Heating Demand as a Consequence of the Heat Island.
University, Szeqediensis, Tomus. Acta Climatologica et Chorological, 40-41, 155-162. [70] Pagenkopf, A. (2007) The Spatiotemporal Structure of Precipitation in Berlin and Its Surrounding Regions between
1951-1990. www.geo graphie.hu-berlin. de/.../pagenkopf.../text-06_iwuh-stmoritz.pdf [71] Duckworth, F.S. and Sandberg, J.S. (1954) The Effect of Cities upon Horizontal and Vertical Temperature Gradients.
Bulletin of American Meteorological Society, 35, 198-207. [72] Hutcheon, R.J., Johnson, R.H., Lowery, W.P., Black, C.H. and Hadley, D. (1967) Observation of the urban heat island in a
small city. Bulletin of American Meteorological Society, 48, 7-9. [73] Kopec, R.J. (1970) Further Observation of the Urban Heat Island in a Small City. Bulletin of American Meteorological
Society, 51, 602-606. http://dx.doi.org/10.1175/1520-0477(1970)051<0602:FOOTUH>2.0.CO;2 [74] Oke, T.R. and Maxwell, G.B. (1975) Urban Heat Island Dynamics in Montreal and Vancouver. Atmospheric Environ-
ment, 9, 191-200. http://dx.doi.org/10.1016/0004-6981(75)90067-0 [75] Kukla, G.G.J. and Karl, T.R. (1986) Urban Warming. Journal of Climate and Applied Meterology, 25, 1265-1270.
http://dx.doi.org/10.1175/1520-0450(1986)025<1265:UW>2.0.CO;2 [76] Lowry, W.P. (1977) Empirical Estimation of Urban Effects on Climate: A Problem Analysis. Journal of Applied Me-
teorology, 16, 129-135. http://dx.doi.org/10.1175/1520-0450(1977)016<0129:EEOUEO>2.0.CO;2 [77] Atedhor, G.O., Odjugo, P.A.O. and Uriri, A.E. (2011) Changing Rainfall and Anthropogenic-Induced Flooding: Im-
pacts and Adaptation Strategies in Benin City, Nigeria. Journal of Geography and Regional Planning, 4, 42-52. [78] Omogbai, B.E. (2010) Rain Days and Their Predictatibility in South Western Region of Nigeria. Journal of Human
Ecology, 31, 185-195. [79] Nicholson, G. (1965) Wet Thursdays Again. Weather, 20, 322-223.
http://dx.doi.org/10.1002/j.1477-8696.1965.tb02744.x [80] Nicholson, G. (1969) Wet Thursdays. Weather, 24, 117-119. http://dx.doi.org/10.1002/j.1477-8696.1969.tb03159.x [81] Lawrence, E.N. (1968) Changes in Air Temperature at Manchester Airport. Metropolis Magazine, 97, 43-51. [82] Lawrence, E.N. (1971) Urban Climate and Day of the Week. Atmospheric Environment, 5, 935-948.
http://dx.doi.org/10.1016/0004-6981(71)90152-1


