Urban Air Pollution Management and Practice in Major · PDF fileAPMA Urban Air Pollution...
235
Urban Air Pollution Management and Practice in Major and Mega Cities of Asia
Transcript of Urban Air Pollution Management and Practice in Major · PDF fileAPMA Urban Air Pollution...

Urban Air PollutionManagement and Practice in Major
and Mega Cities of Asia

APMA Urban Air Pollution Management and Practice in Major and Mega Cities of Asia


APMA
Urban Air Pollution Management and Practice in Major and
Mega Cities of Asia
Prepared and published in the framework of the APMA Project
Edited by
Gary Haq Wha-Jin Han Christine Kim

© Copyright 2002 by the Korea Environment Institute Air Pollution in the Megacities of Asia (APMA) Project c/o Korea Environment Institute 613-2 Bulgwang-dong, Eunpyeong-gu 122-706 Seoul Korea, Republic of Tel: +82 2 380 7610 Fax: +82 2380 7688 Web: www.asiairnet.org
The contents of this report are based on the proceedings of the Air Pollution in the Megacities of Asia workshop held in Seoul, Korea, on 3–5 September, 2001. This publication was produced as part of the Air Pollution in the Megacities of Asia (APMA) project, sponsored by the Ministry of Environment of Korea (MOE-Korea) and Swedish International Development Cooperation Agency (Sida). The contents and views expressed in this document are those of the authors and do not necessarily reflect the policies or position of APMA, World Health Organization (WHO), United Nations Environment Programme (UNEP), Stockholm Environment Institute (SEI), Korea Environment Institute (KEI), Sida, MoE-Korea, or other organisations named in this report. For chapters submitted by representatives of national or city governments, the sources and references not cited can be attributed to their respective government institutions. ISBN: 89-8464-028-X

CONTENTS Foreword v Contributors vi
1 Urban Air Pollution in Asia 1
Gary Haq and Wha-Jin Han
2 Ambient Air Pollution and Emerging Issues in Megacities 8 Dietrich Schwela and Hiremagalur Gopalan
3 Air Quality in the People’s Republic of China 45
Christine Kim, Cui Qiang
4 Air Pollution Management in India 59 T S Panwar
5 Air Quality Management in Jakarta 78 Aboejoewono Aboeprajitno
6 Clean Air For Hong Kong 87 Christopher Fung
7 Urban Air Pollution in Japan 100 Norihiko Tanaka
8 Air Quality Management Policy in Korea 111 Tae-Bong Jeon
9 Air Pollution Problems in the Capital City of Ulaanbaatar, Mongolia 117
P Batima, M. Erdenetuya, R Erdenechimeg and L Batnyam
10 Air Pollution Control Strategies for Taipei City 126 Dah-Jin Wang
11 Air Pollution Management in Thailand 135 Supat Wangwongwatana and Panya Warapetcharayut
12 Learning from Urban Air Pollution Management in Europe 160
Gary Haq
13 Urban Air Pollution Initiatives in the Asia Region 186 Jae-Hyun Lee
14 Enhancing the Capacity for Effective Urban Air Quality Management in Asia 199 John E. Hay
15 Regional Action Plans for Urban Air Quality Management in Asia 214 Wha-Jin Han, Gary Haq, Christine Kim, Hiremagalur Gopalan, Jae-Hyun Lee, Dietrich Schwela
iii

FOREWORD It is estimated that more than half of the world’s population live in urban areas of Asian countries. These urban areas consume thirty per cent of global energy use. In addition, the urban population in Asia has been growing 2.5 times faster than the rural population. There is a clear connection between soaring population growth, rapid industrialization, increased vehicle use and the impact of poor urban air quality in major Asian cities. Furthermore, this urbanization trend raises significant health issues, affecting the well-being and longevity of millions people. Clean air is essential for sustainable development: for in addition to health concerns air pollution causes considerable environmental damage. Acidification and climate change related to air pollutants can negatively affect agriculture, infrastructure and ecosystems. Air pollution is also of regional concern since the air pollution in one country affects neighbouring countries through the long-range transfer of air pollutants. Therefore its needs to be recognized that measures taken in one country can influence and affect levels of air pollution in neighbouring countries. Several attempts have been made at the regional level to address air pollution in Asia. The Malé Declaration on Control and Prevention of Air Pollution and its Likely Transboundary Effects in South Asia is one of such efforts. However, there has been limited progress to address the issue of urban air quality in Asia. The lack of information exchange on effective urban air quality management together with unsynchronized urban air pollution policies in the region has contributed to the absence of regional cooperation on urban air quality management issues. Therefore, establishing a network of countries and cities that can promote the exchange of information is necessary if the issue of urban air quality management is to be addressed effectively. The work of the Air Pollution in the Megacities of Asia (APMA) Project, initiated in November 2000, by the United Nations Environment Programme (UNEP), the World Health Organisation (WHO), and the Korea Environment Institute (KEI) in collaboration with the Stockholm Environment Institute (SEI), has begun to lay the foundation for such a network. The results of the APMA workshop that took place in Seoul in September 2001 are a valuable assessment of the current state of urban air pollution management in Asia. This report elaborates on the country and city presentations at the Seoul workshop, and it is hoped that the report can serve to provide greater insight for future research and policies on approaches to effective urban air quality management that will help to lessen the health, environmental and economic consequences of urban air pollution in Asia, and to achieve more sustainable development. Wha-Jin Han Dietrich Schwela Gary Haq Hiremagalur N.B. Gopalan KEI WHO SEI UNEP
v

CONTRIBUTORS Editors Gary Haq Stockholm Environment Institute at York, United Kingdom Wha-Jin Han Korea Environment Institute, Seoul, Korea Christine Kim Korea Environment Institute, Seoul, Korea Authors Aboejoewono Aboeprajitno DKI Jakarta, Indonesia P Batima Institute of Meteorology and Hydrology, Ulaanbaatar,
Mongolia L Batnyam National Agency for Meteorology, Hydrology and
Environment Monitoring, Ulaanbaatar, Mongolia M Erdenetuya National Remote Sensing Centre, Ulaanbaatar, Mongolia R Erdenechimeg Health Complex of Sukhbaatar District, Ulaanbaatar,
Mongolia Christopher Fung Environmental Protection Department, Hong Kong Hiremagalur Gopalan United Nations Environment Programme, Nairobi, Kenya Gary Haq Stockholm Environment Institute at York, United Kingdom John E Hay United Nations Environment Programme – Regional Office
for Asia Pacific Wha-Jin Han Korea Environment Institute, Seoul, Korea Tae-Bong Jeon Ministry of Environment, Seoul, Korea Christine Kim Korea Environment Institute, Seoul, Korea Jae-Hyun Lee United Nations Environment Programme, Nairobi, Kenya T S Panwar Tata Energy Research Institute, New Delhi, India Cui Qiang Chinese Research Academy of Environmental Sciences Dietrich Schwela World Health Organisation, Geneva, Switzerland Norihiko Tanaka Ministry of Environment, Tokyo, Japan Dah-Jin Wang Bureau of Environmental Protection, Taipei City, Taiwan Supat Wangwongwatana Air Quality and Noise Management Division, Pollution
Control Department, Ministry of Science, Technology and Environment, Bangkok, Thailand
Panya Warapetcharayut Air Quality and Noise Management Division, Pollution Control Department, Ministry of Science, Technology and Environment, Bangkok, Thailand
Editing, Production and Design Erik Willis Stockholm Environment Institute at York, United Kingdom Harry Vallack Stockholm Environment Institute at York, United Kingdom Christine Kim Korea Environment Institute, Seoul, Korea
vi

1 URBAN AIR POLLUTION IN ASIA Gary Haq, Stockholm Environment Institute, York, United Kingdom Wha-Jin Han, Korea Environment Institute, Seoul, Korea INTRODUCTION Urban air pollution poses a significant threat to human health and the environment throughout both the developed and developing world. The issue of urban air quality is receiving more attention as an increasing share of the world’s population are now living in urban centres and are demanding a cleaner urban environment. The United Nations (UN) estimates 4.9 billion inhabitants out of 8.1 billion will be living in cities throughout the world by 2030 compared to the current level of 2.9 billion out of 6.1 billion (UNCSD, 2001). High levels of urbanisation have resulted in increasing urban air pollution due to transportation, energy production and industrial activity all concentrated in densely populated urban areas. The environmental impacts are particularly severe in cities of 10 million or more inhabitants, especially in Asia where some countries have a combination of intense industrial activity, large population density and number and high motor vehicle use. These cities have become known as ‘megacities’ and in Asia include cities such as Bangkok, Beijing, Delhi, Seoul and Tokyo (UNEP/WHO, 1992). The aim of this chapter is to provide an overview of urban air pollution in Asia and to provide the context for the rest of this report, which examines in detail urban air pollution management and practice in selected Asian cities and countries. The report is divided into three parts. Part I is the introduction to the report and examines the main issues regarding urban air pollution and health. Part II of the report examines in detail urban air pollution management in nine Asian countries. Part III examines urban air pollution management practice in Europe and how capacity can be enhanced to effectively implement urban air pollution management. It reviews a number of initiatives taken in the region by other organisations besides UNEP and WHO. The report concludes by reviewing the milestones achieved in urban air pollution management in Asia and the outlook for the future. URBAN AIR POLLUTION IN MAJOR AND MEGA CITIES IN ASIA Increased economic development in the Asian region has led to rapid and unplanned urbanisation with a large number of people being concentrated in cities. The urban population is projected to increase by approximately 48 per cent in East Asia and 46 per cent in Southeast Asia and Pacific by 2015 (see Figure 1.1). By 2020, over half of Asia’s population will live in cities. The urban population will triple from 360 million in 1990 to over a billion by 2020 (UNDP, 1999). It is estimated that currently twelve megacities exist in the Asian region (Bangkok, Beijing, Calcutta, Delhi, Karachi, Metro Manila, Mumbai, Osaka, Seoul, Shanghai, Tianjin and Tokyo) with Tokyo being the largest urban conurbation (UNESCAP, 2000). Urbanisation has resulted in the intensification of pollution in densely populated areas, causing a deterioration in urban air quality.
1

Figure 1.1 Population of major and mega cities in Asia Source: WRI (1998) Causes of Urban Air Pollution The main cause of urban air pollution is the burning of fossil fuels (coal, oil and natural gas) in domestic heating, power generation, industrial processes and in motor vehicles. In addition, the burning of biomass such as firewood, agricultural and animal waste in some cities contribute to the level of pollution. Many activities are undertaken in urban areas which result in polluting air emissions. The most typical urban pollutants include suspended particulate matter (SPM), sulphur dioxide (SO2), volatile organic compounds (VOCs), lead (Pb), carbon monoxide (CO), carbon dioxide (CO2) and nitrogen oxides (NOx). Urban air pollution not only has immediate localised impacts on human health and well being but also contributes to regional and global air pollution. For example, regional acidification is increasingly experienced in East Asia and South East Asia and emissions of greenhouse gases resulting from the combustion of fossil fuels in the industrial and transportation sectors contribute to global climate change On a global scale an estimated 200,000–570,000 deaths occur each year due to outdoor air pollution, which represents 0.1-1.1 per cent of annual deaths (WHO, 1997). Figures 1.2 to 1.4 shows the mean annual concentration of total suspended particulate (TSP), SO2 and NO2 in selected major and mega cities in Asia for 1995. The levels of TSP in a number of cities are three to four times those recommended by WHO while only a few large cities greatly exceed SO2 and NOx levels (UNESCAP, 2000). Approximately 2–5 per cent of all deaths in urban areas in the developing world have been estimated to be due to exposure to high levels of particulates. (World Bank, 1992). High levels of urban air pollution also have economic implications due to increased mortality and illness, damage to crops and property and loss of tourism. The World Bank (1996) estimated that a 20 per cent reduction of key pollutants in Bangkok would provide
2

health benefits of approximately US $4 million to $1.6 billion for PM and between US $300 million and $1.5 billion for Pb. Traffic congestion is a major problem in Bangkok and the World Bank estimated that a 10 per cent reduction in peak-hour trips would provide benefits of approximately US $400 million annually. The damage caused by PM and Pb emissions in Jakarta has been estimated be as high as US $1.2 billion
Figure 1.2 Mean annual concentration of total suspended particulate in selected major and mega cities in Asia Source: WRI (1998)
Figure 1.3 Mean annual concentration of sulphur dioxide in selected major and mega cities in Asia Source: WRI (1998)
3

Figure 1.4 Mean annual concentration of nitrogen dioxide in selected major and mega cities in Asia Source: WRI (1998) Transport and the Urban Environment The transport sector is a large contributor to urban air pollution in Asian megacities, where particulate emissions from diesel vehicles can be very high, leaded petrol is still in use and where sunny conditions readily give rise to photochemical smog and to increased ozone (O3) and NO2 related health impacts. In 1996, the total number of registered cars in the Asian and Pacific region totalled approximately 127 million - 4.24 per cent higher than the previous year (UNEP, 1999). In the cities of Delhi and Manila, the number of cars has doubled every seven years (ADB, 1999). In Southeast Asia the popularity of motorcycles and scooters, which have highly polluting two-stroke engines, together with high average vehicle age and poor maintenance, has led to more emissions per kilometre driven than in developed countries (Walsh, 1999). In Southeast Asia, 2–3 wheelers account for 50–90 per cent of the vehicle fleet. The main pollutants from two-stroke engines are hydrocarbons (HC) and particulate matter (PM). There is now a move from two-stroke to four-stroke engines in some Asian countries. The increase in the use of four-stroke engines results in higher emissions of NOx but lower emissions of CO and HC and an increase in fuel efficiency. Poor people tend to be more affected by pollution from 2-3 wheelers as they are unable to physically separate themselves from the source of pollution. Pollution control strategies in Asian Cities will need to address the use of these vehicles if improved urban air quality is to be achieved (WB/ADB, 2001). Transport poses a major challenge to city authorities in improving the mobility of urban residents while enhancing the efficiency of transportation systems. The increase in the number of motor vehicles has not been matched by investment in infrastructure and many Asian cities are currently suffering from persistent traffic congestion. Cities such as
4

Singapore, Hong Kong, China, Tokyo, Kuala Lumpur and Bangkok are now developing light rail and mass transit systems to reduce the pressure on the roads and provide an opportunity to reappraise city-wide transportation plans (UNESCAP, 2000). Many Asian countries are making progress in reducing vehicle emissions as a major source of urban air pollutants by phasing out leaded petrol, introducing stricter emissions standards and requiring new cars to be fitted with catalytic converters (Walsh, 1999). The role of traditional, non-motorized transport (e.g. rickshaws in Calcutta) can play a major role in moving towards a more sustainable transportation system. However, developing country governments are being encouraged and assisted in pursuing transport policies based on increased car dependency. The response to increasing rates of car ownership and traffic congestion has been expensive road building schemes, which have further encouraged motor vehicle use and dependency causing adverse environmental and health impacts (Whitelegg and Williams, 2000). UNEP AND WHO URBAN AIR POLLUTION INITIATIVES Air pollution management requires the establishment of national and local regulations and institutions for the assessment of air quality and the enforcement of laws. A large number of Asian countries have developed ambient air quality standards for the main pollutants as well as emission standards for power plants, selected industries and vehicles (UNESCAP, 2000). Reliable information on sources of pollution in the city and actual air quality is a prerequisite for air quality management. Many Asian countries now have some form of air monitoring capability to measure all or most of the common urban air pollutants such as SPM, SO2, Pb, O3 and CO. However, the quality of the data collected and how are used to develop air quality management strategies and to implement emission controls on industrial and mobile sources is limited in some Asian countries (UNEP/WHO, 1996). World Health Organisation (WHO) air quality guidelines are frequently being exceeded in a number of Asian cities. There is a continual need to enhance appropriate air quality management capacities in major and mega cities in Asia and to assist in the exchange of best practice in dealing with urban air quality issues. The 1992 United Nations Conference on Environment and Development (UNCED) highlighted the need to focus on urban environmental problems. The WHO Commission on Health and Environment (1992) identified urban air pollution as a major environmental health problem deserving high priority for action. Agenda 21 outlined recommendations for addressing the problem of urban air pollution which included addressing the following main issues (UNEP/WHO, 1996): •
•
•
•
development of appropriate air quality management capacities in major and mega cities and the establishment of adequate environmental monitoring capabilities or surveillance of environmental quality and the health status of populations; improved access to environmentally-sound technologies for developing countries, including the provision and development of extensive international information networks; development and expansion of Earthwatch, a UN system-wide monitoring and assessment programme of which Global Environmental Monitoring System (GEMS/AIR) is a component; and Improvement of data collection and methods of data assessment sot that national and international decisions can be based on sound information, and strengthening of UN data collection activities of the GEMS.
5

From 1975 to 1996 UNEP, in collaboration with WHO, jointly undertook a global urban air quality management programme called GEMS/AIR. In GEMS/AIR, technology transfer and capacity building were performed through information exchange, regional training courses, collaborative reviews, and twinning projects. GEMS/AIR main task was to act as an information brokering system with clearinghouse function. As part of the GEMS/AIR Programme, a review of urban air pollution in the megacities of the world was undertaken in 1992 followed by a review of air quality management and assessment capabilities in twenty major cities in 1996. As a successor to the GEMS/AIR, WHO set up the Air Management Information System (AMIS), a computer a programme developed under the umbrella of the WHO Healthy Cities Programme. The objective of AMIS is to transfer information on air quality management (air quality management instruments used in cities, indoor and ambient air pollutant concentrations, noise levels, health effects, control actions, air quality standards, emission standards, emission inventories, dispersion modelling tools) between countries and cities. In this context AMIS acts as a global air quality information exchange system (Schewela, 1999). Urban air pollution was identified as a priority by the United Nations Centre for Human Settlements (UNCHS/Habitat) and the UNEP Sustainable Cities Programme (SCP). The aim of the SCP is to strengthen capacities in urban environmental planning and management. The programme is founded on cross-sectoral and stakeholder participatory approaches and contributes to promoting urban governance. Each city-level SCP project is adapted to the particular needs, priorities and circumstances of that city. However, all city projects follow the SCP process, which is a general approach for addressing urban environmental issues and consists of three main stages: 1 information, expertise and stakeholder mobilisation 2 strategy formulation and action planning 3 implementation and institutionalisation As part of the SCP a handbook on urban air quality management has been produced (UNCHS/UNEP, 2001). Air Pollution in the Megacities of Asia Project In November 2000, the United Nations Environment Programme (UNEP), in collaboration with WHO, the Korea Environment Institute (KEI) and the Stockholm Environment Institute (SEI) initiated the Air Pollution in the Megacities of Asia (APMA) project to meet the need to strengthen air quality management (AQM) practice in major and mega cities in Asia. The project aims to build on the foundation provided by the GEMS/AIR programme and complement other urban air pollution initiatives by focusing on the development of policy to address urban air pollution in major and mega cities Asia. It aims to enhance the capacity of Asian governments and city authorities to deal with urban air pollution issues by establishing a network (asiairnet) to provide information on best practice, technical support and training, and to facilitate regional and local action plans for air quality management. As part of the APMA project a workshop on Air Pollution in Asian Megacities was held on 3–5 September, 2001 in Seoul which was attended by 50 participants from various Asian countries. This report is based on the contributions presented at the APMA Workshop.
6

REFERENCES Schwela, D (1999) Local Air Quality Management in McGranahan G and Murray, F (eds)
Health and Air Pollution in Rapidly Developing Countries, Stockholm Environment Institute, Stockholm, Sweden
UNCHS/UNEP (2001) Urban Air Quality Management Handbook, United Nations Commission for Humans Settlement/United Nations Environment Programme, Nairobi, Kenya
UNCSD (2001) Protection of the Atmosphere – Report to the Secretary General, E/CN.17/2001/2, Commission for Sustainable Development, New York, USA
UNDP (1999) Human Development Report 1999, UNDP, New York UNEP/WHO (1996) Air Quality Management and Assessment Capabilities in 20 Major
Cities, Marc, London UNEP/WHO (1992) Urban Air Pollution in Megacities of The World, Blackwell, London UNEP(1999) Global Environmental Outlook 2000, Earthscan, London UNESCAP (2000) State of the Environment in Asia and South Pacific 2000, United
Nations ESCAP, Bangkok, Thailand Walsh, M P (1999) ‘Motor Vehicle Pollution and its Control in Asia’ in McGranahan, G
and Murray, F Health and Air Pollution in Rapidly Developing Countries, Stockholm Environment Institute, Sweden
World Bank (1992) World Development Report 1992: Development and the Environment, Oxford University Press, New York
World Bank (1996) The World Urbanisation Prospects, DESA, New York WB/ADB (2001) Workshop Synthesis and Recommendations of the Regional Workshop on
the reduction of emissions from 2–3 Wheelers, 5–7 September, 2001, Hanoi, Viet Nam Whitelegg, J. and Williams, N. (2000) Non-motorised transport and sustainable
development: evidence from Calcutta, Local Environment, vol 5, no 1, pp7–18 WHO (1997) Health and Environment in Sustainable Development: Five years after the
Earth Summit, World Health Organization, Geneva WRI (1998) World Resources 1999-99, World Resources Institute, Oxford University
Press, New York
7
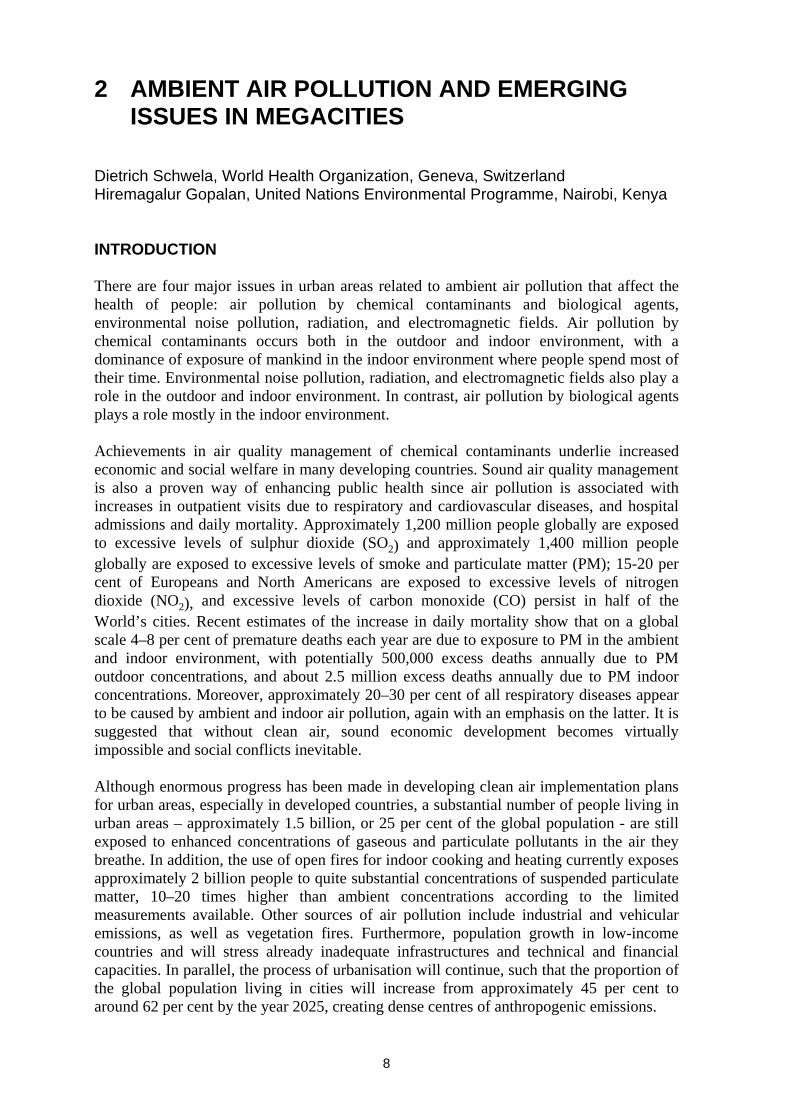
2 AMBIENT AIR POLLUTION AND EMERGING ISSUES IN MEGACITIES
Dietrich Schwela, World Health Organization, Geneva, Switzerland Hiremagalur Gopalan, United Nations Environmental Programme, Nairobi, Kenya
INTRODUCTION There are four major issues in urban areas related to ambient air pollution that affect the health of people: air pollution by chemical contaminants and biological agents, environmental noise pollution, radiation, and electromagnetic fields. Air pollution by chemical contaminants occurs both in the outdoor and indoor environment, with a dominance of exposure of mankind in the indoor environment where people spend most of their time. Environmental noise pollution, radiation, and electromagnetic fields also play a role in the outdoor and indoor environment. In contrast, air pollution by biological agents plays a role mostly in the indoor environment. Achievements in air quality management of chemical contaminants underlie increased economic and social welfare in many developing countries. Sound air quality management is also a proven way of enhancing public health since air pollution is associated with increases in outpatient visits due to respiratory and cardiovascular diseases, and hospital admissions and daily mortality. Approximately 1,200 million people globally are exposed to excessive levels of sulphur dioxide (SO2) and approximately 1,400 million people globally are exposed to excessive levels of smoke and particulate matter (PM); 15-20 per cent of Europeans and North Americans are exposed to excessive levels of nitrogen dioxide (NO2), and excessive levels of carbon monoxide (CO) persist in half of the World’s cities. Recent estimates of the increase in daily mortality show that on a global scale 4–8 per cent of premature deaths each year are due to exposure to PM in the ambient and indoor environment, with potentially 500,000 excess deaths annually due to PM outdoor concentrations, and about 2.5 million excess deaths annually due to PM indoor concentrations. Moreover, approximately 20–30 per cent of all respiratory diseases appear to be caused by ambient and indoor air pollution, again with an emphasis on the latter. It is suggested that without clean air, sound economic development becomes virtually impossible and social conflicts inevitable. Although enormous progress has been made in developing clean air implementation plans for urban areas, especially in developed countries, a substantial number of people living in urban areas – approximately 1.5 billion, or 25 per cent of the global population - are still exposed to enhanced concentrations of gaseous and particulate pollutants in the air they breathe. In addition, the use of open fires for indoor cooking and heating currently exposes approximately 2 billion people to quite substantial concentrations of suspended particulate matter, 10–20 times higher than ambient concentrations according to the limited measurements available. Other sources of air pollution include industrial and vehicular emissions, as well as vegetation fires. Furthermore, population growth in low-income countries and will stress already inadequate infrastructures and technical and financial capacities. In parallel, the process of urbanisation will continue, such that the proportion of the global population living in cities will increase from approximately 45 per cent to around 62 per cent by the year 2025, creating dense centres of anthropogenic emissions.
8

This is reflected in the increase in the number of megacities as follows: 1990 68 cities with more than 3 million people 2000 66 cities with more than 4 million people 2025 135 cities with more than 4 million people. Agenda 21, the outcome of the United Nations Conference on Environment and Development in Rio, 1992, states in Chapter 6 on ‘human health and environmental pollution’ that nationally determined action programmes in this area, with international assistance, support and coordination where necessary, should include (UNCED 1992):
(a) Urban air pollution: (i) Develop appropriate pollution control technology on the basis of risk
assessment and epidemiological research for the introduction of environmentally sound production processes and suitable safe mass transport.
(ii) Develop air pollution control capacities in large cities, emphasizing enforcement programmes and using monitoring networks, as appropriate.
(b) Indoor air pollution:
(i) Support research and develop programmes for applying prevention and control methods to reducing indoor air pollution, including the provision of economic incentives for the installation of appropriate technology.
(ii) Develop and implement health education campaigns, particularly in developing countries, to reduce the health impact of domestic use of biomass and coal.
In comparison to other pollutants, environmental noise has always been an underestimated environmental problem. The noise problems of modern societies are characterised by an immense number of cars in cities and the countryside. There are heavily laden lorries with diesel engines, badly silenced both for engine and exhaust noise, in cities and on highways day and night. Aircraft and trains add to the environmental noise burden. In industry, machinery emits high noise levels and amusement centres and pleasure vehicles detract from leisure time relaxation. The control of environmental noise, however, has been hampered by insufficient knowledge of its effects on humans and of dose-response relationships as well as a lack of defined criteria. While it has been suggested that noise pollution is primarily a “luxury” problem for developed countries, one cannot ignore the fact that exposure is often higher in developing countries, due to bad planning and poor construction of buildings. The effects of noise are just as widespread in these countries and the long-term consequences for health are the same. In this perspective, practical action to limit and control exposure to environmental noise are essential. Such action must be based upon proper scientific evaluation of available data on effects, and particularly dose-response relationships. The basis for this is the process of risk assessment and risk management. Radiation problems in modern societies are primarily those emerging from ultraviolet radiation (UVR) and from natural and artificial radioactivity. UVR has natural and artificial sources, the focus of interest has shifted from artificial to natural UVR, emitted from the sun. UVR has harmful and relatively few beneficial effects for humans. Natural radioactivity accounts for most human irradiation. Radon, a disintegration product of uranium and its decay products, is the main source of exposure to natural radioactivity. Radon is universally present, but rates of emissions mostly from soil, to a lesser extent from construction materials, and to a minor extent from underground water, natural gases,
9

coal and oceans, may vary markedly over time. The public health risk posed by radon is essentially related to exposure to this gas within buildings. Everyone in the world is now exposed to a complex mix of electromagnetic fields frequencies (EMF). EMF has become one of the most pervasive environmental influences, and exposure levels at many frequencies are increasing significantly as the technological revolution continues unabated and new applications using different parts of the spectrum are found. Major sources of EMF include electric power generation, distribution and use, transportation systems, telecommunications facilities and associated devices such as mobile telephones, medical and industrial equipment, radar and radio and television broadcast antennas. Possible health effects of exposure to EMF have led to concerns among the general public and workers that appear to go well beyond those that are attributed to well-established risks. AIR POLLUTION LEVELS AND TRENDS IN DEVELOPED COUNTRIES The air pollution indicators in the cities of developed countries include three major air pollution situations (EEA, 1995; EEA, 1998): • winter-type smog due to SO2 and PM (as measured by the black smoke (BS) or
gravimetric methods); • summer-type smog due to ozone (O3) as resulting from emissions of volatile organic
compounds (VOCs) and nitrogen oxides (NOx); and • high annual average concentration levels (including benzene, benzo[a]pyrene (BaP),
and lead, in addition to SO2 and PM). Seventy to eighty per cent of all surveyed cities of more than 500,000 inhabitants exceeded the 1987 WHO air quality guidelines (WHO/EURO, 1987) during episodes of winter-type smog. During days with poor dispersion conditions, air pollutant concentrations are approximately double the 1987 WHO guidelines in about 28 per cent of cities. High PM concentrations dominate in most of the cities. While the coarse particle fraction decreases, the fraction of fine and ultrafine particles appears to be increasing. Annual mean concentrations of SO2 in major European and American cities are now largely below 100 µg/m3; daily mean concentrations are below 500 µg/m3. Annual mean NO2 concentrations in urban areas throughout developed countries range between 20 and 90 µg/m3. Highest one-hour averages can reach 1,000 µg/m3. High levels of NO2 of the order of 200 µg /m3 during several days have been observed in homes with unvented combustion devices. Even higher values in the mg/m3 region have been estimated for indoor skating rinks. In summer-type smog, the produced O3 will be found downwind of the area of emissions. An exception is when cities are located in confined valleys, or when the air is trapped by special meteorological conditions for significant photo-oxidation to take place. Examples of such cities where high O3 concentrations reach 400 µg/m3 include Athens, Barcelona and Los Angeles. In the close vicinity of streets, and depending on the actual traffic and dispersion conditions, short-term maximum concentrations of CO, NO2 and PM may exceed air quality guidelines or standards by a factor 2 to 4. Road transport is a significant source of smog-inducing pollutants and elevated long-term average concentrations of NO2, PM, lead,
10

VOCs, benzo[a]pyrene (BaP) and benzene. For PM, fine (less than 2.5 µm aerodynamic diameter) and ultrafine particles (less than 0.1 µm aerodynamic diameter) are prevalent. In the streets of large European cities, the eight-hour average CO concentrations are generally between 1 and 20 mg/m3. In such areas, the concentrations measured inside vehicles are, in general, two-to-five times higher than those measured in the ambient air. In environments with insufficient ventilation (such as tunnels, car parks, etc.) CO levels may be much higher than common ambient levels. In indoor ice arenas and arenas of indoor motor shows very high CO concentrations of 2-150 mg/m3 as one-hour averages frequently occur. Environmental tobacco smoke (ETS) in indoor environments can raise eight-hour CO concentrations up to 50 mg/m3. Concentrations of lead (Pb) range from below 0.1 to 1 µg/m3 in urban areas of countries where most fuel is unleaded. Concentrations in excess of 1 µg/m3 are found in urban areas of developing countries where leaded fuels are still in use. Around metal smelters without modern pollution abatement equipment, lead concentrations are approximately 10 µg/m3 (WHO, 1995). Air Management Information System Krzyzanowski and Schwela (1999) analysed the air pollution situation of cities in developing countries. Their observations are based on the data collected in the database of the recently updated Air Management Information System (AMIS) (Schwela, 1999; WHO, 1998; WHO, 2001a). In most of the 150 cities presented in this database, the annual mean concentrations of SO2 in residential areas did not exceed 50 µg/m3. Notable exceptions are several cities in China, India and Nepal, where SO2 concentrations exceeding 100 µg/m3. In most of the cities having data which allow trend assessment, a decline in mean annual SO2 concentration was seen during the 1990s. In Chinese cities, an annual decline rate of between 1–10 per cent was observed. With respect to PM, the most commonly reported indicator is the mass of total suspended particles (TSP). In many cities the TSP annual mean concentration exceeds 100 µg/m3, with the levels exceeding 300 µg/m3 in several cities of China and India. In a limited number of cities the mass concentration of particles with aerodynamic diameter less than 10 µm (PM10) is also measured. In Asian cities, an increase in PM10 concentration was experienced in the 1990s. This increase has occurred even when a reduction in TSP was reported. An opposite trend and a reduction in PM10 level were seen in cities of Central and South America. In most of the cities reporting to AMIS, the annual mean concentration of NO2 remains moderate or low, not exceeding 40 µg/m3. Trends vary between the cities but a 5–10 per cent annual increase was more common than a decrease in concentration of this pollution. The highest NO2 levels, and the increasing trends, are observed in the cities with high and increasing car traffic. In South Asia or in Latin America, this high NO2 concentration combined with the intensive UV radiation results in photochemical smog with high O3 concentrations. The concentrations of air pollution in major and megacities of developing countries reach levels of concern for public health. Vehicle emissions are a major and increasing
11

contributor to air pollution in developing as well as developed countries as a result of the continuing rise in vehicle numbers (see Figure 2.1).
5.352.3
129.1
17.4
184.7
2.3
11.1
93.2
191
32.3
208.6
5.5
18.6
127.3
256.5
44.2
223.2
6.4
0
100
200
300
400
500
600
700
1980 1990 1996
Africa
Figure 2.1 Number (in millions) and spatial distribution of vehicles in the world Source: UNEP (1999) Outdoor air pollution is not the only problem related to air in developing countries. Indoor air pollution in developing countries plays a much more important role due to the fact that ovens and braziers used for cooking and heating in households lead to much higher air pollutant concentrations indoors than those observed in urban areas of developed or developing countries (WHO, 1992; Smith, 1996; Bruce et al., 2000). The resulting human exposures to suspended particulate matter, CO, and NOx often exceed WHO guidelines by factors of 10, 20, or even more (WHO, 1992). Current and projected use of biomass fuels in the various regions are depicted in Figure 2.2, expressed as a percentage of total domestic fuel use. Particularly in Sub-Saharan Africa, the expected decrease in the use of biofuels is rather small.
Asia and the Pacific Europe and Central Asia
Latin America and the Caribbean North America West Asia
2010
0 10 20 30 40 50 60 70 80 9
Latin Am erica and theCaribbean
North A frica and M iddleEast
East Asia and Pacific
South Asia
Sub-Saharan A frica
1990 2000
0
Figure 2.2 Current and projected use of biomass fuels by region Source: WRI/UNEP/UNDP/WB (1998)
12

CLASSIFICATION OF HEALTH EFFECTS OF AIR POLLUTANTS ON VARIOUS COMPARTMENTS OF THE HUMAN BODY The health impacts of air pollutants are numerous and varied and can become manifest in any compartment of the human body. Compartments affected include the respiratory system, immune system, skin and mucous tissues, sensory system, central and peripheral nervous system, and the cardiovascular system. Health effects of air pollution on the respiratory system (lower airways) include acute and chronic changes in pulmonary function, increased incidence and prevalence of respiratory symptoms, sensitisation of airways to allergens, and exacerbation of respiratory infections such as rhinitis, sinusivitis, pneumonia, alveolitis, and legionnaires´ disease. Principal agents for these health effects are the combustion products SO2, NO2, PM10 and CO. In addition, indoor air pollutants - fine PM from ETS, formaldehyde, and infectious organisms - can also act as important agents. Health effects of air pollution on immune system allergies manifest themselves in exacerbation of allergic asthma, allergic rhino-conjunctivitis, extrinsic allergic alveolitis/hypersensitivity pneumonitis, and can produce permanent lung damage in sensitised individuals including pulmonary insufficiency. Principal agents are known to be outdoor allergens and indoor air agents such as house mite dust, cockroaches, organisms living in the pelt of pets, insects and moulds in high humidity environments. Multi-centre studies have shown different spatial patterns of allergic disease (e.g. asthma, rhinitis and eczema) as well as allergic hyper-sensitisation. These variations cannot be reconciled by geographical differences in allergen exposure since the major aeroallergens are widespread. There are significant differences in the prevalence of hay fever and asthma between Eastern and Western Europe. Health effects of air pollution on the skin and on mucous tissues (eyes, nose, throat) are mostly irritating effects. Primary sensory irritations include dry - sore - throat, tingling sensation of nose, and watering and painful eyes. Secondary irritation is characterised by oedema and inflammation of the skin and mucous membranes up to irreversible changes in these organs. Principal agents include volatile organic compounds, formaldehyde and other aldehydes (e. g. acetaldehyde, acrolein) and ETS. Sensory effects of air pollution include nuisance and annoyance reactions caused by perception of air pollutants through sensory organs. VOCs, formaldehyde and ETS can act as principal agents. Effects of air pollution on the central nervous system manifest themselves in damage of the nerve cells, either toxic or hypoxic/anoxic. Principal agents are VOCs (acetone, benzene, toluene, formaldehyde), CO and pesticides. In infants and young children, neuro-physiological changes caused by Pb can result in developmental retardation and irreversible deficiencies. Effects of air pollution on the cardiovascular system develop through reduced oxygenation and result in increased incidence and prevalence of cardiovascular diseases, myocardial infarction, and consequent increase in mortality caused by cardiovascular diseases. Principal agents are CO, PM, and ETS. Carcinogenic effects of air pollution are associated with lung cancer, skin cancer, and leukaemia. Principal agents for lung cancer have been identified as arsenic, asbestos fibres,
13

chromium, nickel, cadmium, polycyclic aromatic hydrocarbons (PAH), trichloroethylene, ETS, and radon. Benzene is known to produce leukaemia, and ultraviolet radiation is a causative agent of skin cancer. A difficult and largely unresolved question is that of synergism among the different carcinogenic compounds and between carcinogenic and non-carcinogenic agents. HEALTH EFFECTS IN CHILDREN In 1990, the World Summit for Children was convened in order to address the desire to provide a better future for every child in the world. For the Summit, UNEP and UNICEF published the 1990 Children and the Environment report, with the message that “environmental degradation is killing children.” This theme recognizes that a clean, healthy environment is the first step toward providing a better future for children. However, in the years that have passed since the Summit and the publication of the report, many problems have persisted while others have arisen (UNEP/UNICEF, 1990). Table 2.1 illustrates some of the health endpoints that are affected by environmental factors including global environmental change. Children are especially vulnerable to the adverse effects of air pollution because of their physical characteristics and their childhood behaviour. Children’s intake of contaminants is greater than that of adults because per unit of body weight, they eat, drink, and breathe more, and their surface area to volume ratio is nearly three times that of an adult. Body functions, such as detoxification, metabolic changes, and excretion of toxins are also different than those in adults. The immune system, nervous system, and organs of children are not yet fully developed. During growth, children may sustain permanent damage (CICH, 2000). Figure 2.3 illustrates these points. Table 2.1 Health impacts related to environmental factors
Environmental factors Health impacts Polluted
Air Global
Environmental Change
Acute Respiratory Infections ● Diarrhoea-related Diseases ● Malaria and Other Vector-Borne Diseases ● Injuries and Poisonings ● ● Cardiovascular Diseases ● ● Cancer ● ● Chronic Respiratory Disease ●
Source: Adapted from UNEP (1999)
14

Effects on: Organs Systems
Functions Development
Vulnerability Breathing
Body Mass & Height GI & Skin Absorption
Metabolism Developing
Immature systems
Risks Physical Chemical Biological
Circumstances Eating, Drinking, Playing, Learning,
Working, Scavenging
Media Water - Air - Food
Soil - Objects
Settings Home - SchoolField - Street Workplace
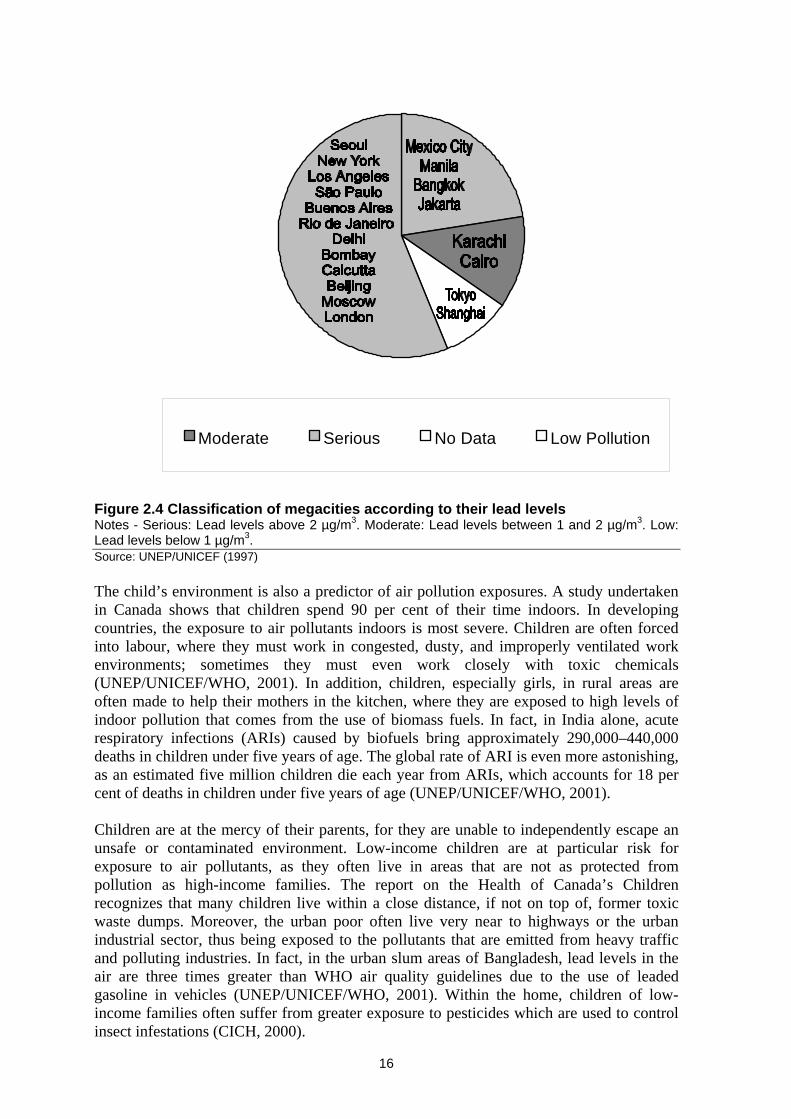
Figure 2.3 Air pollution and children’s vulnerability Source: WHO (2001) The concept of Disability Adjusted Life Years (DALYs) was created from attempts to assess the burden of disease by calculating the years of life lost to those diseases. Obviously, the number of DALYs is greatest when children succumb to disease, because they lose many more years of their lives as compared to adults. The diseases that cause the most DALYs are more likely to affect children than adults, for they include acute respiratory infections, diarrhoea, and malaria. Therefore, to reduce the burden of disease, as measured by DALYs, the first step it to lessen the impacts of diseases on children. One third of the burden of disease in the world today is attributable to environmental risk factors; and of that burden, 40 per cent is borne by children (UNEP/UNICEF/WHO, 2001) In 1990, 30 per cent of all deaths occurred before 15 years of age. However, for acute respiratory diseases, 60 per cent of deaths were of children below 15 years. The health impacts of lead are especially exaggerated in children because it affects the body during the crucial development. Lead poisoning in children can cause hyperactivity and reduce their ability to pay attention and remain alert. Furthermore, children have been known to develop learning disabilities because reading becomes more difficult and intelligence quotients decrease. The consequences of lead poisoning are not as extreme in adults, as their brain development is already complete. At high levels of exposure to lead, the results are the same for adults and children, including organ damage, coma, or death. Figure 2.4 show the lead contamination in 20 megacities (UNEP/UNICEF, 1997).
15
No Data
Moderate Serious Low Pollution
Figure 2.4 Classification of megacities according to their lead levels Notes - Serious: Lead levels above 2 µg/m3. Moderate: Lead levels between 1 and 2 µg/m3. Low: Lead levels below 1 µg/m3. Source: UNEP/UNICEF (1997) The child’s environment is also a predictor of air pollution exposures. A study undertaken in Canada shows that children spend 90 per cent of their time indoors. In developing countries, the exposure to air pollutants indoors is most severe. Children are often forced into labour, where they must work in congested, dusty, and improperly ventilated work environments; sometimes they must even work closely with toxic chemicals (UNEP/UNICEF/WHO, 2001). In addition, children, especially girls, in rural areas are often made to help their mothers in the kitchen, where they are exposed to high levels of indoor pollution that comes from the use of biomass fuels. In fact, in India alone, acute respiratory infections (ARIs) caused by biofuels bring approximately 290,000–440,000 deaths in children under five years of age. The global rate of ARI is even more astonishing, as an estimated five million children die each year from ARIs, which accounts for 18 per cent of deaths in children under five years of age (UNEP/UNICEF/WHO, 2001). Children are at the mercy of their parents, for they are unable to independently escape an unsafe or contaminated environment. Low-income children are at particular risk for exposure to air pollutants, as they often live in areas that are not as protected from pollution as high-income families. The report on the Health of Canada’s Children recognizes that many children live within a close distance, if not on top of, former toxic waste dumps. Moreover, the urban poor often live very near to highways or the urban industrial sector, thus being exposed to the pollutants that are emitted from heavy traffic and polluting industries. In fact, in the urban slum areas of Bangladesh, lead levels in the air are three times greater than WHO air quality guidelines due to the use of leaded gasoline in vehicles (UNEP/UNICEF/WHO, 2001). Within the home, children of low-income families often suffer from greater exposure to pesticides which are used to control insect infestations (CICH, 2000).
16

The poor nutrition that is associated with low-income families may also magnify the health problems that come from air pollution. If a pollution-related disease impairs a child’s immune system, the disease will become more serious if the child does not have the adequate nutrition to regain strength (CICH, 2000). Exposure to air pollutants comes from different sources and has different effects depending on the stage of a child’s development. In the womb, a child is vulnerable to the mother’s activities and exposure to toxins. Mothers have been known to transfer lead, mercury, pesticides, and persistent organic pollutants to their unborn children through the placenta. Thus, if the mother is careless about her health, her child suffers. Tobacco smoke consists of up to 4,000 chemical compounds, including carbon monoxide and formaldehyde, all of which can be passed to a growing foetus (NSC, 2000). As an infant, the child’s body is not yet mature, which means that exposure to environmental contaminants could permanently disrupt a child’s development. While children do engage in behaviour that puts them at increased risk for contamination from pollutants, mothers continue to be vehicles for transmitting pollutants to their children during their infancy. Organic pollutants are known to accumulate in body fats, which are then transferred to children through breast milk. For the majority of children worldwide, breast-feeding is the only source of nutrition. Therefore, mothers who are exposed to pollutants may inadvertently subject their children to adult doses of contaminants through breast milk (CICH, 2000). It is particularly important to protect children from exposure to toxins during the early stages of their lives, as half of all intellectual development potential is established by the time a child is four years of age (UNEP/UNICEF/WHO, 2001). However, while the environments in which children live are important in any analysis of air pollution exposure, the behaviour of children within those surroundings should not be ignored. In general, children are more active than adults are; their curiosity and energy urge them to explore their surroundings, often exposing them to a broad range of contaminants that are particular to their childhood environments. Because children are very active, they breathe rapidly, increasing their intake of pollutants. The area where they are most active is near the ground, both indoors and outdoors, which exposes them to a range of pollutants that adults are able to escape. Airborne pollutants are often deposited on the earth in the dust. When children play on the ground, they agitate the dusts, making the pollutants prime targets for inhalation (CICH, 2000). Children’s curiosity drives them to explore the things they do not understand. They do this, however, in a way unlike that of adults. Children use the hand-to-mouth approach to investigate their surroundings, which again, exposes them to a range of pollutants. Air pollution that has settled onto children’s playthings is ingested as they explore, which has been proven by the discovery of pesticide residue on various toys (CICH, 2000). The serious health effects of air pollution are increasing. Asthma in children has risen in recent years, and in the United States alone, 4.8 million children suffer from asthma (UNEP/UNICEF/WHO, 2001). Incidences of acute lymphocytic leukaemia, tumours of the central nervous system, and bone tumours have increased by 25 per cent in children under the age of 15 in the past 25 years. Organic pollutants, such as dioxins, PCBs, and DDT are known to be endocrine disrupters, which may cause early puberty in girls and serious problems later in life, including infertility, breast cancer, and testicular cancer. An example of the scale of exposure of children to air pollution is provided in Figure 2.5 which shows the percentage of children in the USA living in areas with high ozone levels.
17

6 1 . 3
6 9 . 2 6 7 . 7
5 0 . 8
0
10
20
30
40
50
60
70
Percentage
African-American
Hispanic Asian-American Caucasian
Race
Figure 2.5 Percentage of children in the United States living in areas with high ozone levels, by race Source: ALA (2000) Currently, the monitoring and assessment of air pollution and its effects on children’s health is insufficient and there is a need to improve indicators of environmental health. ACTUAL HEALTH EFFECTS OF AIR POLLUTION IN DEVELOPED COUNTRIES The present situation with respect to epidemiological studies can be summarised as follows. Sulphur Dioxide Short-period exposures (up to 1 hour) Information on the acute effects of SO2 comes from controlled chamber experiments on volunteers exposed to SO2 for periods ranging from a few minutes up to one hour. Acute responses include reductions in the mean forced expiratory volume over one second (FEV1), increases in specific airway resistance, and symptoms such as wheezing or shortness of breath. Such effects occur within the first few minutes after commencement of inhalation and do not increase with further exposure. Exercise enhances these effects, as it allows SO2 to penetrate further into the respiratory tract. A wide range of sensitivity has been demonstrated, both among normal subjects and among those with asthma, which are the most sensitive group (Schlesinger, 1999; WHO/EURO, 2000). Exposure over a 24-hour period At low levels of exposure (mean annual levels below 50 µg/m3; daily levels usually not exceeding 125 µg/m3), epidemiological studies have demonstrated effects on mortality (total, cardiovascular and respiratory) and on hospital emergency admissions for total respiratory causes and chronic obstructive pulmonary disease (WHO/EURO, 2000; Schwela, 2000a). These results have been shown, in some instances, to persist when black smoke and PM levels were controlled for. No obvious threshold levels for SO2 have been identified.
18

Long-term exposure Several ecological studies including those of the Air Pollution and Health: A European Approach (APHEA) project showed a significant increase in total mortality, cardiovascular mortality and respiratory mortality with an increase in SO2. Some studies included the analysis of the influence of other compounds in the air pollutant mix and meteorological variables. However, in the APHEA studies multi-pollutant models were not applied. Other recent studies could not establish a significant increase in total mortality with increase in SO2 in the presence of other pollutants, except under special seasonal conditions (Schwela, 2000a). With respect to morbidity (hospital admissions for cardiovascular or respiratory diseases) an increase in SO2 was significantly associated with an increase in adverse health effects, even when other pollutants were considered. However, most other studies within the APHEA project did not give significant results (Schwela, 2000a). Nitrogen Dioxide Short-term exposure effects Normal healthy adults, exposed at rest or with light exercise for less than two hours to concentrations above 4,700 µg/m3, experience pronounced decreases in pulmonary function; generally, normal subjects are not affected by concentrations less than 1,880 µg/m3. In a small group of mild asthmatics during intermittent exercise, the lowest concentration causing effects on pulmonary function was reported from exposure to 565 µg NO2/m3 for 30–110 minutes. Some studies show increased responsiveness to bronchoconstrictors at levels as low as 376–565 µg NO2/m3; in other studies, higher levels had no such effect (Hazucha, 1999; Schwela, 2000a). Long-term exposure effects Children with long-term outdoor NO2 exposures exhibit increased respiratory symptoms and show a decrease in lung function. Such effects were not observed in adults; however, in some studies gas cooking was related to respiratory symptoms and reduction in lung function suggestive of asthma, in adults. NO2 at levels of several hundred micrograms per cubic metre can slightly affect the specific airway response of persons with asthma to inhaled allergens. Aggravation of asthma may be related to daily variations in NO2. Several studies have detected significant associations between NO2 exposure and respiratory symptoms while other studies could not establish such associations (Hazucha, 1999; Schwela, 2000). Outdoor NO2 epidemiological studies, as well as indoor studies, provide little evidence that long-term ambient NO2 exposures are associated with health effects in adults (WHO/EURO, 2000). There is still not enough evidence from epidemiological studies for the existence of a causal relationship between NO2 and observed health effects (Ackermann-Liebrich and Rapp, 1999). From the existing evidence however, it can , be concluded that NO2 contributes to the health effects observed. Carbon Monoxide The toxic effects of CO first become evident in organs and tissues with high oxygen consumption, such as the brain, heart, exercising skeletal muscle and the developing foetus. Severe hypoxia due to acute CO poisoning may cause both reversible, short-lasting, neurological deficits and severe, often delayed, neurological damage. The neuro-behavioural effects include impaired coordination, tracking, driving ability, vigilance and
19

cognitive performance at COHb levels between 5–8 per cent. Behavioural effects of CO exposure, such as vision impairment, have been found to start at COHb levels above 18 per cent ((Maynard and Waller, 1999; WHO, 1999). The pregnant mother, the foetus and the newborn infant are at high risk of adverse health effects from CO exposures. During pregnancy, maternal COHb levels are usually about 20 per cent higher than the non-pregnant values, the foetal COHb levels are as much as 10-15 per cent higher than the maternal COHb levels (WHO, 1999). Endogenous production of CO results in COHb levels of 0.4-0.7 per cent in healthy subjects. During pregnancy, elevated maternal COHb levels of 0.7-2.5 per cent have been reported, mainly due to increased endogenous production. The COHb levels in non-smoking general populations are usually 0.5-1.5 per cent due to endogenous production and environmental exposures. Non-smoking people in certain occupations (car drivers, policemen, traffic wardens, garage and tunnel workers, firemen etc.) can have long-term COHb levels up to 5 per cent, and heavy cigarette smokers have COHb levels up to 10 per cent (WHO, 2000b). Well-trained subjects engaging in heavy exercise in polluted indoor environments can increase their COHb levels quickly up to 10–20 per cent. In apparently healthy subjects, the maximal exercise performance decreases at COHb levels as low as 5 per cent. The regression between the percentage decrease in maximal oxygen consumption and the percentage increase in COHb concentration appears to be linear, with a fall in oxygen consumption of approximately 1 per cent for each 1 per cent rise in COHb level above 4 per cent. Post-exposure COHb levels of 2.9–5.9 per cent have been associated with a significant shortening in the time to onset of angina, with increased electrocardiographic changes and with impaired left ventricular function during exercise. In addition, ventricular arhythmias may be increased significantly at a mean post-exercise COHb level of 5 per cent. COe from smoking and environmental or occupational exposures may contribute to cardiovascular mortality and to the early course of myocardial infarction (WHO, 1999). A relationship between CO and daily respiratory mortality could not be established consistently. In contrast, an association between ambient CO and cardiovascular mortality and hospital admissions due to cardiovascular diseases appears to persist even at very low CO levels indicating no threshold for the onset of these effects. It was suggested that ambient CO may have more serious health consequences than the COHb formation, and at lower levels than that mediated through elevated COHb levels (WHO, 1999; Schwela, 2000). Ozone Ozone toxicity occurs in a continuum in which higher concentrations, longer exposure duration, and greater activity levels during exposure cause greater effects. Short-term acute effects of O3 include pulmonary function reduction, increased airway responsiveness and airway inflammation, aggravation of pre-existing respiratory diseases such as asthma, increases in daily hospital admissions and emergency department visits for respiratory causes, and excess mortality (Thurston and Ito, 1999; WHO/EURO, 2000). Pulmonary function changes, increased airway responsiveness and airway inflammation, and other symptoms are statistically significant at 160 µg/m3 for 6.6 hour exposures in a group of healthy exercising adults, with the most sensitive subjects experiencing a more than 10 per cent functional decrease within 4–5 hours. Controlled exposure of heavily exercising adults,
20

or children to an O3 concentration of 240 µg/m3 for 2 hours, also produced decreases in pulmonary function (WHO/EURO, 2000). With one- to three-hour O3 exposures of healthy subjects during moderate –to heavy exercise, pulmonary function changes have been reported for FEV1 and the forced vital capacity (FVC), airway resistance, and respiratory frequency (WHO/EURO, 2000). Substantial acute adverse effects occur during exercise with one hour exposure to concentrations of 500 µg/m3 or higher, particularly in susceptible individuals or subgroups. Field studies in children, adolescents, and young adults have indicated that a reduction in pulmonary function can occur as a result of short term exposure to O3 concentrations in the range 120-240 µg/m3 and higher. Mobile laboratory studies have observed changes in pulmonary function in children or asthmatics exposed to O3 concentrations of 280–340 µg/m3 for several hours. Respiratory symptoms, especially coughing, have been associated with O3 concentrations as low as 300 µg/m3. Ozone exposure has also been reported to be associated with increased respiratory hospital admissions and exacerbation of asthma. Daily mortality was significantly associated with various O3 measures in several cities. The association between daily mortality and O3 levels remained significant when other pollutants and confounding variables were included. In other studies no significant influence of O3 levels on daily mortality was found in multi-pollutant models. In a synthesis analysis of seven studies using a non-linear temperature a relative risk for daily mortality of 1.056 per 200 µg/m3 increase in daily one-hour maximum O3 was estimated (Thurston and Ito, 1999). The association between O3 levels and daily hospital admissions is linear, and with 10 µg/m3 increase in O3 concentration the risk increases by 2 per cent (WHO 2000a; WHO/EURO, 2000). Studies also found significant associations between O3 and total respiratory admissions. In a multi-pollutant study of hospital admissions for respiratory diseases a clear and statistically significant association between O3 and hospital admissions was established, and the effect of SPM was greatly reduced in the multi-pollutant model (Thurston and Ito, 1999). Ozone was also positively and significantly associated with pneumonia and COPD admissions. In the APHEA ecological studies, consistent associations between O3 and hospital admissions for respiratory diseases were reported. Particulate Matter Health effects of SPM in humans depend on particle size and concentration, and can fluctuate with daily fluctuations in PM10 (particles below 10 µm aerodynamic diameter) or PM2.5 (particles below 2.5 µm aerodynamic diameter) levels. They include acute effects such as increased daily mortality, increased rates of hospital admissions for exacerbation of respiratory disease, fluctuations in the prevalence of bronchodilator use and cough and peak flow reductions (WHO/EURO, 2000; Pope, 2000a; Pope, 2000b). The relative risk of mortality, estimated from about 60 studies in 35 cities, increased steadily with particle concentration, usually in a linear or quasi-linear way. These studies did not observe a threshold for the onset of health effects from particle exposure. Increased daily mortality occurred concurrently within 1–5 days following an increase in particle concentrations. Changes in daily mortality were estimated as 0.5–1.5 per cent per 10 µg/m3 increase in PM10 concentrations, or about 5–6 µg/m3 increase in PM2.5 concentrations (Pope, 2000a). A breakdown of mortality by respiratory and cardiovascular causes showed that the percentage of excess deaths due to PM exposure is mostly due to cardiovascular disease (Pope, 2000a). Studies on daily counts of hospital admissions have evaluated associations
21

between respiratory/cardiovascular hospital admissions and PM exposure. With respect to lung function and respiratory symptoms, associations with lower respiratory symptoms and cough were significant. Exacerbation of asthma, based on recorded asthma attacks or increased bronchodilator use, were also associated with PM exposure (WHO/EURO, 2000; Pope, 2000a). Evidence is also emerging that long-term exposure to low concentrations of PM in air is associated with mortality and other chronic effects, such as increased rates of bronchitis and reduced lung function. Two cohort studies conducted in the USA indicate positive associations between cardiopulmonary deaths and long-term PM exposure (Pope, 2000a; WHO/EURO, 2000). These studies suggest that life expectancy may be 2–3 years shorter in communities with high PM than in communities with low PM. A further study of post-neonatal mortality among approximately 4 million infants in 86 US metropolitan areas stated that particle exposure was associated with post neonatal infant mortality for all causes, respiratory causes, and sudden infant death syndrome. The results of most of these studies and the role of PM with respect to health effects were re-evaluated and confirmed by the Health Effects Institute (HEI, 1995; HEI, 2000a; HEI, 2000b). Lead The most important effect of lead is shown in the association between lead exposure and a reduction in measures of child intelligence, although the effects are small compared, for instance, with parental and social influences. Meta-analyses of cross-sectional and prospective studies in developed countries indicated that a doubling of blood lead concentration from 100 to 200 µg/l is associated with a mean deficit of 1–2 IQ points (Wadge, 1999). ACTUAL HEALTH EFFECTS OF AIR POLLUTION IN DEVELOPING COUNTRIES The effects of air pollutants on health vary depending on several factors. These include the level of exposure and the susceptibility of the exposed population. The susceptibility of the population is affected by factors such as the numbers of young children and older people, as well as the proportion of people suffering from asthma and other chronic respiratory conditions. Epidemiological studies reflect this variation in sensitivity by showing different associations between levels of exposure and health effects for different sub-populations. In addition, sources and patterns of exposure, (e.g. indoor versus outdoor exposure) are likely to differ substantially from region to region. These factors and the variation in response-concentration relationships are powerful arguments for health studies being undertaken in the different world regions on the effects of air pollutants. It could be a mistake to simply adopt exposure-response relationships derived from studies in developed countries for general use. Unfortunately, only few epidemiological studies have been undertaken in developing countries in order to determine exposure-response relationships. Results of these studies are summarised below for the individual compounds (WHO, 2000a). Sulphur Dioxide In Chile, close to an industrial area where SO2 annual means ranged from 101–145 µg/m3, and maximum daily averages from 405–1230 µg/m3, an increase of 50 µg/m3 in the SO2 daily mean value was related to a 4 per cent increase in cough frequency, a 3 per cent increase in phlegm production, and a 4 per cent increase in wheeze occurrence. A significant change in evening peak flow measurements was also observed. No effects were observed in children without chronic respiratory symptoms. In this study, health effects
22
were observed at levels lower than 125 µg/m3 (the WHO guideline). However, SO2 may have interacted with PM10 levels, which ranged from 5 to 125 µg/m3 in this study. In two areas, where PM10 annual means were low, the prevalence of chronic cough was 30 per cent at 130 µg/m3 (annual mean over 3 years) and 14 per cent at 70 µg/m3; similarly wheezing occurred in 14 per cent of children in the area with the higher SO2 concentrations and 6 per cent in the lower concentration area (WHO, 2000a). Epidemiological investigations in China show short-term exposure to 280 µg/m3 SO2 was correlated with apparent effects on the health of traffic police, whose respiratory function was reduced by 29-64 per cent and whose incidence of chronic rhinitis and pharyngitis was raised by 30-90 per cent compared with the control group. Where the annual average air concentration of SO2 was 260 µg/m3, secondary and elementary school students had a much higher incidence of chronic respiratory diseases than in less polluted areas. Under long exposure to an annual average of 175 µg SO2/m3 (with 550 µg/m3 also present), the three-year average mortality from pulmonary heart disease and respiratory diseases in the community was twice that of the control group (WHO 2000a). At annual average concentrations of 140 µg SO2/m3 (with 150 µg/m3 total particulate matter), SO2 is associated with significantly lower levels of lung function in children at the ages of 10–12. The forced vital capacity of women was significantly decreased under the same conditions. Nitrogen Dioxide In a preliminary study conducted in São Paulo, Brazil, a 75 µg/m3 increase in NO2 was related to a 30 per cent increase in mortality for respiratory illness among children less than five years old. Studies on 60 healthy Beijing children aged 9–11 years, and exposed to NO2 at a daily average level of 70–110 µg/m3, with the peak values of 150–260 µg/m3 for two months, reported a negative correlation between NO2 concentration and peak expiratory flow rates. In consequence, increased NO2 levels could affect children's respiratory function, aggravate air duct blocking and subsequently reduce peak expiratory flow rates. Carbon Monoxide In Cairo, CO concentrations above the WHO Guidelines for Air Quality values resulted in high levels of COHb in the blood of traffic policemen, sometimes reaching more than 10 per cent. A significant direct relationship between ischaemic heart disease and COHb level in Cairo traffic policemen was also observed. Research on the effect of indoor CO on children aged 8–13 years showed that for rooms with individual heating the average CO content was 12.4 mg/m3 and the COHb blood levels in these children was slightly above 4 per cent. In rooms with central heating, the CO concentration was 6.4 mg/m3 and the COHb level was 1.8 per cent. Ozone Several studies conducted on children in Mexico City have illustrated the association of acute peak daily O3 concentration with respiratory health. A 106 µg/m3 rise in the mean 48-hour O3 levels was associated with a decrease of 2 per cent in FEV1, and a 7.4 per cent decrease in the forced expiratory flow FEF25-75. A greater decrease in these parameters was
23
observed in children with chronic cough, chronic phlegm or wheeze. Pre-school children exposed for two consecutive days to peak daily O3 levels above 260 µg/m3 had a 20 per cent increase in risk of respiratory illness. For the same conditions and exposition to low temperatures, the risk of respiratory illness reached 40 per cent. An increase of 100 µg O3/m3 in the 1-hour daily maximum was related to a 10 per cent increase in upper respiratory illnesses among children in Mexico City during winter-time. An increase of 100 µg O3/m3 in the 1-hour daily maximum during 5 consecutive days was related to a 30 per cent increase in upper respiratory illnesses. Asthma-related emergency department visits in Mexico City increased 43 per cent for an increase of 100 µg/m3 in the daily 1-hour maximum O3 level (ranging from 20-500 µg O3/m3). In panels of asthmatic children, an increase of 100 µg/m3 of daily peak O3 concentrations led to an 11 per cent increase of lower respiratory symptoms and a significant decrease in peak expiratory flow rate. An investigation conducted in China on the effect of short-term O3 exposure on lung function for male non-smokers established a threshold of 180 ± 40 µg O3/m3 for acute lung dysfunction, and 100 µg O3/m3 for general malaise. Suspended Particulate Matter Effects of short-term exposure on morbidity and mortality An increase of 10 µg PM10/m3 in São Paulo was related to an increase in daily mortality of 3 per cent among adults older than 65 years of age. In Chile, a 0.8 per cent increase in daily mortality was reported for an increase of 10 µg PM10/m3. In Mexico, a 0.5 per cent increase in daily mortality was found for a similar increase in daily TSP. In Santiago de Chile respiratory-related emergency visits were related to ambient levels of PM10 and PM2.5 during the winter months. An increase of 63.5 µg PM10/m3 was related to a 2 per cent increase in respiratory-related emergency department visits in the winter months. An increase of 36.5 µg PM2.5/m3 was related to a 2.2 per cent increase in the number of emergency department visits for acute respiratory illnesses, to a 5.4 per cent increase in the risk of acute pneumonia, and to a 3.7 per cent increase in the risk of upper respiratory illnesses during winter. An increase of 5 per cent in cough among Chilean children with chronic respiratory symptoms was associated with an increase of 30 µg PM10/m3. Among asthmatic children in Mexico an increase of 10 µg PM10/m3 was associated with a 4 per cent increase in minor respiratory symptoms, and a 0.35 per cent decrease in peak expiratory flow rate. An increase of 10 µg PM2.5/m3 was associated with an 8 per cent increase in the incidence of symptoms in the lower respiratory tract. A synergistic effect of PM10 and O3 exposure on the incidence of symptoms in the lower respiratory tract among these children is possible.
24

Effects of long-term exposure on mortality and morbidity In Rio de Janeiro, Brazil, for each 10 µg/m3 increase in TSP, the infant mortality from pneumonia was estimated to increase by 2.2 per 10,000 population. In Egypt, a significant increase of chest diseases occurred in schoolchildren living in residential settlements close to a cement company and an urban area, as compared with those living in a more rural area. In the first two settlements, 29.2 per cent of schoolchildren have obstructive lung diseases compared with only 9 per cent in the rural area. Furthermore, the high rate of mortality due to chest and cardiovascular diseases among the urban population was related to the prevalence of high concentrations of PM and SO2 in the atmosphere. Epidemiological studies in China show that under long-term exposure, there is a correlation between particle concentrations and mortality from lung cancer. An investigation based on data for 50 million people in 26 cities showed that the average PM10 pollution in urban districts and in control districts were 460 µg/m3 and 220 µg/m3, respectively, and the corresponding average mortality from lung cancer was 14.0 per cent and 7.0 per cent, respectively. Every 100 µg/m3 increase in TSP concentration led to an almost 7 per cent increase in the incidence of chronic broncho-pneumonia in coal-burning areas. Exposure to 200 µg/m3 of TSP can cause upper-respiratory diseases in children; and exposure to 290-470 µg/m3 of TSP significantly depressed immune functions in children. Exposure to TSP (with the daily-average concentration below 150 µg/m3) produced an increased frequency of attacks of asthma in some asthma patients. The lung function of children was reduced after short-term exposure to TSP concentrations over 250 µg/m3. When TSP concentration were higher than 750 µg/m3, middle-aged and old people, people with respiratory disease, and cardiovascular patients exhibited higher mortality (WHO, 2000a). Numerous studies in South Africa have indicated associations between a variety of respiratory symptoms and air pollution in urban, industrial and informal settlement areas. High prevalence rates for respiratory illness were found in a residential suburb within an industrial area, relative to a suburb further away. Similarly, when compared with areas using cleaner fuel, raised levels of respiratory effects have been identified in informal settlements, where coal and wood were commonly used for domestic purposes (WHO, 2000a). Lead A study, conducted in Mexico City among schoolchildren from low-to-medium social status and aged 9–12 years, showed a strong negative correlation between blood lead level, and intellectual coefficients and teacher grading. There was no evidence of a threshold level. Mexican children residing near a road with high traffic volumes had significantly higher levels of lead in blood than did children residing in a residential neighbourhood with smaller traffic volumes. It is estimated that for each increase of 1.5 µg/m3 of lead in ambient air, the concentration of lead in blood would increase by 1 µg/dl. Children from an informal settlement group in Johannesburg, where coal was largely used for cooking purposes, had significantly higher blood lead levels than their inner city and suburban counterparts.
25

EXPOSURE TO AND HEALTH IMPACTS OF AIR POLLUTION The information necessary to estimate the health impact of a pollutant on a population includes the indoor air pollutant concentrations affecting a population, the number of people at risk i.e. the number of people exposed to levels at which excess mortality or/and incidence and prevalence of morbidity can be expected, the time spent indoors, and the increase of mortality or morbidity with a unit increase of a certain pollutant. This information differs from the general knowledge that a substance is harmful; a quantitative estimation of the effects in the general population at certain exposure levels is necessary. Often, additional information on the presence of sensitive subjects in the target population may be needed to assess the magnitude of an impact. Based on the methodology used in the estimates of the global disease burden (e.g. Schwela 1996; WHO, 1997) it has been attempted to estimate mortality and morbidity caused by the impact of air pollution. Estimates are performed for different economic groupings according to different regions of the world: Latin America (AL), China, Established Market Economies (EME), Eastern Europe (EE), India, Sub-Saharan Africa, and South East Asia/Western Pacific (SEAWP). Figure 2.6 shows the results of this estimation of the number of excess deaths due to PM in urban outdoor, urban indoor, and rural indoor areas.
0
100000
200000
300000
400000
500000
600000
EME EEChin
aInd
ia
SEAWP
EM ALSSA
Economy category
Num
ber
of p
eopl
e
Urban ambient air upper estimate
Urban indoor air upper estimate
Rural indoor air upper estimate
Urban ambient air lower estimate
Urban indoor air lower estimate
Rural indoor air lower estimate
Figure 2.6 Excess mortality due to outdoor and indoor particulate matter Source: Schwela (2000b) From Figure 2.6 it can be estimated that between 4 and 8 per cent of the total mortality of globally 52.2 million deaths per year is due to PM. This estimate shows that the excess mortality due to PM is of the same order as tuberculosis, HIV/Aids, and total acute lower respiratory infections (see Figure 2.7). From these very rough estimates most premature deaths from PM are to be expected in urban indoor areas of India, Sub Saharan Africa, and China followed by the South East Asia/Western Pacific region.
26

Tuberculosis6%
Diarrhoe5%
HIV/Aids5%
Malaria3%
Cancers12%
Other & unknowncauses
21%
Diseases of thecirculatory system
29%
Other infectuous andparasitic diseases
6%
Acute lower respiratoryinfections (ALRI)
7%
Diseases ofthe respiratory
system6%
Figure 2.7 Percentage of disease-related mortality to total death rate Source: WHO (1997) A similar picture emerges for the incidence or exacerbation of respiratory diseases, as shown in Figure 2.8. Figure 2.9 gives percentage estimates of the total of 755 million annual incidences of respiratory diseases and shows that between 20 and 30 per cent of respiratory diseases are due to PM.
05
101520253035404550
EME EEChin
aInd
ia
SEAWP
EM ALSSA
Economy Category
Per
cent
age
Urban ambient air lowerestimate
Rural indoor air upperestimate
Urban ambient air upperestimate Urban indoor air lowerestimate Urban indoor air upperestimate Rural indoor air lowerestimate
Figure 2.8 Number of people [10-6] with respiratory diseases due to suspended particulate matter Source: Schwela (2000b)
27

0 10 20 30 40 50 60 70 80 90 100
Respiratoryd iseases
C O P D
A S T H M A
PercentageL ow er estim ate U pper estim ate
Figure 2.9 Percentage of incidence of asthma, COPD and total respiratory diseases due to suspended particulate matter. Source: Schwela (2000b) WHO GUIDELINES FOR AIR QUALITY The WHO Guidelines for Air Quality (GAQ) (WHO, 2000a) base on epidemiological studies that emerged in the late 1980s and 1990s. These studies were performed in the United States and later in Europe. Associations were demonstrated in these studies between daily average concentrations of PM, O3, SO2, airborne acidity, NO2, and CO and the daily occurrence of events such as deaths or admissions to hospital to daily average concentrations of pollutants. Confounding factors such as season, temperature, day of the week, smoking behaviour, occupational exposure, drug use, and others were carefully accounted for. Although the associations for each of these pollutants were not significant in all studies, taking the body of evidence as a whole, the consistency is striking. For PM and O3 it has been accepted by many that the studies provide no indication of any threshold of effect. Environmental factors such as altitude, temperature and humidity vary significantly across the globe. At increased altitude, increased human inhalation compensates for the decrease in the partial pressure of oxygen. This increased inhalation will lead to an increased intake of airborne particles. For gaseous pollutants no increase in effects over those experienced at sea level would be expected. Temperature has a very significant effect on health as is shown in increased mortality rates during heat waves. In contrast, humidity is unlikely to have a significant effect on the toxicity of gaseous pollutants. People with a poor standard of living suffer from nutritional deficiencies, infectious disease due to poor sanitation and overcrowding, and tend to be provided with a poor standard of medical care. Each of these factors may render individuals more susceptible to the effects of air pollution. The age structure of populations differs markedly from country to country. Old people tend to show increased susceptibility to air pollution. Very young children may also be at increased risk. Diseases which produce narrowing of the airways, a reduction in the area of the gas-exchange surface of the lung and an increased alteration of inhalation-perfusion ratios are likely to make the subject more susceptible to the effects of a range of air pollutants. Due to the scarcity of data in some regions around the globe, assumptions were made for some compounds in the derivation of the GAQ, which may not be justified in some parts of
28

the world. For example, the importance of different routes of exposure for some pollutants may vary from country to country. Different guidelines could be derived if such factors were to be taken into account. The assessment of carcinogenic compounds using the unit risk model is also dependent upon considerations of the comparative importance of different routes of exposure. Regulatory authorities should evaluate whether local circumstances give cause to doubt the validity of the guideline set out in the WHO GAQ as a basis for setting local guidelines or standards. These remarks apply to the guidelines of all compounds, for which studies from developing countries are relatively scarce. The new WHO GAQ were derived in the framework of air quality management and are globally applicable. Guideline values are derived for about 45 non-carcinogenic compounds and unit risks for about 35 carcinogens. For SPM exposure-response relationships were presented. Guideline values were derived in expert meetings, in which the Air Quality Guidelines for Europe (WHO/EURO, 1987) were updated. Information was also taken from the International Programme for Chemical Safety (IPCS) and the Concise International Chemical Assessment Documents (CICAD) of the Inter-Organization Programme for the Sound Management of Chemicals. The guidelines serve to give advice to Governments with respect to standard setting and developing clean air implementation plans to protect their populations from the adverse health effects of ambient and indoor air pollution. NOISE LEVELS AND TRENDS IN DEVELOPED COUNTRIES The extent of the noise problem is large. In the European Union countries about 40 per cent of the population are exposed to road traffic noise with an equivalent sound pressure level exceeding 55 dBA daytime and about 20 per cent are exposed to levels exceeding 65 dBA (see WHO, 2000b). The percentage of populations exposed to environmental noise at outdoor levels above 65 dBA is shown in Figure 2.10. Noise levels between 60 and 65 dBA considerably increase annoyance reactions, and those above 65 dBA seriously harm the perceived quality of life, as they can change behaviour patterns.
010203040506070
Bulgari
a
Czech
+ Slov
ak R
...
Denmark
Finlan
d
France
German
y
Hunga
ryIsr
ael
Italy
Netherl
ands
Norway
Poland
Roman
ia
Sweden
United
King
dom
Country
Perc
enta
ge
Figure 2.10 Percentages of populations exposed to environmental noise at ambient levels above 65 dBA (equivalent continuous A-weighted level over 24 hours) in European countries Source: WHO (1995)
29
Taking all exposure to transportation noise together, about half of the European Union citizens are estimated to live in zones which do not ensure acoustic comfort to residents. More than 30 per cent are exposed at night to equivalent sound pressure levels exceeding 55 dB(A) which are disturbing to sleep. NOISE LEVELS AND TRENDS IN DEVELOPING COUNTRIES The noise pollution problem is more severe in cities of developing countries and caused mainly by traffic. Data collected alongside densely travelled roads in Bangkok, Thailand, were found to have equivalent sound pressure levels for 24 hours of 75 to 80 dBA (WHO, 2000b). In developing countries more serious health effects due to noise were observed such as hearing impairment and hearing loss, which in developed countries are only observed in occupational environments. In a study in Karachi, Pakistan, it was observed that about 83 per cent of street policemen had noise induced hearing loss (NIHL). The same study reported NIHL in 33 per cent of rickshaw drivers and 57 per cent of shopkeepers in a busy bazaar (WHO, 2000b). These findings show that in major cities throughout the world, the general population is increasingly exposed to environmental noise. The health effects of these exposures are considered to be a more and more important public health problem. Specific effects to be considered in the fixing of the community noise guidelines include interference with communication, sleep disturbance, cardiovascular and psycho-physiological effects, performance effects, annoyance responses, changes on social behaviour, and noise-induced hearing impairment and hearing loss. Health Effects of Environmental Noise Adverse effects of noise include hearing impairment, interference with speech communication, sleep disturbance, physiological effects, performance effects, annoyance and behavioural effects (Berglund and Lindvall, 1995; WHO, 2000b). Noise-induced hearing impairment is an increase in the threshold of hearing caused by noise. According to ISO 1999 (ISO 1990) noise-induced hearing impairment can be sufficient to affect one’s personal efficiency in the activities of daily living, usually expressed in terms of understanding conventional speech in low levels of background noise. Noise interference with speech communication reduces speech comprehension and may result in a large number of personal disabilities, handicaps and behavioural changes. Problems include concentration reduction, fatigue, uncertainty and lack of self-confidence, irritation, misunderstandings, decreased working capacity, problems in human relations, and a number of stress reactions. Particularly vulnerable to these types of effects are the hearing impaired, the elderly, children in the process of language and reading acquisition, and individuals who are not familiar with the spoken language. Noise is able to cause sleep disturbance and awakenings (primary effects) during sleep period time. Secondary effects such as reduced perceived sleep quality, increased fatigue, depressed mood or well-being, and decreased performance can occur the day after the night-time noise exposure. Noise may have a large temporary and permanent impact on physiological functions in man. The magnitude and duration of effects in general populations (including children)
30

living in noisy areas around airports, industries and on noisy streets are determined in part by individual characteristics, lifestyle behaviours and environmental conditions. Sudden and unfamiliar sounds also evoke reflex responses. Noise accompanied by vibrations and low frequency components or noise containing impulses affect the exposure-response curves for annoyance. Annoyance is indicated in the Guidelines as percentage highly annoyed persons in a population and given as a function of the day and night continuous equivalent sound level. When noise exposure is increased over time compared to situations with a stationary noise exposure, temporary stronger annoyance reactions occur. For other effects of environmental noise such as cardiovascular or mental effects the role of noise is not yet well established. WHO Guidelines for Environmental Noise Environmental noise is considered in the WHO Guidelines for Community Noise (GCN) (WHO, 2000b) hereafter referred to as to include noise emitted from outdoor and indoor sources except noise at the industrial workplace (occupational noise). In major cities throughout the world, the general population is increasingly exposed to environmental noise. The health effects of these exposures constitute a more and more serious public health problem. With each additional source of noise to the environment, may its contribution be even small, environmental noise increases and affects everybody. Most persons are typically exposed to several noise sources or combinations of noise exposure from more than one source, including several types of environmental noise. In contrast to many other environmental problems, noise pollution continues to grow accompanied by an increasing number of complaints by noise-exposed persons. Noise pollution, mainly due to road traffic noise, therefore, is unsustainable. Driving forces are population growth, urbanisation and, to a large extent, also technological development. Expected future enlargements of highway systems, international airports and railway systems will increase the noise problem. Therefore, strategic action is urgently required including continued noise control at the source and noise management locally, regionally, nationally and internationally. Therefore, the WHO GCN on Community Noise also address for the first time noise monitoring, noise management, and environmental noise impact assessment. Many countries have regulations on community noise from road, rail and rail traffic, construction machines, and industrial plants through applying emission standards, on the construction of barriers, and on the acoustic properties of buildings. In contrast, few countries have regulations on environmental noise from neighbourhood, probably due to lack of methods to define and measure it, and the difficulty of controlling it. The guideline values refer to the general population and are the sound levels impacting on the most exposed receiver at the listed environments. The values given refer to the general population. The time base for LAeq,T for day time and night time has been indicated. No time base is given for evenings, but typically guideline value should be 5–10 dB lower than in daytime. The available knowledge on health effects is sufficient for proposing guideline values for community noise regarding annoyance, speech and communication interference, disturbance of information extraction, sleep disturbance and hearing impairment. According to the GCN, it is important to display, in addition to the LAeq,T values, the maximum values of the noise fluctuations, preferably combined with a measure of the number of noise events and separate characterization of noise exposures during night-time.
31
For indoor environments, reverberation time is also an important factor for speech intelligibility. Corresponding recommendations are given in the guideline document. If the noise includes a large proportion of low frequency components, the GCN recommend to consider still lower guideline values. In the GCN, the world literature on health effects of environmental noise was reviewed and used to derive guideline values for community noise with the aim of protecting the general population from adverse health impacts of noise. The issues of noise assessment and noise management were also addressed in the guidelines. Questions of priorities in noise management, quality assurance, and cost-efficiency of control actions and noise policies were also discussed. An extensive glossary and a list of acronyms used make the GCN understandable for the non-expert reader. Finally, a chapter is devoted to the implementation of the GCN and gives recommendations to be considered by national governments, local municipalities, the World Health Organization and the scientific community. A particularly important suggestion of the GCN is to concentrate research more on variables that have monetary consequences. Research should aggressively consider the assessment of dose-response relationships between sound levels and politically relevant variables such as noise induced social handicap, reduced productivity, decreased performance in learning, workplace and school absenteeism, increased drug use and accidents. SOURCES OF IONISING RADIATION Humans are primarily exposed to natural radiation from the sun, cosmic rays, and naturally occurring radioactive elements found in the earth's crust. The primary radioactive elements found in the earth's crust are uranium, thorium, and potassium, and their radioactive derivatives. Radon, which emanates from the ground, is another important source of natural ionising radiation. Cosmic rays from space include energetic protons, electrons, gamma rays, and X-rays. Ionising radiation is radiation that has sufficient energy to remove electrons from atoms. One source of ionising radiation is the radioactive decay of nuclei of unstable atoms. For these radioactive atoms (also referred to as radionuclides or radioisotopes) to become more stable, the nuclei eject or emit subatomic particles, often α- and β-particles, and high-energy photons (γ-rays). Unstable isotopes of radium, radon, uranium, and thorium, for example, exist naturally. Others are continually being made naturally or by human activities such as the splitting of atoms in a nuclear reactor. α-particles are energetic, positively charged particles (helium nuclei) that rapidly lose energy when passing through matter. They can be stopped completely by a sheet of paper. β-particles are fast moving, positively or negatively charged electrons emitted from manmade and natural sources such as tritium, carbon-14, and strontium-90. They are more penetrating than alpha particles, but can be reduced or stopped by a layer of clothing or by a few millimetres of a substance such as aluminium. γ-rays (photons) often accompany the emission of α- and β-particles from a nucleus. They have neither a charge nor a mass and are very penetrating. One source of gamma rays in the environment is naturally occurring potassium-40. Manmade sources include plutonium-239 and cesium-137. Several feet of concrete or a few inches of lead may be required to stop the more energetic gamma rays. X-rays are photons produced by the interaction of charged particles with the electron shell of atoms. They are generally lower in energy and therefore less penetrating than gamma
32

rays. A few millimetres of lead can stop medical X-rays. The penetrating power is illustrated in Figure 2.11.
Figure 2.11 The penetrating power of α- and β-particles and γ-rays Source: USEPA (1998a) Ionising radiation is used on an ever-increasing scale in medicine, dentistry and industry. Main users of manmade ionising radiation include: medical facilities such as hospitals and pharmaceutical facilities; research and teaching institutions; nuclear reactors and their supporting facilities such as uranium mills and fuel preparation plants; and facilities involved in nuclear weapons production as part of their normal operation. Many of these facilities generate some radioactive waste and some release a controlled amount of ionising radiation into the environment. Radioactive materials are also used in common consumer products such as digital and luminous-dial wristwatches, ceramic glazes, artificial teeth, and smoke detectors. Figure 2.12 shows the percentage contribution that various ionising radiation sources make toward the yearly average effective dose received by the US population (USEPA, 1998b).
1%
3%4%11%
26%55%
Radon Other natural sources Medical X-raysNuclear Medicine Consumer products Other
Figure 2.12 Percentage contribution to human exposure of sources of ionising radiation Source: NCRP Report No. 93, quoted in US EPA (1998b)
33

HEALTH EFFECTS OF IONISING RADIATION EXPOSURE Any release of radioactive material can lead to exposure of the population to ionising radiation. In addition to exposure from external sources, ionising radiation exposure can occur internally by ingesting, inhaling, injecting, or absorbing radioactive materials. Both α- and β-particles are generally more hazardous when they are inhaled or ingested. γ-rays can easily pass through the human body or be absorbed by tissue, thus constituting a hazard for the whole body. Evidence of injury from low or moderate doses of ionising radiation may not show up for months or even years. For leukaemia, the minimum time period between the ionising radiation exposure and the appearance of disease (latency period) is 2 years. For solid tumours, the latency period is more than 5 years. The types of effects and their probability of occurrence can depend on whether a person is exposed over a long-term or short-term period (USEPA, 1998b). Effects of long-term continuous or intermittent exposure to low levels of ionising radiation include genetic effects and other effects such as cancer, pre-cancer lesions, benign tumours, cataracts, skin changes, and congenital defects (USEPA, 1998b). Short-term exposure to a large, single dose of ionising radiation, or a series of doses, can cause rapid development of radiation sickness, evidenced by gastrointestinal disorders, bacterial infections, haemorrhaging, anaemia, loss of body fluids, and electrolyte imbalance. Delayed biological effects can include cataracts, temporary sterility, cancer, and genetic effects. Extremely high levels of acute ionising radiation exposure can result in death within a few hours, days or weeks (USEPA, 1998b). The probability of an ionising radiation-caused cancer or genetic effect is related to the total amount of ionising radiation accumulated by an individual. Any exposure to ionising radiation can be harmful or can increase the risk of cancer; however, at very low exposures, the estimated increases in risk are very small (USEPA, 1998b) For radon, scientists largely depend on data collected on underground miners. Figure 2.13 shows the estimated attributable proportion of lung cancer related to residential radon exposure based on a Swedish study and extrapolations from miners (WHO, 2000a). Ultraviolet Radiation Ultraviolet radiation (UVR) affects a number of organs and systems of the human body. These include (WHO, 1994; MacKie, 2000; Swerdlow, 2000) Acute effects
Erythema and sunburn Skin pigmentation and tanning
Photosensitization
Chronic non-cancer effects
Freckles and solar lentigines Melanocytic naevi
Solar keratoses Cataract
Cancer
Non-melanoma skin cancer Cutaneous melanoma
Cancer of the lip Other cancers.
34

02468
101214161820
0 25 50 75 100
Radon concentration [Bq/m3]
Attr
ibut
able
pro
porti
on [%
]
With adjustment Without adjustment Mean
y = (13±4) 10-4 x
Figure 2.13 Estimated attributable proportion of lung cancer in relation to radon exposure Source: WHO (2000a); WHO/EURO (2000) There is evidence that long-term high exposure to UVR can cause cortical cataract in men, but not in women. There is sufficient evidence that UVR causes both melanoma and non- melanoma skin cancer (IARC, 1992; Swerdlow, 2000) discusses the different evidence in squamous cell cancer, basal cell cancer and melanoma in males and females. For melanoma, the exposure-response relationship has indicated that risk relates primarily to intermittent, intense exposures of normally unexposed skin, although there is evidence that cumulative exposure may also matter (NRPB, 1995). Exposure during childhood may be particularly important to risk of melanoma (IARC, 1992); however, from current evidence it does not follow that exposure in childhood is intrinsically more hazardous than that at older ages (Swerdlow, 2000). Relationships of average annual age-adjusted incidence of cutaneous melanoma in relation to average UVR have been reported in WHO (994). Lip cancer incidence is associated with cumulative exposure to UVR and to pipe smoking; its geographical distribution shows differences from that simply explicable by ambient UVR (Swerdlow, 2000). Electromagnetic Fields Radio-frequency (RF) fields are defined as those within the frequency range 300 Hz and 300 GHz. Common sources of RF fields include: monitors and video display units (3–30 kHz), AM radio (30–3 MHz), industrial induction heaters (0.3–3 MHz), RF heat sealers, medical diathermy (3–30 MHz), FM radio (30–300 MHz), mobile telephones, television broadcast, microwave ovens, medical diathermy (0.3 – 3 GHz), radar, satellite links, microwave communications (3–30 GHz) and the sun (3–300 GHz). RF fields are non-ionising radiation. RF fields may, however, produce different effects on biological systems such as cells, plants, animals, or human beings. These effects depend on frequency and intensity of the RF field. By no means, will all of these effects result in adverse health effects. RF fields from the sun - the primary natural source - have a power density below 0.01 mW/m2. Anthropogenic sources, which emit the majority of RF fields found in the immediate environment, can be divided into those found in the community, home, and workplace:
35

In the community, most RF fields are due to commercial radio and TV broadcasting, and from telecommunications facilities. RF exposure from telecommunications facilities is generally less than from radio or TV broadcasting. In large cities, the average background RF levels were about 50 µW/m2 (USEPA 1998a). About 1 per cent of people living in large cities are exposed to RF fields exceeding 10 mW/m2. Higher RF field levels can occur in areas located close to transmitter sites or radar systems. RF sources in the home include microwave ovens, mobile telephones, burglar alarms, video display units and TV sets. The RF field background from household appliances is low, and of the order of a few tens of µW/m2. There are a number of industrial processes which use RF fields: dielectric heaters used for wood lamination and the sealing of plastics; industrial induction heaters and microwave ovens; medical diathermy equipment to treat pain and inflammation of body tissues; and electro-surgical devices for cutting and welding tissues. RF fields near equipment in the workplace can exceed tens of W/m2. Exposure levels for personnel at the workplace are regulated nationally and internationally. RF fields above 10 GHz are absorbed at the skin surface, with very little of the energy penetrating into the underlying tissues. RF fields between 1 MHz and 10 GHz penetrate exposed tissues and produce heating due to energy absorption in these tissues. The depth of penetration of the RF field into the tissue depends on the frequency of the field and is greater for lower frequencies. The specific absorption rate in watts per kilogram (W/kg tissue) is the basic dosimetric quantity for energy absorption from RF fields between 1 MHz and 10 GHz. A specific absorption rate of at least 4 W/kg tissue is needed to produce adverse health effects in people exposed to RF fields in this frequency range. Such energies are only found tens of meters away from powerful FM antennae at the top of high towers. Adverse health effects that could occur from exposure to RF fields between 1 MHz and 10 GHz include physiological and thermoregulatory responses to induced heating (rises in tissue or body temperatures higher than 1 °C). These responses may be a decreased ability to perform mental or physical tasks. Induced heating may affect the development of a foetus, if the temperature of the foetus is raised by 2–3 °C for hours. Most RF studies that were conducted at frequencies between 1 and 10 MHz examined the results of acute exposure to levels of RF fields not normally found in everyday life (WHO, 1993). RF fields below 1 MHz induce electric currents in tissues, which are measured as a current density [A/m2]. Induced current densities that exceed at least 100 mA/m2 can interfere with currents of about 10 mA/m2 that are associated with life-supporting chemical reactions. Such current densities can cause involuntary muscle contractions (WHO, 1993). Extremely Low Frequency (ELF) electric and magnetic fields induce electrical charges and currents. ELF health concerns were raised with respect to effects on the cardiovascular system, the hormone and immune system, neuro-behavioural disorders, pregnancy outcome, adult cancer, and childhood leukaemia. While studies either did not observe obvious effects, were inconclusive or controversial for the first five effects, there appeared to be a significant association of ELF with childhood leukaemia. The mechanism of induced currents from exposure to ‘environmental’ levels of ELF fields, however, is unlikely to explain the latter health effect. (WHO, 1999) Other reported effects on the body from exposure to low-intensity RF fields have raised important health concerns about an increased risk of cancer. Current scientific evidence
36

indicates that exposure to RF fields is unlikely to induce or promote cancers (WHO, 1999). There is no convincing evidence that other suspected effects such as changes in behaviour, memory loss, Parkinson and Alzheimer´s disease are associated with EMF. Effects from low-intensity are being monitored and evaluated under the International EMF Project (Repacholi, 1999). The objective of the International EMF Project is to determine if the biological effects reported from exposure to RF fields at low levels have any adverse health consequences. Mobile telephones, as well as many other electronic devices in common use, can cause electromagnetic interference in other electrical equipment and medical devices, such as cardiac pacemakers and hearing aids. The International Commission on Non-Ionising Radiation Protection (ICNIRP) has developed exposure limits for RF fields (ICNIRP, 1998). These guidelines are derived from reviews of all the peer-reviewed scientific literature, including thermal and non-thermal effects. The RF field limits are well above the levels found in the living environment. RECOMMENDATIONS FOR FURTHER ACTION The first step in addressing the problem of air pollution is to define the problem and understand its severity. Thus, it is important to have adequate monitoring facilities and programmes in place in order to be aware of any changes in pollutant composition and concentration. Monitoring air pollution requires determining the consequences of air pollution after identifying its sources, observing its distribution, and measuring its concentration (UNEP/WHO, 1992). Air quality management is defined as the “capacity to generate and utilize appropriate air quality information within a coherent administrative and legislative framework” (UNEP/WHO, 1992). Thus, pollution management within a city first requires the measurement of urban pollutants. Even Agenda 21 necessitates the existence of appropriate air quality management capacities and adequate environmental monitoring capabilities in cities. Therefore, the cities that already have monitoring facilities and procedures in place should make efforts to maintain their operations and improve their technologies, while those cities that have yet to implement monitors for air pollution need to develop such programs in order to begin their urban air quality management. Following the monitoring and assessment, the public should be informed about the quality of air in the city and the potential consequences of air pollution so that they can take the necessary precautions to protect themselves from any negative health effects that can come from airborne toxins (UNEP/WHO, 1992). Monitoring and assessing air pollution is a costly activity. Thus, to pay for such an endeavour there must be adequate financial resources, which are most readily available if there is political support for the project. Therefore, in addition to informing the public about the risks of air pollution, there is a need to also communicate these risks to politicians and decision-makers in order to convince them to make pollution control one of the top priorities for their city or country. Given the economic consequences of air pollution, such as damaged ecosystems that are necessary for the economy and reduced productivity from workers with pollution-related
37

illnesses, it is clear that there are benefits to the timely redress of pollution problems. Although control mechanisms may be very costly initially, in the end the costs will be recovered. For example, when the United States shifted from the use of leaded fuel to unleaded fuel, it saved US$10 for every $1 invested in the process of conversion due to fewer health costs, reduced need for engine maintenance, and increased fuel efficiency (WRI/UNEP/UNDP/WB 1998). The same is true for switching to cleaner forms of energy, which will diminish dangerous fossil fuel emissions. Solar energy, for example, is expensive upon installation, but the cost of maintaining solar panels are very low. In the long run, the money that is saved from reduced fossil fuel consumption is greater than the money that was spent to install the solar panels. To stabilize or reduce the levels of pollution in the atmosphere, the use of fossil fuels must be replaced with sustainable forms of energy. To stabilize CO2, SO2, SPM and NOx emissions, natural gas and renewable sources of energy must be substituted for coal. Between 1989 and 1995, natural gas was substituted for coal as fuel in the Czech Republic and SO2 emissions were reduced by 36 per cent, SPM was reduced by 49 per cent, and N2O emissions were cut by 50 per cent (WRI/UNEP/UNDP/WB, 1998). Reductions in fossil fuel consumption can come from a number of areas. To begin, fuel prices should reflect the actual costs on society. Currently fuel prices are far too cheap, which encourages over-consumption of a non-renewable resource. If the cost of fuel increased substantially, consumers would be discouraged from using excessive amounts of energy; eventually, the use of fossil fuels would be reduced to a sustainable level and people would have opted to use renewable, clean energy sources. Most fossil fuel combustion takes place in the transportation sector. Therefore, governments need to place restrictions on the use of vehicles while improving the efficiency and availability of public transportation. This method has worked extremely well in Singapore, where air pollution levels have been below WHO and USEPA guidelines, since 1986. Analysts attribute the well-regulated pollution situation to early recognition of the problem and efficient and informed policy and management practices immediately thereafter (Roychoudhury et al., 2000). The Singapore government sought to address the pollution problem from its source: excessive vehicle use. Therefore, it placed severe economic restrictions on the ownership and use of automobiles, making it far too expensive for the average person to use private transportation. However, at the same time, the government also greatly improved the public transportation system. Now metro stations are within walking distance or are a short bus ride away from every residential area. In addition, the government also strongly encouraged pedestrian transport and non-motorized traffic (Roychoudhury et al., 2000). For now, however, fossil fuel use is such an integral part of life that it is necessary to control the rate of emission and the toxic composition of emissions either before, during, or after combustion. Prior to combustion it is possible to control toxic emissions through the use of low-sulphur or sulphur-free fuels (including natural gas), fuel cleaning, and unleaded petroleum. During combustion, pollutants should be controlled by using low NOx burners, or fluidized bed combustion which is known to reduce both NOx and SO2 emissions. Post-combustion, catalysts should be used in power stations and vehicles to reduce NOx. Scrubbers should also be used to remove the pollutants from gaseous emissions after the burning of fossil fuels.
38

Clearly, there are a number of changes that can be made to lifestyles, and industries that can help to control polluting emissions. However, the areas where these pollution regulations are implemented are also important. Air pollution is a global problem, both because air currents move the toxins around the globe, and also because the air pollution is prevalent the world-over. Therefore, efforts to curb pollution must be undertaken on a global scale. More specifically, regional cooperation should be promoted because nations in similar regions share similar problems with air pollution; thus, the exchange of information will benefit all nations involved. In addition, economic and social constraints are often comparable by region making the exchange of information all the more useful. There is a need for databases that will be available internationally so that all nations can remain aware of up-to-date figures and analysis of air pollution composition and concentration. In addition to sharing monitoring information, there is also a need for research regarding the health effects of air pollution and how the health effects, in turn, impact the economy of a nation. These days, governments are market-oriented, which makes them hesitant to undertake activities that will either slow their economies or put them at competitive disadvantage. Therefore, if it is proven that air pollution actually contributes to dysfunctional economies, there will be a greater incentive for nations to implement policies that will require them to reduce emissions and convert to clean technologies. If this information is passed between nations and air pollution is recognized to be detrimental to a strong economy, developed nations will be encouraged to improve their technologies in order to remain ahead, while developing nations will build their infrastructure in environmentally-friendly ways in order to develop efficiently. When nearly every nation in the world has problems with air pollution, the problem can be termed a global issue. To redress the global nature of the problem, each nation has to make efforts to control their own pollution. On the national level, information about the environment, health, economics, and law should be reviewed in order to develop policy that is practical for local governments. Meanwhile, health clinics should be provided about information about air pollution-related illnesses so as to treat those who are already affected by pollution and to educate the community about the adverse health effects of air pollution and the best ways to avoid exposure (UNEP/UNICEF, 1997). Both health problems and environmental problems are multi-causal. To successfully solve these types of problems, national governments need to promote the coordination of activities and information between the ministries or departments that deal with each aspect of these problems. More collaboration is also needed between government agencies and non-governmental or community-based organizations that often have more grassroots' experience and are thus more familiar with real-life conditions (UNEP/UNICEF, 1997). Locally, monitoring health conditions will provide information about the severity of air pollution and determine what needs to be done to address these problems. Moreover, local governments need to provide the knowledge for people to protect themselves from air pollution. Children, who are the most vulnerable to air pollution because of their physical and behavioural characteristics, should have a special focus in air pollution policy. Right now, not enough is known about the diseases that arise from air pollution and their effects on children; hence, more medical research needs to be done in this field. For example, acute respiratory infections are caused by a number of factors, yet there is currently not an integrated approach to reduce children’s susceptibility to these pollution-related infections (UNEP/UNICEF/WHO, 2001).
39

Since children are often exposed to extremely high levels of indoor air pollution, steps should be taken at the community level to improve indoor air quality through ventilation, chimneys, and the use of clean energy sources. A well-fed child is less vulnerable to disease, which indicates that those who provide for children’s safety should focus on nutrition, as well as on the direct cause of illnesses. Through a balanced diet, simple prophylactics such as vaccines, and early treatment of disease, children will be more able to fight off diseases that come from airborne pollutants. Children should be involved in activities that inform them about the dangers of pollutants in order for them to grow up as aware adults. Environmental education in general is important for children as they will become the future leaders of the world and will have the opportunity to integrate environmental awareness and protection into everyday life. At the national level, risk assessment of an endeavour should emphasize impacts on children. Moreover, policies should pay special attention to underprivileged children who are often exposed to higher levels of pollutants than their wealthy counterparts. Children will benefit greatly if their needs are given special attention at international conferences that develop global policy about air pollution because such agreements will have the most widespread impact. Legally-binding environmental policy is of particular importance because it keeps governments accountable for their actions and their effects on children. Though the actions taken internationally and regionally will be similar, it is important to keep regions in mind when developing policy or prioritising problems to be addressed. Children in some regions often face unique problems that are more urgent than the issues that are plaguing the rest of the world. CONCLUSIONS Before humans altered the chemical composition of the Earth’s atmosphere, it provided perfect protection from heat, UV-B radiation, and pollution-related diseases. However, as humans have industrialized the world, we have disrupted that balance that has guarded us, and the effects of our actions show through the increased incidences of skin cancer, acute respiratory infections, developmental problems, and vector-borne diseases, among other health problems. Children, who are treasured by every culture around the world, are most adversely affected by the poisonous toxic compounds that we emit into the atmosphere. If children are exposed to unhealthy levels of pollutants at a young age, they may sustain permanent developmental damage, rendering them unable to function properly as adults. Therefore, we are jeopardizing our future not just through natural resource degradation, but also through the degradation of our human resources. Environmental issues cannot be addressed alone; protection of the environment must be undertaken while keeping in mind a number of social and economic factors, including health and economic policy. Consequently, collaboration between stakeholders and government ministries is necessary for successful control of air pollution.
40
Air pollution control also cannot be achieved by ordering industries and vehicle owners to change their means of production or ways of life. Incentives must be provided in order to persuade compliance with air pollution regulations. In the case of industries, incentives come in the form of tradeable permits and other market-oriented policies. People, on the other hand, can be convinced to protect the environment if they become aware of or feel the effects of health problems that accompany air pollution. It is impossible to stop the progression of development worldwide. Even if development were to reverse, people would still be exposed to the air pollutants that are associated with underdevelopment, namely pollution that comes from the use of biomass fuels. Thus, the best solution is to develop in a sustainable way which includes recognizing the ill effects of air pollution and addressing them before they reach unmanageable proportions. Developed countries need to adopt environmentally friendly technologies, reduce patterns of consumption and develop alternative renewable fuel sources, while developing countries need to develop in a more sustainable way by learning from the experiences of the developed world. REFERENCES Ackermann-Liebrich U, RappR (1999) ‘Epidemiological effects of oxides of nitrogen,
especially NO2 in Holgate, S T Samet, J M, Koren, H S, Maynard R L (eds) Air Pollution and Health, pp559–584, Academic Press, London, UK
ALA (2000) Children and ozone air pollution. American Lung Association Factsheet, September 2000. Internet: http://lungusa.org/air/children_factsheet99.html
Berglund B, Lindvall T (1995) ‘Community Noise’, Archives of the Centre for Sensory Research, volume 2, issue 1, Stockholm University and Karolinska Institute, Stockholm
Bruce N, Perez-Padilla R, Albalak, R (2000) ‘Indoor air pollution in developing countries: a major environmental and public challenge’, Bulletin of the World Health Organization, no 78, pp1078-1092
CICH (2000) The Health of Canada’s Children: A CICH Profile - 3rd Edition, Canadian Institute of Child Health, Ottawa
Cohen A J, Nikula K (1999) ‘The health effects of diesel exhaust: Laboratory and epidemiologic studies’ in Holgate, S T, Samet, J M, Koren, H S, Maynard R L (eds) Air Pollution and Health, pp707–748. Academic Press, London, UK
EEA (1995) Europe’s Environment – The Dobris Report, European Environment Agency, Copenhagen
EEA (1998) Europe’s Environment – The Second Assessment, European Environment Agency, Copenhagen
Ghio A J, Samet J M (1999) ‘Metals and air pollution’ in Holgate, S T Samet, J M, Koren, H S, Maynard R L (eds) Air Pollution and Health, pp635–672, Academic Press, London, UK
Hazucha M J (1999) ‘Controlled exposure to ozone, nitrogen oxides and acids’ in Holgate, S T, Samet, J M, Koren, H S, Maynard R L (eds) Air Pollution and Health pp511–530, Academic Press, London, UK
HEI (1995) ‘Particle air pollution and daily mortality. Replication and validation of selected studies’, The Phase I Report of the Particle Epidemiology Evaluation Project. Health Effects Institute
HEI (2000a) ‘The National Morbidity, Mortality, and Air Pollution Study’, Part I: Methods and Methodologic Issues; Part II: Morbidity and mortality from air pollution in the
41

United States, Research Report 94, June 2000. Health Effects Institute, Cambridge, MA, USA
HEI (2000b) ‘Reanalysis of the Harvard six cities study and the American Cancer Society study of particulate air pollution and mortality’, a Special Report of the Health Effects Institute’s Reanalysis Project, July 2000. Health Effects Institute, Cambridge, MA, USA
IARC (1992) ‘Solar and ultraviolet radiation’, Monographs on the Evaluation of Carcinogenic Risks to humans, Volume 55, International Agency for Research on Cancer, Lyon
ICNIRP (1998) ‘Guidelines on limits of exposure to time-varying electric, magnetic and electromagnetic fields (up to 300 GHz)’, International Commission on Non-Ionising Radiation, Health Physics, 74, pp494–522
ISO (1990) ‘Acoustics–Determination of occupational noise exposure and estimation of noise-induced hearing impairment’, International Standard ISO 1999, International Organization for Standardization, Geneva
Krzyzanowski M, Schwela D (1999) ‘Patterns of air pollution in developing countries’ in Holgate, S T, Samet, J M, Koren, H S, Maynard R L (eds) Air Pollution and Health, pp105–113. Academic Press, London, UK
Maynard, R L, Waller, R (1999) ‘Carbon monoxide’ in Holgate, S T, Samet, J M, Koren, H S, Maynard R L (eds) Air Pollution and Health pp749–796, Academic Press, London, UK
MacKie, R M (2000) ‘Effects of ultraviolet radiation on human health’ in McKinley, A F and Repacholi, M H (eds) Radiation Protection Dosimetry - Ultraviolet Radiation Exposure, Measurement and Protection, vol 91, no 1-3, pp15–18, Nuclear Technology Publishing
NCRP (1987) Ionizing Radiation Exposure of the Population of the United States, NCRP Report No. 93. National Council on Radiation Protection and Measurements, Bethesda, MD, USA
NSC (2000) Environmental Tobacco Smoke, National Safety Council, Itasca, IL, USA Internet: http://www.nsc.org/ehc/indoor/ets.htm [2001, July 6]
Pope III CA (2000a) ‘Epidemiology of fine particulate air pollution and human health: Biologic mechanisms and who’s at risk?’, Environmental Health Perspectives, 108, pp713–723
Pope III CA (2000b) ‘Review: Epidemiological basis for particulate air pollution health standards. American Association for Aerosol Research’, Aerosol Science and Technology 32 , pp4–14
Repacholi M H (1999) ‘EMF concerns and WHO´s International EMF Project’ in Repacholi, M H and Muc. A M (eds) EMF Risk Perception and Communication. WHO/SDE/OEH/99.01, World Health Organization, Geneva Internet: http://www.who.int/peh-emf
Roychoudhury, A, Gupta, A (2000) ‘Singapore: Breathing Easy’, Down To Earth, 9, pp34–38, Internet: http://www.cseindia.org/html/dte/dte20000831/dte_analy.htm
Samet, J M, Cohen, A J (1999) ‘Air pollution and lung cancer’ in Holgate, S T, Samet, J M, Koren, H S, Maynard R L (eds) Air Pollution and Health, pp841–864, Academic Press, London, UK
Schlesinger, R B (1999) ‘Toxicology of sulfur oxides’ in Holgate, S T, Samet, J M, Koren, H S, Maynard R L (eds) Air Pollution and Health, pp585–602, Academic Press, London, UK
Schwela, D H (1996) ‘Exposure to environmental chemicals relevant for respiratory hypersensitivity: global aspects’, Toxicology Letters, 86, pp131–142
Schwela, D H (1999) ‘Public health and the Air Management Information System (AMIS)’, Epidemiology, 10, pp647–655
42

Schwela, D H (2000a) ‘Air pollution and health in urban areas’, Reviews on Environmental Health, 15, pp13–42
Schwela, D H (2000b) ‘The World Health Organization Guidelines for Air Quality. Part 1: Exposure-response relationships and air quality guidelines’, EM July 2000, pp29–34
Schwela, D H (2000c) ‘The World Health Organization Guidelines for Air Quality. Part 2: Air quality management and the role of the guidelines’, EM August 2000, pp23–27
Smith, K R (1996) ‘Indoor air pollution in developing countries: Growing evidence of its role in the global disease burden’ in Ikeda, K and Iwata, T, Indoor Air ´96, Organizing Committee of the 7th International Conference on Indoor Air Quality and Climate, SEEC ISHIBASHI Inc, Tokyo
Swerdlow, A J (2000) ‘Epidemiology of chronic disease risks McKinley, A F and Repacholi, M H (eds) Radiation Protection Dosimetry - Ultraviolet Radiation Exposure, Measurement and Protection, vol 91, no 1-3, pp19–23, Nuclear Technology Publishing
Thurston, G D, Ito, K (1999) ‘Epidemiological studies of ozone exposure effects’ in Holgate, S T, Samet, J M, Koren, H S, Maynard R L (eds) Air Pollution and Health, pp485-510, Academic Press, London, UK
UNCED (1992) Agenda 21: Programme of Action for Sustainable Development, United Nations Conference on Environment and Development, 3-14 June 1992, Rio de Janeiro, Brazil
UNEP (1999) Global Environmental Outlook 2000, United Nations Environmental Programme, Nairobi, Kenya
UNEP/TERI (1999) Domestic Environment and Health of Women and Children, Gopalan, H N B and Saksena, S (eds) United Nation Environment Programme, Nairobi, Kenya, Tata Energy Research Institute, New Delhi, India
UNEP/UNICEF (1990) ‘Children and the Environment’ in The State of the Environment 1990, United Nations Environmental Programme, Nairobi, United Nations Children’s Fund, New York
UNEP/UNICEF (1997) Childhood Lead Poisoning: Information for Advocacy and Action, United Nations Environmental Programme, Nairobi, United Nations Children’s Fund, New York, Internet: http://www.chem.unep.ch/irptc/Publications/leadpoison/lead_eng.pdf
UNEP/UNICEF/WHO (2001) Children and the Environment (Draft). United Nations Environmental Programme, Nairobi, United Nations Children’s Fund, New York, World Health Organization, Geneva
UNEP/WHO (1992) City Air Quality Trends (GEMS/AIR Data), vol 1, WHO PEP 92.1, UNEP/GEMS 92.A.4. World Health Organization, Geneva, United Nations Environment Programme, Nairobi, Kenya
WRI/UNEP/UNDP/WB (1998) World Resources: A Guide to the Global Environment – Environmental Change and Human Health, World Resources Institute, United Nations environment Programme, United Nations Development Programme, World Bank. Oxford University Press, New York
USEPA (1998a) ‘Ionizing Radiation Series No. 1. EPA 402-F-98-009’, Radiation Protection Division, Office of Radiation and Indoor Air, United States Environmental Protection Agency, Washington D C, Internet: http://www.epa.gov/radiation/ ionize.htm
USEPA (1998b) ‘Health effects from exposure to ionizing radiation’, Ionizing Radiation Series No. 2. EPA 402-F-98-010. Radiation Protection Division, Office of Radiation and Indoor Air, United States Environmental Protection Agency, Washington D C, Internet: http://www.epa.gov/radiation/ionize2.htm
Wadge, A (1999) ‘Lead’ in Holgate, S T, Samet, J M, Koren, H S, Maynard R L (eds) Air Pollution and Health, pp797–812. Academic Press, London, UK
43

WHO (1992) Indoor air pollution from biomass fuel, Epidemiological, social and technical aspects of indoor air pollution from biomass fuel, WHO/PEP/92.3A, World Health Organization, Geneva, Switzerland
WHO (1993) ‘Electromagnetic Fields (300 Hz to 300 GHz)’, Environmental Health Criteria 137, World Health Organization, Geneva, Switzerland
WHO (1994) ‘Ultraviolet radiation’, Environmental Health Criteria 160. World Health Organization, Geneva, Switzerland
WHO (1995) Concern for Europe’s Tomorrow, World Health Organization Regional Office for Europe, Copenhagen, Denmark
WHO (1997) Health and Environment in Sustainable Development - Five Years after the Earth Summit. World Health Organization, Geneva, Switzerland
WHO (1998) Healthy Cities Air Management Information System, AMIS 2.0, CD ROM. World Health Organization, Geneva, Switzerland
WHO (1999) ‘Carbon monoxide – Second edition’, Environmental Health Criteria 213. World Health Organization, Geneva, Switzerland
WHO (2000a) Guidelines for Air Quality. WHO/SDE/OEH/00.02. World Health Organisation, Geneva, Switzerland, Internet address: http://www.who.int/peh/
WHO (2000b) Guidelines for Community Noise, published by the Institute of Environmental Epidemiology, Ministry of Environment, Singapore and the World Health Organization, Geneva, Switzerland, Internet address: www.who.int/peh/
WHO (2001a) Air Management Information System, AMIS 3.0, CD ROM. World Health Organization, Geneva, Switzerland
WHO (2001b) The gateway to children’s environmental health, Internet: http://www.who.int/peh/ceh/topics_littleadults.htm
WHO/EURO (1987) Air Quality Guidelines for Europe, World Health Organization, WHO Regional Publications, European Series No. 23, Copenhagen, Denmark
WHO/EURO (2000) Air Quality Guidelines for Europe, Second Edition, WHO Regional Publications, European Series, No. 91. World Health Organisation, Geneva, Switzerland
44

3 AIR QUALITY IN THE PEOPLE’S REPUBLIC OF CHINA
Christine Kim, Korea Environment Institute, Seoul, Korea Cui Qiang, Chinese Research Academy of Environmental Sciences, Beijing, China INTRODUCTION One of China’s most pressing environmental problems today is the air pollution that has ironically resulted from the nation’s efforts to raise the standard of living for its citizens through increased energy and automobile use. Among the top ten most polluted cities in the world, three (Beijing, Shenyang and Xian) are in China. Moreover, the air quality in more than 500 major Chinese cities is below World Health Organization’s (WHO) guidelines. China has long recognized air pollution as a critical problem. With the largest population of any country in the world, China’s air pollution problem is one of regional and international concern that affects the quality of life, economic and environmental well being of China and the Region. This chapter outlines the general characteristics and issues of air pollution in China. EFFECTS OF AIR POLLUTION ON HEALTH IN CHINA Air pollution is thought to be one of the leading risk factors for respiratory diseases, such as chronic obstructive pulmonary disease (COPD), lung cancer, pulmonary heart disease, and bronchitis, diseases that are the leading causes of death in China. The fact that men and woman have similar rates of these diseases, despite women's much lower smoking rates, provides evidence that this high disease burden is related to pollution. Since the 1980s, a number of studies examining the relationship between ambient air pollution and health effects in China have been conducted; however, it is important to remember that although the studies measured only ambient air pollution levels, in reality people are exposed to a combination of indoor and outdoor air. One of most definitive of these studies examined the relationship between air pollution and mortality in two residential areas of Beijing. According to this study, the risk of mortality was estimated to increase by 11 per cent with each doubling of sulphur dioxide (SO2) concentration, and by 4 per cent with each doubling of total suspended particulates (TSP). When the specific causes of mortality were examined, mortality from COPD increased 38 per cent with a doubling of particulate levels and 29 per cent with doubling of SO2. Pulmonary heart disease mortality also increased significantly with higher pollution levels. Levels of air pollution measured often exceeded WHO guidelines, particularly in winter when ambient air pollution was exacerbated by indoor fuel burning and certain climatic conditions. Yet, it is striking that excess mortality was associated with pollutant levels below WHO guidelines, suggesting that the guidelines cannot be perceived as a safe limit. Respiratory diseases, hospitalization, or doctor visits are often a more sensitive measure of the impact of air pollution on human health than mortality. One recent study confirmed that as concentrations of SO2 and TSP rose in Beijing, so did visits to the emergency room. This increase in unscheduled hospital visits occurred both when air pollution levels were extremely high (primarily in the winter) and when the levels were below WHO's
45

recommended guidelines, bolstering studies in developed countries that have shown excess respiratory disease and mortality at these lower levels. Although Beijing has been the focus of many studies, it has no monopoly on bad air. Chongqing, the largest and most recently declared autonomous zone, has a higher concentration of SO2 than any of China's five other largest cities. A recent study found that several symptoms of compromised health, including reduced pulmonary function and increased mortality, hospital admissions, and emergency room visits, were correlated with higher levels of air pollution in Chongqing. A study conducted in another of China's largest cities, Shenyang, estimated total mortality increased by 2 per cent with each 100 micrograms per cubic metre increase in SO2 concentration, and by 1 per cent for each 100 micrograms per cubic metre in TSP. Respiratory diseases are not the only health impacts of concern associated with air pollution. Lead exposure, for instance, leads to neurological damage, particularly in children. China has no comprehensive national database on blood-lead levels, a reliable biomarker of exposure, but some studies show that blood-lead levels are far above the threshold associated with impaired intelligence, neurobehavioral development, and physical growth. (The U.S. standard is 10 micrograms per deciliter.) Between 65 and 100 per cent of children in Shanghai have blood-lead levels greater than 10 micrograms per deciliter. Those in industrialized or congested areas had levels averaging between 21 and 67 deciliters. In Shanghai, prenatal exposures to lead from urban air were associated with adverse development in the children during their first year of life. Based on dose-response functions from studies conducted within China and in other countries, the World Bank has estimated the number of deaths and diseases associated with air pollution among urban populations. Using the Chinese standards as a benchmark, they estimate the number of deaths that could be prevented if air pollution were reduced to those levels. According to their calculations, approximately 178,000 deaths, or 7 per cent of all deaths in urban areas, could be prevented each year. Another measure of air pollution's impact on health is the number of hospital admissions from respiratory diseases. This study found 346,000 hospitalizations associated with the excess levels of air pollution in urban areas. Table 3.1 Health Effects from Ambient Air Pollution in China
Urban air pollution No. of cases Premature deaths 178,000 Respiratory hospital admissions 346,000 Emergency room visits 6,779,000 Lower respiratory infections or child asthma 661,000 Asthma attacks 75,107,000 Chronic bronchitis 1,762,000 Respiratory symptoms 5,270,175,000 Restricted activity days (years) 4,537,000
Source: SEPA (2001)
46

Table 3.2 Health Effects from Indoor Air Pollution in China Indoor air pollution No. of cases Premature deaths 111,000 Respiratory hospital admissions 220,000 Emergency room visits 4,310,000 Lower respiratory infections or child asthma 420,000 Asthma attacks 47,755 Chronic bronchitis 1,121,000 Respiratory symptoms 3,322,631,000 Restricted activity days (years) 2,885,000
Source: SEPA (2001) SOURCES OF AIR POLLUTION IN CHINA Industrial and Domestic Energy Use Coal burning, the primary source of China's high SO2 emissions, accounts for more than three quarters of the country's commercial energy needs, compared with 17 per cent in Japan and a world average of 27 per cent. China's consumption of raw coal increased annually by 2 per cent between 1989 and 1993 (see Table 3.3). Meanwhile, SO2 emissions increased by more than 20 per cent and TSP increased by approximately 10 per cent. The country is expected to burn 1.5 billion tonnes of coal annually by the year 2000, up from 0.99 billion tonnes in 1990. Without even more dramatic measures to control emissions than are currently in place, the deterioration of air quality seems inevitable. Table 3.3 Trends in Energy Structure (percentages of total energy sources) Year Coal Petroleum Natural Gas Hydropower Total
consumption (Mt coal equivalent)
1962 89.2 6.6 0.9 3.2 165 1985 75.8 17.1 2.2 4.9 602 1996 75.0 17.5 1.6 5.9 1388 Source: Sinton (1996) Particulates and SO2 are the ambient air pollutants of greatest concern; both are by-products of coal combustion. While industrial emissions of heavy metals and other toxics are also significant contributors to air pollution in China, they are not routinely monitored and will not be addressed in this section. The extent and type of air pollution in China vary dramatically by geographic region. SO2 and particulate emissions are highest in the northern half of China where coal is used to heat homes and other buildings for several months of the year and where industrial centres also depend heavily on coal burning. Yet, air pollution in the north would be much worse if not for the higher quality, cleaner coal that is available there. By contrast, the coal mined in the south of China is high in sulphur and extremely polluting, contributing to serious problems with acidic precipitation, especially in the southwest provinces of Sichuan, Guizhou, Guangxi, and Hunan.
47
Harry Vallack
What are the units?

Industry accounts for two thirds of China's coal use – industrial boilers alone consume 30 per cent of China's coal. These boilers are usually highly inefficient and emit through low smoke stacks, contributing to much of China's ground-level air pollution, especially small particulates and SO2. Inefficient and dirty boilers are particularly problematic because many of the industries that use them are located in densely populated metropolitan areas, placing populations in these areas at high risk of exposure. The residential sector accounts for approximately 15 per cent of total coal use, yet is estimated to contribute to more than 30 per cent of urban ground-level air pollution. Largely because of controls at power plants and within households, particulate emissions have not risen as much as might have been expected with the doubling of coal consumption. Overall, particulate emissions in China have remained relatively level since the early 1980s. In fact, in some large cities, ambient particulate concentrations have decreased markedly since the 1980s. In contrast, up until the mid 1990s, SO2 emissions roughly paralleled the increase in coal consumption as a result of inadequate sulphur control measures. However, since about 1996, there have been many efforts that have acted to reduce SO2 emissions, especially those aimed at reducing the sulphur content of coal used, higher thermal values for the coal, energy efficiency improvements and so forth. China’s emissions of SO2 were estimated to be 25.0 million tonnes in 1997 compared with 25.7 million tonnes in 1995 (Streets et al., 2000). Most of the efforts made recently have been the cheap options or options that have other benefits. It remains to be seen whether this de-coupling of SO2 emissions from increases in coal consumption can be maintained. Transportation Although the energy and industrial sectors are now the biggest contributors to urban air pollution in China, the transportation sector is becoming increasingly important. The total number of motorized vehicles in China is growing rapidly and has already risen to about 1 million in Beijing and almost 700,000 in Guangzhou. For the country as a whole, the number of vehicles in 1995 climbed to about 28 million. By 2020, the urban vehicle population is expected to be 13 to 22 times greater than it is today. This trend will likely have a major influence on the future of China's air quality. The shift toward vehicle use is most apparent in China's big cities. For example, from 1986 to 1996, the number of vehicles in Beijing increased fourfold, from 260,000 to 1.1 million. Although this is only one tenth of the number of vehicles in Tokyo or Los Angeles, the pollution generated by Beijing motor vehicles equals that in each of the two other cities. The problem stems not just from the growing size of the vehicle fleet but also from low emissions standards, poor road infrastructure, and outdated technology, which combine to make Chinese vehicles among the most polluting in the world. Vehicle emissions standards in China are equivalent to the standards of the developed world during the 1970s, and some domestic companies are manufacturing vehicles modelled after vehicles from 20 years ago. Actual emissions often exceed these standards: Chinese vehicles emit 2.5 to 7.5 times more hydrocarbons, 2 to 7 times more nitrogen oxides (NOx), and 6 to 12 times more carbon monoxide (CO) than foreign vehicles. In Beijing, Shanghai, Hangzhou, and Guangzhou, up to 70 per cent of CO emissions have been attributed to motor vehicles. Cars also contribute a large share of hydrocarbons and NOx in the cities for which data are available. As a result, although China's vehicle fleet is small compared with the developed countries, its large cities are already blanketed with smog.
48

A recent study in Beijing revealed that at all monitoring points within the Third Ring Road – a rough boundary separating downtown Beijing and its outskirts – the CO levels exceeded the national standard (4 micrograms per cubic metre per day). During the summer, ozone concentrations repeatedly exceeded the national standard which is set on an hourly basis – often several times per day. In addition, concentrations of NOx have almost doubled over the past decade. Compounding these pollution problems is the fact that the burgeoning Chinese motor vehicle fleet is largely fuelled by leaded gasoline. Although lead exposure is known to be a significant health hazard in China, no routine monitoring of environmental concentrations or blood-lead levels is performed. A few studies have been conducted and are described below. These scanty data suggest that ambient lead levels in the urban area of major cities such as Beijing are usually 1 to 1.5 micrograms per cubic metre – the national standard is 1 microgram per cubic metre. In some areas, ambient lead levels can reach as high as 14 to 25 micrograms per cubic metre. The health effects described below are significant, although recent and dramatic government actions to phase out leaded gasoline will likely have a major impact on this problem. Beijing and Shanghai as well as other cities have already begun to act and the countrywide phase out was expected to be complete by the year 2000. Table 3.4 Percentage of Emissions in Selected Chinese Cities Attributable to Motor Vehicles (1996)
CO Hydrocarbons NOx Category Beijing 48-64 60-74 10-22 District
Shanghai 69 37 District
Shenyang 27-38 45-53 District
Jinan 28 4-6 District
Hangzhou 24-70 Road
Urumqi 12-50 Road
Guangzhou 70 43
Source: Walsh (1996) Indoor Air Pollution in China In China, the effects of outdoor air pollution are compounded by those of indoor air pollution. Households using coal for domestic cooking and heating are especially at risk because coal emits very high levels of indoor particulate matter less than 2.5 microns in size – the size believed to be most hazardous to health. (These concentrations can be more than 100 times the proposed US ambient air 24-hour standard.) Exposure to these small-sized particles is especially harmful because they persist in the environment and reach deep into the lungs. Indoor air pollution affects both urban and rural populations. Nor is it simply a problem indoors: numerous studies have shown that intense indoor coal burning can affect ambient
49

air quality as well. For instance, rural neighbourhoods are generally unaffected by urban sources of air pollutants but can be extremely polluted from the burning of coal indoors. Indoor air pollution causes as many health problems as smoking, with the effects concentrated among women and children. Although the proportion of China's households that burn polluting biomass fuels indoors for cooking and heating remains significant, it has been declining with the proliferation of alternative energy sources. Largely as a result of government investments, about one third of urban Chinese now have access to gas for cooking, and coal-burning households are increasingly turning to the use of cleaner, more efficient briquettes. Table 3.5 Indoor Air Particulate Air Pollution from Coal Burning in China
URBAN/RURAL
PARTICULATES (µg/m3)
Shanghai Urban 500-1,000 Beijing Urban 17-1,100 Shenyang Urban 125-270 Taiyuan Urban 300-1,000 Harbin Urban 390-610 Guangzhou Urban 460 Chengde Urban 270-700 Yunnan Rural 270-5,100 Beijing Rural 400-1,300 Jilin Rural 1,000-1,200 Hebei Rural 1,900-2,500 Inner Mongolia Rural 400-1,600
Note: a. Particles less than 10 micrometres in size.
Source: WRI (1998) Perhaps the most compelling example of the health impact from indoor air pollution is the extremely high lung cancer rates among non-smoking women in rural Xuan Wei County. Studies conducted by the United States Environmental Protection Agency (USEPA) report that in the three communes with the highest mortality rates, the age-adjusted lung cancer mortality rate between 1973 and 1979 was 125.6 per 100,000 women, compared with average rates of 3.2 and 6.3 for Chinese and US women, respectively, for the same time. Because surveys showed that virtually no women (in the county) smoked tobacco products, other sources of potent exposure must have contributed to these troubling rates. Analyses of indoor air and blood samples from the women indicate that fuel burning inside the home was largely responsible for the lung cancers. The USEPA studies found a strong association between the existence of lung cancer in females and the duration of time spent cooking food indoors. The levels of carcinogenic compounds present in smoky coal (a local type of coal that smokes copiously) were found to be much higher in the women who used smoky coal for cooking.
50

AMBIENT AIR QUALITY MONITIORING AND STANDARDS IN CHINA In a nation-wide effort to improve the air quality, the Chinese government and media have broadcast the daily state of atmosphere of 42 main cities everyday after the evening news since June 5th, 2000. These cities include 32 capital cities of province, municipalities directly under the Central Government and municipal capitals, ten beach cities and main tour cities, which include: Beijing, Tianjin, Shijiazhuang, Taiyuan, Huhehaote, Shenyang, Dalian, Changchun, Haerbin, Shanghai, Nanjing, Suzhou, Nantong, Hangzhou, Wenzhou, Hefei, Fuzhou, Xiamen, Nanchang, Jinan, Qindao, Yantai, Zhengzhou, Wuhan, Changsha, Guangzhou, Shenzhen, Zhuhai, Shantou, Zhenjiang, Nanning, Haikou, Chengdu, Chongqin, Guiyang, Kunming, Lasha, Xi'an, Lanzhou, Xining, Yinchuan, Wulumuqi. These cities are being monitored and controlled by the relevant departments. Before this, only Beijing, Tianjin had reported the state of atmosphere everyday. According to official Chinese estimates (SEPA 2001), total emissions of sulphur dioxide during 2000 amounted to 19.95 million tons; 16.21 million tons from industrial sources and 3.83 million tons from municipal sources. The total amount of emission of flue gas and dust was 11.65 million tons, 9.53 million tons from industrial sources and 2.12 million tons from municipal sources. The total amount of emission of industrial ashes and powders was 10.92 million tons. Table 3.6 Pollutant Emission Between 1997 and 2000 (1000s tonnes per annum)
Year Sulphur dioxide from
industry
Sulphur dioxide from
non-industrial sources
Soot from Industry
Soot from non-
industrial sources
Dust from Industry
2000 1621 383 953 212 1092
1999 1460 397 953 206 1175
1998 1594 497 1175 277 1322
1997 1852 494 1565 308 1505 Source: Streets, et al (2000) Table 3.7 Comparison of Emission of Main Air Pollutants in 1995 and 2000
Year SO2 (10 kt) Particulate matter (10 kt)
Industrial dust emissions
(10 kt)
2000 1995 1165 1092 1995 2370 1735 1731
Per cent change -15.8 -33.2 -36.9 Source: China Environment Yearbook (2001)
51
Harry Vallack
What does this include ? transport, domestic, commercial? All non-industrial anthropogenic sources?
Harry Vallack
Particulate matter? (PM10, TSP??)
Harry Vallack
What does this include ? transport, domestic, commercial? All non-industrial anthropogenic sources?
Harry Vallack
Fugitive dust emissions?

In 2000, 36.5 per cent of the 338 monitored cities met the national air quality standard of Grade II whereas 63.5 per cent were worse than Grade II.. In general, the urban air quality was better than in 1999 which is indicated by the rising percentage of the cities having complied with the air quality standard and the reduced number of the cities with the air quality worse than Grade III.
Figure 3.1 Comparison of Air Pollution Index in 47 Key Cities (1999); State Environment Protection Agency (SEPA), 2001 Source: SEPA (2001) The cities for which the average annual value of TSP and PM10 exceeded the limit value of the national standard of Grade II accounted for 61.6 per cent of the total cities included in the statistics. 20.7 per cent of the cities had higher average annual concentration of sulphur dioxide than the limit value of the national standard of Grade II, 8 per cent less compared with 1999. NOx pollution was relatively serious in the super big cities where there was a high population density and a large number of vehicles. Compared with 1999, the percentage of the cities whose air quality met the national standard of Grade II rose from 33.1 to 36.5 per cent. The percentage of cities with air quality worse than Grade III declined from 40.6 to 33.1 per cent. Out of 47 key cities for environmental protection, 27 met the national air quality standard of Grade II; 7 met the standard of Grade III and 13 had the air quality worse than Grade III.
Figure 3.2 Percentage by Grade of Urban Air Quality in China (2000) Source: SEPA (2001)
52
Harry Vallack
Mega?

Figure 3.3 Statistics of Grades of Urban Air Quality in 2000 Source: SEPA (2001) POLLUTION REDUCTION MEASURES The major problems that China has faced in effective pollution reduction policies and regulations include inadequate economic and social analysis for total load control, poor cost-benefit analysis for least cost option, absence of effective instruments to implement least cost options (i.e. investment, technology, human resources), poor monitoring and law enforcement, and poor inter-province and inter-agency co-ordination. In the midst of these obstacles, China has recently made an enormous effort to abate urban air pollution. The revised Law of Air Pollution Prevention and Control of the People's Republic of China was ratified by the Standing Committee of the National People's Congress on 29 April 2000 and enacted from September 2000. The revised Law of Air Pollution Prevention and Control has more precise and stricter provisions for air pollution prevention and control. Emended law air pollution and prevention and control was put into practice 1 September 2001. This is the second entire emendation after “law of air pollution prevention and control” passed by the Committee of People's congress Council in September of 1987 and the first emendation by Committee of People's congress Council in 1995. The new law is an important law to prevent and control air pollution, it embodies governmental determination to enforce air pollution prevention and control and to improve environmental quality. In the emended law of air pollution prevention and control, important policies and tactics by the Central Committee of Communist Party and State Department are embodied for controlling air pollution, such as the control of the total amount of pollutants, a license system, a system of charging for cleaning up contamination instead of a system of charging for exceeding standards, reporting on city air pollution, enhancing prevention and cure of vehicles' emissions and city dust, popularization of the production and use of clean energy, and so forth. The emended law of air pollution prevention and control made more progress compared to the former in the following areas:
1. Reinforcing prevention. To enhance the control of emissions from vehicles, the emended law contains particular regulations on vehicle manufacture, use and maintenance, quality of fuel, monitoring and inspection.
2. Strengthening control of city dust. City governments are encouraged to adopt
53

measures such as afforestation, increasing the area of greenbelt per person, decreasing the area of bare land, so as to prevent dust pollution. Building construction or other dust-producing operations must adopt measures to prevent dust pollution according to local environmental protection regulations.
3. Prohibiting the exceedence of pollution standards. The original law only contained financial penalties for exceeding pollution standards and didn't regulated that it is an ‘irregularity’. The emended law stipulates that exceeding pollution standards is an irregularity.
4. Carrying out total control and licensing of air pollutant releases. The emended law of air pollution prevention and control states that the areas of poor air quality can be classified as acid rain control area and sulphur dioxide control areas by State Department's approval.
5. Establishing a system of emissions charging. The emended law made great progress on charging for emissions instead of just charging for excessive emissions. It is based on the “polluter pays” principle. “
6. Carrying out clean production. The emended law encourages the exploitation and use of clean energy such as solar energy, wind, waterpower, etc. It states that corporations should preferentially adopt clean production techniques to make full use of the energy and so decrease air pollutant.
7. Strengthening legal responsibility. The emended law includes stronger penalties and allows for greater flexibility in the implementation of the law.
In addition to this revised law, China is also implementing more specific projects in the areas of urban smoke, factory emission controls and inspection, acid rain control, SO2 Emission Control, Vehicle Emission Control Pilots on lead-free gasoline, Emissions Trading and SO2 tax economic instruments and various other projects. The policies and regulations in the areas of stationary and mobile sources are detailed below. Energy Sources By the end of September 2000, 3735 out of 4895 key industrial enterprises for which SO2 emissions exceeded 100 tonnes/year have complied with the emission standard, a 76 per cent compliance rate. From January to September 2000, 4732 mines producing high-sulphur coal have been closed, which resulted in a reduction in high-sulphur coal production by 19 million tons. 106 units using coal for power generation have been shut down. 862 small-scale cement and glass production factories and 393 small-scale iron and steel production plants have also been shut down. The development of natural gas as an environmentally sustainable alternative to coal and leaded gasoline use has begun in some Chinese cities; however, it is far from becoming widespread as of yet. In the Ninth Five Year Plan, China has stipulated its aim to produce 30,000 natural gas powered automobiles by the year 2000 and 200,000 by the year 2005. The Plan expects to reduce sulphur dioxide emissions to 21 million tonnes and save 1.5 million tonnes of gasoline. More studies to formulate effective and appropriate regulations to ensure compliance are still needed. China is also currently developing its Law of Energy Efficiency and has outlined the following energy efficiency goals for the Ninth Five Year Plan period: a) Convert less coal to electricity and improve efficiency
China plans to build high efficiency power plants near coal mines so that the energy used
54
Harry Vallack
Does this mean illegal?
Harry Vallack
?????????????

for coal transportation coal dust pollution during coal transport can be reduced. Coal consumption for electricity will be reduced from the current level of 427 g/kWh to 365 g/kWh. Efficient transmission lines will be built to reduce energy loss during transmission and transformation. Outdated urban electric transmission networks will be renovated. Various pumps and pneumatic machines, which currently consume over one third of the nation's electricity, will be improved. b) Publicise and disseminate cleaner coal technology China will promote coal gasification, coal and water mixture (CWM) technology, and mold coal. It will also recover and utilize coal bed methane to reduce global warming gas emissions and to save energy resources. c) Reform urban energy use The Government will increase combinations of heating and power supplies in urban areas. It will establish demonstration residential blocks with energy efficient air conditioning and central heating systems. d) Promote the development of renewable energy sources The Government will increase the use of other energy supplies, besides coal. It will produce 300,000 to 600,000 kW of nuclear power generators; import large-scale nuclear power plants for coastal areas where power shortages are severe; increase the hydropower supply to 80 million kilowatts; increase China's wind power generating capacity to 200,000 kilowatts; increase geo-thermal power to 3 million standard coal equivalent (SCE); and continue to explore solar energy potential. It will also encourage biogas energy in rural areas to reduce dependence on traditional biomass fuels. e) Deepen the energy price reform In an attempt to limit energy use, the Government will encourage efficient usage and gradually phase out energy subsidies to raise funds for the energy development programme. Vehicle Emissions Reduction Policies The Chinese government began to implement automotive emission standards in 1984. At present, the automotive emission standard formulated with reference to ECER15 is being carried out. Particulate emission standards for vehicular diesel engines were formulated in 2000. In June 2000, Chinese policies phased out leaded gasoline for vehicles, with the unleaded content in the gasoline above 99 per cent. With the use of unleaded gasoline across the country, lead emissions can be reduced by more than 1500 tonnes annually. The concentration of lead in the urban air will be substantially reduced. Those cities that use unleaded gasoline ahead of other cities have also begun to take the leadership in controlling other pollutants in the gasoline, such as sulphur, olefin and aromatic hydrocarbon. The State Quality and Technical Supervision Administration (SQTSA) has recently taken steps to improve air quality in China's cities. Four new standards tightening controls over vehicle exhaust emissions have been promulgated. These standards have been applied to a range of vehicles manufactured after the beginning of 2000, according to Yin Minghan,
55
Harry Vallack
What’s this?

director of the administration's Industry and Transportation Standardization Department. Liquefied petroleum gas (LPG) vehicles, compressed natural gas (CNG) vehicles and those powered by diesel engines, which are not covered by the existing State standards, will also be regulated by the new standards. The standards were established with reference to vehicle exhaust regulations of the UN Economic Commission for Europe. Current vehicle exhaust emission standards were issued 10 years ago, when private cars were not so common and environmental problems not so serious. Implementation of the new standards beginning next year is expected to result in a remarkable improvement in air quality, the official said. Tail-gas emissions are expected to be cut by 80 per cent. It is expected by the Government that the standards will also spur domestic automobile manufacturers to work towards more advanced technologies, and foster a stronger sense of responsibility for the whole society. Results of any assessment of the standards have yet to be seen. Key domestic auto manufacturers have been invited to participate in drafting the standards to ensure that the 80 per cent decrease in exhaust emissions is within their technological capabilities. The Chinese Government is also engaged in drafting State standards for unleaded petrol and diesel fuels citing fuel quality as another important factor in controlling the quality of tail gas emissions. Furthermore, in order to decrease the energy consumption and emission pollution of China's automotive products, the Chinese government has given support on the establishment of the joint venture corporation which will produce the electronic control system (EMS) of engines for vehicle use. According to the programme, a production capability of 1 million units was expected to be sold and applied in the domestic market by 2000. The United Nations and international financial organizations have paid close attention and given great support to China's automotive industry, particularly for research and development of energy efficiency, emission control, and safety improvement. The United Nation Development Programme (UNDP) has financed an emission control and passive safety project for the formulation of standards for China's automotive industry. The main organization undertaking this project is the China Automotive Technology and Research Centre. In addition, loans from the World Bank have provided financial support for the establishment of the State's key laboratory for automotive safety and energy economy at Tsinghua University. According to SEPA, the Chinese Government’s long-term objectives for reducing vehicle emissions through the internationally-sponsored project include: a) Improvement of the technical level of China's automotive products, and realize the targets of 50 per cent emission decrease, 10 per cent average energy efficiency, and increase safety performance by 100 per cent. b) Formulation and development of regulations that completely control automotive emissions and testing of evaluation methods for automotive emission and energy efficiency products. Reduction by 50 per cent of the emission of pollutants from petrol and diesel engines produced for domestically made vehicles and establish a related testing centre. c) Reduction of fuel consumption of motor vehicles by ten per cent compared with the present level, and improvement of the automobile emission level and safety performance. Establishment of an EMS System Engineering Centre, which will formulate the technical standards for the matching of EMS with engines, and will carry out the preliminary R&D
56

work for the application of the electronic technologies to motor vehicles. The project is implemented by the Ministry of Machinery Industry (MMI) and the National Environment Protection Agency (NEPA). It is hoped that the implementation of this project will give China more scientific and strict standards on vehicle emission, fuel consumption, and safety performance. The project will also greatly increase the ability of the State to monitor the automotive industry, to enhance the fairness and authority of the inspection of vehicles produced by both local and foreign manufacturers, and to help remove artificial international trade barriers. Through this project, it is also hoped that energy consumption will be further lowered. For example, a 10 per cent saving in fuel consumption would yield savings of 3 million tonnes of fuel per year thus greatly lower the emission of pollutants. In the area of alternative fuels, China is also experimenting with several programmes to try to find alternatives to conventional internal combustion engine vehicles. Within the last year, several cities have started pilot projects using compressed natural gas or liquefied natural gas buses, and in June 1998 China inaugurated an electric vehicle demonstration project with seventeen vehicles of various sizes in Shantou city- Nan Ao island, an area in northern Guandong Province. FUTURE CHALLENGES According to the Chinese Research Academy of Environmental Sciences, the main challenge for the future of China’s air pollution reduction lies in its population and socio-economic growth. Industrialization and globalization, urbanization and an ageing population are all factors which will contribute to air pollution in the country. In addition, China will also need to focus on efficiency of technology and energy measures, clean fuels, emissions reduction technologies, least costs option and regional adaptation. Cleaning up China’ air quality will be a long and arduous task. For Beijing alone, improving air quality to China’s grade II standards (average annual concentration of SO2 no more than 60 µg/m3, NO2 no more than 80 µg/m3 and respirable particulates no more than 100 µg/m3) would require the sum of RMB 35 000 million (US$4 200 million). To reach the same target for all 47 urban areas currently designated as key cities would cost US$40 000 million, according to Chinese government estimates. It is planned that Beijing will spend RMB 78 000 million to clean up its air between 1999 and 2003. This figure includes municipal expenditures as well as central government inputs. With the Beijing 2008 Olympic Games on the horizon, it is expected that China will make an extra effort to clean up its air and provide the necessary financial resources. REFERENCES “Status and Development of Vehicular Pollution in China,” Environmental Science, Vol. 7,
No. 4 (August 1996) China Environment Yearbook, various issues (China Environment Yearbook Press,
Beijing, various years) Fang Cai, “Stare Into the Sky: When Will It be Clear?” China Environment News (January
21, 1997) He Kebin et al., “The Status and Trend of Urban Vehicular Pollution,” Environmental
Science, Vol. 17, No. 4 (1996)
57

International Energy Agency, Energy Statistics and Balances: Non-OECD Countries, 1971-1995, and Energy Statistics and Balances: OECD Countries, 1960-1995 (Organisation for Economic Co-Operation and Development, Paris, 1997)
Jonathan Sinton, ed. China Energy Databook (University of California at Berkeley, Berkeley, 1996)
Michael Walsh, “Motor Vehicle Pollution in China: An Urban Challenge,” in China's Urban Transport Development Strategy: Proceedings of a Symposium in Beijing, November 8-10, 1995, World Bank Discussion Paper No. 352 (The World Bank, Washington, D.C., 1996)
National Environmental Protection Agency (NEPA), National Environmental Quality Report, 1991-1995 (NEPA, Beijing, 1996)
Pollution Control in the PRC: Air Pollution Page, Golden State (December 2001) <http://www.chinaenvironment.com>
Qiang, Cui, Chinese Research Academy of Environmental Sciences. “Air Pollution Management in Mainland China,” Air Pollution in the Megacities of Asia Workshop Presentation (September 4, 2001)
Robert S. Chapman et al., “Assessing Indoor Air Pollution Exposure and Lung Cancer Risk in Xuan Wei, China,” Journal of the American College of Toxicology, Vol. 8, No. 5 (1989)
SEPA (2001) State Environment Protection Agency (PRC), State of Environment Report 2000 (Beijing)
Stephen Stares and Liu Zhi, “Motorization in Chinese Cities: Issues and Actions,” in China's Urban Transport Development Strategy: Proceedings of a Symposium in Beijing, November 8-10, 1995, World Bank Discussion Paper No. 352 (The World Bank, Washington, D.C., 1996)
Streets, et al (2000) ‘Sulfur dioxide emissions in Asia in the period 1985-1997’, Atmospheric Environment 34, pp4413-4424
The World Bank, “Clear Water, Blue Skies: China's Environment in the New Century” (The World Bank, Washington, D.C., 1997)
World Health Organization (WHO), Health and Environment in Sustainable Development: Five Years After the Earth Summit (WHO, Geneva, 1997)
WRI (1998), World Resources Institute, “Regional Profile: China’s Health and Environment,” World Resources Report 1998-1999: Environmental Change and Human Health (Oxford University Press for the World Resources Institute)
58

4 AIR POLLUTION MANAGEMENT IN INDIA
T S Panwar, Tata Energy Research Institute, New Delhi, India INTRODUCTION Air pollution in India has been aggravated by a number of developments such as the growth in the size of cities, rapid economic development, industrialization and increasing traffic and levels of energy consumption. The movement of people into urban areas together with the increase in consumption patterns and unplanned urban and industrial development have led to the problem of air pollution. This has resulted in a number of megacities in India becoming among the worst polluted cities in the World. The focus of this paper is on air pollution in the three megacities of Delhi, Mumbai, and Calcutta. The population of India has increased from 846 million to1027 million during the period 1991–2001. In addition, the urban conurbations have also shown an high increase in the population (see Table 4.1). Table 4.1 Population of top three urban agglomerates (Mumbai, Calcutta and Delhi)
Urban conurbation
Population (1991)*
Million
Population (2001) **
Million
Calcutta (Kolkata) 11.0 13.2 Delhi 8.4 12.8 Mumbai 12.6 16.4
Source: * Nanda (1992); ** www.censusindia.net/results/million_plus.html The number of motor vehicles in India has increased from 0.3 to 37.2 million during the period 1951–1997 (MoST, 2000). Of this number 32 per cent of vehicles are concentrated in 23 metropolitan cities. Delhi accounts for about 8 per cent of the total registered vehicles and has more registered vehicles than the cities of Mumbai, Calcutta and Chennai taken together. The total registered motor vehicles (1997) in Delhi, Mumbai and Calcutta were 28.5, 8.0 and 5.9 lakhs (100,000) respectively. (MoST, 2000). The tremendous increase in the number of vehicles in Delhi has contributed significantly to increased consumption of petroleum products. The consumption of petrol between 1980–1981 and 1998–1999 has increased from 1.33 to 5.17 hundred thousand tons while that for diesel has increased from 3.77 to 11.90 lakhs tons. In Delhi, two-wheelers and cars/jeeps constitute about 88 per cent of the total registered vehicles while buses constitute just 1 per cent. The growth in the number of private vehicles is related to the lack of efficient public transport and unplanned urban development. Government owned, as well as private, bus fleet comprises the main public transportation system in Delhi. Figure 4.1 shows the different types of vehicles in Delhi in 1998 (GNCTD, 2000a).
59

Figure 4.1 Proportion of different types of vehicles in Delhi Source: n/a A number of large-sized industries and thermal power plants exist in and around the large urban centres. In addition, small scale industries are also an important source of pollution with a very high aggregate pollution potential. When located in densely populated areas the industrial units tend to affect a large portion of the urban population. In Delhi there are approximately 126,000 small and medium scale industrial units (GNCTD, 2000a). Out of a total of 125,000 industries there are 98,000 industries in the areas categorized as non-conforming with the Master Plan of Delhi (MoEF, 1997). In recent years, the Supreme Court has requested a number of polluting industries in Delhi to cease operation and has required that certain categories of industries be moved from non-conforming to conforming areas.
Cars and Jeeps26%
Goods vehicles5%
Auto Rickshaws3%Taxis
1%Buses
1%
Motor Cyclesand Scooters
64%
Similarly, energy generated locally from power plants contributes to the air pollution load in the city. For example, in Delhi there are currently three coal-based thermal power plants, namely Rajghat, Indraprastha and Badarpur and a gas-based power plant. The Delhi power generation scenario shows that, in order to meet the future projected requirements, an increasing reliance has to be placed on electricity imports. Figure 4.2 shows the electricity availability and future energy requirements in Delhi.
0
5000
10000
15000
20000
25000
30000
35000
1996-97 1996-97 1996-97 2000-01 2006-07
Year
AvailabilityRequirement
Locallygenerated
(DVB share)
Purchased (Centralplants & other
sources)Total available
CEA projection
CEA projection
Figure 4.2 Electricity availability and future requirement in Delhi (Million kWh) Source: CMIE (2000), GNCTD (2000b)
60

Besides transport and industrial sectors, the domestic and commercial sectors also contribute to the overall pollution load in urban areas. Other sources of air pollution include the use of generators, waste burning, construction activities, and roadside airborne dust due to vehicular movement. In recognition of the severity of the pollution problem, Delhi has been designated as an air pollution control area. In addition to anthropogenic sources, climate and natural sources also play an important role in the build up of pollution levels. Delhi has a semi-arid climate with an extreme seasonal hot summer and heavy rainfall in monsoon months and very cold winters. Mean monthly temperature ranges from 14.3 °C in January (minimum 3 °C) to 34.5 °C in June (maximum 47 °C). The annual mean temperature is 25.3 °C. Dust storms occur frequently during summer months leading to build up of particulate matter in the atmosphere. The monsoon season witnesses the least pollution due to frequent washout of pollutants along with rains. During winter, ground-based temperature inversions are a regular feature that restrict mixing height to low levels. The overall impact of lower temperatures, calm conditions, lower mixing height and temperature inversions during winter prevents pollutant dispersal (CPCB, 2000). Mumbai has a mean elevation of 11 metres above sea level and consists of several islands on the Konkan coast. It has a tropical savannah climate. The annual average temperature is 25.3 °C, with a maximum of 34.5 °C in June and minimum of 14.3 °C in January. Average annual precipitation is 2,078 millimetres with July having the maximum rainfall. High pollution concentrations usually occur in the winter when adverse meteorological situations with weak winds may prevail. Mumbai harbour is India’s busiest, handling more than 40 per cent of India’s maritime trade. Besides being India’s financial and commercial centre, Mumbai is also one of the most industrialized Indian city. There are approximately 40,000 industries in the city. Major air polluting industries include a large fertilizer/chemical complex, two oil refineries and a thermal power plant – all based in Chembur, eastern Mumbai. Three suburban, surface, electric train systems provide the main public transportation, together with the municipality-owned bus fleet (World Bank, 1997). Calcutta has a tropical Savannah climate with a marked monsoon season. Monthly mean temperatures range from 20–31 °C, and the maximum temperatures often exceed 40 °C. Total annual rainfall is about 1,600 millimetres with a maximum during the monsoon season from June to September. Moderate north-westerly winds prevail for most of the year with a high frequency of calms. The pre-monsoon and monsoon season is dominated by strong south-westerly winds with greatest air ventilation potential (UNEP/WHO, 1995). The main modes of public transportation in Calcutta are the buses and mini-buses, besides the Metro rail and the trams. Amongst the three metropolitan cities, Mumbai and Calcutta are located in coastal areas and influenced by sea based disturbances, while Delhi is mainly influenced by its inland position. The climatic conditions of Mumbai and Calcutta are influenced by periodic sea-originated winds and meteorological conditions. The land and sea breezes are regular diurnal features in coastal areas and these natural wind movements cause ventilation effects and help in maintain the quality of ambient air over coastal cities (CPCB, 2000).
61

STATUS OF URBAN AIR POLLUTION It is estimated that about 3,000 tonnes of air pollutants are emitted every day in Delhi. Figure 4.3 presents estimates for the growth of total air pollution emissions in Delhi over the period 1991–1997. The transport, industrial and domestic sectors are major sources of polluting emissions in Delhi. Table 4.2 shows the percentage contribution of major sources to air pollution. The contribution from vehicular traffic alone has increased from 64 per cent to 72 per cent in the last decade.
0
500
1000
1500
2000
2500
3000
3500
1991 1992 1993 1994 1995 1996-97
Year
(tonn
es)
Pollution load
Figure 4.3 Estimated daily air pollution emissions in Delhi Source: MoEF (1997) Table 4.2 Contribution of various sectors to ambient air pollution
Sector
1970-1971
1980-1981
1990-1991
2000-2001*
Industrial 56% 41% 29% 20% Transport 23% 42% 63% 72% Domestic 21% 18% 7% 8%
Source: MoEF 1997 Table 4.3 shows that vehicle exhaust emissions in Delhi are much greater than the vehicular emissions of other metropolitan cities such as Calcutta, Mumbai, and Chennai. Table 4.3 Estimated vehicular emissions in metropolitan cities, 1994
Vehicular emissions (tonnes per day) City PM SO2 NOX HC CO Total Delhi 10.30 8.96 126.46 249.57 651.01 1046.30Mumbai 5.59 4.03 70.82 108.21 469.92 659.57Bangalore 2.62 1.76 26.22 78.51 195.36 304.47Calcutta 3.25 3.65 54.69 43.88 188.24 293.71Chennai 2.34 2.02 28.21 50.46 143.22 226.25
Source: CPCB (1995)
62

For Mumbai, a comprehensive emissions inventory was developed as part of the URBAIR project (World Bank, 1997). Table 4.4 gives the total air pollutant emissions from various sources in Greater Mumbai. Table 4.4 Total annual emission in Greater Mumbai, 1992-1993 (tonnes/year) Emission sources
Total
suspended particulate
matter (TSP)
PM10
(Particulate matter
less than 10 microns)
Sulphur dioxide (SO2)
Nitrogen oxides
(NOx)
Vehicle exhaust 3,673 3,673 3,490 19,520 Re-suspension from roads
10,200 2,550 - -
Power plant 1,500 1,500 26,000 11,200 Industrial (fuel combustion)
1,817 1,496 38,710 4,085
Industrial processes
6,053 - - -
Domestic 4,432 2,235 1,688 1,344 Refuse burning/ dumps
4,108 4,108 26 153
Marine 560 469 9,350 1,245 Total 32,343 16,031 79,264 37,547 Source: World Bank (1997) The Greater Mumbai report highlighted the importance of accounting for emissions from sources such as the re-suspension of road dust and refuse burning. Total suspended particulate (TSP), re-suspension of road dust, stone crushers, refuse burning, wood combustion and diesel vehicle exhaust were identified as the major contributors to the total TSP load. Similarly, for sulphur dioxide (SO2) emissions, the major contributors were industrial fuel oil combustion and power plants. In the case of nitrogen oxides (NOX), major emission sources were vehicles and power plants. Ambient Air Quality Under the National Ambient Air Quality Monitoring (NAAQM) network, SPM, SO2, and NO2 have been identified for regular monitoring at all the 290 stations spread across the country. CPCB (2000) analysed the status and trends of air quality at various cities in India for the period 1990–1998. Figures 4.4–4.6 show the minimum, maximum and annual averages of SPM, SO2, and NO2 in sixteen cities (including Delhi, Mumbai and Calcutta) in the country between 1990 and 1998 (TERI, 2001).
63

Suspended particulate matter Suspended particulate matter (SPM) is one of the most important air pollutants in most of the urban areas in India and permissible standards are frequently exceeded at several monitoring locations. Levels of SPM have been consistently high in various cities over the past several years. The annual average limits of suspended particulate matter for residential areas (140 µg/m3) and for industrial areas (360 µg/m3) have been frequently exceeded in most cities. The maximum SPM values were observed in Kanpur, Calcutta, and Delhi, while low values have been recorded in the south Indian cities of Chennai and Bangalore. The SPM non-attainment areas are dispersed throughout the country. The widespread severity of the SPM problem in the country is due to the synergistic effects of both anthropogenic and natural sources.
0
100
200
300
400
500
600
700
Che Ban Hyd Pondi Nag Pune Mum Cha Ahm Bho Jai How Pat Del Cal Kan
µ
MaxMinAvg
NAAQS residential
NAAQS industrial
Figure 4.4 Range and mean of annual averages (1990-98) of SPM in various cities Notes - Abbreviation of cities: Che-Chennai; Ban-Bangalore; Hyd-Hyderabad; Pondi-Pondicherry; Nag-Nagpur; Pune-Pune; Mum-Mumbai; Cha-Chandigarh; Ahm-Ahmedabad; Bho-Bhopal; Jai-Jaipur; How-Howrah; Pat-Patna; Del-Delhi; Cal-Calcutta; Kan-Kanpur. Source: CPCB (2000) Sulphur dioxide Based on the mean average sulphur dioxide (SO2) value the problem is significant in Howrah, Calcutta and Pondicherry, where annual average limits (60 and 80 µg/m3 for residential and industrial areas) have been exceeded over recent years. SO2 levels have been generally below air quality standards in most, but not all cities in India. Some of the measures taken such as cleaner fuel (reduction of sulphur content in diesel) and fuel switching have contributed to lower SO2 ambient levels.
64

0
20
40
60
80
100
120
Nag Cha Jai Bho Kan Hyd Che Pat Del Ahm Ban Mum Pune Pondi Cal How
µ
MaxMinAvg
NAAQS industrial area
NAAQS residential area
Figure 4.5 Range and mean of annual averages (1990-98) of SO2 in various cities Source: CPCB (2000) Nitrogen dioxide The air quality monitoring data indicate that the annual average nitrogen dioxide concentration has been within the annual average limit (60 µg/m3 for residential area and 80 µg/m3 for industrial areas) at most urban cities including Calcutta, Mumbai and Delhi.
0
50
100
150
200
250
Nag Che Kan Cha Bho Ban Pat Jai Ahm Hyd Del Mum Cal Pondi Pune How
µ
M axM inAvg
NAAQS industrial area
NAAQS residential area
Figure 4.6 Range and mean of annual averages (1990-98) of NO2 in various cities Source: CPCB (2000)
65
Status of Other Air Pollutants The salient results of additional parameters at some stations in the metropolitan cities of Delhi, Calcutta and Mumbai are as follows (CPCB, 1998): •
•
• • •
The annual mean concentration of respirable particulate matter (RPM) is much higher than the prescribed limits of 120 µg/m3 (industrial) and 60 µg/m3 (residential and other uses) in Delhi and Calcutta. For example, the RPM annual average concentration at ITO (Delhi) in 2000 was 190 µg/m3, which is more than three times the standard prescribed for residential areas. The ratio of RPM to SPM at this site is about 0.39. However, RPM in Mumbai and Chennai is not very high but is greater than ambient air quality standards.
Though particulate lead in the ambient air of Calcutta and Delhi is higher when compared to Mumbai, it is well within the prescribed limits for the different area classes.
The concentration of polycyclic aromatic hydrocarbons (PAHs) is showing an upward trend. However, at present permissible limits for PAHs have not been determined.
Lead-free gasoline has been introduced throughout the country since 1 February, 2000 and in all metropolitan cities since 1995. This has resulted in a downward trend in the lead concentrations in the ambient air (CPCB, 2000). The Greater Mumbai report highlights the fact that the TSP frequently exceed the WHO air quality guideline at all stations and concentrations at street crossings are sometimes extremely high, exceeding the WHO air quality guideline by a factor of 10 or more. Further, relative to their respective air quality guidelines, TSP and PM10 are the most important pollutants in Mumbai. Air quality at traffic intersections Traffic intersections are recognized as micro-environments experiencing high pollution loads. Air quality monitoring conducted at different traffic intersections in Delhi (MoEF, 2000) revealed the following:
RPM as well as SPM was excessively high at all the monitoring locations. The 24 hourly ambient air quality standards for SPM (200 µg/m3) and RPM (100 µg/m3) are exceeded at all the traffic intersections. The maximum concentration observed was 1448 µg/m3. The RPM (or PM10) concentrations at the different sites varied from 150–553 µg/m3 and thus, some of the values were as high as 5.5 times the standard. SO2 was recorded within limits at all the locations. NO2 was recorded well within the limits except a few locations. The CO levels at most locations was much higher than the prescribed permissible limit. This is because of high traffic density and large number of motor vehicles operating on the roads.
Noise pollution Studies by the CPCB on the ambient noise levels show that they exceed the prescribed standards in most of the big cities (MoEF 1998). The major sources of noise are vehicles, industrial manufacturing processes and festival noise.
66

Air Pollution and Health Impacts In India, millions of people breathe air with high concentrations of pollutants. The air is highly polluted in terms of SPM in most cities. This has led to a greater incidence of associated health effects on the population manifested in the form of sub-clinical effects, impaired pulmonary functions, use of medication, reduced physical performance, frequent medical consultations and hospital admissions with complicated morbidity and even death in the exposed population. Respiratory infections amount for 10.9 per cent of the total burden of diseases, which may be both due to presence of communicable diseases as well as high air pollution levels (World Bank, 1993). A WHO/UNEP study (1992) compared prevalence of respiratory diseases in different areas of Mumbai, classified according to ambient average concentrations of SO2. The study revealed a relatively higher prevalence of most respiratory diseases in polluted urban areas compared with rural control area. In Delhi, the increasing levels of air pollution are responsible for higher incidence of respiratory diseases, cancer, and heart diseases. Polluted air is responsible for over 40 per cent of the emergency hospital admissions of patients with breathing and heart problems. This was revealed in a 1999 epidemiological study by All India Institute of Medical Sciences which focused on 100,000 patients who were rushed in following aggravation of symptoms of asthma, chronic bronchitis and heart ailments. According to another study conducted in 10 schools of Delhi in 1996 by Vallabh Bhai Patel Chest Institute, the cumulative prevalence of asthma in children was 15.3 per cent (GHK International Ltd, 2000). Brandon et al (1995) estimated the total magnitude of economic costs associated with environmental degradation in India. Using the 1991–1992 air pollution data for particulates, SO2, NOX, and lead from 36 cities, health impacts were estimated in terms of reductions in morbidity and mortality if pollutant levels in these cities were reduced to the WHO annual average standard. The total health costs due to air pollution were estimated to be US $517-2102 million (see Table 4.5). The physical impacts were 40,000 premature deaths avoided with 7,500 (19 per cent) in Delhi, 5,700 (14 per cent) in Calcutta and 4,500 (11 per cent) in Mumbai. Table 4.5 Annual costs of ambient air pollution levels (1991–1992) in Indian cities exceeding WHO guidelines (US $ Million)
Premature deaths
Hospital admissions and sickness requiring medical attention
Minor sicknesses (including restricted activity days and respiratory symptom days)
City
Lower estimate
Upper estimate
Lower estimate
Upper estimate
Lower estimate
Upper estimate
Delhi 32 300 5 10 65 88 Mumbai 19 179 3 6 42 57 Calcutta 24 229 4 8 48 65 Total for 36 cities 170 1614 25 50 322 437
Source: Brandon et al (1995)
67

The World Bank (1997) Greater Mumbai study estimated the costs that could be attributed to the impacts on health and mortality due to high levels of PM10 in Mumbai. The total costs in 1991 due to the effect of PM10 alone was approximately Rs. 18.2 billion. Table 4.6 shows the estimated annual episodes of illness and premature deaths due to ambient SPM levels in Delhi and the corresponding monetary costs. The people residing in higher pollution zones show the greater percentage occurrence of respiratory diseases (see Table 4.7). Table 4.6 Estimates of annual episodes of illness and premature deaths and corresponding monetary costs due to SPM in Delhi 1991–1992 1995 Premature death 7,491 9,859 Annual episodes of illness 3948923 5197018 Cost of premature deaths 651.0 Rs 856.7 Rs Costs of medical treatment 24.6 Rs 32.4 Rs
Source: As quoted in GHK International Ltd. (2000) Table 4.7 Percentage prevalence of chronic respiratory symptoms and chronic airway diseases in non-smoking subjects in urban areas according to pollution zones Symptoms and diseases
Low pollution zone Medium-high pollution zone
Lower economic class
per cent of total women sampled having health
problem
per cent of total women sampled
having health problem
(1) Chronic cough 7.2 10.8 (2) Chronic phlegm 6.6 9.2 Higher economic class
per cent of total women sampled having health
problem
per cent of total women sampled
having health problem
(1) Chronic cough 3.0 6.8 (2) Chronic phlegm 2.5 5.7
Source: As quoted in GHK International Ltd (2000) TERI (1998) estimated the incidence of mortality and morbidity in different groups in India due to exposure to PM10 and translated these impacts into economic values. The results indicated 2.5 million premature deaths and total morbidity and mortality costs of Rs 885 billion to Rs 4250 billion annually.
68

OVERVIEW AND EVALUATION OF URBAN AIR POLLUTION MANAGEMENT The government has taken a number of measures such as legislation, emission standards for industries, guidelines for siting of industries, environmental audit, EIA, vehicular pollution control measures, pollution prevention technologies, action plans for problem areas, development of environmental standards, and promotion of environmental awareness. However, despite all these measures, air pollution still remains one of the major environmental problems. At the same time, there have been success stories as well, such as the reduction of ambient lead levels (due to introduction of unleaded petrol) and comparatively lower SO2 levels (due to progressive reduction of sulphur content in fuel). Existing Policy Legislation The government has formulated a number of legislative measures, policies and programmes for protecting the environment. Some of these related to air pollution are the Air (Prevention and control of pollution) Act, 1981 and the Environment (Protection) Act, 1986. India has also adopted the Male declaration on Control and Prevention of Air Pollution and its Likely Transboundary Effects for South Asia in April 1998. Ambient air quality standards Ambient air quality standards (both short-term, i.e., 24 hourly, and long-term, i.e., annual) have been laid down for industrial, residential/rural/other, and sensitive areas with respect to pollutants such as SO2, NOX, SPM, RPM, NH3 and Pb. For CO, 1 hour and 8 hour standards have been prescribed. Guidelines for siting of industries Guidelines for siting industries are prescribed so that the possible adverse effects on the environment and quality of life can be minimised. Some natural life-sustaining systems and specific land-uses are more sensitive, and thus the minimum distance for siting a given industry has been prescribed in such cases. Environmental impact assessment Environmental Impact Assessment (EIA) is mandatory for 29 specific activities/projects and also for some of the activities to be taken up in identified areas such as the coastal zone. The procedure for examining the impact of different activities includes the preparation of an EIA report, holding a public hearing and examination by a duly constituted expert committee (MoEF 1999). MoEF has also taken up carrying capacity-based regional planning studies in certain selected areas of the country including the National Capital Region. Emission standards for industries The CPCB has laid down the maximum permissible limits for different pollutants for many categories of industries that contribute to air pollution. The standards have been notified by MoEF under the Environment (Protection) Act 1986. Environmental audit Submission of an environmental statement by polluting units to the concerned State Pollution Control Boards has been made mandatory under the Environment (Protection) Act, 1986.
69

Zoning atlas for siting of industries In order to delineate the areas that are suitable for industrial siting, a district-wise zoning atlas project has been taken up by the CPCB that zones and classifies the environment in a district. The industrial zones are identified based on the sensitivity and pollution-receiving potential of the district (MoEF, 2000). Development of pollution prevention technologies Industries are encouraged to use cleaner and low waste or no waste technologies to reduce waste generation and the emission of pollutants (CPCB, 2000). There is an opportunity for the demonstration and replication of cleaner technologies in clusters of small-scale industries. Beneficiated coal The Ministry of Environment and Forests has made it mandatory for thermal power plants located more than 1,000 km from the coal pit-head, or in urban, ecologically sensitive or critically-polluted areas, to use beneficiated/blended coal containing ash no more than 34 per cent, with effect from June 2002. The power plants using FBC (Fluidized Bed Combustion) and an IGCC (Integrated Gasification Combined Cycle) combustion technologies are, however, exempted from using beneficiated coal irrespective of their locations. Pollution control in problem areas Twenty-four problem areas have been identified in the country for pollution control through concerted efforts involving all the concerned agencies/industries. Action plans have been prepared and are being implemented (MoEF, 2000). Epidemiological studies MoEF has initiated the environmental epidemiological studies in seven critically polluted areas. The initial feedback from the studies indicate that the incidence of symptomatic morbidity (eye irritation, respiratory problem and skin lesion/irritation) is high in areas of industrial activity. However, no direct correlation between morbidity and mortality rates and environmental pollution could be established. Control of Vehicular Pollution The various measures taken by government to mitigate emissions from transport sector are as follows: Stringent emission norms Mass emission standards for new vehicles was first introduced in India in 1991. Stringent emission norms along with fuel quality specifications were laid down in 1996 and 2000. Euro I norms are applicable from 1 April 2000 and Euro II norms will be applicable all over India from 1 April 2005. However, in the case of the National Capital Region (NCR), the norms were brought forward to 1 June 1999 and 1 April 2000 for Euro I (Bharat Stage I) and Euro II (Bharat Stage II), respectively (CPCB, 1999; SIAM, 1999). Cleaner fuel quality To conform to the stringent emission norms, it is imperative that both fuel specification and engine technologies go hand in hand. Fuel quality specifications have been laid down by the Bureau of Indian Standards (BIS) for gasoline and diesel for the period 2000–2005 and beyond 2005 for the country.
70
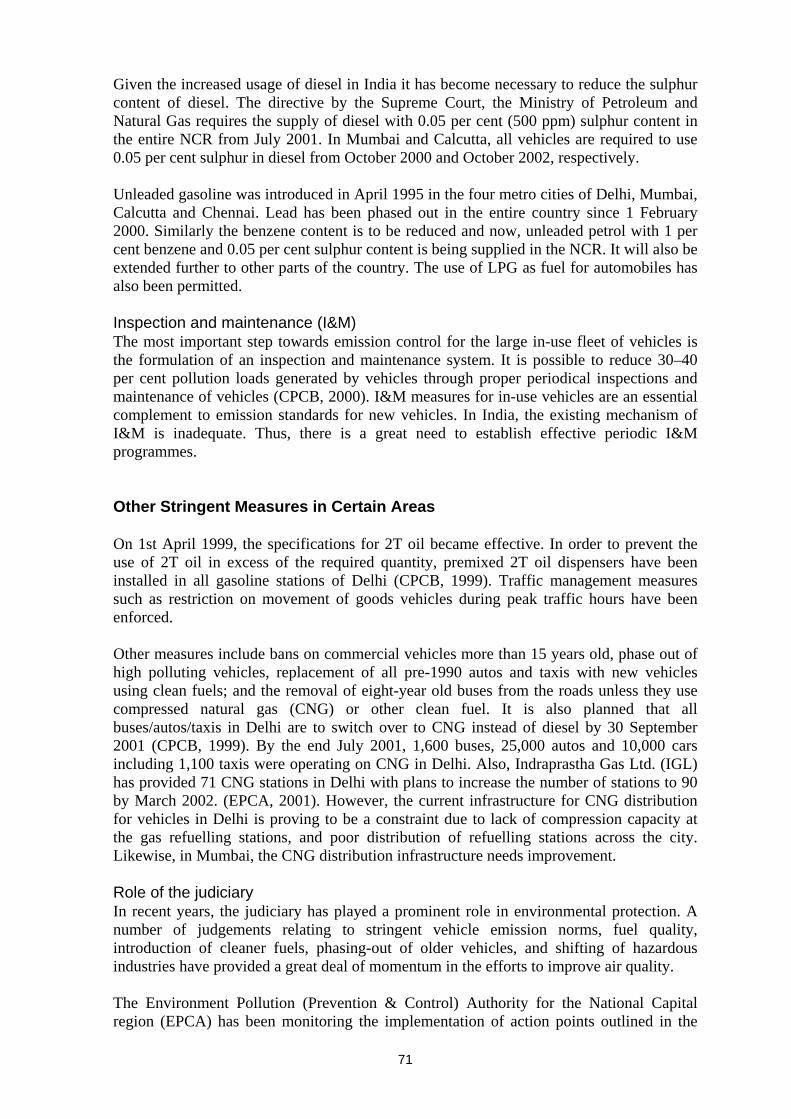
Given the increased usage of diesel in India it has become necessary to reduce the sulphur content of diesel. The directive by the Supreme Court, the Ministry of Petroleum and Natural Gas requires the supply of diesel with 0.05 per cent (500 ppm) sulphur content in the entire NCR from July 2001. In Mumbai and Calcutta, all vehicles are required to use 0.05 per cent sulphur in diesel from October 2000 and October 2002, respectively. Unleaded gasoline was introduced in April 1995 in the four metro cities of Delhi, Mumbai, Calcutta and Chennai. Lead has been phased out in the entire country since 1 February 2000. Similarly the benzene content is to be reduced and now, unleaded petrol with 1 per cent benzene and 0.05 per cent sulphur content is being supplied in the NCR. It will also be extended further to other parts of the country. The use of LPG as fuel for automobiles has also been permitted. Inspection and maintenance (I&M) The most important step towards emission control for the large in-use fleet of vehicles is the formulation of an inspection and maintenance system. It is possible to reduce 30–40 per cent pollution loads generated by vehicles through proper periodical inspections and maintenance of vehicles (CPCB, 2000). I&M measures for in-use vehicles are an essential complement to emission standards for new vehicles. In India, the existing mechanism of I&M is inadequate. Thus, there is a great need to establish effective periodic I&M programmes. Other Stringent Measures in Certain Areas On 1st April 1999, the specifications for 2T oil became effective. In order to prevent the use of 2T oil in excess of the required quantity, premixed 2T oil dispensers have been installed in all gasoline stations of Delhi (CPCB, 1999). Traffic management measures such as restriction on movement of goods vehicles during peak traffic hours have been enforced. Other measures include bans on commercial vehicles more than 15 years old, phase out of high polluting vehicles, replacement of all pre-1990 autos and taxis with new vehicles using clean fuels; and the removal of eight-year old buses from the roads unless they use compressed natural gas (CNG) or other clean fuel. It is also planned that all buses/autos/taxis in Delhi are to switch over to CNG instead of diesel by 30 September 2001 (CPCB, 1999). By the end July 2001, 1,600 buses, 25,000 autos and 10,000 cars including 1,100 taxis were operating on CNG in Delhi. Also, Indraprastha Gas Ltd. (IGL) has provided 71 CNG stations in Delhi with plans to increase the number of stations to 90 by March 2002. (EPCA, 2001). However, the current infrastructure for CNG distribution for vehicles in Delhi is proving to be a constraint due to lack of compression capacity at the gas refuelling stations, and poor distribution of refuelling stations across the city. Likewise, in Mumbai, the CNG distribution infrastructure needs improvement. Role of the judiciary In recent years, the judiciary has played a prominent role in environmental protection. A number of judgements relating to stringent vehicle emission norms, fuel quality, introduction of cleaner fuels, phasing-out of older vehicles, and shifting of hazardous industries have provided a great deal of momentum in the efforts to improve air quality. The Environment Pollution (Prevention & Control) Authority for the National Capital region (EPCA) has been monitoring the implementation of action points outlined in the
71
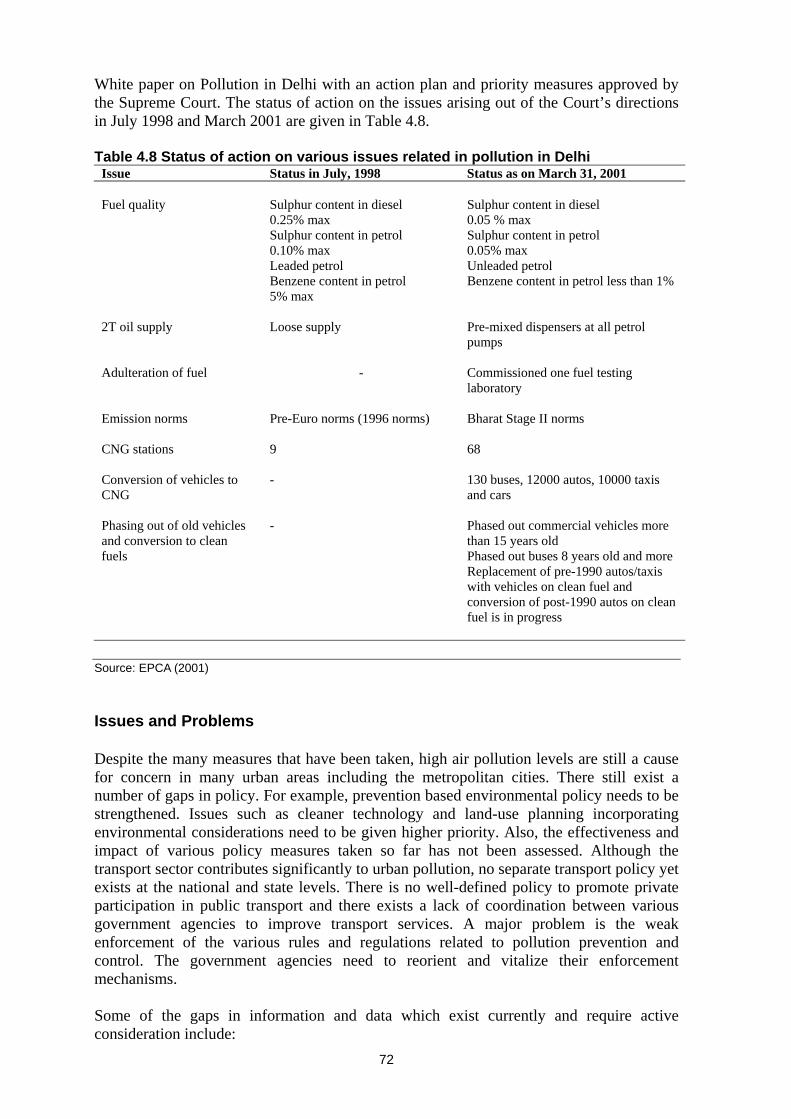
White paper on Pollution in Delhi with an action plan and priority measures approved by the Supreme Court. The status of action on the issues arising out of the Court’s directions in July 1998 and March 2001 are given in Table 4.8. Table 4.8 Status of action on various issues related in pollution in Delhi
Issue Status in July, 1998 Status as on March 31, 2001 Fuel quality
Sulphur content in diesel 0.25% max Sulphur content in petrol 0.10% max Leaded petrol Benzene content in petrol 5% max
Sulphur content in diesel 0.05 % max Sulphur content in petrol 0.05% max Unleaded petrol Benzene content in petrol less than 1%
2T oil supply Loose supply Pre-mixed dispensers at all petrol pumps
Adulteration of fuel - Commissioned one fuel testing laboratory
Emission norms Pre-Euro norms (1996 norms) Bharat Stage II norms
CNG stations 9 68
Conversion of vehicles to CNG
- 130 buses, 12000 autos, 10000 taxis and cars
Phasing out of old vehicles and conversion to clean fuels
- Phased out commercial vehicles more than 15 years old Phased out buses 8 years old and more Replacement of pre-1990 autos/taxis with vehicles on clean fuel and conversion of post-1990 autos on clean fuel is in progress
Source: EPCA (2001) Issues and Problems Despite the many measures that have been taken, high air pollution levels are still a cause for concern in many urban areas including the metropolitan cities. There still exist a number of gaps in policy. For example, prevention based environmental policy needs to be strengthened. Issues such as cleaner technology and land-use planning incorporating environmental considerations need to be given higher priority. Also, the effectiveness and impact of various policy measures taken so far has not been assessed. Although the transport sector contributes significantly to urban pollution, no separate transport policy yet exists at the national and state levels. There is no well-defined policy to promote private participation in public transport and there exists a lack of coordination between various government agencies to improve transport services. A major problem is the weak enforcement of the various rules and regulations related to pollution prevention and control. The government agencies need to reorient and vitalize their enforcement mechanisms. Some of the gaps in information and data which exist currently and require active consideration include:
72

•
•
• • • • •
Strengthening of monitoring at pollution hotspots (e.g. traffic intersections) and more stations to be established and increased frequency of monitoring. Additional air quality parameters need to be monitored such as ozone, benzene, PAH, PM2.5, dry deposition of sulphates and nitrates. Private/community participation in monitoring activity. Emission factor development for various activities. Emission load mapping at regular intervals for all the urban areas. Air pollution modelling should be used as a tool for forecasting and urban planning. Strengthening of information on number of vehicles on road, vehicle usage, industrial statistics including emissions, fuel consumption, technology used and pollution control equipment installed.
Identification of Best Practices in Urban Air Pollution Management In recent years, the public is becoming increasingly aware about the problem of air pollution. Various articles are published in the newspapers and information is being broadcast on television about air pollution levels in the major cities. In addition, a number of NGOs as well as the government agencies are becoming active in creating awareness. One of the best examples is the reduction in air pollution and noise levels on Diwali festival due to the mass awareness created amongst the school children and the general public. Another example of best practice is the significant improvements in vehicle technology and the emission standards together with improvements in the fuel quality. Vehicular emission standards have been progressively tightened with the introduction of Euro I and II emission norms for new vehicles. Better fuel quality specifications (unleaded petrol, reduction of benzene in petrol and reduction of sulphur in diesel) have been put in place. This has resulted in a significant reduction in lead levels in ambient air and the SO2 levels have also reduced in a number of cities. The siting of industries is also receiving increased attention. If industries are located in populated residential areas, the health effects are quite significant. In Delhi, the Courts ordered that the polluting industries and industries operating in non-conforming areas are to be either closed or shifted to other areas. Efforts are now being made to target other non-point sources of pollution. The open incineration/combustion of dry leaves, old tyres, plastics, and garbage has now been prohibited in Delhi. There is also an encouraging trend towards shifting to cleaner fuels. For example, LPG is becoming more popular as a domestic cooking fuel. In the transport sector, CNG has been introduced in Mumbai and Delhi. In the industrial sector, the shift from coal to LSHS/gas has had a positive impact on the air quality in Mumbai.
73

RECOMMENDATIONS Despite the legislative and policy measures introduced, air pollution remains a major concern in India. Besides continuing and consolidating the ongoing schemes/programmes, new initiatives and definite programmes need to be formulated for the efficient management of urban air pollution (TERI, 2001). Vehicular Pollution Control Since motor vehicles are significant contributors to air pollution in most urban areas, vehicular pollution control deserves a high priority. A practical strategy should be devised that reduces both emissions and congestion using a mixed set of instruments, which are dictated by command and control, and/or the market based principles. Some of these are: • •
•
•
• •
•
•
•
• •
•
Augmentation and improvement of public transport system. Mass Rapid Transport System to be considered/expanded in the major urban areas. In Delhi, the Metro Rail project needs to be completed on schedule and integrated with existing transport system. Regulations affecting vehicles with a view to reducing the rate of growth in ownership of personal vehicles and their use. Improvements in traffic planning and management. Also, by-pass roads for major cities and construction of express highways linking major urban areas should be undertaken. Also, efforts should be made to facilitate movement of non-polluting modes of transport such as bicycles within cities by introducing dedicated lanes wherever possible. Progressive tightening of emission norms and fuel quality specifications. Greater promotion and use of alternative fuels such as CNG/LPG/Propane/battery operated vehicles. Expansion of CNG/LPG dispensing facilities. Improvement in vehicle technology (e.g. restriction on the two-stroke engines, emission performance warranty of vehicles by manufacturers). Phasing out of highly polluting vehicles. Strengthening of I&M system: The I&M system, comprising inspection, maintenance, and certification of vehicles, is crucial for regulating pollution for the large fleet of in-use vehicles. It should include testing of various elements of safety, road worthiness and compliance to pollution norms. Taxes on fuels, vehicles; the revenue so generated could be used for pollution control measures. Curbing fuel adulteration; state-of-the-art testing facilities and deterrent legal action. Setting up of a unified urban transport authority in place of existing multiplicity of authorities in Delhi and other cities.
Industrial Pollution Control
There should be a greater effort to introduce cleaner technologies such as: - Waste minimisation technologies involving process change, raw material
substitution, improved housekeeping, etc. - Waste utilisation technologies involving reclamation and utilisation of wastes as
secondary raw material. Action plan for fly ash utilisation from Thermal Power Plants should be implemented.
- Combustion modification for NOX reduction. - Incentives for the development and adoption of clean technology and emission
74
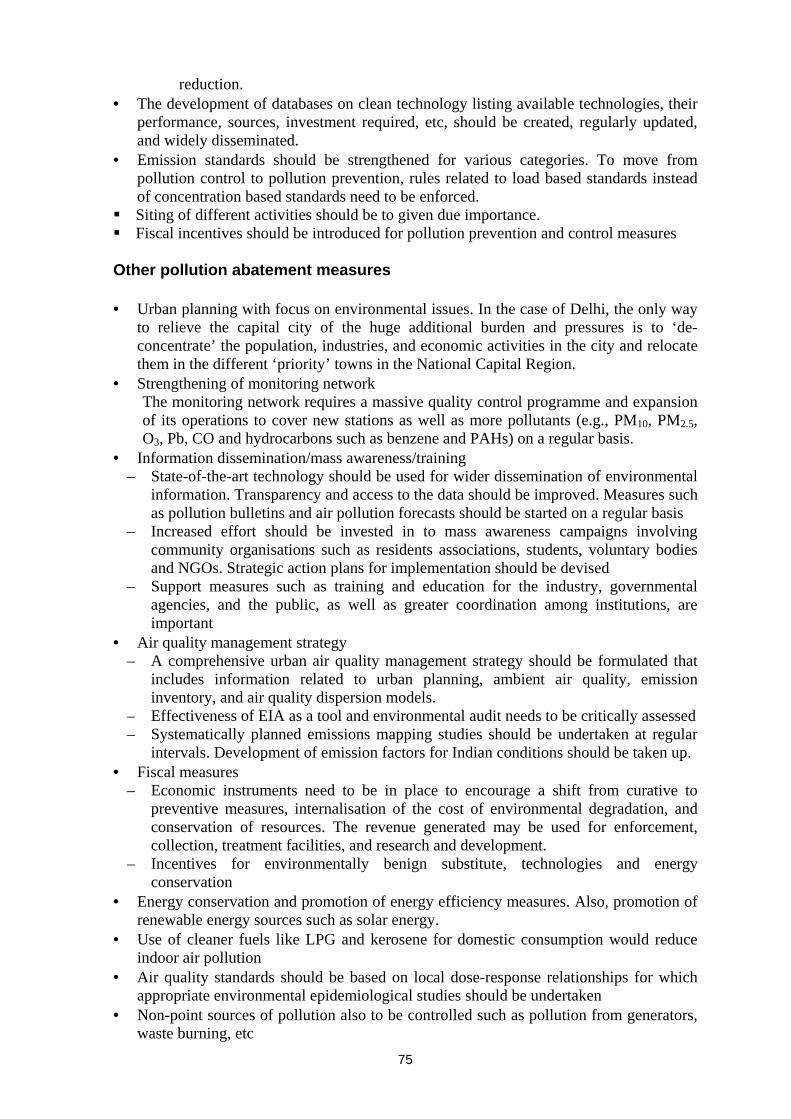
reduction. •
•
•
•
•
•
•
•
•
•
•
The development of databases on clean technology listing available technologies, their performance, sources, investment required, etc, should be created, regularly updated, and widely disseminated. Emission standards should be strengthened for various categories. To move from pollution control to pollution prevention, rules related to load based standards instead of concentration based standards need to be enforced.
Siting of different activities should be to given due importance. Fiscal incentives should be introduced for pollution prevention and control measures
Other pollution abatement measures
Urban planning with focus on environmental issues. In the case of Delhi, the only way to relieve the capital city of the huge additional burden and pressures is to ‘de-concentrate’ the population, industries, and economic activities in the city and relocate them in the different ‘priority’ towns in the National Capital Region. Strengthening of monitoring network The monitoring network requires a massive quality control programme and expansion of its operations to cover new stations as well as more pollutants (e.g., PM10, PM2.5, O3, Pb, CO and hydrocarbons such as benzene and PAHs) on a regular basis.
Information dissemination/mass awareness/training – State-of-the-art technology should be used for wider dissemination of environmental
information. Transparency and access to the data should be improved. Measures such as pollution bulletins and air pollution forecasts should be started on a regular basis
– Increased effort should be invested in to mass awareness campaigns involving community organisations such as residents associations, students, voluntary bodies and NGOs. Strategic action plans for implementation should be devised
– Support measures such as training and education for the industry, governmental agencies, and the public, as well as greater coordination among institutions, are important
Air quality management strategy – A comprehensive urban air quality management strategy should be formulated that
includes information related to urban planning, ambient air quality, emission inventory, and air quality dispersion models.
– Effectiveness of EIA as a tool and environmental audit needs to be critically assessed – Systematically planned emissions mapping studies should be undertaken at regular
intervals. Development of emission factors for Indian conditions should be taken up. Fiscal measures
– Economic instruments need to be in place to encourage a shift from curative to preventive measures, internalisation of the cost of environmental degradation, and conservation of resources. The revenue generated may be used for enforcement, collection, treatment facilities, and research and development.
– Incentives for environmentally benign substitute, technologies and energy conservation
Energy conservation and promotion of energy efficiency measures. Also, promotion of renewable energy sources such as solar energy. Use of cleaner fuels like LPG and kerosene for domestic consumption would reduce indoor air pollution Air quality standards should be based on local dose-response relationships for which appropriate environmental epidemiological studies should be undertaken Non-point sources of pollution also to be controlled such as pollution from generators, waste burning, etc
75

•
•
•
Increase in vegetation cover. Appropriate design of green belts/barriers and proper selection of plant species Noise pollution is also a major problem in metro cities and adequate preventive and control measures need to be taken. Enforcement mechanism
– Significant improvements in the enforcement mechanism are required to ensure that the policies are implemented both in letter and spirit
– Wherever necessary, the policies/standards need to be reformulated keeping in mind the fast-changing situaion
– An effective environment management plan should be devised that includes environmental strategy, regulation, institutional capacity-building, and economic incentives and penalties.
Regional cooperation in the management of air pollution in Asian mega-cities – Sharing of information and experiences about the various best practices adopted in
the different cities would be greatly helpful. CONCLUSION The major metropolitan cities in India are facing severe air pollution problems. Critical levels of SPM and PM10 exist in many of the cities. High levels of NOx and CO exist at many traffic intersections. In addition, other pollutants such as PAH and benzene are also high. SO2 and lead levels in ambient air are, however, decreasing in most of the cities due to the measures taken such as reduction of sulphur in fuel and introduction of unleaded petrol. The high levels of air pollution are leading to higher incidence of respiratory diseases, cancer and heart diseases. High economic costs are associated with the degradation in air quality. Vehicles have been identified as the major source of pollutants in the metro cities. Thus, vehicular pollution control in metropolitan cities and other cities needs to given a high priority. Strategies which need to be adopted include the promotion of public transport and mass rapid transport systems together with traffic planning and management. In addition, taxes on fuels and vehicles, stringent emission norms and fuel quality specifications, promotion of cleaner fuels such as CNG, replacement of two-stroke engines, and a strengthening of the I&M system. Industrial sources, both large and small scale units, also need to be targeted to reduce air pollution. These include promotion of cleaner technologies, strengthening of emission standards and introducing economic incentives. Emphasis should be given to waste minimisation and utilisation. In addition, non-point sources of pollution also need to be addressed adequately. A comprehensive urban air quality management strategy should be formulated using information related to urban planning, ambient air quality, emission inventory, and air quality dispersion models. Strengthening the monitoring network and institutional capabilities would facilitate an improvement in the enforcement mechanism. In short, though a number of measures have been taken in the past to address the problem of air pollution much still needs to be done if the residents of metropolitan cities such as Delhi, Mumbai and Calcutta are to breathe clean air. In this respect, regional cooperation in the management of urban air pollution would be of great significance enabling best practices to be shared.
76

REFERENCES Brandon, C, Hommann, K, Kishor, N M (1995) 'The cost of inaction: valuing the
economy-wide cost of environmental degradation in India', a paper presented at the UNU conference on the Sustainable Future of the Global System, Organised by the United Nations University/Institute of Advanced Studies, National Institute for Environmental Studies, Japan, Tokyo, 16–18 October, 1995
CMIE (2000) Energy Economic Intelligence Service, Mumbai: Centre for Monitoring Indian Economy Pvt. Ltd, March 2000
CPCB (1995) Air pollution and its control. Parivesh Newsletter, Volume 2, No.1, June 1995, Central Pollution Control Board, Delhi
CPCB (1998) Annual report (1997-98), Central Pollution Control Board, Delhi CPCB (1999) 'Auto emissions'. Parivesh Newsletter 6(1), June 1999. Central Pollution
Control Board, Delhi CPCB (2000) Air Quality status and trends in India. NAAQMS/14/1999-2000, Central
Pollution Control Board, Delhi EPCA (2001) Report on Clean Fuels, Environment Pollution (Prevention and Control)
Authority for the National Capital Region, July 2001 GHK International Ltd (2000) Interim status report – Delhi 21, Delhi Urban Environment
and Infrastructure Improvement Project (DUEIIP), May 2000 for MoEF and GNCTD, GHK International Ltd. in association with Operations Research Group, New Delhi
GNCTD (2000a) Delhi Statistical handbook 1999. New Delhi: Directorate of Economics and Statistics, Government of National Capital Territory of Delhi
GNCTD (2000b) Economic survey of Delhi 1999–2000, Planning Department Government of National Capital Territory of Delhi, New Delhi
MoEF (1997) White paper on pollution in Delhi with an action plan, Ministry of Environment and Forests, Government of India, New Delhi
MoEF (1998) India - Sustaining Development, Ministry of Environment and Forests, New Delhi
MoEF (1999) Annual report (1998–1999), Ministry of Environment and Forests, New Delhi
MoEF (2000) Annual report (1999–2000), http://envfor.nic.in/report, June 2000, Ministry of Environment and Forests, New Delhi
MoST (2000) Handbook on transport statistics in India (1999). New Delhi: Transport research wing, Ministry of Surface Transport
Nanda A R (1992). Final Population Totals, Paper-2 of 1992, Census of India- Series-1, Registrar General and Census Commissioner, India
SIAM (1999) Fuel and Vehicular Technology, Society of Indian Automobile Manufacturers, New Delhi
TERI (1998) Looking Back to Think Ahead: growth with resource enhancement of environment and nature, Tata Energy Research Institute. New Delhi
TERI (2001) State of Environment report for India, Final report submitted by TERI to UNEP, 2001
UNEP/WHO (1995) City air quality trends (GEMS/Air Data) Vol. 3, WHO/EOS 95.17, UNEP/EAP/95.A2, UNEP, Nairobi
WHO/UNEP (1992) Urban air pollution in megacities of the World, World Health Organisation/United Nations Environment Programme, Blackwell, Oxford
World Bank (1993) World Development report: investing in health, The World Bank, Oxford University Press
World Bank (1997) Urban air quality management strategy in Asia. Greater Mumbai report. World Bank technical paper No. 381, The World Bank, Washington, D C
WWW.censusindia.net/results/million_plus.html accessed on 21/8/01
77

5 AIR QUALITY MANAGEMENT IN JAKARTA
Aboejoewono Aboeprajitno, Head of Bapedalda, DKI, Jakarta, Indonesia INTRODUCTION Jakarta is located on Java Island and is the capital city of the Republic of Indonesia. It has the status of a special region in Indonesia and is classified as a province. Jakarta has gradually grown into one of the World’s most populated cities – nearly 9.5 million people on 661.62 square kilometres – an average population density of around 14,500 per square kilometres. As a megalopolis, Jakarta is inhabited by people from a variety of races and tribes, with different socio-cultural backgrounds. It is growing and developing continuously, both in the terms of population size and economic growth and development. Both factors exert powerful influences upon the environment. Because of city development and urbanisation, Jakarta has experienced serious air pollution problems associated with the use of energy in the transport and industrial sectors. Concentrations of street level air pollution along major roads in Jakarta have reached hazardous levels. Air quality in Jakarta is severely degraded. Several studies have shown that the amount of pollutants emitted by motor vehicles, industry and domestic activities is increasing The major transportation problems in Jakarta include increasing traffic congestion and the low quality of public transport. Private cars have contributed significantly to the traffic congestion and decline in air quality. A World Bank Study (1993) estimated that the costs of air pollution in Jakarta, mostly comes from motor vehicles, was approximately US $500 million per year. The Local Government of Jakarta as implemented a Clean Air Programme (PRODASIH /Programme Udara Bersih) in order to improve air quality. However, the Programme is predominantly ran by the government without any broad participation or support of urban communities. Therefore, this Programme is likely to become expensive and beyond the capabilities of urban management resources. This situation caused the local government of Jakarta to apply some guidelines in urban development and promote an environmentally sound and sustainable development programme, which was more simpler and paid greater attention to the formulation of urban environmental policies, enforcement, promotion of public participation and cooperation among various parties, and improved international cooperation. AIR POLLUTION IN JAKARTA Air pollution is a major problem in most cities. It is caused primarily by energy used in transportation and industry, although nature also contributes through such events as volcanic eruptions and forest fires. The casual visitor to Jakarta can observe that the air quality is severely degraded. No distant views are visible and tall buildings in the city centre appear shrouded in haze. Monitoring data confirms this observation. The level of dust in the air in several areas
78
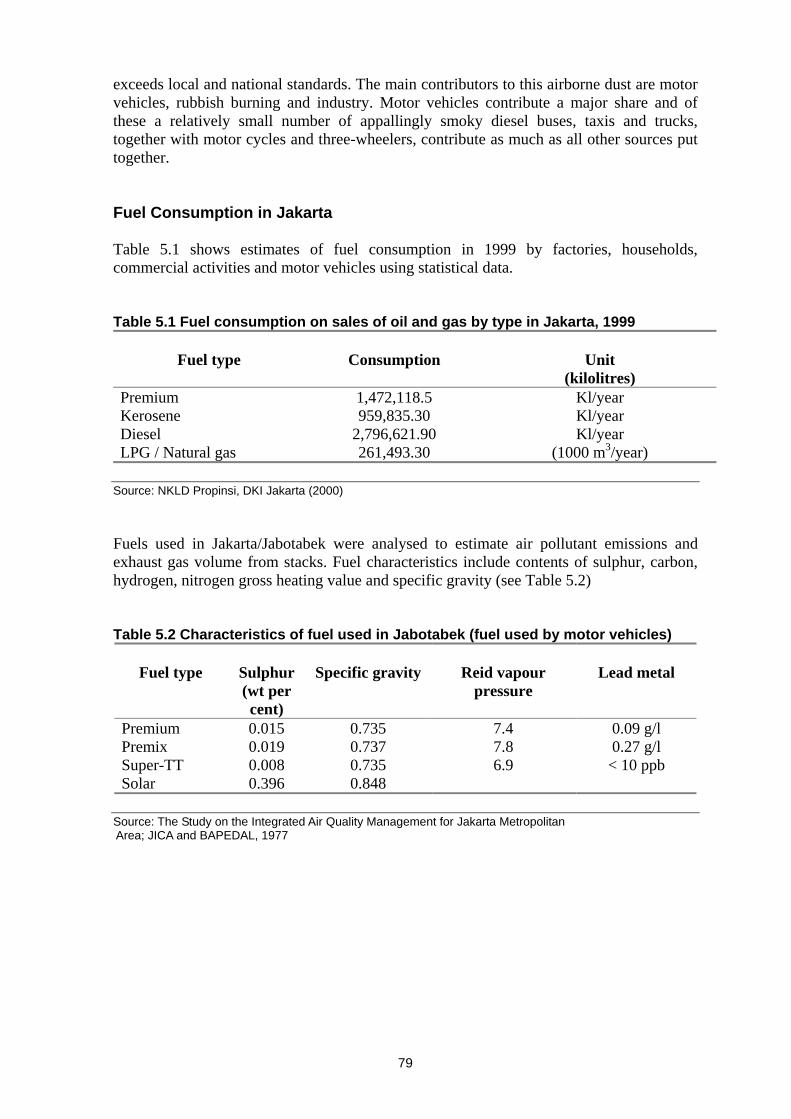
exceeds local and national standards. The main contributors to this airborne dust are motor vehicles, rubbish burning and industry. Motor vehicles contribute a major share and of these a relatively small number of appallingly smoky diesel buses, taxis and trucks, together with motor cycles and three-wheelers, contribute as much as all other sources put together. Fuel Consumption in Jakarta Table 5.1 shows estimates of fuel consumption in 1999 by factories, households, commercial activities and motor vehicles using statistical data. Table 5.1 Fuel consumption on sales of oil and gas by type in Jakarta, 1999
Fuel type
Consumption
Unit
(kilolitres) Premium 1,472,118.5 Kl/year Kerosene 959,835.30 Kl/year Diesel 2,796,621.90 Kl/year LPG / Natural gas 261,493.30 (1000 m3/year)
Source: NKLD Propinsi, DKI Jakarta (2000) Fuels used in Jakarta/Jabotabek were analysed to estimate air pollutant emissions and exhaust gas volume from stacks. Fuel characteristics include contents of sulphur, carbon, hydrogen, nitrogen gross heating value and specific gravity (see Table 5.2) Table 5.2 Characteristics of fuel used in Jabotabek (fuel used by motor vehicles)
Fuel type
Sulphur (wt per cent)
Specific gravity
Reid vapour
pressure
Lead metal
Premium 0.015 0.735 7.4 0.09 g/l Premix 0.019 0.737 7.8 0.27 g/l Super-TT 0.008 0.735 6.9 < 10 ppb Solar 0.396 0.848
Source: The Study on the Integrated Air Quality Management for Jakarta Metropolitan Area; JICA and BAPEDAL, 1977
79

Vehicle Numbers
Table 5.3 presents the number of registered motor vehicles in Jakarta over the period 1996–2000. Table 5.3 The number of registered motor vehicles in Jakarta, 1996–2000 (Excluding army and Corps Diplomatic cars)
Categories
1996
1997
1998
1999
Motor cycles 1,345,027 1,502,457 1,527,906 1,543,609 Passenger cars 845,559 947,218 952,267 965,058 Trucks/lorries 287,606 320,157 319,301 320,438 Buses 253,278 253,689 253,718 253,574 Total 2,731,470 3,023,521 3,053,192 3,082,679
Source: Polda Metro Jaya (2000) Since 1990 the number of motor vehicles(total: 1,649,037), population has been increasing rapidly in Jakarta. The average rate of increase has been approximately 15 per cent per annum in the period 1997–2000. Almost 50 per cent of vehicles registered in Jakarta are motorcycles of which more than 60 per cent are two-stroke motorcycles. They are the worst offenders for suspended particulate matter and hydrocarbon emissions. Motorcycles become popular very quickly because of their ability to move around much quicker in the congested traffic. They are not very expensive and can be afforded by medium and low-income people. They are used not only for personal transportation but also for informal-commercial transportation and for goods delivery. Most of the vehicles in Jakarta still use carburettors and there is no exhaust after-treatment. For most of the domestic vehicles, the old engine modes are conductive to high fuel consumption and emissions. The average level of emission control is still low. New cars until very recently could not use catalytic converters for exhaust-treatment because the fuels still contained lead. Insufficient roadways and their condition contribute to increasing emissions of carbon monoxide, hydrocarbons and particulate matter and also exacerbate traffic congestion in Jakarta. This is due to both longer trip times and higher emissions from vehicles at low speed, deceleration, stopping and acceleration. Inventory of Point Sources There are about 910 factories in Jakarta listed in the Indonesia Manufacturer Directory, 1993/1994. Their breakdown by industry type is shown in Table 5.4. The main industries by number in Jakarta are textiles/clothing/leather; plastic product and machinery/equipment. Except for the large-scale facilities (power plants, glass factories, steel smelting factories), most point source emissions come from boilers, generators, diesel engines, gas turbines, dryers and incinerators.
80
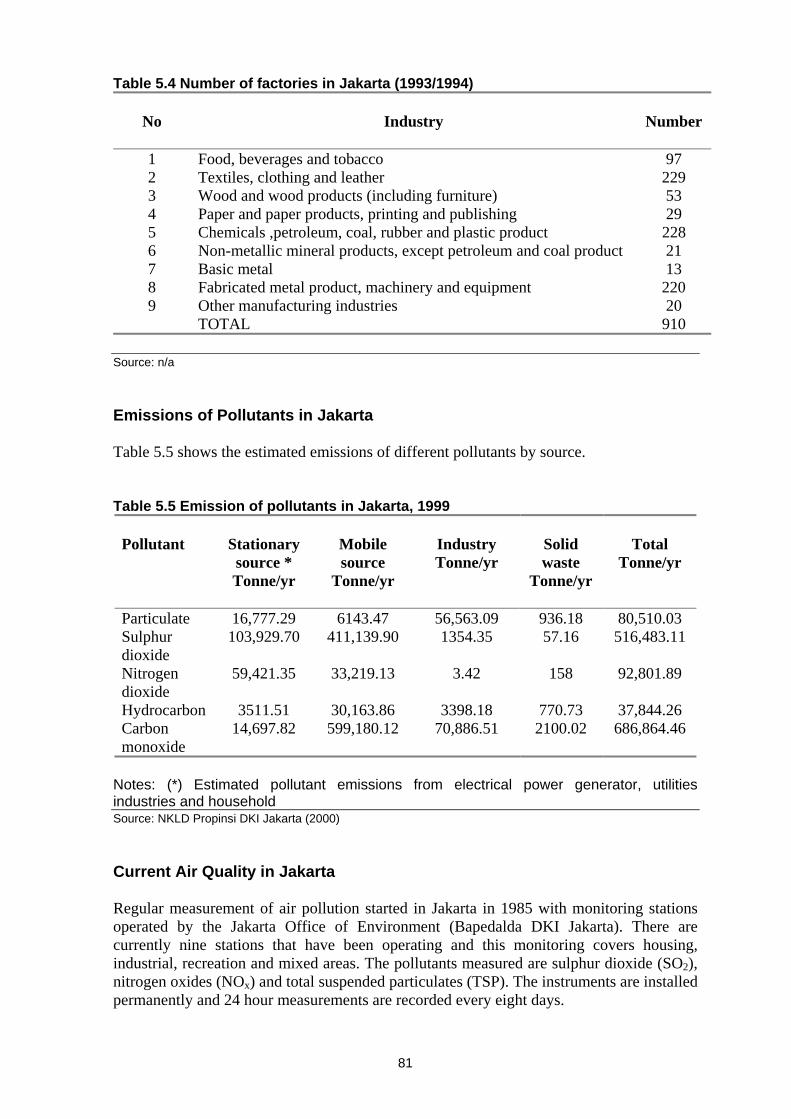
Table 5.4 Number of factories in Jakarta (1993/1994)
No
Industry
Number
1 Food, beverages and tobacco 97 2 Textiles, clothing and leather 229 3 Wood and wood products (including furniture) 53 4 Paper and paper products, printing and publishing 29 5 Chemicals ,petroleum, coal, rubber and plastic product 228 6 Non-metallic mineral products, except petroleum and coal product 21 7 Basic metal 13 8 Fabricated metal product, machinery and equipment 220 9 Other manufacturing industries 20 TOTAL 910
Source: n/a Emissions of Pollutants in Jakarta Table 5.5 shows the estimated emissions of different pollutants by source. Table 5.5 Emission of pollutants in Jakarta, 1999
Pollutant
Stationary source * Tonne/yr
Mobile source
Tonne/yr
Industry Tonne/yr
Solid waste
Tonne/yr
Total
Tonne/yr
Particulate 16,777.29 6143.47 56,563.09 936.18 80,510.03 Sulphur dioxide
103,929.70 411,139.90 1354.35 57.16 516,483.11
Nitrogen dioxide
59,421.35 33,219.13 3.42 158 92,801.89
Hydrocarbon 3511.51 30,163.86 3398.18 770.73 37,844.26 Carbon monoxide
14,697.82 599,180.12 70,886.51 2100.02 686,864.46
Notes: (*) Estimated pollutant emissions from electrical power generator, utilities industries and household Source: NKLD Propinsi DKI Jakarta (2000) Current Air Quality in Jakarta Regular measurement of air pollution started in Jakarta in 1985 with monitoring stations operated by the Jakarta Office of Environment (Bapedalda DKI Jakarta). There are currently nine stations that have been operating and this monitoring covers housing, industrial, recreation and mixed areas. The pollutants measured are sulphur dioxide (SO2), nitrogen oxides (NOx) and total suspended particulates (TSP). The instruments are installed permanently and 24 hour measurements are recorded every eight days.
81

Starting from 1992, continuous 1 hour average measurements have been made of SO2, nitrogen oxide (NO), nitrogen dioxide (NO2), carbon monoxide (CO) and particulate matter (PM10) at a single site in Central Jakarta which is situated in a location strongly influenced by heavy traffic (road site). In order to improve air quality monitoring information in Jakarta, Bapedalda has set-up three other continuous monitoring stations in residential areas. The results of monitoring in 1999 for SO2, NOx and CO, showed no exceedances of the Ambient Air Quality Standard of DKI Jakarta. However, the 24-hour average concentrations of TSP are over the standard occasionally at Tebet (a residential area) and Pulo gadung (an industrial area). Also, the Annual PM10 at Pulo Gadung (an industrial area) exceeded the National Standard. Total hydrocarbons at all station exceeds the standard. AIR QUALITY MANAGEMENT IN JAKARTA Air quality in Jakarta is severely degraded; several studies have shown that air pollution is increasing caused by the pollutant emissions from motor vehicles, industries and domestic activities. Jakarta has carried out several efforts to improve the air quality. PRODASIH (Programme Udara Bersih = Clean Air Programme) is a recent programme that is aimed at improving the air quality of Jakarta. The Programme includes controlling and checking the road worthiness of motor vehicles including vehicles emission and managing traffic to reduce traffic congestion, promoting the use of clean fuel including gas fuel, controlling industrial emissions, managing land use development and expanding the green space in the city. The activities that form part of the Programme are described below. Policy Formulation The local government of Jakarta through the Governor’s decrees as adopted the following local regulations:
• • •
a standard of ambient air quality and noise a standard of mobile source emission a standard of point source emission
Monitoring Facilities There are currently twelve (periodical) air quality monitoring stations and four continuous stations. Stations have been sited in recreational, industrial, recreation and mixed areas and a further five continuous monitoring and one mobile unit are planned for 2001. All the new equipment is funded by the Central Government through The Ministry of Environment. Data from continuous monitoring will be used to inform the public on a daily basis using the Pollution Standard Index (PSI) in order to increase awareness of air pollution problem and their participation in reduce the pollution. Fuel Alternative and Unleaded Gasoline Promotion Although the use of motor vehicles brings increased mobility and access to employment it also results in air pollution and damage to human health and the environment. The Governor of Jakarta has begun to examine options to deal with vehicle pollution reduction
82

by implementing a cleaner fuels programme. In Jakarta 90 buses use gas fuel and 1,377 unit taxis are equipped with liquid natural gas (LNG) or compressed natural gas (CNG) fuel converters. In 2001 another 1,208 unit taxis will be equipped with LNG/CNG fuel converters. There are 700 official car units of local governments are equipped with LNG/CNG fuel converters. In July 2001 the Government of Indonesia introduced and supplied unleaded gasoline to Jabotabek (Jakarta and its suburb) area through PERTAMINA (national oil enterprise). In order to increase the switch to unleaded gasoline the Government excluded unleaded gasoline from any increase in the price of fuel. Since practically all the lead in the urban air comes from the combustion of leaded gasoline in gasoline vehicles, phasing out of lead gasoline has substantially reduced emissions of lead in the air. Industrial and Vehicles Emissions Control With regard to the Blue Sky Programme implemented the Ministry of Environment in Jakarta, there are twenty industries under strict control. These industries are steel melting (7), power plant (3), glass melting (4) and textile (6). All the industries have signed an agreement with the Government of Jakarta that they will meet air emission standards by the end of 2004. At present, the motor vehicles that are subject to a compulsory emission test are limited to public transportation, cargo, truck and buses. Because of the economic crisis in Indonesia, not all the vehicles undergo the test which have contributed to the deterioration in air quality. The institution responsible for vehicle emission testing has several actions such as strengthening the capabilities and facilities for roadworthiness and implementing and enforcing the law. A recent study by JICA and Bapedal (1997) revealed that more than 50 per cent of CO was emitted from private motor vehicles and approximately 20 per cent from motorcycles. Private motor vehicles and motorcycles are responsible for approximately 40 per cent of HC emission, respectively. More then 50 per cent of NOx are emitted from the private motor vehicles and approximately 30 per cent from buses. Private motor vehicles, buses and trucks are responsible for an equal share SOx and PM10 emissions. In 1986 Local Government of Jakarta introduced an Inspection and Maintenance Programme (I&M), which was legalised by the Governor Decree Number 95 in the year 2000 and will be implemented in year of 2002. The objective of the I&M Programme is to protect the environment by reducing vehicle exhaust emissions by addressing the correct engine adjustment through regular testing and maintenance of the vehicle. The responsibility for implementing the I&M Programme will give to private registered workshops to ensure the delivery of a high standard of service. The private registered workshops will be constantly monitored by private surveillance organisation. The high degree of involvement of the private sector shall ensure that I&M Programme is efficiently implemented with a minimal government investment. A Supervisory Commission, including members of all stakeholders will be established to oversee the implementation of the I&M Programme. Figure 1 illustrates the I&M system and relationship between the government, private sector, non-governmental organisations and the public. It can be seen that the I&M Programme largely depends on the involvement of the private sector. The development and regulation of the system will be the Governments task through the Management Team.
83

P blic and StakeholderS pervision andRegulatory Level
Registrationand supervision ofI&M Workshops
Training andregistration ofI&M Operator
Development andoperation of software
and data transfer
Equipmentmaintenance and
calibration
Supervision& ServicesLevel(PrivateSector)
ImplementingWorkshopsImplementation
Level (Private Sector)
Output
Lower car emission and fuel savingsGood services for car owner
ConsumerLevel
Supervising Committee
Registrationand supervision ofI&M Workshops
Training andregistration ofI&M Operator
Development andoperation of software
and data transfer
Equipmentmaintenance and
calibration
Good services for car owner
Management TeamI&M Centre
u
u
Figure 5.1 The Inspection and Maintenance System in DKI Jakarta and relationship between the government, private sector, NGO’s and public Source: DKI Jakarta (2001) The workshops that deliver the services have to be registered and need to employ at least two registered operators. They will then be licensed to measure the vehicle exhaust emissions before and after the maintenance/service. The result of the measurement will be stored together with the vehicle and owner data on a computer and all the data will be transferred to the I&M Centre. All registered private cars owners in DKI Jakarta will be required have an annual inspection and maintenance of their car. All the data at the I&M Centre will be analysed and distributed to relevant institutions. The data will be also available to the public to ensure transparency. IMPLICATION FOR CAR OWNERS Under the I&M System the car owner is treated as a client (see Figure 2). A private firm will supervise the procedures and the quality of service. The car owner will have the choice of a number of registered workshops implementing the I&M Programme. The I&M will be organised as a one-stop service. The market will regulate the price of these services with exemption of a minimal fee for a sticker and recommendation letter. Car owners will be responsible for ensuring that their car meet the I&M regulation each year. Additional checks should help to identify misuse.
84

Publicity Campaign A Publicity campaign has been used to encourage people awareness and increase public participation on the Clean Air Programme. The activities are emission test for private cars under the I&M Programme and dissemination information through all media. During the period 1992–1997, 21,000 cars in total have followed the emission test campaign. This campaign was conducted in collaboration between local government agencies, state enterprise (PT Sucofindo), the Police Department, universities and non-governmental organisations (NGOs). As pilot project, Swisscontact has implemented I&M Programme on buses (1,850 units) and taxis (700 units). Result show that after I&M the emission reduced nearly 90 per cent and r fuel consumption was reduced by: 10 per cent. An NGO programme called “Segar Jakarta – ku” is also increasing public concern about air pollution.
I&M CenterDKI Jakarta
Data-transferby contractor
RegisteredWorkshop
Car before
I&M
PaymentOK?
No
Yes
Time or
Faild on road check
Information exchange
Recommendationletter
Car Registration(DISPENDA)
Checkedcars
I&M CenterDKI Jakarta
Data-transferby contractor
I&M CenterDKI JakartaI&M CenterDKI Jakarta
Data-transferby contractorData-transferby contractor
RegisteredWorkshop
Car before
I&M
PaymentOK?
No
Yes
Time or
Faild on road check
RegisteredWorkshop
Car before
I&M
PaymentOK?
No
Yes
Time or
Faild on road check
RegisteredWorkshopRegisteredWorkshop
Car before
I&MCar before
I&M
PaymentPaymentOK?
No
YesOK?
No
Yes
Time or
Faild on road check
Time or
Faild on road check
Information exchangeInformation exchange
Recommendationletter
Recommendationletter
Recommendationletter
Car Registration(DISPENDA)
Car Registration(DISPENDA)
Checkedcars
: Second stage
Figure 5.2: Inspection and Maintenance Programme Flowchart for Public Awareness Campaigns in Jakarta Source: DKI Jakarta (2001) Improving Traffic Management Excessive use of motor vehicles has caused problems for cities. Increased demand for roads and parking has resulted in paving over valuable and productive urban spaces. Development of an urban and regional transportation systems are to provide an integrated system that can ease and increase the safe mobility of people and goods. The strategies are reducing traffic and promoting the use of public transportation, expanding and improving public transport and parking facilities.
85

CONCLUSION Along with the city development and urbanisation, Jakarta has experienced serious air pollution problem associated with the use of energy in the transport and industrial sectors. Street level concentrations of air pollution along major roads in Jakarta have reached hazardous level and at several locations TSP concentrations exceed air quality standards. The local Government of DKI Jakarta has implemented the Clean Air Programme/Prodasih to improve air quality in Jakarta. The Programme has adopted a “command and control “ approach and uses economic instruments to ensure the polluter-pays. The overall design and implementation of the Clean Air programme is normally a government function but the private sector has played a major rule in the provision and operation the necessary facilities. The implementation and enforcement of the is not yet fully effective and has been restricted due to inadequate expertise; funding; equipment; political will; limited public support and participation; and uncoordinated institutional responsibilities. Local institutions will require substantial strengthening in terms of human resources, organisational structure, facilities and financial resources based on cooperation among various parties (e.g. private sectors, NGOs, international cooperation) if the Programme is to be implemented successfully. Finally, public awareness and information dissemination need to be continued to ensure the implementation of the whole Programme and the public are aware of their role (e.g. use of cleaner fuels and I&M of vehicles) in improving air quality in Jakarta.
86

6 CLEAN AIR FOR HONG KONG
Christopher Fung, Hong Kong Environmental Protection Department, Hong Kong Special Administrative Region, China INTRODUCTION The Hong Kong Special Administrative Region of China (Hong Kong) occupies an area of approximately 50 kilometres (km) from north to south by 60 km from east to west on the southeastern coast of the Asian mainland. The land area of slightly less than 1,100 km2 is made up of two main islands and one rhombus shape piece of land that adjoins the mainland of China. This is surrounded by open water on three sides. Less that 20 percent of all Hong Kong’s land have been developed for residential, commercial, industrial or other “built-up” uses and is where most of Hong Kong’s man-made emissions to the atmosphere would originate. Currently, close to seven million people share the limited residential land resulting in many tall buildings in the built-up areas. This concentration of human activities results in economies of scale, sometimes with high efficiency material use. For example, Hong Kong boasts the only mass transit system (subway) that is financially self-sustaining in the World because of the high level of public transport usage. Private car ownership and usage are low compared to countries with similar per capita income. This also means that electricity is centrally supplied by only three generating plants sited away from major population centres. This paper reviews the current status of urban air pollution in Hong Kong and the measures taken to improve urban air quality. URBAN AIR POLLUTION IN HONG KONG Hong Kong is confronted with an acute street level pollution problem, mainly caused by the intensity of vehicle use in densely populated urban centres. Figure 6.1 shows the hourly variation of respirable suspended particulates (RSP) and traffic flow at a typical urban location. In addition, it suffers from a highly visible ambient air pollution problem In addition, it suffers from a highly visible ambient air pollution problem. This is largely caused by sources in Hong Kong but is also affected by regional air quality problems. Hong Kong's emissions also contribute to this regional air pollution problems. Figure 6.1 shows the trends in visibility impairment during the period 1991 to January-October, 2001. Poor air quality undermines the quality of life for every resident of Hong Kong. Acute respiratory and cardiovascular disease linked to air pollution is already costing Hong Kong US $3.8 billion a year in medical expenses and lost productivity. Also, air pollution is a threat to Hong Kong's economy. Poor visibility and a reputation for poor air quality are a disincentive to tourism and to companies establishing or maintaining their operations in Hong Kong.
87
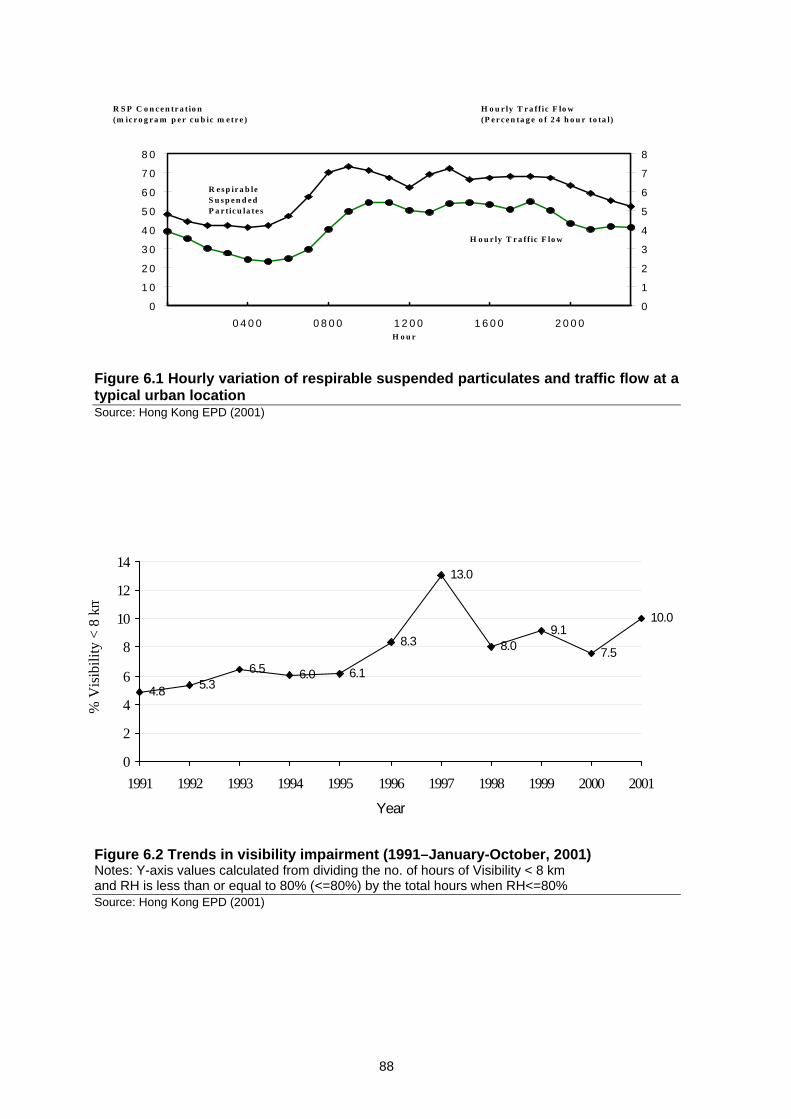
0
1 0
2 0
3 0
4 0
5 0
6 0
7 0
8 0
0 4 0 0 0 8 0 0 1 2 0 0 1 6 0 0 2 0 0 00
1
2
3
4
5
6
7
8
R e s p ir a b leS u s p e n d e dP a r tic u la te s
H o u r ly T r a ff ic F lo w
R S P C o n c e n tr a t io n (m ic r o g r a m p e r c u b ic m e tr e )
H o u r ly T r a ff ic F lo w (P e r c e n ta g e o f 2 4 h o u r to ta l)
H o u r
Figure 6.1 Hourly variation of respirable suspended particulates and traffic flow at a typical urban location Source: Hong Kong EPD (2001)
4.8 5.36.5 6.0 6.1
8.3
13.0
8.09.1
10.0
7.5
0
2
4
6
8
10
12
14
1991 1992 1993 1994 1995 1996 1997 1998 1999 2000 2001
Year
% V
isib
ility
< 8
km
Figure 6.2 Trends in visibility impairment (1991–January-October, 2001) Notes: Y-axis values calculated from dividing the no. of hours of Visibility < 8 km and RH is less than or equal to 80% (<=80%) by the total hours when RH<=80% Source: Hong Kong EPD (2001)
88

CAUSES AND EFFECT OF AIR POLLUTION IN HONG KONG The high density of built up areas and the unusually high reliance on diesel vehicles in Hong Kong are unique. Thirty per cent of Hong Kong's vehicles have diesel engines, compared with 19 per cent in Japan, 17 per cent in Singapore and 10 per cent in the United Kingdom. Diesel vehicles account for 70 per cent of all vehicle kilometres travelled each year. The hilly topography adds to the effect of the many high-rise buildings in the urban centres, restricting the flow of air and inhibiting dispersion of air pollution. This leads to a building up of smoke, RSP and nitrogen oxide (NOx) concentrations in the urban area and acute nuisances in the streets. The type and source of air pollutants in Hong Kong together with health effects are summarised in Table 6.1. Weather conditions also have very significant effects on the concentration of air pollution, much more so than can be explained by the day-to-day change in emissions. Hong Kong’s position on the coast of the large Asian landmass, its rugged terrain and uneven coastlines mean that it is subject to prevailing summer and winter monsoons with strong land-sea breezes which can cause the local wind to deviate significantly from the prevailing situation. Pollution can be trapped locally. Usually the worst air pollution situation in Hong Kong occurs when it is on the edge of a typhoon, where humidity is low, wind is light and dispersion is weak. Similar situations also occur during the transition between the two monsoons in March–April or August–September. MEASURING AIR POLLUTION Concentrations of up to seven air pollutants are routinely monitored at 14 fixed stations. A new fixed station at a remote location close to Hong Kong’s International Airport was added in July 1999. Air Quality Objectives for seven major components of air pollution have been established for Hong Kong (see Table 6.2 ). They serve as a benchmark for the quality of air needed to protect public health and also as measurable targets to be achieved in the fight against air pollution. The Air Pollution Index (API) transforms the many different measurements into a single number to give the public a simple indicator of whether the air quality is good or bad (see Table 6.3).
89

Table 6.1 The health effects of key air pollutants
AIR POLLUTANTS
SOURCE
(AMBIENT AIR QUALITY)
SOURCE
(STREET LEVEL)
EFFECTS
Sulphur Dioxide (SO2)
Power stations Fuel combustion Vehicles Marine vessels Aircraft Cement plants Incinerators
Heavy and light goods vehicles Buses Taxis Public light buses Private light buses
Impairment of respiratory Aggravation of existing respiratory (especially bronchitis) and cardiovascular diseases Increased mortality, especially if elevated levels of suspended particulates are also present
Carbon Monoxide (CO)
Private cars Motorcycles Heavy and light goods vehicles Buses Taxis Public light buses Private light buses
Vehicles Power stations Marine vessels Aircraft Industry
Visual impairment Reduced work capacity Reduced mental function and poor learning ability Persons suffering from heart and circulatory problem, foetuses, young infants, pregnant women and elderly people are likely to be more susceptible
Ozone (O3)
Formed from chemical reaction of NO2 with reactive VOC in the presence of sunlight
Formed from chemical reaction of NO2 with reactive VOC in the presence of sunlight Transboundary air pollution
Visibility impairment Irritation of nose, throat and airways. Symptoms include cough, chest pain, and throat and eye irritation Can also increase susceptibility to respiratory infection
Volatile Organic Compounds (VOC)
Private cars Motorcycles Medium and heavy goods vehicles Buses Taxis Public light buses Private light buses
Vehicle Marine vessels Aircraft Incinerators Petroleum terminals Gasoline cargo tanks Petrol filling stations Dry cleaning facilities Paint works Printing works Auto body repairing Landfill gases Natural sources
Formation of Ozone and smog Some VOC are toxic
Lead (Pb)
Leaded petrol vehicles Leaded petrol vehicles Sources outside Hong Kong
Damage to the nervous system, red blood cells, kidneys, potential increase in high blood pressure Other effects may result in decreased coordination, mental abilities, brain damage
90

Table 6.1 The health effects of key air pollutants (continued)
AIR POLLUTANTS
SOURCE
(AMBIENT AIR QUALITY)
SOURCE
(STREET LEVEL)
EFFECTS
Black Smoke Vehicles Industry Restaurants Power stations Marine vessels Aircraft
Goods vehicles Taxis Public light buses Buses Private light buses Motorcycles
Nuisance Visibility impairment Soiling Potentially cancer causing
Total Suspended Particulates (TSP)
Vehicles Power stations Marine vessels Fuel combustion Cement plants Aircraft Incinerators
Goods vehicles Taxis Buses Public light buses Private light buses Motorcycles Road dust
Nuisance Visibility impairment Soiling Respirable fraction has effects on health (see Respirable Suspended Particulates below)
Respirable Suspended Particulates (RSP)
Vehicles Power stations Marine vessels Fuel combustion Cement plants Incinerators Aircraft Soil blow-off Transboundary air pollution
Medium and heavy goods vehicles Taxis Diesel light goods vehicles Franchised and private buses Public light buses Diesel and petrol private cars Private light buses Motorcycles and petrol light goods vehicles
Visibility impairment Breathing and respiratory symptoms such as shortness of breath, coughing and wheezing, aggravation of existing respiratory diseases and damage to lung tissues Individuals with chronic lung and heart disease, influenza, asthma, elderly people and children are more susceptible
Nitrogen Dioxide (NO2)
Power stations Vehicles Marine vessels Fuel combustion Aircraft Cement plants Incinerators Transboundary air pollution
Medium and heavy goods vehicles Diesel and petrol private cars Franchised and private buses Diesel light goods vehicles Taxis Public light buses Motorcycles and petrol light goods vehicles Private light buses
Visibility impairment Aids photochemical smog formation Irritation of lungs and lowering resistance to respiratory infection such as influenza Individuals with respiratory problems, such as asthma, are more susceptible. May also impair lung development in young children.
Source: compiled by Hong Kong EPD (2001)
91

Table 6.2 Hong Kong air quality objectives Concentration (in micrograms per cubic metre)
Averaging Time1 Pollutants 1-hour2 8-hour3 24-hour3 3-month 1-year
Sulphur Dioxide 800 350 80 Total Suspended Particulates 260 80 Respirable Suspended Particulates 180 55 Nitrogen Dioxide 300 150 80 Carbon Monoxide 30,000 10,000 Ozone 240 Lead 1.5
Notes -
1. The objectives provide the targets for protecting the public from adverse health effects of air pollution. They are based on scientific analysis of the relationship between air pollution concentrations, and the associated adverse effects of the polluted air. As air pollutants may cause acute health effects for short periods of exposures or chronic effects for longer periods, objectives are set for 1-hour, 8-hour, 24-hour, 3-month or1-year periods, according to whether there are corresponding effects for any particular exposure periods.
2. Not to be exceeded more than three times per year. 3. Not to be exceeded more than once per year.
Source: Hong Kong EPD (2001) Table 6.3 Calculation of air pollution index from air quality objectives levels
Air Pollution
Index
Corresponding Air Quality Objective Levels
25 Air pollution is low - at half the Annual AQO, or at a quarter of the
1-hour or 24-hour AQO level 50 Air pollution is medium - at the Annual AQO, or at half the 1-hour or
24-hour AQO level 100 Air pollution is high - at the 1-hour or 24-hour AQO level 200 Air pollution is very high - at 2 times the 1-hour or 24-hour AQO level500 Air pollution is severe - at 3-12 times the 1-hour or 24-hour AQO level
Source: Hong Kong EPD (2001) Two air pollution indices are issued in Hong Kong - the General Air Pollution Index and the Roadside Air Pollution Index. The former represents the quality of air which most people will experience at home, in school or at work. The latter represents the quality of air in busy streets. Hong Kong is the first city in the world to issue a Roadside Air Pollution Index on a regular basis. Air pollution respects no boundaries. Emissions from Hong Kong and from Southern China each affect the other's background air pollution and contribute to daily fluctuations in levels recorded. The deterioration in visibility, which is a sign of photochemical smog, is a common phenomenon in many neighbouring cities in Guangdong, the Chinese province to the north of Hong Kong. The influence of cross boundary effects in Hong Kong is most noticeable when the prevailing wind is from the Northwest to the Northeast. This is more common in the winter months.
92

MEASURES TO REDUCE AIR POLLUTION A wide range of measures has already been introduced in Hong Kong to control air pollution. These pollutant and their effects are described in Table 6.4. Table 6.4 Measures taken to control air pollution
OBJECTIVES
MEASURES TAKEN
EFFECTS
Inspection and enforcement programme smoky vehicle control programme in place since 1998 step up smoke testing procedures for annual roadworthiness inspection since late 1997 Police using portable smoke meters for enforcement against smoky vehicle from early 1999
Smoky vehicle reports reduced by 30 per cent from 1993 to 1998
Reduce emissions from diesel fleet Stringent standards for diesel private cars introduced in 1998
No new diesel private cars have been registered
All new taxis to use LPG starting end 2000
Will eliminate RSP emission from individual diesel taxis and reduce overall RSP emission from vehicle fleet by up to 30 per cent
Reduce Volatile Organic Compounds (VOC) emissions
Oil depots installed floating roof oil tanks since 1993
VOC emissions from oil depots reduced by over 90 per cent
Vapour recovery system at petrol filling stations since April 1999
VOC emissions from petrol filling stations reduced by over 30 per cent
Reduce emissions from motorcycles
All new motorcycles to meet stringent emission standards planned for October 1999
Reduce 50 per cent of VOC emissions from individual motorcycles
Reduce emissions from industries Ban on high sulphur fuels since
1990 SO2 concentrations fell by up to 80 per cent in industrial areas. Combined with reduction in indusrtial activity, total industrial SO2 emissions fell from 46,616 tonnes in 1989 (before the ban) to 16,688 tonnes in 1997
Licensing control of major polluting sources since 1987
Overall, up to 55 per cent of the emissions from industries have been reduced from 1987 to 1997
Reduce emissions from power generation
Natural gas for power generation and coal units built after 1991 installed with flue gas desulphurisation system
SO2 emissions fell from 131,600 tonnes in 1991 to 52,659 tonnes in 1997
Units built after 1991 fitted with latest low-NOx technology and old units retrofitted with low-NOx burners
NOx emissions fell from 149,400 tonnes in 1991 to 55,723 tonnes in 1997 Also helps reduce Ozone formation
93

Table 6.4 Measures taken to control air pollution (continued)
OBJECTIVES
MEASURES TAKEN
EFFECTS
Reduce dust emissions from construction activities
Construction dust regulation introduced in 1997
Dust emitted from individual construction activities reduced by up to 80 per cent
Reduce emissions from petrol vehicles
Unleaded petrol phased in since 1991. Complete ban on leaded petrol since 1 April 1999
No leaded petrol. Virtually eliminates lead emissions from vehicles
3-way catalytic converters and trade in incentives for old private cars
More than 75 per cent of petrol vehicles now have catalytic converters For vehicles complying with new standards: NOx and Hydrocarbons reduced by 90 per cent Carbon monoxide reduced by 90 per cent
New vehicles to install controls on evaporatibe emissions which is planned to take effect in July 1999
Reduces 90 per cent of VOC emissions from individual vehicles
Reduce emissions from diesel fleet
Fuel sulphur standards: pre-1995: 0.5 per cent 1995: 0.2 per cent 1997: 0.05 per cent
SO2 from individual vehicles reduced by 90 per cent
Engine standards: Euro I standards adopted in 1995 Euro II standards adopted by stages since 1997
For vehicles complying with latest standards: RSP reduced by 80 per cent NOx reduced by 20 per cent
Source: Hong Kong EPD (2001) CURRENT TRENDS IN AIR POLLUTION Industrial emissions of PM, SO2 and NOx were reduced sharply between 1989 and 1991 and have remained low since then due to the 1990 ban on high sulphur fuel oil. Due to other measures, the emissions from power generation have been also steadily decreasing. The total emissions of SO2 have fallen by 58 per cent from about 190,000 tonnes in 1993 to about 80,000 tonnes in 1997. Total emissions of NO2 have been reduced by about 45 per cent from 227,000 tonnes in 1992 to approximately 123,000 tonnes in 1997. While emissions from power generation remain the largest contributor, from Hong Kong to regional air quality, their local impact is limited. The power stations have been sited and their chimneys designed so that under most weather conditions the emissions are well dispersed and carried away from the urban areas. Figure 6.3 shows the sources of air pollutant emissions in Hong Kong for the years 1991 and 1997. With regard to the street level pollution problem, measures introduced to control emissions from motor vehicles have been offset by the growth in vehicle numbers and the number of kilometres travelled. From 1991 to 1997, vehicle numbers grew by 30 per cent and kilometres driven increased by 25 per cent (See Tables 6.4 and 6.6 ). The volume of harmful emissions from motor vehicles also rose (see Figures 6.4–6.6): • • •
PM increased from 6,451 tonnes to 7,175 tonnes (10 per cent) NOx increased from 36,128 tonnes to 40,687 tonnes (13 per cent) VOCs increased from 14,047 to 16,591 tonnes (18 per cent).
94

Particulate Matters - TSPincluding RSP (1991)
Aircraft0.17%
CementPlant 0.86%
MarineVessel5.64%
Incinerator1.63%
Vehicle38.68%
FuelCombustion
2.68%
PowerStation50.34%
Particulate Matters - TSPincluding RSP (1997)
Vehicle51.95% Cement
Plant 1.27%
MarineVessel9.07%
Aircraft0.29%
PowerStation32.54%
Incinerator0.25%
FuelCombustion
4.62%
SO2 (1997)
Aircraft0.51%
CementPlant 0.1%
MarineVessel6.23%
Vehicle7.01%
FuelCombustion
20.68%
Incinerator0.03%
PowerStation65.43%
SO2 (1991)
Incinerator0.38%
FuelCombustion
7.42%
CementPlant 0.04%
Vehicle6.1%
MarineVessel2.45%
Aircraft0.17%
PowerStation83.43%
NOx (1991)
Vehicle17.56%
PowerStation72.63%
CementPlant 0.79%
Incinerator0.35%
FuelCombustion
2.41%
Aircraft1.47%
MarineVessel4.79%
NOx (1991)
Vehicle17.56%
PowerStation72.63%
CementPlant 0.79%
Incinerator0.35%
FuelCombustion
2.41%
Aircraft1.47%
MarineVessel4.79%
Figure 6.3 Sources of air pollutant emissions in Hong Kong for the years 1991 and 1997 Source: Hong Kong EPD (2001)
95

Table 6.5 Number of vehicles licensed in 1991 and 1997 Vehicle by Class Type in Hong Kong
1991 1997
Motorcycle 17,777 23,511Private car 212,017 314,833Taxi 17,308 17,918Passenger van 2,384 2,230Public light bus 4,336 4,335Light goods vehicle 89,629 78,876Heavy goods vehicle 28,194 39,403Non-franchise buses 3,779 5,753Franchise single deckbuses 302 441Franchise double deckbuses 3,733 4,869Total 379,459 492,169
Source: Hong Kong EPD (2001) Table 6.6 Vehicle-kilometres travelled in 1991 and 1997
Vehicle by Class Type in Hong Kong
1991 1997
Motorcycle 207,400,000 271,840,000Private car 2,720,670,000 4,060,180,000Taxi 1,840,640,000 2,382,430,000Passenger van 260,830,000 243,140,000Public light bus 340,600,000 360,520,000Light goods vehicle 1,240,500,000 1,290,850,000Heavy goods vehicle 2,048,720,000 2,166,920,000Non-franchise buses 116,550,000 168,500,000Franchise single deckbuses 9,870,000 22,610,000Franchise double deckbuses 288,520,000 388,070,000Total 9,074,300,000 11,355,060,000
Source: Hong Kong EPD (2001)
96

M e d iu m G o o d sV e h ic le s 2 8 .9 %
P riv a te B u s e s 1 .2 %
F ra n c h u s e d B u s e s1 0 .6 %
D ie s e l P riv a te C a rs0 .7 %
D ie s e l L ig h t G o o d sV e h ic le s 2 4 .8 %
H e a v y G o o d s V e h ic le s1 %
P e tro l P riv a te C a rs1 .7 %
O th e r P e tro l V e h ic le s(M o to rc y c le & P e tro l
L ig h t G o o d s V e h ic le s )0 .3 %
T a x i 2 5 .7 %
P riv a te L ig h t B u s e s1 .1 %
P u b lic L ig h t B u s e s 4 %
Figure 6.4 Respirable particulate emissions from motor vehicles in urban areas (1997) Source: Hong Kong EPD (2001)
Private Light Buses0.4%
Diesel Private Cars0.2%
Public Light Buses1.6%
Diesel Light GoodsVehicles
7.7%
Taxi5.9%
Franchused Buses6.8%
Private Buses0.8%
Medium GoodsVehicles18.5%
Heavy GoodsVehicles
0.6% Petrol Private Cars28.4%
Other PetrolVehicles (Motorcycle& Petrol Light Goods
Vehicles)29.1%
Figure 6.5 Hydrocarbon emissions from motor vehicles in urban areas (1997) Source: Hong Kong EPD (2001)
Private Light Buses0.4%
Diesel Private Cars0.2%
Public Light Buses1.6%
Diesel Light GoodsVehicles
7.7% Taxi5.9%
Franchused Buses6.8%
Private Buses0.8%
Medium Goods Vehicles18.5%
Heavy Goods Vehicles0.6%
Petrol Private Cars28.4%
Other Petrol Vehicles(Motorcycle & Petrol
Light Goods Vehicles)29.1%
Figure 6.6 Emissions of nitrogen oxides from motor vehicles in urban areas (1997) Source: Hong Kong EPD (2001)
97

Emissions of Pb, SO2, and CO meet air quality objectives. However, vehicle smoke causes acute nuisances in busy streets. The average annual concentrations of RSP remain high although slight improvement has been observed in 1997 and 1998. RSP is still the biggest concern in terms of health impacts. There is a slow but steady rise in NO2 concentrations. These now reach the limit of the 24-hourly maximum levels under air quality objectives. Concentrations of ozone (O3) are steadily increasing. Average concentrations have increased by 50 per cent since 1991. To reduce O3 and photochemical smog, it is necessary to reduce the emissions of NOx and VOCs both in Hong Kong and Guangdong. HOW DOES HONG KONG COMPARE WITH OTHER CITIES? If Hong Kong's air quality is compared to the air quality of other major world cities the following conclusions can be made: • •
•
•
•
• •
•
•
•
CO levels are among the lowest. average concentrations of NOx, O3 and SO2 are about the same as Tokyo, New York and London. average RSP levels are high and are equivalent to levels experienced in cities such as Taipei and several other Asian cities, though well below Bangkok and Mexico City.
WHAT NEEDS TO BE DONE? In 1999 the Chief Executive chose environmental protection as his theme for Hong Kong’s policy address. It was the first time that the environment had figured so prominently in a high-level policy announcement. The measures of air quality improvement part of the policy address are highlighted below:
a target to reduce respirable PM from vehicles by 60 per cent by 2003 and 80 per cent by 2005, and nitrogen oxide emissions by 30 per cent by 2005. US $1.4 billion (US$1=Hong Kong $7.8) in grants to be provided for switching diesel taxis to liquefied petroleum gas (LPG) taxis by 2007, and for fitting older diesel vehicles with catalysts and particulate traps. tougher action to be taken against smoky vehicles. Pedestrian zones to be expanded and less-polluting modes of transport encouraged.
The broader context of these improvements is:
In the short term, further mitigation measures to reduce smoke and control emissions from the existing vehicle fleet are the priority. For the medium term, new fuels and new emission standards are required for the future vehicle fleet. Energy efficiency measures also need to be pursued both for vehicle engines - to help reduce emissions - and in the commercial, domestic and industrial sectors - so as to help contain background emissions from power generation. For the longer term, rail systems need to be extended and other electric powered transport systems introduced wherever possible.
In parallel with all actions in Hong Kong, support for Guangdong's efforts to control emissions is needed, together with development of a regional air quality programme.
98

WHAT ARE THE NEXT STEPS? Additional mitigation measures for the existing road transport fleet are being introduced. These include retrofitting older franchised buses with catalysts; rationalising bus routes and working to extend pedestrianisation schemes or entry time restrictions to help reduce pollution in black spot areas. The Euro III standards for reduced emissions and increased fuel efficiency in vehicles will be introduced simultaneously with their adoption in Europe. The Government will be introducing new technology vehicles into its own fleet and working with bus companies, the motor trade and power companies to set up trials for low emission technology vehicles. Under the Third Comprehensive Transport Study and Second Railway Development Study, new approaches to transport planning are being developed to promote more environmentally efficient transport systems. Energy policy will be developed to continue control over emissions from power generation. Programmes to reduce emissions from all sectors of Hong Kong industry and commerce will be extended. Intensive work is in progress with the Provincial Government in Guangdong and with authorities in Shenzhen and Zhuhai to establish the basis for a regional air quality improvement programme. The objective is to achieve and sustain healthy air quality for every resident of Hong Kong, and to contribute to improvement of regional air quality. With the measures already in place, and the additional mitigation measures that are to be taken, the problem of respirable particulates should improve in the next one to two years while emissions of NO2 should be contained for several years. To maintain improvement over the medium to long term, new policies and programmes will need to be put in place over the coming year, co-ordinated action to deal with regional pollution will need to be developed, and continued effort will be needed by everyone who contributes to air pollution. Environmental initiatives may have impact on individuals in certain areas, but will bring returns to the whole community through reducing health costs and increasing the livability of the city. The choices made together in this area are going to be one of the most significant factors which will determine whether Hong Kong can become a more sustainable city in the 21st Century.
99

7 URBAN AIR POLLUTION IN JAPAN Norihiko Tanaka, Air Quality Management Division, Ministry of the Environment, Tokyo, Japan INTRODUCTION This paper first reviews the general trends and current state of air pollution in the Metropolitan and Kansai Areas and outlines the different types of policy initiatives taken in Japan to deal with urban air pollution. The Metropolitan Area covering Tokyo and the Kansai Area covering Osaka are the two largest urban areas in Japan. For the purposes of this paper, the Metropolitan Area covers Tokyo, Saitama, Chiba, Kanagawa while the Kansai Area covers all of Osaka and Hyogo unless otherwise stated. GENERAL TRENDS The metropolitan area covers the Kanto Plain with Tokyo at its centre facing Tokyo Bay. The Kansai Area is on Osaka Plain and its centre, Osaka, is also located on the coast. The geographical aspect in both of these areas tends not to favour air stagnation. Both of the areas have been inhabited for hundreds of years. The population of theses areas underwent rapid growth in the 20th century during Japan’s modernisation and the population continues to grow. Figure 7.1 shows the trends in population growth in the Metropolitan Area and Kansai Area. Rates of growth in recent years have slowed down compared to the growth rates experienced in the 1970s.
0
10000
20000
30000
40000
50000
1930
1935
1940
1945
1950
1955
1960
1965
1970
1975
1980
1985
1990
1995
2000
Year
Popu
latio
n (x
1000
)
Metropolitan Area (extended) Kansai Area (extended)
Figure 7.1 Population Growth in the Metropolitan and Kansai areas Source: MOE Japan In the process of modernisation, a number of industrial facilities, both large-scale and small-scale, were constructed and began to operate in these areas. Some of these industrial facilities, especially large-scale facilities, have been transferred to other areas mainly due to the shortage of land and the environmental burden they place on the Metropolitan Area and Kansai Area, though a significant number of middle- and small-scale industrial facilities still remain. The centres of these areas are mainly utilised for commerce, many of the industrial
100

facilities are located in coastal zones and residential areas are widely spread into the suburbs. No slum areas have formed in those areas.
Figure 7.2 shows that motor vehicle ownership in the Metropolitan Area and Kansai Area is increasing. The total distance travelled by motor vehicles is considered also to be high though no statistics for Metropolitan Area and Kansai Area are available. Road transport accounts for a high proportion of transport sector. The ratio of petroleum against total primary energy for the whole country was 55 per cent in 1996. In terms of final energy consumption, industrial use accounts for half of total consumption whilst household and transport account for a quarter. Energy consumption is rising mainly due to the increases in the household and transport sectors. Electric power consumption in the Metropolitan Area and Kansai Area accounts for approximately 35 per cent and 18 per cent of the national total respectively.
0
5000
10000
15000
20000
25000
1985 1990 1995 1998
Year
Num
ber o
f Aut
omob
ile
Ow
ners
hip
(x10
00)
Metropolitan Area (extended) Kansai Area (extended)
Figure 7.2 Automobile Ownership in the Metropolitan and Kansai areas Source: MOE Japan STATE OF THE AIR POLLUTION IN THE METROPOLITAN AND KANSAI AREAS The section reviews ambient air quality in the Metropolitan and Kansai Areas and the emissions of different types of pollutants. Sulphur Dioxide The concentrations of sulphur dioxide (SO2) in ambient air in the Metropolitan Area and Kansai Area have decreased considerably over the last 30 years (see Figure 7.3). Almost all monitoring stations in the Metropolitan Area (250 stations) and Kansai Area (170 stations) have been meeting the environmental quality standard value of 0.04 ppm or less as daily average of hourly values over the last twenty years. Nitrogen Dioxide In contrast to SO2, the concentrations of nitrogen dioxide (NO2) in ambient air in the Metropolitan Area and Kansai Area have not decreased significantly (see Figure 7.4). Compliance with the Japanese environmental quality standard, 0.04–0.06 ppm or less as daily average of hourly values, still remains at a low level. In the Metropolitan Area (the area
101

designated in the Motor vehicle NOx Control Law), the compliance ratio for general air pollution monitoring (GAPM) stations was 69 per cent and for roadside air pollution monitoring (RAPM) stations 27 per cent in 1998. The compliance ratio in the Kansai Area was 85 per cent for general air pollution monitoring stations and 52 per cent for the roadside air pollution monitoring stations. The concentration of NO2 tends to be high during winter.
00.010.020.030.040.050.060.070.080.09
1965
1967
1969
1971
1973
1975
1977
1979
1981
1983
1985
1987
1989
1991
1993
1995
1997
1999
Fiscal Year
Ann
ual A
vera
ge (p
pm)
Metropolitan Area (Kanda Tsukasa-cho Station) Kansai Area (Sakai-shi Nishiki Station)
Figure 7.3 Trends in sulphur dioxide concentrations Source: MOE Japan
0
0.01
0.02
0.03
0.04
0.05
0.06
1970
1972
1974
1976
1978
1980
1982
1984
1986
1988
1990
1992
1994
1996
1998
Fiscal Year
Ann
ual A
vera
ge(p
pm)
Metropolitan Area (Kanda Tsukasa-cho Station) Kansai Area (Kokusetsu Osaka Station)
g
Figure 7.4 Trends in nitrogen dioxide concentrations Source: MOE Japan
102

Suspended Particulate Matter The concentrations of Suspended Particulate Matter (SPM) in ambient air in the Metropolitan Area and Kansai Area are slowly decreasing, but the situation is far from satisfactory at present (see Figure 7.5). In 1998 14.7 per cent of GAPM stations and 3.1 per cent of RAPM stations complied with Japan’s SPM environmental quality standard (0.1mg/m3 or less as a daily average of hourly values) in the Metropolitan Area (the area designated in Motor vehicle NOx Control Law. In the Kansai Area (the area designated in Motor vehicle NOx Control Law), 73.3 per cent of GAPM stations and 34.1 per cent of RAPM stations attained the standard. Usual results were observed in 1999 due to the influence of weather conditions.
0102030405060708090
1974
1976
1978
1980
1982
1984
1986
1988
1990
1992
1994
1996
1998
Fiscal Year
Annu
al A
vera
ge(µ
g/m
3 )
Metropolitan Area (Kokusetsu Tokyo Station) Kansai Area (Sakai-shi Nishiki Station)
Figure 7.5 Trends concentrations of suspended particulate matter Source: MOE Japan Photochemical Oxidant In the case of photochemical oxidant (Ox), the number of exceedances of the threshold value, rather than average concentration, is critical to judge the effect on health. Therefore Japan’s environmental quality standard has been established for hourly values only (0.06 ppm or less). In both the Metropolitan Area and Kansai Area, the rate of compliance with the standard is very low. In 1999, no monitoring stations in these two areas attained the standard. Figure 7.6 shows the trend in the number of days per monitoring station where high concentration of photochemical oxidants (more than 0.12 ppm (warning level)) appeared in the Metropolitan Area and Kansai Area.
103

00.5
11.5
22.5
33.5
4
1994 1995 1996 1997 1998
Fiscal Year
Num
ber
of D
ays
Metropolitan Area (Tokyo Bay Area) Kansai Area (Osaka Bay Area)
Figure 7.6 Number of days when the photochemical oxidant standard is exceeded Source: MOE Japan Carbon Monoxide Ambient air pollution by carbon monoxide (CO) in the Metropolitan Area and Kansai Area has improved over the last 30 years (see Figure 7.7). A comparison with Japan’s environmental quality standard, 10ppm or less as a daily average of hourly values, shows that all monitoring stations in the Metropolitan Area and Kansai Area have been attaining the standard for approximately 10 years.
00.5
11.5
22.5
3
1971
1973
1975
1977
1979
1981
1983
1985
1987
1989
1991
1993
1995
1997
1999
Fiscal Year
Ann
ual A
vera
ge(p
pm)
Metropolitan Area (Kokusetsu Tokyo Station) Kansai Area (Kokusetsu Osaka Station)
g
Figure 7.7 Trends in carbon monoxide concentrations Source: MOE Japan
104
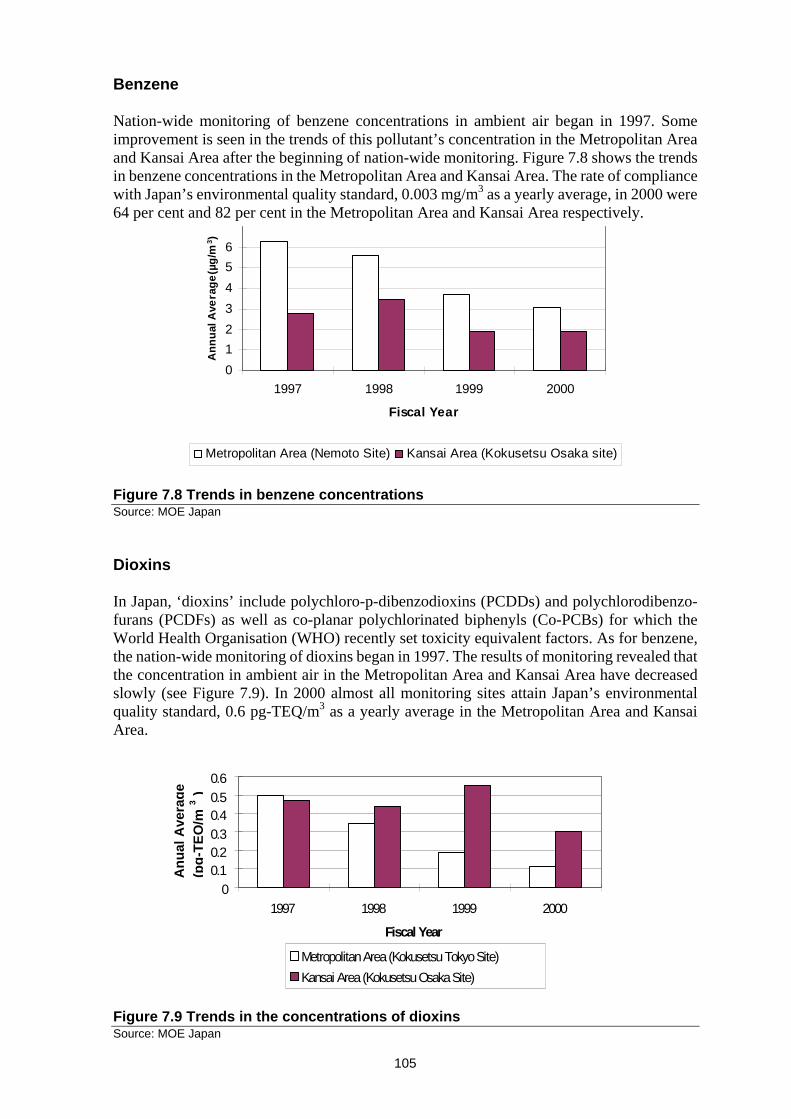
Benzene Nation-wide monitoring of benzene concentrations in ambient air began in 1997. Some improvement is seen in the trends of this pollutant’s concentration in the Metropolitan Area and Kansai Area after the beginning of nation-wide monitoring. Figure 7.8 shows the trends in benzene concentrations in the Metropolitan Area and Kansai Area. The rate of compliance with Japan’s environmental quality standard, 0.003 mg/m3 as a yearly average, in 2000 were 64 per cent and 82 per cent in the Metropolitan Area and Kansai Area respectively.
0123456
1997 1998 1999 2000
Fiscal Year
Ann
ual A
vera
ge(µ
g/m
3 )
Metropolitan Area (Nemoto Site) Kansai Area (Kokusetsu Osaka site)
Figure 7.8 Trends in benzene concentrations Source: MOE Japan Dioxins In Japan, ‘dioxins’ include polychloro-p-dibenzodioxins (PCDDs) and polychlorodibenzo- furans (PCDFs) as well as co-planar polychlorinated biphenyls (Co-PCBs) for which the World Health Organisation (WHO) recently set toxicity equivalent factors. As for benzene, the nation-wide monitoring of dioxins began in 1997. The results of monitoring revealed that the concentration in ambient air in the Metropolitan Area and Kansai Area have decreased slowly (see Figure 7.9). In 2000 almost all monitoring sites attain Japan’s environmental quality standard, 0.6 pg-TEQ/m3 as a yearly average in the Metropolitan Area and Kansai Area.
0 0.1 0.2 0.3 0.4 0.5 0.6
1997 1998 1999 2000 Fiscal Year
Anu
al A
vera
ge(p
g-TE
Q/m
)
3
Metropolitan Area (Kokusetsu Tokyo Site)Kansai Area (Kokusetsu Osaka Site)
Figure 7.9 Trends in the concentrations of dioxins Source: MOE Japan
105

URBAN AIR POLLUTION POLICY MEASURES In Japan, environmental quality standards are set as national administrative targets taking into account damage to human health and the environment. Measures are planned and implemented by central and local governments so as to attain these standards. Standards for five pollutants (SO2 NO2, SPM, Ox and CO) were set in the 1970s while certain hazardous air pollutants (e.g. benzene, dichloromethane and dioxins) were set during the 1990s or later. Stationary Sources The 1968 Air Pollution Control Law designates the types of facility from which large amounts of pollutant are likely to be emitted. Emission standards (e.g. SOx, NOx, and Soot) are set based on the size and type of facility. Many of the emission standards have been progressively tightened. The owner of each such facility must submit a report prior to the installation of the facility and must ensure the facility meets national emission standards and accept local authorities’ inspections. The number of such facilities is approximately 41,000 in the Metropolitan Area and approximately 22,000 in the Kansai Area. It was difficult to attain the environment quality standards for SO2 and NO2 in the Metropolitan Area and the Kansai Area because of the number of industrial facilities clustered in these areas. As a consequence, the system of ‘total emission control’ was introduced by the 1974 Air Pollution Control Law. Under this system, a maximum total amount of pollutant emission is computed with a scientific pollution forecasting method. Special emission standards are applied to large-scale facilities so as to attain the computed total amount. This system started in 1974 for SO2 and in 1981 for NO2. In addition, the regulation of the content of sulphur in fuel has been introduced in some restricted areas including some parts of the Metropolitan Area and the Kansai Area in order to reduce SO2 pollution. A number of agreements which are independent of the national law system have been concluded between local authorities and enterprises where plants are close to the region of the local governments. In some agreements, air pollution prevention articles which are stricter than those in national law are incorporated. Mobile Sources In order to reduce the air pollution from road traffic, the Air Pollution Control Law outlines measures on motor vehicles. The main instrument is the regulation of exhaust emission from liquid petroleum gas (LPG) fuelled, gasoline-fuelled and diesel-powered motor vehicles. Numerical emission standards are set for NOx, CO, HC and PM (applied to diesel-powered motor vehicles only) according to the weight of the motor vehicle. The standards have been progressively tightened so as to promote motor companies’ efforts to develop lower emission technologies. Fuel quality In 1996 regulation of the quality of automotive fuel was implemented to avoid the distribution of low-quality fuel which might result from the free importation of petroleum products. The law stipulates the maximum content of lead, sulphur, benzene and methyl tertiary-butyl ether (MTBE) for gasoline and of sulphur for diesel fuel.
106
NOx Control Law To combat the increasing NOx emission from road transport in the Metropolitan Area and Kansai Area, the Motor Vehicle NOx Control Law was adopted in 1992. Some parts of the Metropolitan Area and Kansai Area are designated areas for the purpose of this law. Buses and trucks registered in designated area must meet the current permissible limits set by the Air Pollution Control Law. Under this law, governors of the district within the designated area are required to develop a comprehensive reduction plan which covers traffic control measures, road construction measures and the promotion of low emission motor vehicles etc. Uniform NOx emission standards for many types of plants were set and progressively strengthened to regulate NOx emission from stationary sources. Moreover, in order to improve severe pollution in urban areas the total emission control system was introduced in 1974 and was applied to NOx in 1981 for the Metropolitan Area and Kansai Area. Under this system, standards stricter than national standards were set for large-scale stationary sources. Uniform emission standards of NO2 for exhaust emission for gasoline-fuelled, LPG-fuelled, and diesel-powered motor vehicles were set and progressively strengthened. Despite these efforts, ambient air concentrations of NOx have not improved largely since 1970s because of the increase of frequency and total number of motor vehicle kilometres travelled. Sulphur Dioxide Various types of measures have been adopted to reduce SO2. These regulate emissions from plants by setting emission standards including standards based on the total emission control system, and limiting the sulphur content of fuels. Suspended Particulate Matter In order to reduce SPM pollution, the regulations of soot emissions for combustion plants and regulations of the structure and the ways of maintenance for non-combustion plants were employed for stationary sources. For diesel-powered motor vehicles, uniform emission standards for exhaust emission were set and progressively strengthened. The NOx Control Law was amended to include articles on PM in 2001 and these will enter into force in the near future. As for PM2.5, which is already incorporated in the regulatory system in the USA, intensive studies to elucidate the relationship between the concentration of PM2.5 in Japan and damage to human health is being undertaken with the aim of establishing an environmental quality standard. Photochemical Oxidants Photochemical oxidants (Ox) is formed through the photochemical reaction of NO2 with hydrocarbons. The high concentration of NO2 in urban areas is thought to be the main reason of the frequent formation of Ox in Japan.
107

Carbon Monoxide Motor vehicle exhaust fumes are the principal source of CO emissions An emission standard for CO was set for gasoline-fuelled, LPG-fuelled and diesel-powered motor vehicles and progressively tightened. Benzene Industrial plants and motor vehicle exhaust emissions are the main source of benzene. In urban areas, benzene from motor vehicle fuel is the dominant source. Countermeasures for this problem comprised the introduction of an upper limit for benzene content of gasoline as well as the regulation of motor vehicle exhaust emissions by setting an hydrocarbon emission standard for gasoline-fuelled, LPG-fuelled and diesel-powered motor vehicles. Dioxins The principal sources of emission of dioxins into the ambient air are waste incinerators. Electric steel making furnaces, zinc recovery facilities are also major emission sources. The Japanese Government set a target to reduce the total amount of dioxin emissions by 2002 to approximately 10 per cent of the amount in 1997. Furthermore. in 1999 a law concerning special measures against dioxins was adopted to begin the regulation of major dioxin-emitting plants. Under this law, owners of plants must ensure flue gases meet the emission standard and must report to local authorities the result of periodic self-checks of their compliance with the standard. A number of small-scale incinerators were abolished as a result of the law entering into force. Abatement Technology for Air Pollution Sulphur oxides It is the obligation of the owner of a company or facility releasing SOx to introduce the measures necessary to comply with regulatory standards. With the gradual strengthening of the regulation and the introduction of total emission control, companies have found it necessary to actually reduce the volume of emissions. Emission volume reduction has been carried out mainly through: (i) conversion to cleaner fuels; (ii) energy conservation; and (iii) installation of flue gas desulphurisation equipment. Conversion to cleaner fuels Reducing the sulphur content of heavy oil has been one approach to which industry has devoted considerable effort. Heavy oil desulphurisation facilities have been established, and at present, Japan remove sulphur from up to 1.2 million barrels of heavy oil per day. The average sulphur content of the heavy oil used in Japan was 2.5 per cent in 1967, but by 1992 this had fallen to 1.05 per cent. Conversion to liquefied natural gas has also contributed to a reduction of SOx emitted into the atmosphere. Energy conservation Energy conservation in industrial processes, spurred on by the oil crisis, was pursued for the purely economic reason of maintaining and strengthening international competitiveness by reducing production costs, but this also contributed greatly to the reduction of air pollutants. The progress made in energy conservation by Japanese industry can be seen in the changes
108

in energy consumption by six major industries which account for about 70 per cent of industrial energy consumption in Japan These industries include iron and steel, petrochemical, paper and pulp for which an improvement of 20–40 per cent was achieved between 1973 and 1987. Flue gas desulphurisation In addition to conversion and energy conservation, another measure to reduce SOx emissions in Japan has been the installation of flue gas desulphurisation units at large-scale sources. This was the final choice of many large factories to meet strict regulatory standards, but it did prove very effective in reducing SOx emissions. Desulphurisation processes for flue gas can be roughly classified into dry processes and wet processes. The wet process, which requires high rates of SOx removal, is commonly used in Japan. In 1970, there were only 102 flue gas desulphurisation plants in Japan, but by 1995 this had grown twenty-fold to a total of 2,200; during the same period, processing capacity grew by 42 times to 200 million cubic metre/hour. Nitrogen Oxides NOx generated by combustion includes thermal NOx produced during the reaction of nitrogen in the air with oxygen at high temperatures, and fuel NOx produced from nitrogenous compounds in fuels. Control measures for NOx emitted from stationary sources are as follows: Conversion to Cleaner Fuels Fuel NOx originated from nitrogenous compounds in fuel can be reduced by conversion to cleaner fuels ; from coal to oil or natural gas. Low NOx Combustion The amount of thermal NOx can be decreased by improving combustion conditions and techniques. Methods to improve combustion conditions and techniques are listed below. Improvement of combustion conditions:
- decreasing air ratio - decreasing air preheating - decreasing heat load of combustion chamber
Improvement of combustion techniques:
- using a low NOx burner - two-stage combustion method - flue gas recirculating method - off-stoichiometric (Bias) combustion - improving combustion chamber - water or steam injection - using additives
Flue gas denitrification Denitrification is a technique to remove NOx from flue gas. In 1972, there were only 5 flue gas desulphurisation plants in Japan, but by 1995 this had grown to a total of 736; during the same period, processing capacity grew to 318 million cubic metre/hour. Selective catalytic reduction is most commonly used (93%), followed by non-catalytic reduction (4%) and non-selective catalytic reduction (1%).
109

IMPROVED AIR QUALITY One success in improving air quality in the Metropolitan Area and Kansai Area has been due to the abatement of SOx pollution. The concentrations of SO2 in the Metropolitan Area and Kansai Area have decreased considerably over the last 30 years. The relatively minor contribution to the emission of SOx made by road traffic must be one the factors behind this success. The countermeasures taken can be summarised as follows: Legislation: - establishment of environment quality standard for SO2; - regulation of emission from plants by setting emission standard including standard based
on the total emission control system; and - regulation of sulphur content in fuels. Technical aspects: - introduction of heavy oil desulphurisation systems at oil refineries; and - Installation of desulphurisation units to large-scale facilities. FUTURE MEASURES TO REDUCE URBAN AIR POLLUTION Since various types of measures have been already introduced, it is probably difficult to decrease the pollution by mere extension of existing measures. Drastic changes in existing measures or new types of measures might be necessary. Some of the measures subject to future consideration are as follows: For stationary sources: - rigorous implementation of NOx regulatory system in force both for existing plants and
for new plants. For stationary sources and road construction: - effective implementation of the environment impact assessment (EIA) system. For motor vehicles: - regulation of motor vehicle inflow into urban areas, especially the inflow of
diesel-powered motor vehicles; - introduction of economic methods such as road pricing in order to decrease traffic in
urban areas; and - promotion of rail especially for freight transport. Motor vehicle emissions are one of the principal sources of SPM. Countermeasures to reduce the road traffic in urban areas similar to those used for NOx might be also effective in reducing SPM pollution. Furthermore, the countermeasures for SPM should include measures to reduce the emission of SO2, NO2, and volatile organic compounds (VOCs), in ambient air because these pollutants may also form SPM in the atmosphere. The measures not listed for NO2 but which are subject to future consideration for SPM control include: - regulation of emission of VOCs from stationary sources; and - introduction of a new system to control total amount of SPM precursors.
110

8 AIR QUALITY MANAGEMENT POLICY IN KOREA
Tae-Bong Jeon, Air Quality Policy Division, Ministry of Environment, Seoul, Republic of Korea INTRODUCTION The Korean Government has implemented a number of measures over the past few decades to improve air quality in Korea. Some of the more notable policy initiatives have included supplying clean energy (natural gas, low-sulphur fuel, etc.) to the public and strengthening the emission standards for industry and motor vehicles, which began in the early 1980s. As a result of these initiatives, there has been a continuous reduction of air pollutants such as sulphur dioxide (SO2 )and particulate matter (PM). However, the concentration of ozone (O3) and nitrogen oxide (NOx) in some urban conurbations has not decreased significantly over the past ten years. This has been mainly due to an unprecedented rise in the number of motor vehicles. This paper will review the current status of air quality in Korea and the main policy initiatives take to improve urban air quality. THE CURRENT STATUS OF AIR QUALITY IN KOREA The air pollution problem in Korea has been gradually improving. The levels of ambient air pollutants, including SO2, meet air quality standards due to the mandatory use of clean fuel and the supply of low sulphur fuel. However in some large cities, levels of NOx, PM, and O3 have exceeded air quality standards during certain periods throughout the year (see Figure 8.1).
0
0.01
0.02
0.03
0.04
0.05
0.06
1990 1991 1992 1993 1994 1995 1996 1997 1998 1999 2000
ppm
0
10
20
30
40
50
60
70
80
90
㎍/㎥
PM10
SO2
NO2
O3
Figure 8.1 Trends in key air pollutants Source: MOE Korea
111

In Seoul, SO2 concentrations have fallen from a peak of 0.094 ppm in 1980 to 0.006 ppm in 1990. Following the extended supply of clean and low-sulphur diesel fuel, the nation-wide air pollution monitoring stations showed that SO2 concentrations levels meet the air quality standard of 0.02 ppm as an annual average, except for some stations installed in Ulsan area. Despite the extensive use of clean fuel and the stringent emission standards levels of PM10 have been increasing. This increase has been sue the rise in pollutant emissions from motor vehicles and the impact of the yellow dust phenomenon. Compared to some of the major cities in advanced countries, PM10 levels in Korean cities are 2-4 times higher (Seoul 65 µg/m3, London 14 µg/m3, New York City 28 µg/m3, Tokyo 38 µg/m3 in 2000). Due to an increase in the PM10 levels, annual average visible distance in Korea has decreased from 13 km in 1996 to 10 km in 2000. As the number of motor vehicles increased from 1 million in 1985 to 1 2million in 2000, the amount of vehicle exhaust emissions have also increased significantly with an increase in NO2 pollution. For example, in Seoul, the concentration of NO2 has increased from 0.030 ppm in 1990 to 0.034 ppm in 2000. The level of O3 pollution also shows an upward trend. Of the 140 measurement stations installed nation-wide, 71 have exceeded the air quality standard of 0.1 ppm on average per hour, and the number of ozone warnings issued during the summers is on the increase. In 2000, a total of 52 warnings were issued compared to 24 were in 1997. The increase in air pollution level in Korea has been due to the combination of the following factors: high population density; high pollutant emission volume per unit area; and increase in motor vehicle ownership and energy use. Of these the rapid increase in the rate of motor vehicle ownership is the most important cause of air pollution in large cities. For example, the number of motor vehicles has increased by approximately 93 times in the past 30 years (1970:130,000 cars, 1980:530,000, 1990:3,400,000, 2000:2,050,000). MAJOR POLICY FOR AIR QUALITY MANAGEMENT One objective of the Korean Government policy has been to increase the supply of clean fuel such as low-sulphur fuel. The Government has also sought to establish a scientific and systematic foundation for the management of air quality. At present, the Korean Ministry of Environment (MOE) is making a concerted effort to ensure that there is no deterioration in air quality due to the large number of visitors that will be attracted to Seoul by the 2002 FIFA World Cup Since the major contributor to air pollution in large cities is the motor vehicle, the MOE is promoting measures to combat vehicle pollution. The MOE has implemented a number of measures to reduce air pollution caused by motor vehicles. Its policy can be summarised in Table 8.2.
112

Table 8.2 Air pollution management and policy measures for mobile sources Motor vehicle manufacture management measures
1. promotion of motor vehicles using clean fuel, such as the natural gas
2. strengthening the motor vehicle emission allowance standard to foster the development of low-pollution engines
Motor vehicle operation management measures:
1. street-level enforcement 2. institutionalisation of regular
inspections 3. prevention of idle engine rotation
Traffic Management measures 1. smooth traffic 2. reduce traffic volume 3. adjust fuel price, educational publicity
Source: MOE Korea ESTABLISHING THE FOUNDATION FOR AIR POLLUTION MANAGEMENT IN KOREA Emissions Inventories To provide a scientific and systematic foundation for the management of air quality, tHe MOE is undertaking a survey to prepare an emission inventory of pollutants. The survey is currently being conducted using energy statistics. However, in the future, the survey will also include pollutants emitted during energy non-use processes. Using such modelling, the MOE will then be able to establish a pollutant reduction plan. Expanding Monitoring Networks There are currently 311 measurement stations installed and operated nation-wide to provide on-going measurements of air pollution levels. The MOE plans to increase the number of these stations to 457 by the 2005. A Photochemical Assessment Monitoring System will be gradually expanded. In order to reduce the air pollutants emitted from industrial facilities, which currently responsible for approximately 26 per cent of total air pollutants, the MOE has strengthened the emission standards and established a Tele-Metering System (TMS) which monitors whether the air quality standard is being observed. The MOE plans to complete the installation of the TMS in major business spots by 2005. Expanding Use of Clean Energy The MOE intends to decrease the emissions of air pollutants by using environmentally friendly energy. From 2001 the MOE has been implementing a policy of supplying low-sulphur (less than 0.3 per cent) fuel to seven regions with the most serious air pollution. This programme will be expanded to other regions by 2002. The policy began in 1981 when the maximum permissible sulphur content of bunker-C oil was set at 4.0 per cent. and over the years the sulphur limits for fuel have been tightened. In 1985 the MOE banned the use of solid fuel in the five largest cities as well as in eight
113

cities and provinces in Seoul. Today the use of solid fuel is banned in 20 cities in Seoul and Pusan. Furthermore, for 36 cities, including the Seoul Metropolitan Area, where air pollution level is high, the use of Liquefied Natural Gas (LNG) and other clean fuels for boiler in housing complexes is mandatory. It is also mandatory to use LNG for power generation facilities in the Seoul Metropolitan Area. Measures for an Environmentally Friendly World Cup The Korean Government is placing a great emphasis on hosting an environmentally friendly World Cup IN 2002. In order to achieve this goal, the government has taken a number of important steps. The MOE is introducing low pollution vehicles such as compressed natural gas (CNG) buses, minimising air pollutants through more efficient emissions management, promoting public transportation, preventing motor vehicles from running idle, and limiting the operating hours of incinerators in the host cities. The MOE plans to supply low-sulphur (less than 15ppm) diesel in the Seoul metropolitan area. New Motor Vehicle Emission Standards The emission standard for new motor vehicles has been strengthened many times in Korea in order to foster the manufacture of motor vehicles that generate less pollutants. However, compared to the standards in developed countries such as Europe, the Korean standard lags far behind. In the case of gasoline-fuelled motor vehicles, the Korean standard is equivalent to EURO II standard of the European Union and TLEV standard of the United States. In 2002 the standard will be upgraded to EURO III and LEV levels. In 2006, the government plans to upgrade the standard to EURO IV and ULEV. The diesel engines currently produced in Korea lag behind in technology compared to those produced in developed countries. Technology development is therefore an urgently required. Since 1998, initiatives for developing motor vehicles with low-pollution technology have been implemented such as the high-compression dispersion device for mid-size motor vehicle diesel engines. Along with motor vehicle operation management measures, personal habits, such as long pre-heating of engines and not turning off the ignition key when the car is parked or is at a complete stop, lead to unnecessary fuel consumption. Such habits also increase the generation of emission gases and contribute to the air pollution. Therefore, the government plans to regulate idling in transportation terminals, motor vehicle depots, parking lots, and other special areas. The Introduction of CNG Buses Large motor vehicles such as buses and trucks which use diesel fuel are a major source of motor vehicle air pollution. Although heavy-duty diesel buses and trucks represent only 4 per cent of the total amount of vehicles, it is estimated that they emit 47 per cent of total vehicle emissions. Furthermore, vehicle air pollution in the Seoul metropolitan area, which accounted for 55 per cent of total air pollution in 1991, rose to 85 per cent in 1999. For this reason, since 1998 the government has been promoting natural gas buses, which emit 70 per cent less ozone-generating pollutants, no visible soot and emit 15 per cent less carbon dioxide compared to existing diesel buses. Based on these figures, the MOE became convinced that promoting CNG buses would greatly improve the urban air quality in a
114

short period of time. From 1991, the Korean Ministry of Environment and Ministry of Industry and Energy have provided US $20 million to motor vehicle research institutes to develop low emission core technologies related to CNG engines. Since 1998 four CNG buses have been used on real bus routes for an evaluation. The test results (including emission levels, drivability, durability and user acceptability) were excellent and major problems for large-scale deployment have not been discovered. Korea is a relatively small country, with conditions favourable for the construction of a CNG infrastructure. A nation-wide natural gas pipeline was constructed in the mid-1990s. The construction of natural gas stations at bus terminals can be achieved at a reasonable cost. In addition, the price of importing natural gas is less than that of crude oil and the CNG bus project can act as an impetus for finding new energy sources in the transportation sector. In order to induce participation from local governments and relevant industries, the MOE has provided various support: reducing natural gas prices and subsidising bus purchase (2.25 million Won per bus); installing refuelling facilities on publicly-owned lots and constructing bus parking lots; and making efforts to raise awareness of the safety of refuelling facilities and the environmental benefits of using natural gas buses. MOE revised the Air Quality Preservation Law to include the legal provisions to replace the existing diesel buses with CNG buses so that the CNG promotion projects could proceed with legal support. In addition, the law regulating gas station construction was revised with the support of related ministries. Specifically, the rules and regulations that restrict the construction of CNG refuelling stations within city limits were changed. In order to introduce 20,000 CNG buses and to construct 400 gas stations, the MOE and local governments will spend a total of US $610 million by the 2007. The MOE spent US $38 million in 2000 and US $46 million in 2001. A total of US $153 million will be spent by 2002. In 2000 the financial subsidy to bus companies amounted to US $20 million, half of which was funded by the MOE and the other half by the local governments. In addition, the MOE allocated US $18 million to gas station owners in the form of low interest loans. Laws were modified to exempt those paying value-added and acquisition taxes on the purchase of CNG buses. This tax deduction it was worth US $9.2 million in year 2000 and will be worth approximately US $167 million by 2007. The budget and tax support, to encourage the purchase of CNG buses is essential. because the CNG buses are more expensive than diesel buses and the construction of gas stations is necessary. It is therefore imperative to consider the reasonable profitability and return for initial investment by bus owners and operators. The government plans to replace 5,000 superannuated diesel-fuel city buses with natural gas buses by 2002. The goal is to ultimately replace all 20,000 city buses nation-wide by the 2007 (see Table 8.1). Since June 2000, 275 CNG buses have been operating in six cities. The MOE will supply 2,354 CNG buses by the end of this year and install 68 refuelling facilities. In the cities that will host the 2002 World Cup, 5000 buses will be replaced with CNG buses before the start of the games.
115

Table 8.2 Number of CNG buses supplied
Year 2000 2001 2002 2007
Buses 77 2,345 5,000 20,000 Source: MOE Korea In the future the MOE plans to encourage the development of advanced CNG engines, for example, develop ways to utilise catalytic converter and engines powered by Liquefied Natural Gas (LNG) and explore how to minimise the economic burden of private bus companies when the use of CNG buses is expanded. The MOE will also support the monitoring of CNG bus operations by civil organisations as part of an effort to identify potential problems, develop corrective measures and improvements. CONCLUSION Motor vehicle emission are currently the largest source of air pollutants in Korea. Maintaining clean air will therefore be difficult without a comprehensive motor vehicle air pollution reduction policy. The MOE plans to reduce the volume of air pollutants emitted by motor vehicles by 50 per cent by 2005. Fuel quality improvement measures such as the reduction of the sulphur content of diesel fuel will also continue to be pursued. The diesel fuel price increase and the improvement of traffic systems and publicity campaigns on environmentally friendly driving habits will also be implemented. The MOE is also planning mid- and long-term comprehensive air quality measures. Target pollutants will be expanded from SO2 and dust to include NO2, volatile organic compounds (VOCs) and other hazardous air pollutants.
116

9 AIR POLLUTION PROBLEMS IN THE CAPITAL CITY OF ULAANBAATAR, MONGOLIA
P. Batima, Institute of Meteorology and Hydrology, Ulaanbaatar, Mongolia M. Erdenetuya, National Remote Sensing Centre, Ulaanbaatar, Mongolia R. Erdenechimeg, Health Complex of Sukhbaatar District, Ulaanbaatar, Mongolia L. Batnyam, National Agency for Meteorology, Hydrology and Environment Monitoring, Ulaanbaatar, Mongolia INTRODUCTION Ulaanbaatar is the capital city of Mongolia. The city is located in the centre of Mongolia, in the middle of the Khentein Mountain. The population of Ulaanbaatar is more than 700,000 (as of 2000). The area of the city is 135,800 hectares. The average elevation is 1,206 metres (m) above see level. Ulaanbaatar is surrounded by four high mountains: to the south Bogd Mountain (2,268 m above sea level) and Songino Khairkhan (1652 m above sea level), to the north Chingelte Mountain (1949 m above sea level) and to the east Bayan Zurkh Mountain (1834 m above see level). The country’s energy use patterns are determined by its economic growth, large land area, climatic regime, low population density and its domestic resources. Coal is abundant: recoverable reserves are estimated to be 50 billion tonnes. It is used for the bulk of Mongolia’s power and heat (80 per cent), whilst oil products (mainly diesel oil) accounts for the remainder. Currently, Mongolia has no domestic oil or natural gas production and all oil products are imported mostly from Russia. Petroleum products are consumed mainly by the transport sector. Apart from traditional biomass fuels (wood, dung), there is no substantial primary energy source in Mongolia. The use of Mongolia’s enormous hydro-electric power potential is severely hampered by the harsh Mongolian winters. The non-commercial primary energy sources include fuel wood and animal dung. In households wood and dung are used for cooking and heating. It is estimated that heat consumption will reach its maximum in 2020, at a level more than five times that of 1993. This will be mainly due to the increase in consumption in industrial and service sectors. Electricity consumption is projected to reach 6.8 times the 1993 level in 2020. This growth is related to the diesel consumption in the mining sector and the growth of transport sector. Consumption of diesel fuel is expected to increase by approximately 7.1 times and gasoline by 6.5 times in 2020, compared to 1993 (Batima et al., 2000). The Mongolian economy is relatively diversified. Agriculture accounts for close to 33 per cent of gross domestic product (GDP), industry and construction for 27.5 per cent, and services for approximately 40 percent (Statistical Yearbook, 1998). Mining, mainly copper, provides an estimated 27 per cent of the economy’s export earnings (1998). Industry includes wool and cashmere processing, leather goods production, food processing, construction and, in recent years, garments. Growth resumed in 1994 and has remained positive despite economic downfall. It peaked at 6.3 per cent in 1995, but dropped to 2.6 per cent when copper prices plummeted in 1996. Growth reached 4 per cent in 1997, driven by rapid expansion in the mining and services sectors: mineral production alone increased by 21 per cent.
117

The issue of urban air pollution is becoming of increasing concern due to the increase in demand for electricity and the concentration of population in the urban area. AIR POLLUTION IN ULAANBAATAR The major sources of air pollution in the city of Ulaanbaatar city are:
Combined Heat and Power (CHP) plants: there are three CHP plants in Ulaanbaatar. The stations consume approximately 5 million tonnes of coal per year. The total power of these stations is 2,500 megawatt-hours (MWh) per year.
•
•
•
•
•
Heat only boilers: there are 250 heat only boilers used for heating individual buildings and industrial facilities. The boilers use 400 thousand tonnes of coal per year. Transport: more than 37,000 vehicles of 500 different types and considered as moving sources. Households: there about 75,000 households which consume nearly 200 thousand tonnes of coal and 160 m3 wood per year for cooking and domestic heating. Aerial sources: dust from solid waste, power station ash and degraded land.
There are four stations in Ulaanbaatar which monitor emissions of sulphur dioxide (SO2), nitrogen dioxide (NO2) and dust (Annual Report, 1999). The overall mean concentrations of SO2 and NO2 for the city have increased during the period 1994–1999. These concentrations increased by 1–2 mg/m3 per year (see Figure 9.1). In particular the SO2 concentration increased from 4–7 mg/m3 and NO2 concentrations from 14–23 mg/m3 in the period 1994–1998 (Batnyam, 2001). The main source of SO2 in Ulaanbaatar is CHP plants and heat-only boilers. From October to March, SO2 concentrations tend to rise significantly due to an increase in emissions of polluting substances into air from heating point sources.
Figure 9.1 Changes of annual mean concentrations of SO2, NO2 and dust in Ulaanbaatar, 1994–1999 Source: Batnyam (2001)
118

In 1999, the daily mean concentration of NO2 in Ulaanbaatar was 23 mg/m3 although a maximum daily concentration of 64 mg/m3 was observed at one of the four monitoring stations.. Power plants, manufactures and cars are the main emitters of NO2 where burning processes occur at a high temperature. Particularly high levels of emissions are caused by old cars with poorly maintained engines. Increased concentrations of NO2 are observed mainly along the road and at traffic sites of the city. One of the main causes of the increase in NO2 concentrations is the rise in the number of cars over the past decade and a general lack of traffic management and vehicle maintenance.
May Dec
The main sources of sulphur dioxide in Ulaanbaatar are CHP plants and Heat Only Boilers. During winter, from October to March, the concentration of SO2 rises significantly due to an increase in emissions from heating point sources. Figure 9.2 illustrates changes in diurnal concentrations of SO2 in the city in different seasons. Generally speaking, air pollution increases from the morning and reaches its maximum at 1600 hrs then decreases gradually through the night.
0
5
10
15
20
25
30
35
0400 hrs 0800 hrs 1200 hrs 1600 hrs 2000 hrs 2400 hrs
SO2 c
once
ntra
tions
(mg/
m3 )
Jan July
Figure 9.2 Diurnal changes in concentration of sulphur dioxide in Ulaanbaatar Source: Batnyam (2001) Figure 9.3 shows the dust concentrations over the past five years. The concentrations of dust increase from November and reaches a maximum value in April. This is the month of strong spring winds and dust storms in Ulaanbaatar.
119

050
100150200250300350400
1995 1996 1997 1998 1999
mg/m3
Figure 9.3 Concentrations of dust in Ulaanbaatar Source: Batnyam (2001) AIR POLLUTION AND HEALTH One of the main health issues in Ulaanbaatar is acute respiratory infection in children due to air pollution (Erdenetuya et al, 2000). According to the results of The Mother-infant Research Centre, 25–40 per cent of clients visited a doctor and 32.6 per cent of treated patients suffered from acute respiratory diseases. Figure 9.4 compares acute respiratory diseases among total patients in Mongolia to other developing countries. The result of the study showed a clear correlation between increased concentration of SO2, NO2 and carbon monoxide (CO) in air and respiratory diseases. An example of the relationship between SO2 and acute respiratory infection (ARI) is shown in Figure 9.5. The incidence of respiratory diseases in children under 5 years old is 2–3 times higher in Ulaanbaatar than in rural areas.
35.8
31.5
33.634
32.6
29
30
31
32
33
34
35
36
Percentage
Bangladesh Mayamar Pakistan Zambia Mongolia
Country
Figure 9.4 Percentage of children infected by acute respiratory diseases among total patients treated in hospital Source: Erdenetuya et al (2000)
120

0
500
1000
1500
2000
1 2 3 4 5 6 7 8 9 10 11 12
Months
Num
ber
Acut
e R
espi
rato
ry
Infe
ctio
ns
0
0.02
0.04
0.06
0.08
0.1
SO 2
concentration
mg/m
3
ARI SO2 (mg/m3)
Figure 9.5 Relationship between SO2 concentrations and the occurrence of acute respiratory infection Source: Erdenetuya et al (2000) The children under age of 2-12 months are particularly vulnerable to diseases caused by air pollution (see Figure 9.6). In developed countries 3-4 per cent of children under 5 years old suffer from ARI compared with a usual incidence of between 7-18 per cent in developing countries. However, the ARI rate amongst children under the age of 5 years in Mongolia is 24 per cent. Figure 9.7 compares the percentage of children infected by acute respiratory diseases among total patients visiting a doctor in different countries. It shows that in Mongolia a high percentage of children suffer from acute respiratory diseases.
0 200 400 600 800 1000 1200Number of Children
over 2 months
1 year
3 years
5-7 years
Age
Figure 9.6 Number of children diagnosed with acute respiratory infection per year by age Source: Erdenetuya et al (2000)
121

25.5
39.3 41.8
35 34
40
05
1015202530354045
Percentage
Ethiopia Iraq Brazil England Austria Mongolia
Country
Figure 9.7 Percentage of children infected by acute respiratory diseases among total patients visiting a doctor in different countries Source: Erdenetuya et al (2000) AIR POLLUTION MANAGEMENT The Government of Mongolia has taken several steps to deal with environmental problems and nature conservation. One of the options for the allocation of pollutant emission limits among sectors is the introduction of emission permits. Since 1992, the Great Khural (parliament) of Mongolia has passed eighteen laws directed toward environmental protection. In addition, it passed the State Policy on the Environment in 1997, which forms the legal basis for the protection of the environment and Mongolia’s natural resources. In 1995, the Mongolian Environmental Action Plan was published which described a programme of action to protect air and outlines the country’s priorities for air pollution monitoring and management. This is the regulatory instrument which relates to the development of relevant economic sectors such as energy, coal mining, agriculture, industry, transport, infrastructure, etc. Also, the Law on Air was ratified by the Parliament. Existing national and sectoral action programmes, plans and policy documents that could be integrated into the air protection action programme are listed in Box 9.1. The National Agency for Meteorology, Hydrology and Environment Monitoring, which falls under the MNE, is responsible for pollution monitoring and development of pollution emission inventories, national action programmes and plans related to air as well as environmental issues. Other government institutions, NGOs, the private sector, academic and education institutions should be involved in planning as well as in the implementation of activities to protect air quality.
122

Box 9.1 Existing national and sector policy documents • Concept of National Security of Mongolia, State Great Khural (Parliament) (SGK),
1994 • National Development Concept of Mongolia, SGK, 1996 • National Concept of Ecology, SGK, 1997 • National Plan of Protected Areas, SGK, 1998 • Mongolian Action Programme for the 21st Century (MAP-21), 1999 • National Environmental Action Plan of Mongolia, GoM 1993 • National Programme for Natural Disaster Reduction, GoM, 1999 • Power System Master Plan, ADB, 1996 (It will be updated in 2000) • National Plan of Action to Combat Desertification in Mongolia, GoM, 1997 • National Plan of Forestry, Mongolia, GoM, 1998 • National Plan of Water, Mongolia, GoM, 1998 • National Plan for Public Ecological Education of Mongolia, GoM, 1997 • National Plan of Waste Management, Mongolia, GoM, 1999 • Asia Least-cost Greenhouse Gas Abatement Strategy, Mongolia, ADB/GEF/UNDP,
1998 • National Plan “100.000 sun’s home” of renewable energy in rural area, GoM, 1999 • Road Master Plan and Feasibility Study, ADB, 1996 • The Police on Promotion and Development of the Industry, GoM, 1998 • Programme on Promotion of Manufacturing Products for Export, GoM, 1998 • Programme on Promotion of Small and medium Enterprise, GoM, 1999 • Renewable Energy Master Plan of Mongolia. Draft 2000 • Coal Master Plan • Master Plan Study for Rural Power Supply by Renewable Energy in Mongolia. Draft The energy sector of Mongolia is a major contributor to air pollution in Ulaanbaatar. Figure 9.8 shows the sectoral share of air pollution – the CHP sector is a major polluter followed by the transport sector.
Figure 9.8 The sectoral share of air pollution of Ulaanbaatar Source: Ministry of Nature and the Environment Mongolia (1999)
123

The electricity and heat sectors current face a number of problems which are due to obsolete technologies, poor coal quality and the lack of funds for maintenance. The most widely recognised barriers are:
Institutional: Most subsectoral problems seem to be more or less recognised and are being addressed to a certain extent. Unfortunately, there is no integrated approach for all sectors and responsibilities are not clearly defined among the sectors.
•
•
•
• • • • • •
• •
•
•
•
•
Financial: Due to the economic difficulties in Mongolia, the country is in the middle of transition towards a market economy. The Government is unable to resolve financing issues in the energy supply and production sector despite most of the investments being allocated in this sector. Technical: Most of the old technologies have both low efficiency and high energy losses. In addition, the heat content of the coal is low and variable, which leads to combustion problems and poor overall performance of the power plants.
RECOMMENDATIONS In order to reduce air pollution of Ulaanbaatar a number of measures could be taken to improve the efficiency of power plants such as:
increasing efficient ‘clean’ coal technology; improving efficiency of CHP plants; improving efficiency of boilers, furnaces and coal-fired household stoves; improving district heating distribution and buildings; introducing energy efficient measures and technologies in industry; and increasing the use of renewable energy for electricity generation.
The second main source of pollution in the city is the transport sector. The measures needed to reduce air pollution include:
increasing public transportation facilities and encouraging the use of public transport; improving the capacity and utilisation of the transport sector and replacing and renewing the vehicle fleet with new vehicles better suited for the conditions of the country, which are fuel efficient and have low operational costs; and establishing a technical inspection network to provide for a greater operational and traffic safety and to reduce the environment impacts of motor vehicles on health and environment.
In addition to the introduction of pollution control measures in certain sector, education and public awareness activities should also be implemented. These activities could include:
National technical experts: Training to different target groups is an important part of the air pollution education programme. This can be achieved by the participation in local and international training and workshops. Hence, the skills of national technical experts and other personnel related to the action programme can be improved. Stakeholders: It is important to inform and educate the staff in government agencies, NGOs, industries, financial agencies, and academic institutions related to the air pollution problems and concerns. Public: The organisation of periodic information campaigns to distribute informative leaflets and other materials at the national, the regional and the local level to inform and educate the society should be implemented. A periodic evaluation of the level of
124

public awareness about air pollution is important to increase public participation in the issue. Options for informal education in the field of environmental protection include use of mass media (newspapers, television programs, booklets) and conferences and workshops for the public and the press on related issues. Students and school children: To provide students and pupils with knowledge on the environment and its pollution and to include optional courses in environmental education, special lessons on environmental issues, activities outside the classrooms in the school programmes are essential for the implementation of the action programme.
•
• Air pollution reduction pilot and/or demonstration projects and the dissemination of results will play an important role in increasing awareness of air pollution issues. Therefore, it is recommended to initiate and implement pilot and/or demonstration projects on the reduction of air and environmental pollution of the city.
CONCLUSION Ulaanbaatar is the capital of the country and its air is highly polluted compared to other cities in Mongolia. Almost one third of the country’s population live in Ulaanbaatar. One of the specific characteristics of Mongolia’s climate is its long, cold winter where temperature drops to –30–40oC. Heating is required for eight months during late autumn, winter and early spring. Hence as much as 77 per cent of the power plants fuel consumption is used for heat generation. This long-lasting cold climate and high consumption of fuel for heat generation cause high levels of air pollution in Ulaanbaatar especially in winter. The result is high levels of respiratory infections and disease, especially in children under 5 years old for whom the levels are 2-3 times higher in Ulaanbaatar than in rural areas. REFERENCES Ministry of Nature and the Environment (1999) Annual Report for 1998, Ulaanbaatar,
Mongolia Altantsetseg, J and Namkhaijantsan, G (1997) ‘Change of Bio-climate conditions and
Human Health in Mongolia’ presented at the Third Mongolia and China Symposium on Climate Change in Arid and Semi-arid Regions over the Central Asia. Beijing, China
Batnyam, L (2001) Pollution control management and urban air pollution, Country report, Centre for environmental training, Singapore
Batima, P, Dagvadorj, D and Dorjpurev, J (2000) Greenhouse Gases Mitigation Potentials in Mongolia, Ulaanbaatar, Mongolia
Erdenetuya, M and Erdenechimeg, R (2000) ‘Mongolian climate and children health’ Environmental Threats to the Health of Children, Manila, Philippines
125

10 AIR POLLUTION CONTROL STRATEGIES FOR TAIPEI CITY
Dah-Jin Wang, Bureau of Environmental Protection, Taipei City Government, Taipei, Taiwan INTRODUCTION In accordance with Executive Yuan’s National Environmental Protection Project, Taipei Municipal Government has been improving urban air quality in the city. After undertaking air quality surveys and providing guidance for, and inspection of, air pollution sources, a reduction in the concentration of urban air pollutants has been achieved. These pollutants include particulate matter (PM10), sulphur dioxide (SO2), nitrogen dioxide (NO2), carbon monoxide (CO) and lead (Pb). This paper provides an overview of air pollution control strategies in Taipei city and examines the issues of air quality analysis, emission profile, control measures for greenhouse gases and mobile sources. The paper concludes by discussing the effects of implementing an air pollution reduction strategy. TAIPEI CITY Located in northern Taiwan, Taipei has a thriving arts and academic centre and countless modern commercial buildings. With its vibrant cultural and economic growth, it has become a modern international metropolis. Taipei is nestled in a basin with mountains on all sides and covers an area of 27,180 hectares (271.8 km2) accounting for 0.76 per cent of the entire Taiwan area. Two mountain peaks rise up steeply in the north-east: Mount Tatun and Mount Chihsing, both just over 1,000 metres high. By virtue of this unusual topography, the area was made into Yangmingshan National Park. To the south-east of Taipei lies Songshan Hill and Chingshui Ravine which form a natural protective barrier of lush woods. The Hsintien Creek is located to the south-west while the Keelung River lies to the north-east. The two rivers converge to become the Tanshui River which then flows into the Taiwan Strait. Taipei has a subtropical climate, with an average temperature of 23.6 ºC. Summer is from May until September and is characterized by scorching heat and high humidity. Average temperatures range between 25.2–28.6 ºC. Autumn is from October to November, with average temperatures ranging between 22.2–24.2 ºC. The city had 350, 000 households and a population of 1.60 million at the end of 1968, just prior to the administration reform. By the end of 2000, the number of households had reached 889,000 with a population of 2.65 million. Over the past 32 years, the population has increased by 65 per cent and the number of household have increased 1.5-fold. The number of motor vehicles reached 1,625,526 at the end of 2000 - an increase of 48 per cent (530,813) compared to the 1990 level. On average, the annual growth rate was 4.05 per cent over the decade. The number of automobiles increased from 497,127 to 666,513 in the period 1990-2000 - an average annual growth rate of 3.01 per cent. In 2000 the number of motorcycles was 938,400 vehicles more than in 1990 - an average annual growth rate of 4.87 per cent. The highest growth rate was for non-commercial compact cars which
126

increased 39 per cent over the decade. At the end of 2000, there were 614 motor vehicles (including 252 automobiles and 362 motorcycles) for every thousand city residents. In recent years, urbanisation has resulted in rapid business development, mostly urban light industry. The number of factories in the city was 2,171 at the end of 2000 with a work force of 59,897 persons. To ensure Taipei develops into a modern city with a clean and healthy environment, urban air quality management has become a priority issue on the municipal agenda. Since the city was upgraded to a municipality, laws and regulations have been amended and a specialised environmental protection agency has been established, which is responsible for the protection of air, water and the control of noise nuisance, environmental hygiene and waste disposal. CURRENT STATUS OF AIR QUALITY IN TAIPEI Taipei is located within the northern air quality control basin and the Environmental Protection Agency (EPA) has set up 19 stations in this basin to monitor the air quality. Since the air pollution sources of Taipei City and Taipei County affect and interact with each other, this paper will first discuss the current status of the air quality within the northern air quality basin and then the current status of the air quality monitoring activities in Taipei City. In 1999, the number of days with a pollutant standards index (PSI) more than 100 were 189 slightly more than the 174 exceedances of the previous year (1998). Due to the effect of the sandstorm from mainland China, the number of days with PSI more than 100 from January to April 2000 were 255 although the number of exceedances would have been 177 if the effects of the sandstorm were excluded. The goal of 197 exceedances was met in 2001. The EPA has seven automatic monitoring stations in Taipei, including five air quality monitoring stations, one traffic monitoring station and one meteorological station. If the 21 days with recorded PSI more than 100 in 2000 due to a sand storm are subtracted from the overall statistics, a comparison of exceedances (i.e. PSI more than 100) from 1995 to 2000 shows approximately 60 exceedances annually during the period, except for 70 recorded in 1997. Observing that the number of days with PSI more than 100 has remained more or less constant over the past six years, it can be concluded that the air quality improvement projects have been effectively implemented during the period. According to monthly statistics, the days with PSI more than 100 caused by particulate matter (PM10), one of the Criteria Air Pollutants (CAPs), are found mainly in the January–April period. Ozone (O3), another CAP, may result in 365 days with PSI more than 100, but its greatest impact on air quality is found mainly in the April–September period. Over the past few years, it has become increasingly clear that the occurrence of sandstorms in mainland China is a key factor influencing the island’s air quality. However, after excluding the sandstorm influence, the number of days with PSI more than 100 recorded by the Chung-Shan, Song-Shan and Wan-Hwa stations in 2000 showed a annual decline, while the remaining two stations showed a rise. The number of days with a recorded PSI more than 100 the Wan-Hwa station has been dropping annually by approximately 52 per cent since 1997. It is noteworthy that the number of days with PSI more than 100 recorded
127
by the Gu-Ting station has been increasing since 1998. Emission Inventory The emission inventory of air pollution in 1999 based on different air pollution sources in Taipei City is described below. Total suspended matter The emission of total suspended matter (TSP) totals 52,346 tonnes per year. Fugitive emissions account for 87 per cent of the total. Combustion emissions – of which the soot emitted from the food-and-drink industry takes a major share – accounts for approximately 5 per cent and road transportation emissions approximately 7 per cent. Particulate matter The emissions of particulate matter (PM10) total 15,209 tonnes per year. The fugitive particle emissions from non-combustion sources account for approximately 60 per cent, mostly fugitive dust emission caused by vehicles (56 per cent). Construction engineering accounts for 3 per cent, non-fuel combustion 17 per cent and road transportation 22 per cent (emissions from diesels accounting for 9 per cent, cars 7 per cent and motorcycles 6 per cent). Sulphur oxides The emissions of sulphur oxides (SOx) total 2,658 tonnes per year. Combustion emission accounts for approximately 62 per cent, mostly fuel combustion (44 per cent for commercial activities and 12 per cent for industries). Non-fuel combustion emissions account for some 3 per cent, and road transportation emissions 37 per cent (23 per cent from petroleum vehicles, , 8 per cent from diesels and 6 per cent from motorcycles). Nitrogen oxides (NOx) The NOx emissions total 22,023 tonnes per year. Road transportation accounts for 81 per cent (diesels 44 per cent; petroleum cars 34 per cent and motorcycles 3 per cent). As for non-road transportation emissions, aircraft account for some 10 per cent. Combustion emissions accounts for some 9 per cent, of which fuel combustion accounts for a major share (approximately 6 per cent). Non-methane hydrocarbon The emissions of non-methane hydrocarbons (NMHC) totals 72,769 tonnes per year. The fugitive hydrocarbon emissions of non-combustion sources accounts for approximately 55 per cent, (building construction - 22 per cent; commercial activities - 19 per cent; industrial coatings - 11 per cent, industrial solvents - 2 per cent and gas stations - 1 per cent). Road transportation accounts for 44 per cent of NMHC emissions (petroleum vehicles - 25 per cent, motorcycles - 16 per cent and diesels - 2 per cent). Carbon monoxide (CO) The emissions of CO totals 204,092 tonnes per year. Road transportation accounts for approximately 98 per cent of which emissions from petroleum vehicles are responsible for 74 per cent, motorcycles 21 per cent and diesels 3 per cent. Emissions from aircraft are responsible for approximately 1 per cent of the total.
128

AIR POLLUTION CONTROL STRATEGY In order to reinforce the promotion of the National Environmental Protection Project, the Bureau of Environmental Protection (EPB), Taipei Municipal Government, focuses on the characteristics of pollution in the city and the goal of reducing air pollutant emissions, and evaluates each enforcing instrument in order to draw up the ‘Policy of Restrain Air Pollution in Taipei Municipal’. As mentioned above, apart from a handful of point sources and fugitive sources, air pollution in the city mainly comes from mobile source. In order to control the mobile sources, the Bureau of Environmental Protection has been formulating progressively stricter standards of vehicle emissions. Compared with the policy of other countries, the standards of Taipei are regarded as relatively strict. However, the experience of other countries has shown that, in addition to controlling mobile source emissions, traffic management practices are an important aspect of the overall transportation strategy. Traffic management schemes can reduce traffic congestion, reduce engine idling time and cut down the driving mileage of the whole traffic fleet. Also, fuel consumption will be reduced so that total emissions to the atmosphere can be lessened. The EPB pollution control policy can be divided into four general areas, 16 strategies for controlling air pollution and 28 schemes of reduction: 1. Control mobile sources: Six strategies of control and 12 schemes of reduction 2. Control fugitive sources: One strategy of control and four schemes of reduction 3. Control point sources: Three strategies of control and six schemes of reduction 4. Integrative management project: Six control plans and promotion programme Mobile Source Control Strategies With support from the air pollution prevention and control fund, the Bureau of Transportation (BOT), Taipei City Government, has been continuously enforcing strategies to control mobile sources. In 1998, BOT implemented three projects, including the second phase of a demonstration project on natural gas buses of Taipei City, a system of displaying information on the conditions of buses for Taipei City – a project of reducing air pollution by enhancing bus service quality and furthering mass transportation development, and a demonstration project for reducing environmental pollution by replacing the traffic light controllers of Taipei City. In 1999, the BOT implemented two projects: one on the planning and arrangement of bicycle lanes and the other on the planning of a bicycle road network for Taipei City. Current proposals include the third phase of a demonstration project on natural gas buses in Taipei City, the preferential programme for transfer between Mass Rapid Transportation (MRT) System and buses, and a training programme for inspecting LPG vehicles. Measures for reducing air pollution from mobile source include the promotion of low-polluting vehicles, inspection and control, strategies of transport system control, and other important traffic construction plans as described below: 1. The promotion of liquefied petroleum gas (LPG) vehicles: LPG vehicles are
characterised by low pollution; helping to reduce emission of NOx, CO and HC as well as saving fuel expenses. In 1996, EPA promoted LPG vehicles by granting an allowance to LPG taxi drivers. Currently there are approximately 10,000 LPG taxis registered in Taipei City, with one of the three LPG stations located in An-Kang Rd. in Nei-Hu District and the other two in Bin-Jiang St. in Song-Shan District.
129
2. Introduction of natural gas buses: Since 1997, BOT has been implementing this project with the support of the air pollution prevention and control fee. Currently, there are already six in-service natural gas buses, with one natural gas filling station located in Gang-Chian Rd. in the Nei-Hu District. Thus far, NOx and HC emissions from buses have been significantly reduced. .
3. Reducing Pollution form Bus Exhaust fumes: “Squid cars”, the term used by Taiwanese for any vehicles spewing out considerable amounts of black smoke and other pollutants (as squids do when frightened in the ocean), have long been subject to complaints in downtown's. In order to solve this long-standing problem, the BOT, with the support of the air pollution prevention and control fund, had buses in Taipei City install smoke filters and catalytic converters.
4. Bus Lanes and Preference Lanes: Currently there are a total of seven bus lanes and one bus preference lane in Taipei City. Ever since implementing bus lanes, a number of positive effects have been found, such as higher bus speeds, more bus passengers, and less private transportation.
5. Transfer and Shuttle between MRT System and Buses: In order to encourage the use of public transport BOT, withr the support of the air-pollution fee, began implementing a preference programme for MRT – bus transfer was open for service. Since then, the number of MRT commuters has been increasing, while private transportation by commuters has declined. This has eventually achieved the goal of improving air quality. Following this successful example, the agency has continued to expand the transfer-based preference programme and shuttle bus services, with a view to further promoting the utilisation of mass transportation.
6. Chessboard-style and Mainline Bus System: In order to enhance the overall service quality of the bus system, to offer the public straightforward accessibility to the system, and reduce detours and bus stops within the system as a whole, we devised a “chessboard-style” bus network project. Thus far, we have moved into the second stage of the project: reviewing and adjusting current bus routes. Currently, BOT are proposing a total of ten new mainline bus routes while keeping up the pace of bus lane implementation, a synergistic effect that brings about a more prompt and convenient service.
7. Computer Signal System: As part of the concept of transportation system management, the computer signal system facilitates efficient traffic flow by regulating intersections via signal optimisation. It is expected that the system will enhance driving speed and reduce the frequency of stopping and waiting for buses, thus decreasing vehicles’ fuel consumption and bringing about a positive effect to municipal transportation as a whole. Thus far BOT? have completed in succession the changeable information signals, intersection controllers, vehicle detectors and closed-circuit television monitoring systems, all of which are connected to our traffic control centre.
8. Regional Traffic Control and Regional Passage Control: In order to avoid series traffic jam problems caused by large-sized vehicles, Taipei City has prohibited large trucks and tractor-trailers from certain routes and areas at certain times. The control regulation is implemented either on the basis of the whole day (07:00–22:00), or during morning and afternoon rush hours according to the characteristics of different sections of the routes. In addition, pedestrian-only lanes are implemented on partial sections of Shimen, and motorcycle-only lanes or motorcycle prohibition areas are implemented on special sections as well. Moreover, during the period of Chinese Tomb-sweeping Day and the blossom of Yang-Ming mountain, regional passage control, shuttle services, and instrumental control of freeway ramps are implemented. All of these have proven to be highly efficient measures for improving transportation management.
9. Small-to-Medium Bus Route Planning: “The Small-to-Medium Bus Route Planning” and “The Research Project of Air Pollution Reduction” were implemented this year
130

with the support of the air pollution prevention and control fee. These projects are carried out with a view to facilitating the shuttle services and remote suburb transport for the MRT system, so as to increase the popularity of the mass transportation system and thereby reduce the use of private vehicles.
10. Light Rail Transit (LRT) System: This is a project proposed in “A White Paper on Traffic Policy of Taipei City”, the LRT system is expected to alleviate the saturated transport load of bus lanes by co-ordinating with light rail cars. Powered by electricity, light rail cars are low-pollution transportation vehicles.
The EPB of Taipei Municipal Government has implemented a number of strategies to control mobile source emissions. These measures have included educating the public to undertake periodical maintenance and examination of their vehicles in order to ensure the vehicle complies with environmental protection regulations. The EPB is planning to undertake the following five major projects in 2001: 1. Project of diesel vehicles exhaust fumes examination: This project includes inspection
of the exhaust emissions of diesel vehicles, sampling and analysis of the diesel used, building a diesel vehicle database for the city so as to facilitate related inquiry and control, organising campaigns to promote strategies controlling diesel-fuelled car exhaust emission, and to encourage and guide diesel suppliers to apply for EPA’s replacement subsidy.
2. Electric Motorcycle Promotion Programme: At the end of October 2000, there were a total of 1,623 registered electric motorcycles, with 73 charge stations. Sixteen of the charge stations were located beside MRT stations. This programme includes planning and organization of promotion campaigns, printing promotion literature, having administrative agencies, enterprises, or communities set an example by using electric motorcycles on a trial basis, and conducting questionnaire surveys on these trial users and organizing seminars on trial experience in riding electric motorcycles as a reference for future implementation. In addition, this project will also include schemes for building charge stations, assessment of substitute solutions for charging, and planning a maintenance service system for electric motorcycles. All of these programmes are expected to enhance the convenience of using electric motorcycles and thereby promote their use with an ultimate goal of reducing pollutant emissions.
3. Project of Publicising Periodic Examination of Motorcycle Exhaust: Using various means this project will publicise the problems of motorcycle exhaust. For example, inspection tasks aimed at those motorcycles in public and private parks which are not regularly examined (a card publicising regular examination will be attached to these vehicles), reinforcing publicity of related regulations, and conductingexamination campaigns free-of-charge.
4. Auditing and assessment project of motorcycle exhaust periodic examining stations of Taipei city: This will involve assessment and inspection of the motorcycle exhaust examination and service centres authorised by Taipei municipal government. Including analysis of assessment results, and educational and training courses for the relevant personnel.
5. The control and investigation of air pollution from mobile sources: This will involve road-side inspection of motorcycles to check whether they have had the regular examinations as required by the authority, restricting those vehicles without regular examination and conducting exhaust emission inspections, carrying out recurrent examinations of vehicles reported to have emitted excessive exhaust gas until these vehicles pass related examination, and informing the owners of vehicles of examination deadline.
131
Below are the descriptions of the future strategies to control mobile sources in Taipei City:
Promotion of Low-Pollution Vehicles: Low-pollution vehicles include electric motorcycles, electric bicycles, LPG cars, CNG buses, and those automobiles powered by alternative fuels. We expect, by increasing the use of low-pollution vehicles, to reduce emissions of Criteria Air Pollutants (CAPs) such as NOx, NMHC and CO. Associated tasks will include providing subsidies for purchasing electric motorcycles and replacing their batteries, establishment of an extensive network of charging facilities for electric vehicles and launching campaigns to promote the use of other low-pollution vehicles (such as electric bicycles).
•
•
•
•
•
•
•
•
•
Survey on Pollution Characteristics: A survey of pollution characteristics, so as to facilitate formulating control countermeasures. Eligible CAPs will include TSP, SOx, NOx, NMHC and CO. We will carry out surveys on pollutants emitted by various types of mobile vehicles that are in use including a survey on the pollution characteristics of aircraft. Replacement of High-Pollution Vehicles: Enactment of stricter emission standards and provision of various subsidies (such as subsidies for replacing two-stroke motorcycles), with a view to reducing the number of highly-polluting, old vehicles that are in use. Eligible CAPs will include NOx, NHMC and CO. Promotion of Automobile Pollution Control Devices: We expect to achieve reductions in pollutant emissions by subsidising the upgrading of exhaust emission devices on diesels. Associated tasks will include programmes of reducing exhaust gas emission of diesels, with TSP as an eligible CAP. Reduction of Motorcycle Pollutant Emission: Establishment of a regular examination system for motorcycles through launching inspection, regulation and publicity campaigns. Eligible CAPs will include NMHC and CO. Associated tasks will involve launching extensive road-side clamp-downs on motorcycles and organizing campaigns to promote the examination system for motorcycles. Control strategy of Mobile Sources: Formulation of a medium-to-long term plan and control strategy which will serve as a guide for regulating mobile source emissions in the future. Eligible CAPs will include PM10, VOC, SOx, NOx and CO. Associated tasks will involve integration and renewal of mobile source parameters and emission inventories for Taipei City, review of changes in mobile sources and the effect of controls in Taipei City, and the formulation of a practicable solution to controlling mobile sources for Taipei City including traffic management, mass transportation planning, guidance, phasing out high pollution vehicles and an overall reduction of vehicle kilometres travelled.
Effects of Implementing the Reduction Strategy For the past few years, the EPB, Taipei Municipal Government has implemented the programme to improve air quality and has succeeded in continuously reducing polluting emissions. The major measures promoted to control air pollution include:
Controlling Mobile sources – includes the promotion of low emission vehicles, the enhancement of testing and the elimination of high contamination vehicles, and so on. Controlling Point sources – reinforces the inspection of businesses such as restaurants, automobile repair shops, laundries, gas stations, and industrial facilities located in the city, as well providing assistance in improving emission controls. Controlling Fugitive sources – controlling pollutant emissions from construction sites and associated measures such as street-sweeping.
132

With the air-pollution allowance subsidised by the Bureau of Transportation, Taipei Municipal Government, the EPB continuously enhances related control measures, such as the renovation of traffic signal controllers, the preferential programme for transfer between Mass Rapid Transportation (MRT) System and buses, and the demonstration project for natural gas buses of Taipei City. Up to the end of October, 2000, the number of vehicles re-equipped with LPG had reached 8997, and there were three gas filling stations: One was established on An-kang Road, Nei-hu District and the other two in Bin-jiang Street, Song-shan District. Also, the number of licenses issued for electric motorcycles was 1729 and there were 73 charge stations (with 392 sockets) of which 16 were installed beside the MRT stations. Also, there were 6 natural gas buses in service, and natural gas filling stations were established on Gang-chian Road, Nei-hu District. The effects of enforcing the reduction strategy are explained in Table 10.1: Table 10.1 Effects of enforcing the reduction strategy for pollutants TSP Reductions achieved mainly from point sources, the control
programme for construction sites, and the improvement of the emission test for diesel vehicles
PM10 Reductions achieved mainly from the examination and spot checks of new automobiles, but also from the emission testing of diesel vehicles and the phase out of diesel buses
SOx Reductions achieved mainly from the control of the sulphur contained in diesel fuel and partly from the control of point sources
NOx, NMHC, CO In addition to reductions from fixed sources, NOx, NMHC, and CO have also been reduced from mobile source. (e.g. by enacting stricter emission standards for exhausts). A secondary cause is the effect of exclusive lanes for buses and the chessboard-style road network of bus routes
Source: Taipei City Government Bureau of Environmental Protection PROSPECTS FOR THE FUTURE In addition to the continual strengthening of emission controls for various air pollutants, the air pollution control strategy in Taipei city will also be required to address the emissions of greenhouse gases (GHGs). The EPB will increase citizens awareness of climate change issues in order to reduce GHG emissions. Because mobile sources are the primary cause of air pollution in the city, the EPB will co-operate with the other city authorities concerned in order to increase the control of mobile sources and co-ordinate activities. Furthermore, due to advances in technology and lifestyle changes, the EPB is examining the most appropriate management and control measures. The aim of such actions is to maintain citizens’ health, enhance quality of life and protect the environment.
133

REFERENCES Bureau of Environmental Protection (2000) Coordination and Evaluating Programme of
Effect of the Improving Programme of Air Quality in Taipei Municipal, CTCI Corporation, Taipei Municipal Government, Taipei
Pei-chen Ni, Jen-te Bai, Pei-yun Chu, and Kuo-tung Liu (2000) ‘Air Pollutant Emission, Estimation of Coefficient of Fuel Efficiency, and Estimate of the Total of Contaminant Emission of Motor Vehicles in Metropolises’ presented at the Seminar on Estimation and Evaluation of Social Cost by Traffic Accidents and Violation of Traffic Regulation, Taipei
Yu-lin Chuang and Kuo-tung Liu (1999) ‘Case Study of Air Quality Deterioration in Northern Area’ presented at the 16th Seminar on Controlling Technology of Air pollution
Air Protection Department of the Environmental Protection Administration (1999) Notion of Control Point Source
134

11 AIR POLLUTION MANAGEMENT IN THAILAND Supat Wangwongwatana and Panya Warapetcharayut, Air Quality and Noise Management Division, Pollution Control Department, Ministry of Science, Technology and Environment, Bangkok, Thailand INTRODUCTION The first act for the control and conservation of national environmental quality in Thailand was the Enhancement and Conservation of National Environmental Quality Act of 1975 which established the Office of the National Environment Board (ONEB). The Act of 1975 and the ONEB were repealed and the Enhancement and Conservation of National Environmental Quality Act of 1992 was promulgated and published in the Royal Gazette on April 4, 1992. The Act became effective on June 4 of the same year. The Act of 1992 established three new offices under the Ministry of Science, Technology and Environment, namely the Office of Environmental Policy and Planning, the Pollution Control Department, and the Department of Environmental Quality Promotion. The present organisation chart of the Ministry of Science, Technology and Environment, the Department of Pollution Control, and the Air Quality and Noise Management Division. The Air Quality and Noise Management Division is responsible for carrying out duties of the Department of Pollution Control with respect to air pollution, noise and vibration management. These duties include monitoring of air quality and noise, establishment of ambient air quality standards and emission standards, development of strategies to prevent and mitigate air and noise pollution, and preparation of reports. Other acts that also contain provisions related to motor vehicle air pollution control include the Land Transport Act of 1992, the Motor Vehicle Act of 1979, the Traffic Act of 1992, the Announcement of the Revolutionary Party No. 16 of 1971, and the Liquid Fuel Act of 1978. The government agencies responsible for implementing these acts are the Land Transport Department, the Police Department, and the Department of Commercial Registration. This paper reviews the policies and measures taken to monitor and improve urban air quality in Thailand. THAILAND’S NATIONAL PRIMARY AMBIENT AIR QUALITY STANDARDS The 1981 primary ambient air quality standards (NPAAQS) were revised in 1995 under Section 32 of the Enhancement and Conservation of National Environmental Quality Act of 1992. The revised standards took into account the latest information on human health impact of key pollutants such as carbon monoxide (CO), nitrogen dioxide (NO2), sulphur dioxide (SO2), total suspended particulates (TSP), particulate matter (PM10) lead (Pb) and ozone (O3) within the constraints of specific environmental, socio-economic, and technological conditions that exist in Thailand (see Table 11.1).
135

Table 11.1 Thailand’s National Primary Ambient Air Quality Standard (NPAAQS) Air Pollutants
1-hour average
8-hour average
24-hour average
1-month average
1-year
average
CO (ppm) 30 9 --- --- --- NO2 (ppm) 0.17 --- --- --- --- SO2 (ppm) 0.3 --- 0.12 --- 0.04 TSP (mg/m3) --- --- 0.33 --- 0.1 PM10 (mg/m3) --- --- 0.12 --- 0.05 Pb (mg/m3) --- --- 0.01 0.0015 --- O3 (ppm) 0.1 --- --- --- ---
Source: PCD Thailand The current NPAAQS are more stringent than the standards of 1981 and are comparable to standards established in other nations and those recommended by relevant international organisations. The major changes in Thailand’s NPAAQS are the lower values for the CO standards, both 1-hr and 8-hr averages, and the additions of a 1-hr average SO2 standard, a 1-month average Pb standard, and 24-hr and annual average PM10 standards. The standards for NO2 and O3 are left unchanged. GOVERNMENT POLICY AND TARGETS ON AIR POLLUTION Analyses made by the World Bank indicates that if ambient concentrations of SPM and Pb in Bangkok are reduced by 20 per cent from current levels, the mid-point estimates of the annual health benefits from less sickness and lower mortality would be between US $1 billion and US $1.6 billion and between US $300 million and US $1.5 billion, respectively. Another study assigned various monetary values to the estimated health risks and estimated an economic benefit of US $10.7 million annually from carbon monoxide reduction in Bangkok. A high priority has been placed on improving air quality and the government has set general policy on air pollution to mitigate air pollution problems in non-attainment areas and to maintain air quality in attainment areas within ambient air quality standards In order to improve the air quality, definite targets have been established to control the ambient air concentrations of various air pollutants as follows: 1. Total Suspended Particulate Matter
Annual average < 0.1 mg/m3 by 1997 24-hour average < 0.8 mg/m3 by 1997
< 0.5 mg/m3 by 1999 < 0.3 mg/m3 by 2001
2. CO to meet both short-term and long-term standards by 1997 3. Other air pollutant levels to be maintained below standards
136

AMBIENT AIR QUALITY MONITORING NETWORK IN THAILAND Monitoring of ambient air quality in Thailand has been carried out since 1983 after the 1981 NPAAQS were promulgated and subsequently revised in 1995. The monitoring was carried mainly in Bangkok and its surrounding vicinity. Since then, the network has been improved, upgraded, and expanded from time to time to cover other areas of the country. The first air quality monitoring system installed in 1983 consisted of eight permanent stations located around Bangkok to continuously monitor ambient air quality in the city. The monitoring stations were located in residential, commercial, industrial and mixed areas. Although the system was operated continuously, it was not an on-line system. Collection, transfer, and analysis of data were performed manually and were therefore relatively labour intensive. The first on-line and real-time continuous air quality monitoring system in Thailand was installed in 1987 with the assistance from the Japan International Cooperation Agency (JICA). The system consisted of five automated air quality monitoring stations located in Samut Prakarn province, an industrial area southeast of Bangkok. Air quality data collected at each monitoring station were transmitted via dial-up telephone line to central processing computer for data storage and analysis. The third monitoring system, also an on-line and real-time continuous system, was installed 1991. It consisted of four monitoring stations located on the roadside of streets in Bangkok. Each station had a display board to instantly provide air quality data to the public whilst simultaneously transmitting data via a dedicated telephone line to a central processing computer for data storage and analysis. Short-term temporary roadside air quality monitoring was also undertaken every year on a regular basis in approximately 22 of the most congested streets in Bangkok for a period of two weeks in each street. Thailand’s Current Ambient Air Quality and Meteorological Monitoring Networks In 1992, the Pollution Control Department (PCD), with technical assistance from the Swedish Government, began preparing the design of a nation-wide ambient air quality monitoring network and a meteorological monitoring network. The networks were gradually installed over several phases through the upgrading of existing air quality monitoring stations and the installation of new ones, and were completed in 1996. The investments made in these two networks amount to approximately 400 million bahts. Ambient Air Quality Monitoring Network The ambient air quality monitoring network consists of 53 automated ambient air quality monitoring stations located throughout the country as shown in Table 11.2. Various ambient air pollutants are measured such as CO, NOx, SO2, O3, TSP, PM10, Pb, HC and H2S. Forty-five of them also have 10-metre or 30-metre meteorological masts measuring wind speed, wind direction, temperature, humidity, barometric pressure, solar radiation, and precipitation. The monitoring stations are operated automatically with remote control from the central computers located at the PCD in Bangkok. Automatic zero and span checks of gas analyzers in the stations are performed everyday and manual calibrations with standard gases of US
137

Environmental Protection Agency (USEPA) protocol grade are made every 15 days to ensure good data quality. Concentrations of air pollutants are measured, collected and analyzed on an hourly basis by a data acquisition system in each station and data are subsequently transmitted daily to the central data processing system at the PCD through a dial-up telemetric communication system. Table 11.2 Spatial Distribution of Air Quality Monitoring Stations and 100-metre Tall Meteorological Masts
Region
Province
Number of air
Quality Monitoring Stations
Number of
100-metre Met. Masts
Central Region (34 stations)
Bangkok Samut Prakarn Patum Thani Nonthaburi Nakorn Pathom Ayudthaya Saraburi Ratchaburi Samut Sakorn
18 5 1 2 1 1 2 1 2
1
Northern Region (7 stations)
Chiangmai Lampang Nakorn Sawan
2 4 1
1
Northeastern Region (2 stations)
Khon Kaen Nakorn Rachsima
1 1
1
Eastern Region (7 stations)
Chonburi Rayong
3 4
1
Southern Region (3 stations)
Surat Thani Phuket Songkhla
1 1 1
1
Total
2
5
Source: PCD Thailand With respect to the data transmission system, there are five regional node computers. Regional node computers are located in Bangkok for the central region, Chiangmai for the northern region, Khon Kaen for the north-eastern region, Chonburi for the eastern region and Song Khla for the southern region. Regional node computers telephone the monitoring stations located in their respective regions on a daily basis to retrieve air quality and meteorological data collected at the stations. The central node computer, serving not only as a regional node computer but also the central processing computer, telephones the other four regional node computers daily to retrieve data which are stored in the database for further processing and reporting.
138

In addition, the PCD also has five mobile ambient air quality monitoring units for emergency response to air pollution episodes and other special air pollution studies. Monitoring of PM2.5 The PCD is in the process of establishing ambient air quality standards for particulate matter less than 2.5 microns (PM2.5). Background information is being collected for the consideration of standard levels. Planning for the ambient air monitoring of PM2.5 is also being undertaken. One PM2.5 was purchased last year and another one this year to initiate the ambient air monitoring of PM2.5. Meteorological Monitoring Network In addition to 10-metre meteorological masts at most of the air quality monitoring stations, the PCD also has a dedicated meteorological monitoring network consisting of five 100-metre meteorological masts located in Bangkok for the central region, Chiang Mai for the northern region, Khon Kaen for the north-eastern region, Rayong for the eastern region, and Song Khla for the southern region and one Radio Acoustic Sounding System (RASS) for monitoring upper-air meteorological condition, as shown in Table 11.3. Meteorological parameters are measured at different heights on each 100-metre meteorological mast as indicated in Table 11.3. Wind speed, 3-dimensional wind directions, temperature, and relative humidity are measured at 3 different heights, namely 10, 50 and 100 metre. Solar radiation, net radiation, barometric pressure, and precipitation are measured at a height of 2 metre above the ground. Table 11.3 Parameters measured on a 100-metre meteorological mast at different heights
Height Above Ground
(m)
Parametres Measured
2 Solar radiation, Net radiation, Barometric pressure, and Precipitation
10 Wind speed, 3-dimensional wind direction, Temperature, and Relative humidity
50 Wind speed, 3-dimensional wind direction, Temperature, and Relative humidity
100 Wind speed, 3-dimensional wind direction, Temperature, and Relative humidity
Source: PCD Thailand Bangkok’s Air Quality Monitoring Programme Monitoring of ambient air quality in Bangkok is carried out in both general background areas and roadside areas as follows. General Ambient Air Quality Monitoring Continuous ambient air monitoring stations are placed in residential, commercial, industrial and mixed areas of Bangkok. Monitoring locations are carefully selected to ensure that monitoring stations are not directly influenced by any particular major sources so that the
139

quality of the general ambient air in Bangkok is monitored and impacts to general population can then be evaluated. The number of monitoring stations varies from time to time. Originally, there were 6 continuous monitoring stations installed in 1983. The air pollutants being measured were only limited to CO, TSP, and Pb. They were subsequently renovated and upgraded and a few new stations also installed in October of 1996 bringing the total number of stations for general ambient air quality monitoring in Bangkok to 10 stations. Every station monitors CO, TSP, PM10, Pb, SO2, NOx, and O3. Hydrocarbons (HC) are also monitored in some monitoring stations. The new stations are also equipped with 10-metre meteorological masts measuring wind speed, wind direction, temperature, humidity, and solar radiation. Roadside Street-Level Ambient Air Quality Monitoring Since there are a lot of Thai people living and working in “shophouses” which are in close proximity to the street, it is also necessary to monitor the quality of air at street level where these people are exposed. Roadside ambient air quality monitoring in Bangkok is carried out in two different ways as follows: a) Long-term Continuous Roadside Ambient Air Quality Monitoring In 1991, four permanent on-line and real-time continuous roadside ambient air quality monitoring stations were operated in Bangkok in the areas experiencing traffic congestion. Each station also has its own electronic display board to continuously display instantaneous concentrations of CO, PM10, and noise levels to the public. Simultaneously, data is transmitted via a dedicated telephone line and is logged into a central processing computer at the Department of Pollution. In October of 1996, the Department of Pollution Control installed three new on-line roadside ambient air quality monitoring stations continuously measuring CO, TSP, PM10, Pb, SO2, NOx, O3 and HC. These new stations are also equipped with 10-metre meteorological masts measuring wind speed and direction, temperature, humidity and solar radiation. b) Short-term Temporary Roadside Ambient Air Quality Monitoring In addition to permanent roadside monitoring stations, temporary monitoring of CO, TSP and Pb is carried out regularly every year at the roadsides of approximately 15 of the most congested streets in Bangkok for a period of 2 to 4 consecutive weeks at each street. Data are collected manually every day. Air Quality and Noise Information System The PCD distributes information about environmental issues in general through different means and media including the Internet to suit different categories of users. There is no restriction, the Internet is also used as a gateway to disseminate information to the public. General information on environmental and pollution issues in Thailand including air pollution can be found from the homepage of the PCD under the Internet address http://www.pcd.go.th. The Air Quality and Noise Management Division of the PCD has been developing an Internet-based Air Quality and Noise Information System (AQNIS) dedicated to the dissemination of information related to air quality and noise management in Thailand including a daily air quality update. This system is used to present and distribute information to the general public, the mass-media, and also to decision-makers. When connected to the
140

Internet, the user is able to receive information about ambient air quality, air emissions, noise, regulations and standards related to air and noise pollution, special reports, and so forth. The Internet address of this system is http://www.aqnis.pcd.go.th. The Internet-based AQNIS allows the user to select different kinds of information organised in a strict hierarchy. The user can find the information in different folders covering the following main areas:
General Information about PCD’s organisation, e-mail addresses; • • • • •
News and Events about ongoing activities related to PCD work; Forecasts and Reports about studies, projects; Air Quality information from the nation-wide air quality monitoring network; and Noise and Vibration information from monitoring activities and reports.
The Internet-based AQNIS undergoes continuous development. Currently, the Air Quality information is the most developed part. The user can choose to view ambient air quality data from the different regions, in near real time, by clicking on the map or list boxes. Meteorological information is also available. Most of the information is presented as graphs, but advanced users are also able to download basic data for further analysis. In the future, more complex decision-making information will be distributed with the aid of this system. This system will allow the media and the general public to obtain the same information as decision-makers. CURRENT AMBIENT AIR QUALITY IN BANGKOK AND TRENDS Results of ambient air quality monitoring for more than 10 years indicate that the air pollutants of greatest concern in Bangkok are SPM, especially PM10 and CO. They are mostly emitted by the transport sector. The World Bank's ‘Economic Report on Urban Environmental Problems in Thailand in 1993’ estimated transport sector emissions of these two air pollutants in 1991 to be 76 and 1,065 thousand tons per year, respectively. The report also concluded that air pollution in Bangkok, due to high concentrations of SPM, is among the highest priority problems. Table 11.4 and Table 11.5 summarise ambient air quality in Bangkok in 1998 in the general background areas and at roadside sites, respectively. As indicated, the principal concern is along the major roads in Bangkok where pollutant concentrations and frequency of exceedances of the ambient air quality standards for TSP, PM10, and CO are high enough to result in significant adverse health impacts on the local population.
141

Table 11.4 Ambient air quality in the general areas of Bangkok in 2000
Concentrations Pollutants Range 95
percentile Average Standard Frequency of
Exceeding Standard
TSP (24-hr), mg/m3 0.02 - 0.33 0.19 0.09 0.33 0/351 (0%) PM-10 (24-hr), µg/m3
18.6 – 169.4 102.7 56.1 120 37/1,725 (2.1%)
CO (1-hr), ppm 0.0 – 12.50 2.6 0.96 30 0/70,186 (0%) CO (8-hr), ppm 0.0 – 8.20 2.31 0.97 9 0/71,609 (0%) O3 (1-hr), ppb 0.0 - 203 54 15.6 100 161/54,415 (0.3%) NO2 (1-hr), ppb 0.0 - 136 22.8 22.8 170 0/67,094 (0%) SO2 (1-hr), ppb 0.0 - 161 20 6.7 300 0/72,750 (0%) Pb (1-month), µg/m3 0.02 - 0.33 0.21 0.09 1.5 0/93 (0%)
Source: PCD Thailand Table 11.5 Ambient air quality at the roadside sites in Bangkok in 2000
Concentrations Pollutants Range 95
percentileAverage Standard Frequency of
Exceeding Standard
TSP (24-hr), mg/m3 0.05 – 0.48 0.35 0.19 0.33 25/424 (5.9%) PM10 (24-hr), µg/m3 27.0 – 244.4 146.6 82.6 120 206/1,613 (12.8%) CO (1-hr), ppm 0.0 – 18.5 5.6 2.20 30 0/41,879 (0%) CO (8-hr), ppm 0.0 – 13.13 5.17 2.19 9 34/42,452 (0.1%) O3 (1-hr), ppb 0 - 136 31.0 7.6 100 5/23,615 (0.02%) NO2 (1-hr), ppb 0 - 169 81.0 35.4 170 0/22,962 (0%) SO2 (1-hr), ppb 0 - 12 24.0 9.2 300 0/22,988 (0%) Pb (1-month), µg/m3 0.03- 0.24 0.16 0.09 1.5 0/62 (0%) Source: PCD Thailand Total Suspended Particulate Matter (TSP) Current levels of ambient TSP in Bangkok's air, especially along the streets which have very congested traffic producing start-stops cycles of vehicles with very low speed, far exceed Thailand's primary ambient air quality standard for TSP. In 2000, 24-hour average concentrations of roadside ambient TSP in Bangkok exceeded the standard of 0.33 mg/m3 at some of monitoring sites with the maximum concentration of 0.48 mg/m3. There were 211 out of 751 observations or approximately 28 per cent of 24-hour average concentrations of roadside ambient TSP exceeded the standard. The annual mean concentration of TSP was 0.19 mg/m3 which also exceeded the standard of 0.1 mg/m3. It was reported that by weight, 40 per cent of TSP in Bangkok is from diesel vehicles, 40 per cent is from road dust and the remaining 20 per cent is from sea salt particles and from industries. Figure 11.1 shows the trend of roadside ambient concentrations of TSP in Bangkok from 1988 to 2000. It is clear that Bangkok has been experiencing high concentrations of TSP exceeding the standards every year for more than 10 years. TSP levels declined slightly during 1993 and 1994 which is probably due to the construction of the second-stage expressway system, which was completed in 1992. There were fewer numbers of construction projects in Bangkok during 1993–1994. TSP levels rose again in 1995 which is probably due
142
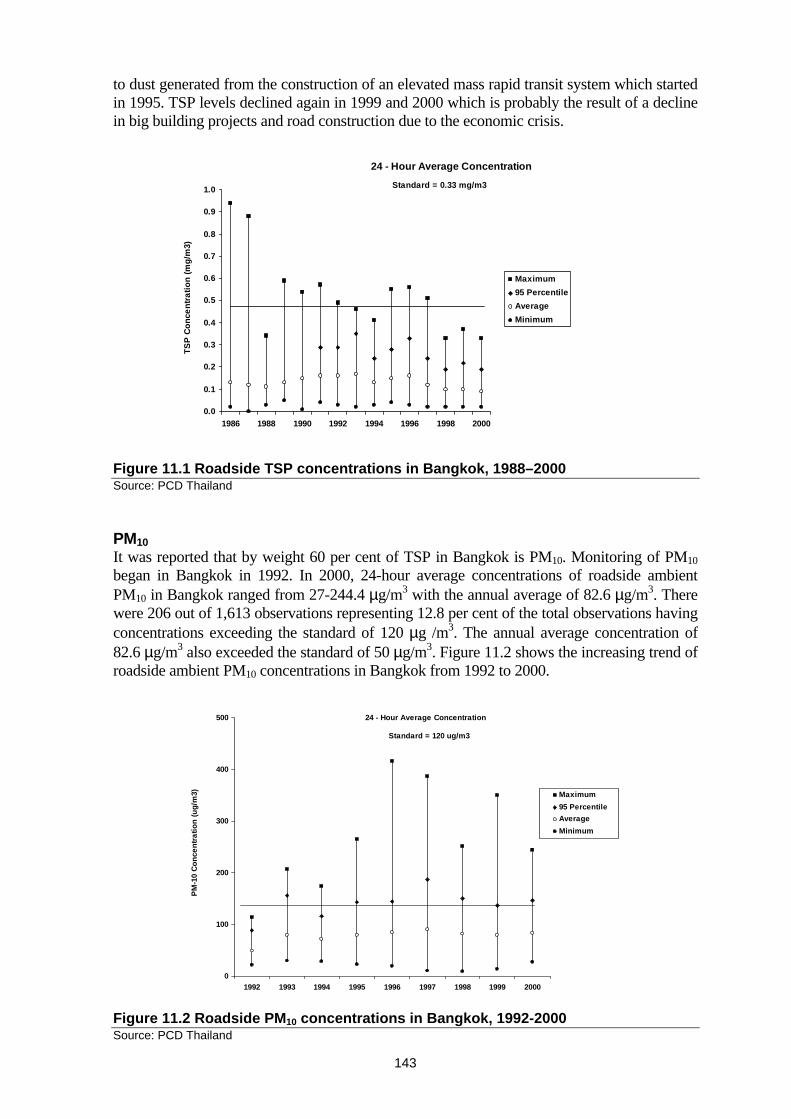
to dust generated from the construction of an elevated mass rapid transit system which started in 1995. TSP levels declined again in 1999 and 2000 which is probably the result of a decline in big building projects and road construction due to the economic crisis.
0.0
0.1
0.2
0.3
0.4
0.5
0.6
0.7
0.8
0.9
1.0
1986 1988 1990 1992 1994 1996 1998 2000
TSP
Con
cent
ratio
n (m
g/m
3)
Maximum95 PercentileAverageMinimum
24 - Hour Average Concentration
Standard = 0.33 mg/m3
Figure 11.1 Roadside TSP concentrations in Bangkok, 1988–2000 Source: PCD Thailand PM10 It was reported that by weight 60 per cent of TSP in Bangkok is PM10. Monitoring of PM10 began in Bangkok in 1992. In 2000, 24-hour average concentrations of roadside ambient PM10 in Bangkok ranged from 27-244.4 µg/m3 with the annual average of 82.6 µg/m3. There were 206 out of 1,613 observations representing 12.8 per cent of the total observations having concentrations exceeding the standard of 120 µg /m3. The annual average concentration of 82.6 µg/m3 also exceeded the standard of 50 µg/m3. Figure 11.2 shows the increasing trend of roadside ambient PM10 concentrations in Bangkok from 1992 to 2000.
0
100
200
300
400
500
1992 1993 1994 1995 1996 1997 1998 1999 2000
PM-1
0 Co
ncen
tratio
n (u
g/m
3) Maximum95 PercentileAverageMinimum
24 - Hour Average Concentration
Standard = 120 ug/m3
Figure 11.2 Roadside PM10 concentrations in Bangkok, 1992-2000 Source: PCD Thailand
143

Carbon Monoxide Maximum 1-hour and 8-hour average concentrations of roadside ambient CO recorded in Bangkok in 2000 were 18.5 and 13.13 ppm of which only the 8-hour average exceeded the corresponding standard of 9 ppm. There were 34 out of 42,452 observations or 0.1 per cent of 8-hour average concentrations of roadside ambient CO exceeding the standard. This reflects the effect of traffic congestion in Bangkok which does not only occur during the morning and evening rush hours but also extends throughout most of the day. Although vehicle population in Bangkok has increased by an average of 300,000 vehicles per year since 1990, roadside ambient CO concentrations in Bangkok, both 1-hour and 8-hour average concentrations, have been observed to be decreasing since 1993 as shown in Figure 11.3 and Figure 11.4. This coincides with the enforcement of emission standards for new light duty gasoline vehicles in 1992 which require vehicles to have catalytic converters in order to reduce emissions to meet the standards. Additionally, gasoline quality was also improved to give an oxygen content of between 1-2 per cent by weight thus allowing more complete combustion of gasoline, especially in the existing vehicle fleet.
0
10
20
30
40
50
1993 1994 1995 1996 1997 1998 1999 2000
CO Concentration (ppm)
Maximum 95 Percentile Average Minimum
1 - Hour Average Concentration
Standard = 30 ppm Figure 11.3 Roadside CO-1 Hr. concentrations in Bangkok, 1993–2000 Source: PCD Thailand
0
5
10
15
20
25
30
1992 1993 1994 1995 1996 1997 1998 1999 2000
CO
Con
cent
ratio
n (p
pm)
Maximum95 PercentileAverageMinimum
8 - Hour Average Concentration
Standard = 9 ppm
Figure 11.4 Roadside CO- 8 hr. concentrations in Bangkok, 1992-2000 Source: PCD Thailand
144

Lead Figure 11.5 shows the trend of roadside ambient lead concentrations in Bangkok from 1986 to 2000. High concentrations of roadside ambient lead were observed prior to 1992 but started declining progressively since then as a result of the aggressive lead phase-out program introduced in 1990. The current roadside ambient lead concentrations are much lower than the WHO’s recommended guideline. The maximum monthly average concentration of roadside ambient lead observed in 2000 was only 0.24 µg/m3 which is only one-seventh of Thailand’s standard of 1.5 µg/m3. The annual average concentration was reported to be 0.09 µg/m3.
0
0.5
1
1.5
2
2.5
3
1986 1987 1988 1989 1990 1991 1992 1993 1994 1995 1996 1997 1998 1999 2000
Pb C
once
ntra
tion
(ug/
m3)
Maximum95 PercentileAverageMinimum
Monthly Average Standard = 1.5 ug/m3
Premium ULG was introduced in May 1991
Regular ULG was introduced in September 1993
Figure 11.5 Roadside Pb concentrations in Bangkok Source: PCD Thailand Other Air Pollutants It was observed in 2000 that there were 161 out of 54,415 observations (or 0.3 per cent) of hourly ambient O3 concentrations exceeding the ambient air quality standards of 100 ppb, mostly in the areas downwind from the centre of Bangkok. This indicates that Bangkok may start to experience photochemical smog problem which require more studies and analyses in detail to gain a better understanding of the situation and the associated photochemical reactions. In 2000, no violation of standard of SO2 and NO2 concentrations was observed both in the general areas and at the roadside areas of Bangkok. MOBILE SOURCE EMISSION INVENTORY FOR BANGKOK A mobile source emission inventory for Bangkok was developed for the first time in 1994. In 1997, the inventory had been improved to encompass the area for Bangkok Metropolitan Region (BMR), which includes the five surrounding provinces (Nakhonpathom, Nonthaburi, Pathumthani, Samutprakarn and Samutsakorn). The emission factors for pollutants in grams per kilometre with vehicles driven at different speeds for given vehicle types and characteristics were calculated by using the USEPA MOBILE 5 emission factor model. The model was customised to the conditions in BMR by taking into account local factors such as
145
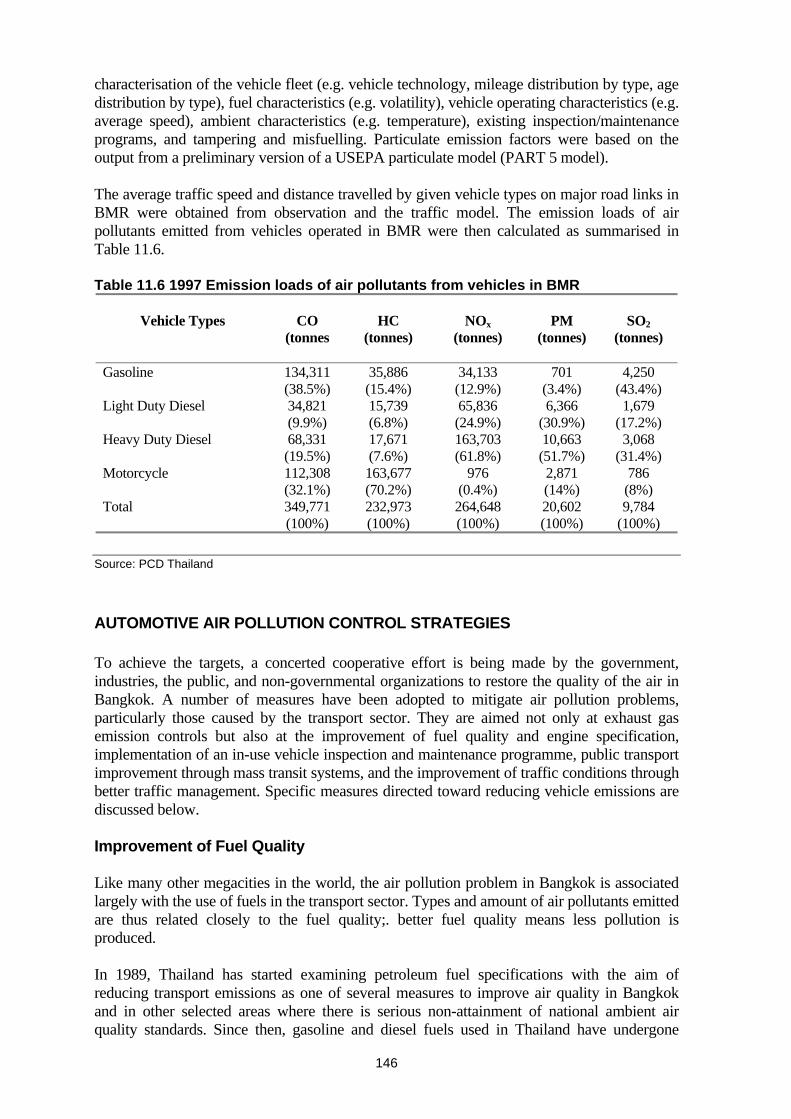
characterisation of the vehicle fleet (e.g. vehicle technology, mileage distribution by type, age distribution by type), fuel characteristics (e.g. volatility), vehicle operating characteristics (e.g. average speed), ambient characteristics (e.g. temperature), existing inspection/maintenance programs, and tampering and misfuelling. Particulate emission factors were based on the output from a preliminary version of a USEPA particulate model (PART 5 model). The average traffic speed and distance travelled by given vehicle types on major road links in BMR were obtained from observation and the traffic model. The emission loads of air pollutants emitted from vehicles operated in BMR were then calculated as summarised in Table 11.6. Table 11.6 1997 Emission loads of air pollutants from vehicles in BMR
Vehicle Types
CO
(tonnes
HC
(tonnes)
NOx
(tonnes)
PM
(tonnes)
SO2
(tonnes)
Gasoline 134,311 (38.5%)
35,886 (15.4%)
34,133 (12.9%)
701 (3.4%)
4,250 (43.4%)
Light Duty Diesel 34,821 (9.9%)
15,739 (6.8%)
65,836 (24.9%)
6,366 (30.9%)
1,679 (17.2%)
Heavy Duty Diesel 68,331 (19.5%)
17,671 (7.6%)
163,703 (61.8%)
10,663 (51.7%)
3,068 (31.4%)
Motorcycle 112,308 (32.1%)
163,677 (70.2%)
976 (0.4%)
2,871 (14%)
786 (8%)
Total
349,771 (100%)
232,973 (100%)
264,648 (100%)
20,602 (100%)
9,784 (100%)
Source: PCD Thailand
AUTOMOTIVE AIR POLLUTION CONTROL STRATEGIES To achieve the targets, a concerted cooperative effort is being made by the government, industries, the public, and non-governmental organizations to restore the quality of the air in Bangkok. A number of measures have been adopted to mitigate air pollution problems, particularly those caused by the transport sector. They are aimed not only at exhaust gas emission controls but also at the improvement of fuel quality and engine specification, implementation of an in-use vehicle inspection and maintenance programme, public transport improvement through mass transit systems, and the improvement of traffic conditions through better traffic management. Specific measures directed toward reducing vehicle emissions are discussed below. Improvement of Fuel Quality Like many other megacities in the world, the air pollution problem in Bangkok is associated largely with the use of fuels in the transport sector. Types and amount of air pollutants emitted are thus related closely to the fuel quality;. better fuel quality means less pollution is produced. In 1989, Thailand has started examining petroleum fuel specifications with the aim of reducing transport emissions as one of several measures to improve air quality in Bangkok and in other selected areas where there is serious non-attainment of national ambient air quality standards. Since then, gasoline and diesel fuels used in Thailand have undergone
146

reformulation several times which has resulted in significant improvements in air quality in Bangkok, especially for lead. Further improvements in fuel quality for both gasoline and diesel are under consideration, i.e. increasing cetane number, decreasing density, decreasing polyaromatic hydrocarbon content, and further reduction of 90 per cent volume distilled temperature of diesel; and increasing oxygenated compounds content, flexible benzene and aromatics contents, and decreasing vapour pressure of gasoline. Automotive gasoline reformulation The major emissions of concern from gasoline fuelled vehicles are Pb, CO, unburned hydrocarbon, benzene, and other aromatic emissions which have carcinogenic effects in humans. Gasoline compositional changes which can have a major impact on emissions of these pollutants include the complete phasing out of lead, increasing the volatility, specifying a minimum combined oxygen content, and reduced aromatic content including benzene. Such fuel modifications can, if carefully introduced, substantially improve the environmental impacts of gasoline. Lead content Lead in gasoline has been gradual reduced, as indicated in Table 11.7, both to reduce lead emissions and to facilitate the use of pollution control technologies such as catalytic converters. Methyl Tertiary Butyl Ether (MTBE) is normally used to boost the octane rating of gasoline instead of lead. Leaded gasoline has been no longer available in Thailand since January 1, 1996. In order to promote the use of unleaded gasoline, it has been made to less expensive than leaded gasoline. Since lead in the urban air practically all comes from combustion of leaded gasoline in vehicles, the phasing out of lead in gasoline has substantially reduced emissions of lead in to the air. Consequently, ambient lead concentrations in the congested streets and in general areas of Bangkok have been observed to be on the decline since 1992 coinciding with the phasing out of lead from the gasoline. Table 11.7 Phase-out of leaded gasoline in Thailand
Year
Phase-out of leaded gasoline
Before 1984 0.84 grams of Pb/litre 1984 0.45 grams of Pb/litre 1990 0.40 grams of Pb/litre 1991 Introducing unleaded premium gasoline 1992 0.15 grams of Pb/litre in leaded gasoline 1993 Introducing unleaded regular gasoline 1994 Complete phase-out of regular leaded gasoline January 1, 1996 Complete phase-out of premium leaded gasoline
Source: PCD Thailand Oxygen content Although catalytic converters will dramatically reduce both carbon monoxide and hydrocarbon emissions from new gasoline fuelled vehicles after 1993, there are still a very large fleet of in-use uncontrolled vehicles (more than 1 million uncontrolled passenger
147

gasoline vehicles and more than 1 million motorcycles) on the roads in Bangkok and this situation will persist over the next 10-15 years or so. These vehicles, having no exhaust after-treatment, not designed to meet any emission standards, operating with fairly rich air/fuel ratio (mainly at idle or very low speeds as is typical in Bangkok), produce exceptionally high CO emissions and to a lesser extent unburned hydrocarbons. Primarily to reduce emissions from these in-use uncontrolled vehicles, oxygenated compounds such as MTBE and ethanol of not less than 5.5 per cent but not more than 10 per cent by volume has been incorporated into the premium gasoline since 1993 to achieve combined oxygen level of between 1 per cent and 2 per cent by weight. Combined oxygen has the effect of leaning the air/fuel ratio of the engine and thus lowers the emissions of CO and unburned hydrocarbon without making any mechanical adjustment. Carbon monoxide has been observed to be on the decline since 1993 in the congested streets and general areas of Bangkok. To some extent, the decline is probably, due to oxygenated compounds incorporate into the premium gasoline. The effect of oxygenated compounds on the ambient hydrocarbon levels has not been investigated. Benzene/aromatics contents The aromatics, including benzene, content of gasoline directly affects the amount of toxic emissions in the exhaust gases, although the emissions will be lower from a catalyst-equipped car. The concern is mostly with benzene which is known to have carcinogenic effects in humans and is found in exhaust gases not only directly from benzene in the gasoline but also from the thermal dealkylation of higher aromatics such as toluene and xylene in the combustion process. In order to reduce the exhaust emissions of toxic compounds, benzene and aromatics contents in both regular and premium gasoline have been limited to the levels as shown in 11. 8. Table 11.8 Benzene and aromatics contents in gasoline in Thailand
Substance
Level
Target Date
Benzene not more than 5 per cent by volume July 1, 1991 not more than 3.5 per cent by volume January 1, 1992 Aromatics not more than 50 per cent by volume January 1, 1994 not more than 35 per cent by volume January 1, 2000
Source: PCD Thailand Automotive diesel reformulation The major emissions of concern from diesel vehicles are suspended particulate matter (including PM10), black smoke, unburned hydrocarbon, nitrogen oxides, and sulphur oxides. The extent and nature of black smoke generated in diesel engines is determined dominantly by engine design and operating factors as well as fuel characteristics. The principal air pollution problem in Bangkok is particulate matter., Changes in diesel characteristics which can have a major impact on emissions of particulate matter include reducing the maximum allowable 90 per cent volume distilled temperature and the maximum allowable sulphur content.
148
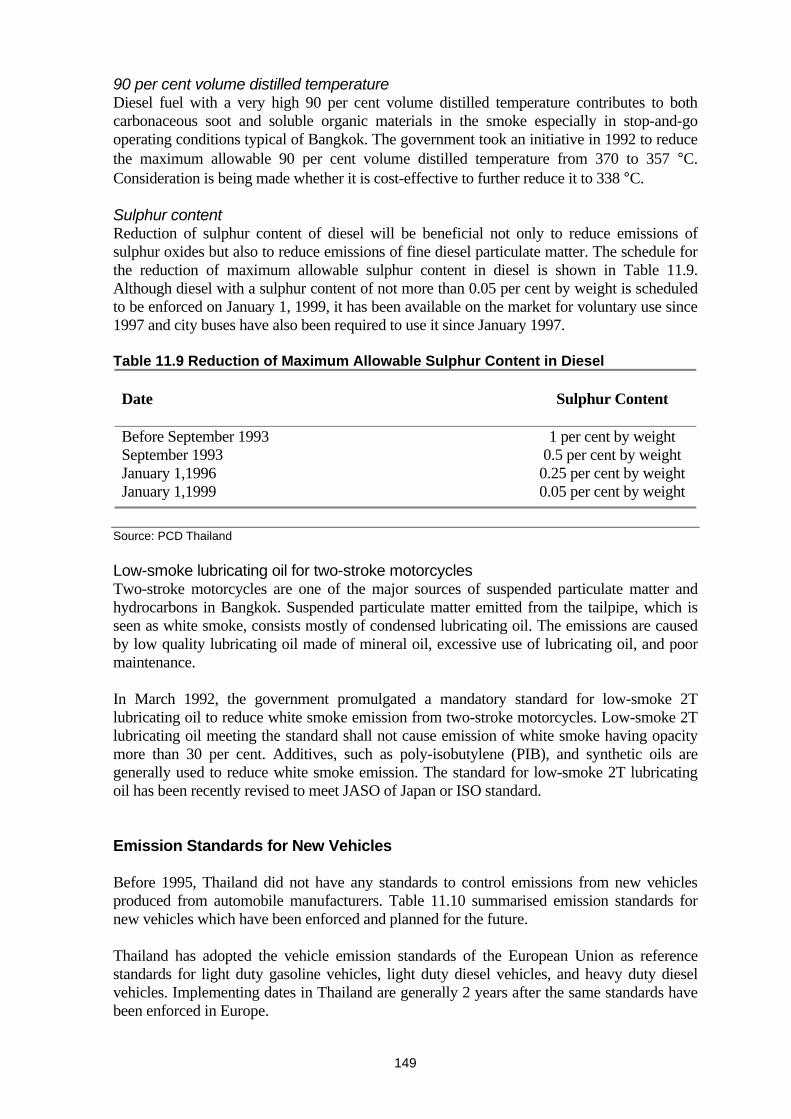
90 per cent volume distilled temperature Diesel fuel with a very high 90 per cent volume distilled temperature contributes to both carbonaceous soot and soluble organic materials in the smoke especially in stop-and-go operating conditions typical of Bangkok. The government took an initiative in 1992 to reduce the maximum allowable 90 per cent volume distilled temperature from 370 to 357 °C. Consideration is being made whether it is cost-effective to further reduce it to 338 °C. Sulphur content Reduction of sulphur content of diesel will be beneficial not only to reduce emissions of sulphur oxides but also to reduce emissions of fine diesel particulate matter. The schedule for the reduction of maximum allowable sulphur content in diesel is shown in Table 11.9. Although diesel with a sulphur content of not more than 0.05 per cent by weight is scheduled to be enforced on January 1, 1999, it has been available on the market for voluntary use since 1997 and city buses have also been required to use it since January 1997. Table 11.9 Reduction of Maximum Allowable Sulphur Content in Diesel
Date
Sulphur Content
Before September 1993 1 per cent by weight September 1993 0.5 per cent by weight January 1,1996 0.25 per cent by weightJanuary 1,1999 0.05 per cent by weight
Source: PCD Thailand Low-smoke lubricating oil for two-stroke motorcycles Two-stroke motorcycles are one of the major sources of suspended particulate matter and hydrocarbons in Bangkok. Suspended particulate matter emitted from the tailpipe, which is seen as white smoke, consists mostly of condensed lubricating oil. The emissions are caused by low quality lubricating oil made of mineral oil, excessive use of lubricating oil, and poor maintenance. In March 1992, the government promulgated a mandatory standard for low-smoke 2T lubricating oil to reduce white smoke emission from two-stroke motorcycles. Low-smoke 2T lubricating oil meeting the standard shall not cause emission of white smoke having opacity more than 30 per cent. Additives, such as poly-isobutylene (PIB), and synthetic oils are generally used to reduce white smoke emission. The standard for low-smoke 2T lubricating oil has been recently revised to meet JASO of Japan or ISO standard. Emission Standards for New Vehicles Before 1995, Thailand did not have any standards to control emissions from new vehicles produced from automobile manufacturers. Table 11.10 summarised emission standards for new vehicles which have been enforced and planned for the future. Thailand has adopted the vehicle emission standards of the European Union as reference standards for light duty gasoline vehicles, light duty diesel vehicles, and heavy duty diesel vehicles. Implementing dates in Thailand are generally 2 years after the same standards have been enforced in Europe.
149

European emission standards for motorcycles are too lenient for adoption Thailand. This is because there are a lot more motorcycles in Thailand, especially in Bangkok, and most of the motorcycles in Europe are mopeds having engine sizes of 50 cc or less. Motorcycles in Thailand are generally larger than 90 cc in engine sizes. Therefore, the second and third stage motorcycle emission standards of Taiwan, which are the most stringent standards in the world, have been adopted for Thailand’s fourth and fifth level standards, respectively. Table 11.10 Emission standards for new vehicles
Type of Vehicles
Level
Reference Standards
Implementing Date
Light Duty Gasoline 1 ECE R 15-04 ------- Vehicles 2 ECE R83-B 30 March 1995 3 ECE R83-01(B) 24 March 1996 4 93/59/EEC 1 January 1997 5 94/12/EC 1 January 1999 6 96/69/EC 25 August 2001 7 1999/102/EC (A) Under Discussion 8 1999/102/EC (B) Under Discussion Light Duty Diesel 1 ECE R 83-C 29 January 1995 Vehicles 2 ECE R 83-01(C) 23 February 1996 3 93/59/EEC 1 January 1997 4 94/12/EC
1 January 1999 30 September 2001 for DI Diesel
5 96/69/EC 25 August 2001 6 1999/102/EC (A) Under Discussion 7 1999/102/EC (B) Under Discussion Heavy Duty Diesel 1 ECE R 49-01 -------- Vehicles 2 EURO I 12 May 1998 3 EURO II 23 May 2000 Motorcycles 1 ECE R 40-00 10 August 1993 2 ECE R 40-01 15 March 1995 3 - CO < 13 g/km
- HC < 5 g/km 1 July 1997
4 - CO < 4.5 g/km - HC+NOx < 3 g/km - White Smoke <15 per cent - Evaporative 2 g/test for sizes => 150 cc up
30 July 2001
5 - CO < 3.5 g/km HC+NOx < 2 g/km
- White Smoke <15 per cent - Evaporative 2 g/test
1 July 2003 for sizes < 110 cc 1 July 2004 for all sizes
Source: PCD Thailand Emission Standards for In-use Vehicles Emission standards for in-use vehicles are used mainly as reference standards for the inspection and maintenance program which includes periodical inspection and roadside inspection. The standards were revised to be more stringent taking into account emission standards for new vehicles and were promulgated at the beginning of 1998 as shown in Table 11. 11.
150

Table 11.11 Emission Standards for In-use Vehicles Pollutants Type of Vehicles Standards Measuring
Device Test Procedure
Black Smoke
Diesel vehicle 50 per cent 45 per cent 40 per cent 35 per cent
Filter Opacity Filter
Opacity
Snap Acceleration Test Snap Acceleration Test Full Load Test Full Load Test
Gasoline vehicle registered from November 1, 1993
1.5 per cent NDIR Idle Test
CO Gasoline vehicle registered before November 1, 1993
4.5 per cent NDIR Idle Test
Motorcycle, Three Wheelers 4.5 per cent NDIR Idle Test Gasoline vehicle registered
from November 1, 1993 200 ppm NDIR Idle Test
HC Gasoline vehicle registered before November 1, 1993
600 ppm NDIR Idle Test
Motorcycle, Three Wheelers 10,000 ppm NDIR Idle Test
White Smoke Motorcycle 30 per cent Smoke meter; full-flow opacity system
Quick acceleration the engine to ¾ of maximum power rpm.
Noise Diesel vehicle Measuring at the max. power rpm
Gasoline vehicle Measuring at ¾ of max. horse power rpm.
Motorcycle, Three Wheelers 100 dBA
Sound Level metre as
standard of IEC
Measuring at ½ of max. power rpm., if engine has max. rpm. Over 5,000 rpm Measuring at ¾ of max. power rpm., if engine has max. rpm. Less than 5,000 rpm
Source: PCD Thailand Inspection and Maintenance Programme Vehicles registered under Land Transport Act, such as buses and trucks, are required to pass emission inspection annually prior to the annual renewal of the license. The inspection is carried out by the Land Transport Department or the local Land Transport Office. Vehicles registered under Motor Vehicles Act, such as passenger cars, taxis, and motorcycles, have been subject to emission inspection since 1995. The inspection programs for these vehicles are as follows, Taxis Since 1995, taxis have been subject to emission inspection every six months and the inspection is carried out by the Land Transport Department or the local Land Transport Office. Motorcycles Starting from 1995, motorcycles 7 years old and older were subject to emission inspection annually at the time of the renewal of the license. The age was reduced to 5 years in 1997. The inspection is carried out by authorized private inspection centres or garages. Ultimately, motorcycles will be subject to emission inspection for the first time at the age of 3 years.
151

Private Passenger Vehicles Starting from 1995, private passenger vehicles 10 years old and older were subject to emission inspection annually at the time of the renewal of the license. The age was reduced to 7 years in 1997. The inspection is carried out by authorized private inspection centres or garages. Ultimately, private passenger vehicles will be subject to emission inspection for the first time at the age of 3 years. In order to pass the inspection, emissions of in-use vehicles must meet the emission standards for in-use vehicles specified in Table 11.8. The current decentralised inspection and maintenance program for in-use vehicles is being criticised for its effectiveness since authorized private inspection centres or garages are also allowed to do repairs. The program will be evaluated in the near future and will be improved as necessary to increase its effectiveness. Roadside Inspection Roadside inspection for smoky vehicles in Bangkok is carried out every day by four agencies, i.e. Police Department, Land Transport Department, Department of Pollution Control, and Bangkok Metropolitan Administration. Drivers of vehicles violating emission standards for in-use vehicles will be fined and use of the vehicles on the street will not be allowed until they are repaired and pass the re-inspection. Currently, there are up to 30 to 40 inspecting teams carrying out roadside inspections every day. Traffic Management and VKT Reduction The Office of the Commission for the Management of Land Traffic under the Prime Minister Office is doing everything possible to reduce traffic congestion in order to increase traffic speed in Bangkok and reduce vehicle kilometres travelled (VKT). Some of the measures implemented are as follows: •
• • • • • • • • •
Two mass rapid transit systems, i.e. an elevated skytrain system and a subway system, are under construction. The elevated skytrain system started operations at the end of 1999 and the subway system will be operational at the end of 2002. Public bus system reform. Increasing road network and expressway. Automatic Computerized Traffic Light Management System. Parking restriction on major streets. Flexible working hours. Strict enforcement of traffic regulation. Bus lane. Reversible lane. Limited access roads.
Restricting the use of private vehicles during rush hours based on the license plate number is being discussed. Use of vehicles will not be allowed during rush hours on the date having the same last digit as the license plate numbers of the vehicles. For example, if the last digit of the license plate number is 1, the vehicle will not be allowed to be used on the first, the eleventh, the twenty first, and thirty first of every month. This means that traffic volume will be reduced by 10 per cent and use of each vehicle will not be allowed on only 3 to 4 days a month compared to 15 days if odd and even numbers are used.
152

Gasoline Vapour Recovery System Stage I and Stage II gasoline vapour recovery systems will be required in the gasoline distribution system to control hydrocarbon evaporative emissions according to the following schedule,: a) Stage I at Bulk Terminals, Tank Trucks, and Service Stations •
•
•
•
•
Effective immediately for new facilities in Bangkok, Nonthaburi, Pratum Thani, and Samut Prakarn. Effective on July 1, 2001 for existing facilities located in Bangkok, Nonthaburi, Pratum Thani, and Samut Prakarn, however due to the current economic crisis, it is supposed to be implemented on January 1, 2000. Volatile organic compound emissions of Stage I at bulk terminals must not be more than 17 mg/m3 of vapor vented which is equivalent to 10 mg/liter of gasoline loaded. Implementation in other provinces will be considered in the future.
b) Stage II at Service Stations
Effective immediately for new and existing service stations located on the side of the streets having a width of between 8 and 12 metres or located in Bangkok, Nonthaburi, Pratum Thani, and Samut Prakarn. Implementation in other service stations and in other provinces will be considered in the future.
Other Measures
• Alternative fuel vehicles, such as natural gas buses, LPG tuk tuks, and electric vehicles.
• Public awareness campaigns. • Training of technicians working in vehicle repair garages. • Tax penalties and incentives for promoting the use of cleaner vehicles and
cleaner fuels, such as excise tax on two-stroke motorcycles but not on four- stroke motorcycles.
• Controlling the use of used engines, i.e. any vehicles newly built with used engines must meet relevant new vehicle emission standards and re-powered vehicles with used engines must meet relevant in-use vehicle emission standards.
• Intensive inspection and maintenance program for public buses.
153

AIR POLLUTION CONTROL STRATEGIES FOR STATIONARY SOURCES The previous (Seventh, 1992-1996), and the current (Eighth, 1997-2001) Five-year National Economic and Social Plans have moved towards sustainable economic growth and promoted development while enhancing the quality of the environment and natural resource base in accordance with the new Constitution promulgated in 1997. Air pollution control strategies for stationary sources include: Environmental Impact Assessment Major activities of certain categories and sizes (Table 12.12) are required by the Enhancement and Conservation of National Environmental Quality Act of 1992 to prepare and submit an environmental impact assessment (EIA) report with their permit applications. A permit will be given only if it is demonstrated that the proposed source will not cause any adverse impact to the environment, including air quality, and if measures for the prevention of, and remedy for, adverse effects on the environmental quality are proposed. Emission Standards All new and existing sources are required to be in compliance with emission standards of the Ministry of Industry under the Factory Act (Table 11.13) and of the Ministry of Science, Technology and Environment under the Enhancement and Conservation of National Environmental Quality Act (Tables 11.14 – 16). Fuel Oil Standard Sulphur content in fuel oil has been reduced since the middle of 1994, especially in Bangkok and Samut Prakarn, which is a heavily industrialized area located to the east of Bangkok, as shown in Table 11.18. Prior to 1994, sulphur content in fuel oil was more than 3 per cent by weight. At present, fuel oil number 1 and 2 which are mostly used by industries have sulphur content of not more than 2 per cent by weight. Monitoring Requirement Section 80 of the Enhancement and Conservation of National Environmental Quality Act requires the owner or possessor of the point source of pollution to have facilities for the treatment of polluted air, equipment or instruments for the control of discharges of air pollutants, to collect statistics and data showing the daily functioning of the facility or equipment and instruments, and make detailed notes to be kept as recorded evidence on-site.
154

Table 11.12 Types and Sizes of Projects or Activities Requiring Environmental Impact Assessment (EIA) Reports
Items
Major Source Categories
Sizes
1 Dam or reservoir Storage volume of 100 million cubic metres or more or storage surface area of 15 square kilometres or more
2 Irrigation Irrigated area of 80,000 raise (12,800 hectares) or more
3 Commercial airport All sizes 4 Hotel or resort 80 rooms or more 5 Mass transit system and expressway as defined by
the Mass Transit System and Expressway Act, or projects similar to expressway or rail type mass transit system
All sizes
6 Mining as defined by the Mineral Act All sizes 7 Industrial estate as defined by the Industrial Estate
Authority of Thailand Act or project similar to industrial estate
All sizes
8 Commercial port and harbour With capacity for vessels of 500 tonne-gross or more
9 Thermal power plant Capacity of 10 MW or more 10 Industries
(1) Petrochemical industry Using raw materials which are produced from oil refinery and/or natural gas separation with production capacity of 100 tonnes/day or more
(2) Oil refinery All sizes (3) Natural gas separation or processing All sizes (4) Chlor-alkaline industry requiring NaCl as raw
material for production of Na2CO3, NaOH, HCl, Cl2, NaOCl and bleaching powder
Production capacity of each or combined products of 100 tonnes/day or more
(5) Iron and/or steel industry Production capacity of 100 tonnes/day or more (production capacity calculated by using production capacity of furnace in ton/hour multiplied by 24 hours
(6) Cement industry All sizes (7) Smelting industry other than iron and
steel Production capacity of 50 tonnes/day or more
(8) Pulp industry Production capacity of 50 tonnes/day or more 11 All projects in watershed area classified as 1B by
the Cabinet Resolution All sizes
12 Coastal reclamation All sizes 13 Building in areas adjacent to rivers, coastal areas,
lakes or beaches or in the vicinity of national parks or historical parks
Building (1) 23 metres in height or more (2) Total area of all floors or area of any floor in the same building is 10,000 square metres or more
14 Residential building as defined by the Building Act 80 units or more 15 Land appropriation (or housing development) Number of land plots is 500 plots or more
Total land area is more than 100 rais (16 hectares)
16 Hospitals which are located: (1) in areas adjacent to rivers, coastal areas, lakes or beaches (2) in other areas
(1) 30 beds or more (2) 60 beds or more
17 Pesticide industry or industry producing active ingredient by chemical process
All sizes
18 Chemical fertilizer industry using chemical process in production
All sizes
155

Table 11.12 Types and Sizes of Projects or Activities Requiring Environmental Impact Assessment (EIA) Reports (continued) Items Major Source Categories Sizes
19 Highway or road as defined by Highway Act passing through following area: (1) Wildlife sanctuaries and wildlife non- hunting area as defined by Wildlife Conservation and Protection Act (2) National parks as defined by National Park Act (3) Watershed class 2 as approved by the Cabinet (4) Mangrove forests designated as National Forest Preserves (5) Coastal area within 50 metres of maximum sea level
All projects which are equivalent to or above the minimum standard of rural highway, including roadbed expansion
20 Central waste treatment plants as defined by the Factory Act
All sizes
21 Sugar industry (1) Production of raw sugar, refined sugar, pure refinery sugar (2) Production of glucose, dextrose, fructose or other similar products
All sizes Production capacity of 20 tonnes/day or more
22 Petroleum development (1) Survey and/or petroleum production (2) Petroleum and oil transportation system by pipe
All sizes All sizes
Source: PCD Thailand Table 11.13 Industrial Emission Standards Under the Factory Act (Reference Condition: 25 Degree Celsius at 1 atm and 20 per cent Excess Air) No. Substances Sources Standard Values
1 Particulates Boiler & Furnace - Heavy oil as fuel - Coal as fuel - Other fuels Steel/Aluminium Manufacturing Other source
300 mg/m3 400 mg/m3 400 mg/m3 300 mg/m3 400 mg/m3
2 Antimony Any source 20 mg/m3 3 Arsenic Any source 20 mg/m3 4 Copper Furnace or Smelter 30 mg/m3 5 Lead Any source 30 mg/m3 6 Chlorine Any source 30 mg/m3 7 Hydrogen Chloride Any source 200 mg/m3 8 Mercury Any source 3 mg/m3 9 Carbon Monoxide Any source 1,000 mg/m3 or 870 ppm 10 Sulphuric Acid Any source 100 mg/m3 or 25 ppm 11 Hydrogen Sulphide Any source 140 mg/m3 or 100 ppm 12 Sulphur Dioxide Sulphuric acid production 1,300 mg/m3 or 500 ppm 13 Oxides of Nitrogen Boiler
- Coal as fuel - Other fuels
940 mg/m3 or 500 ppm 470 mg/m3 or 250 ppm
14 Xylene Any source 870 mg/m3 or 200 ppm 15 Cresol Any source 22 mg/m3 or 5 ppm 16 Sulphur Dioxide Combustion process using oil as fuel in Bangkok
and Samut Prakarn 1,250 ppm
Source: PCD Thailand
156

Table 11.14 Emission Standards Under the Enhancement and Conservation of National Environmental Quality Act for Thermal Power Plant Constructed After January 1995 (25 Degree Celsius at 1 atm and 50 per cent Excess Air)
Pollutants Standard Values Coal/Solid Fuel Oil/Liquid Fuel Gaseous Fuel
Sulphur Dioxide (ppm) > 500 MW 300 - 500 MW < 300 MW
320 450 640
320 450 640
20 20 20
Oxides of Nitrogen as NO2 (ppm) 350 180 120 Particulate Matter (mg/m3) 120 120 60 Source: PCD Thailand Table 11.15 Emission Standards Under the Enhancement and Conservation of National Environmental Quality Act for Stone or Gravel Quarrying Plant (25 Degree Celsius at 1 atm) Control Standard Values Measurement
Technology Opacity ( per cent)
Concentration (mg/m3)
Without Local Exhaust System
20 --- At a distance of 1 meter from the edge of any emitting source in the process
With Local Exhaust System
20 400 At the stack
Source: PCD Thailand Table 11.16 Emission Standards Under the Enhancement and Conservation of National Environmental Quality Act for Municipal Waste Incinerator (25 Degree Celsius at 1 atm and 50 per cent Excess Air)
Pollutants Incinerator Capacity > 50 ton/day 1 - 50 ton/day
Particulate Matter (mg/m3) 120 400 Sulphur Dioxide (ppm) 30 30 Oxides of Nitrogen as NO2 (ppm) 180 250 Opacity ( per cent) 10 20 Hydrochloric Acid (ppm) 25 136 Dioxin as Total Chlorinated PCDD plus PCDF (ng/m3)
30 30
Source: PCD Thailand
157

Table 11.17 Sulphur content (per cent by Weight) in fuel oil
Effective
Effected
Fuel Oil No.
Date Areas 1 2 3 4 5 July 1, Bangkok & Samut Prakarn 2.0 2.0 2.0 2.0 0.5 1994 Other Areas 2.5 3.0 3.2 3.2 2.5
January 1, Bangkok & Samut Prakarn 2.0 2.0 2.0 2.0 0.5 1998 Other Areas 2.0 2.0 3.0 3.0 2.5
Source: PCD Thailand It is also required that a report summarising the functioning results of the facility, equipment or instruments shall be submitted to the local official of the locality where the point source is situated at least once per month. The report is subsequently submitted to the pollution control official who has jurisdiction over that locality on a regular basis at least once per month. Methodologies for monitoring of emissions are recommended as follows: •
•
For largest/most environmentally significant sources (EIA is required) Continuous Emission Monitoring System (CEMs).Predictive Emission Monitoring System (PEMs) - Prediction of emissions by developing correlation between emissions and process data. For remaining air pollution control equipment sources
- Operation monitoring of air pollution control equipment. The Pollution Control Department is currently developing an automatic computerized internet-base reporting system to receive telemetrically transmitted emission monitoring reports from emission sources as shown in Figure 11.6. The system will also have the capability to telemetrically access on-line the monitoring systems at the emission sources.
158

PCD EMISSION REPORT INFORMATION SYSTEM
PLANT
CEM CEM
Data Logger
CEMCEM
PLANT PLANT
Data Logger
Emission Data
Data Logger Data Logger
Emission Data Emission Data Emission Data
Computer Computer Computer Computer
MONTHLY ELECTRONIC REPORT
NECTEC (Internet) PCD
PCD
COMPUTER
Monthly Emission Report Database
Figure 11.6 Automatic computerized internet-base emission reporting system Source: PCD Thailand
159

12 LEARNING FROM URBAN AIR POLLUTION MANAGEMENT IN EUROPE
Gary Haq, Stockholm Environment Institute, York, United Kingdom INTRODUCTION Air pollution in Europe was once viewed as a necessary consequence of economic development: a price that had to be paid for increased prosperity and industrialisation. However, significant progress in reducing emissions of atmospheric pollutants within the European Union over the past thirty years has demonstrated that this does not have to be the case (CEC, 2001). This reduction in pollutant emissions has been achieved by the introduction of emissions standards and measures aimed mainly at the energy, industry and transport sectors as well as changes in the economy. These changes have dramatically improved air quality in European cities and this has been heralded as one of the great success stories of effective environmental policy. Although air quality in large European urban conurbations has improved, approximately 40 million people residing in 115 large European cities still experience exceedence of the World Health Organisation‘s (WHO) air quality guidelines for at least one pollutant every year (EEA, 1998). Improvements in urban air quality are now being threatened by vehicle emissions caused by growth in the transport sector (EC, 1999). The aim of this paper is to examine the progress that has been made in addressing the problem of urban air pollution in Europe. It highlights the future challenges in achieving good air quality in European cities and reviews the policies and practice taken by the European Union (EU) and its Member States. The paper focuses on measures being taken to reduce pollutant emissions from motor vehicles as road transport is considered to pose the greatest threat to urban air quality. The paper concludes by identifying the key principles that could be adapted to megacities elsewhere which are experiencing similar urban air quality problems. It highlights the experience of Curitiba (Brazil) and Bogotá (Colombia) as cities which are adapting such measures and developing new pioneering policies to address the causes of poor air quality. The United Kingdom (UK) was one of the first countries in Europe to undergo an industrial revolution and experience poor air quality due to the burning of coal. In response to poor air quality the UK has developed pioneering air quality legislation. It is therefore appropriate for this paper to review in detail past and present experience of urban air quality management in the UK in the context of the EU. FROM PEA-SOUPERS TO PHOTOCHEMICAL SMOGS The industrial revolution in Europe resulted in the harnessing of steam to provide power to pump water and move machinery. Throughout the 19th century high levels of urban air pollution were frequently experienced throughout the cities of Europe. The main source of pollution was black smoke and sulphur dioxide from the burning of coal used by industry and in homes for domestic heating. Industries were often located in towns and cities and
160

the combination of industrial emissions and emissions from domestic heating resulted in smoke and winter fogs which became the obvious signs of atmospheric pollution. In addition, the emission of acids, dust and a miscellaneous collection of obnoxious smells were also experienced which were not only unpleasant but also posed a danger to human health (Clapp, 1994). Fogs were often experienced in the autumn and winter months. During these periods pollution levels increased and the mixture of smoke and fog resulted in what is nowadays referred to as ‘smog’. During periods of stable weather and temperature inversions, smoke particles from industrial plumes would mix with fog giving it a yellow-black colour. Smog was frequently experienced in cities for a considerable number of days. Wind speeds would be low thus causing the smog to stagnate, with pollution levels increasing near ground level (Encyclopaedia of Atmospheric Environment, 2001). Smog episodes often brought cities to a halt, disrupting traffic and causing death rates to rise dramatically. The effects of this pollution on buildings and vegetation also became obvious. Urban air pollution episodes have caused serious health impacts in Europe and North America over the last 150 years (see Table 12.1).
Table 12.1 Excess deaths associated with air pollution incidents Date Place Excess deaths December 1873 London, UK 270-700 December 1892 London,UK 1000 December 1930 Meuse Valley, Belgium 63 December 1952 London, UK 4000 November 1953 New York, USA 250 December 1962 London, UK 340-700 January-February 1963 New York City, USA 200-405 November 1966 New York City, USA 168 Source: Elsom (1992) The 1930 Meuse Valley (Belgium) smog episode lasted for three days and resulted in an extra 63 deaths. The city of London in England was infamous for its smogs, which were often referred to as ‘pea-soupers’ due to poor visibility. The 1952 Great London Smog lasted for five days and led to approximately 4,000 more deaths than usual. The deaths were attributed to the dramatic increase in air pollution during the period, with levels of sulphur dioxide increasing seven-fold, and levels of smoke increasing three-fold. The peak in the number of deaths coincided with the peak in both smoke and sulphur dioxide pollution levels (Elsom, 1992). Figure 12.1 illustrates the number of deaths and the rising concentrations of sulphur dioxide and smoke. During the period 1950-1980 almost every country in Europe experienced serious air pollution in their large urban conurbations. This led to these countries enacting their first national air pollution control legislation (Boubel et al., 1994). For example, the West Germany government adopted the 1959 Federal Air Purity Act (Luftreinhaltegesetz) which was a response to the poor air quality experienced in the Land of North Rhine-Westphalia (NRW) in Germany’s industrial heartland. The Act introduced ambient air quality standards (Boehmer-Christansen and Skea, 1991). In the Netherlands the 1970 Air Pollution Act prohibited pollution that could cause nuisance or damage human health, animals, plants, and goods.
161

Figure 12.1 Death related to sulphur dioxide and smoke concentrations in the 1952 London Smog Source: Wilkins (1954) In the UK the Great London Smog led to the introduction of the first Clean Air Act in 1956. The Act aimed at controlling domestic sources of smoke pollution by introducing smokeless zones. However, the effectiveness of the Act has been questioned as it simply reinforced the move to less smokey fuels that was already taking place at the time. In addition, the Act has been criticised for its inability to cover anything but smoke emissions (Brimblecombe and Maynard, 2001). Despite this criticism, within ten years of the Act being adopted smoke emissions from industry were reduced by 74 per cent with those from domestic sources becoming the main polluter (Clapp, 1994). The introduction of cleaner coals led to a reduction in sulphur dioxide pollution and the move to the use of natural gas reduced domestic emissions. During the past three decades many European countries have experienced summer and winter photochemical smogs caused by the reaction between emissions from motor vehicles and sunlight. Athens (Greece) has experienced severe photochemical smog episodes due to traffic emissions, high temperatures and ozone formation in the Athens basin. In 1991 air quality exceeded health-based standards for 180 days. The smog is believed to claim at least six lives a day in Greater Athens. However, it is difficult to distinguish between deaths due to smog and the high temperatures that are experienced at the same time (Elsom, 1996). On 12-15 December, 1991 London experienced the most severe nitrogen dioxide pollution episode since regular monitoring began in 1971. One hour levels of nitrogen dioxide peaked at 809 µg/m3, greatly exceeding the 1987 WHO air quality guideline of 400 µg/m3. Levels of benzene increased by six to seven times its typical value. The 1991 London smog episode was claimed to have caused 160 extra deaths (Elsom, 1996).
The greatest threat posed to urban air quality today in many large European cities is from road transport. This is a problem that is being experienced not only in the larger urban conurbations of Europe but by cities throughout the World.
162

THE REDUCTION OF URBAN AIR POLLUTANTS IN EUROPE Many activities are undertaken in urban areas which result in polluting air emissions. The principal source of urban air pollution is the combustion of fossil fuels in domestic heating, power generation, industrial processes, the incineration of solid waste and in motor vehicles. The most typical urban pollutants are sulphur dioxide (SO2), nitrogen oxides (NOx), non-methane volatile organic compounds (NMVOCs), carbon monoxide (CO), ozone (O3), particulate matter (PM) and lead (Pb) all of which have important implications for human health. EU Member States have made considerable progress in reducing the emissions of air pollutants for all key sectors. However, despite these achievements, further reductions are required in order to ensure non-exceedence of urban air quality standards. The progress made in reducing three main groups of pollutants (acidifying substances, ozone precursors and particulate matter) are discussed below. Acidifying Substances The atmospheric emissions of acidifying substances such as SO2, NOx and ammonia (NH3) contribute to acidification and eutrophication which can result in damage to soil, aquatic and terrestrial ecosystems, buildings and materials and human health. Figure 12.2 shows that the agriculture and energy sectors are each responsible for 29 per cent of emissions of acidifying substances in EU Member States. Emissions of acidifying gases were reduced by 32 per cent between 1990 and 1998 in the EU (EEA, 2001). This has been due mainly to a reduction in SO2 emissions resulting from a switch to cleaner energy sources (e.g. from coal and heavy fuel oil to natural gas), the use of low-sulphur coal, coal washing technologies and the introduction of combustion technologies such as flue-bed combustion, and emission control devices such as flue gas desulphurisation (EEA, 2000).
Figure 12.2 Emissions of acidifying substances in the EU Member States by sector, 1998 Source: EEA (2001)
163

Ozone Precursors The level of photo-chemical pollutants or ozone (O3) precursors such as NOx, NMVOCs and CO remain high in most European cities (EEA, 1998). These pollutants together with methane (CH4) contribute to the formation of ground level (tropospheric) ozone. Exposure to high O3 concentrations can result in adverse health effects and damage to crops and natural vegetation. The total emissions of ozone precursors are falling in most EU Member States. Between 1990 and 1998 the emission of ozone precursors fell by 22 per cent in the EU as a whole (EEA, 2001). Transport is the greatest emitter of ozone precursors and was responsible for 48 per cent of emissions in 1998 (see Figure 12.3). The greatest reduction in emissions of ozone precursors has been in the transport sector due to the introduction of catalytic converters on new cars. Reductions in the energy and industry sectors have been due to improved pollution abatement. For example, VOC emissions from solvent use and manufacturing processes have been reduced via best practice, substitution by water-based production and pollutant abatement technology. However, this reduction from pollution abatement has been offset by the growth in road traffic (EEA, 2001). The reduction in emissions of ozone precursors has resulted in lower peak concentrations of tropospheric ozone. Estimates suggest that, in 1999, 42 per cent of the EU population was exposed to concentrations above the threshold value for the protection of human health (110 µg/m3) between 1 and 25 days and 12 per cent on more than 50 days in all EU countries except northern European countries and Portugal. The. exceedence days are days with an eight hour average ozone concentration of more than the threshold value (EEA, 2001).
Figure 12.3 Emissions of ozone precursors in EU Member States by sector, 1998 Source: EEA (2001)
164

Particulate Matter The inhalation of fine particulate matter can have adverse health effects. The direct emissions of particulate matter with a diameter less than 10 µm (primary PM10) and emissions of particulate precursors (NOx, SO2 and NH3), which are partly transformed into secondary PM10 by chemical reactions in the atmosphere, fell in the EU by 29 per cent between 1990 and 1998 (EEA, 2001). Energy, road transport and industry are the sectors responsible for the highest emissions of PM10 at 27 per cent (see Figure 12.4). It is these same sectors that have contributed the most to the reduction in particulate emissions due to fuel switching and abatement in the energy and industry sectors and the introduction of the catalytic converter in cars. Improved vehicle engine technologies and the further introduction of abatement technology and low-sulphur fuels such as natural gas in power station fuel combustion will further reduce the emissions of primary and secondary PM10. Despite this reduction, concentrations of PM10 are expected to remain above limit values in urban areas (EEA, 2001). EC Directive 1999/30/EC sets limit values for NOx, SO2, Pb and PM10 in ambient air and came into force in July 1999 (CEC, 1999). The Directive sets a limit value for PM10 of 50 µg/m3 (24 hour average) not to be exceeded more that 35 times a year. In the past, PM10 was measured as part of ambient concentrations of suspended matter as laid down in Directive 80/779/EEC, which was based on WHO guidelines. Because monitoring of PM10 in the EU only began recently, it is difficult to determine the progress being made in its reduction. However, an EEA report concludes that a large fraction of the urban population in Europe is exposed to levels of fine particulate matter in excess of threshold values for the protection of human health (EEA, 2001).
Figure 12.4 Emissions of particulate matter in EU Member States by sector, 1998 Source: EEA (2001)
165

Table 12.2 provides an overall assessment of air pollution in Europe based on EU air pollution indicators and the progress being made in achieving standards. Although there has been progress in reducing emissions of atmospheric pollutants from a number of sectors, substantial parts of the population in Europe are exposed to high concentrations of ground level ozone and fine particulate matter. Table 12.2 Progress made in meeting EU air pollution targets, 2001
Air Pollution Indicator
Assessment
Description
Emissions of ozone precursors
National emissions of ozone precursors have fallen by 22 per cent since 1990, mainly due to the introduction of catalysts on new cars. However, EU emission targets for VOCs and NOx have not been reached, and substantial reductions of NMVOCs and NOx are still required to achieve 2010 targets as set out in the Gothenburg Multi-pollutant and Multi-effect Protocol.
Limit value exceedence days for ozone
Ozone levels in Europe are exceeding the threshold set for protection of human health. Year- to-year fluctuations and changes in monitoring preclude firm conclusions on trends in population exposure; analysis of monitoring data suggests that peak ozone concentrations are decreasing, but median values are tending to increase.
Emissions of particulate matter
No emission targets have been set for fine particles. Reductions in emissions of particle precursors SO2, NOx and primary PM10 from energy industries and road transport have made a significant contribution - a 29 per cent reduction of total PM10 emissions between 1990 and 1998.
Limit value exceedence days for particulate matter
A large fraction of the urban population is exposed to levels of particulate matter in excess of threshold values for the protection of human health.
Emissions of acidifying substances
☺
The 32 per cent reduction in EU emissions of acidifying gases between 1990 and 1998 is due mainly to a reduction in SO2 resulting from a switch from coal and heavy fuel oil to natural gas, and abatement measures such as flue-gas desulphurisation in power plants.
Area with exceedence of critical loads
Increases in the percentage of ecosystems exposed to nitrogen deposition in excess of critical loads since 1990 in several countries have reversed the decreasing trend in the area exposed to acidification and increased the area exposed to eutrophication.
☺ Positive trend, moving towards target. Some positive development, but either insufficient to reach target or mixed trends with the
indicator. Unfavourable trends.
166

CHALLENGES FOR LOCAL AIR QUALITY MANAGEMENT IN LARGE EUROPEAN CONURBATIONS Under the second EU Auto-Oil Programme1 (AOPII) forecasts of air quality in Europe based on current and future air quality objectives suggest that over the period 1995-2020 the EU will achieve large reductions for all pollutants of between approximately 40 and 50 per cent. Smaller reductions of approximately 30 per cent are expected for PM10 and greater reductions of approximately 60 per cent for benzene. These significant reductions will be achieved mainly in the energy and road transport sectors. Emissions from road transport are projected to fall by approximately 70-80 per cent and will result in conventional emissions from road transport taking up a smaller share of total emissions (EC, 2000). Tables 12.4-12.11 summarise the air quality modelling results for ten European cities considered in the AOPII. The results are based on the AOPII business-as-usual scenario and describe what could happen to air quality in the ten cities in 2010 assuming European trends in 1999 continue unchanged. The results suggest that emissions of CO and benzene would pose no threat to the cities in 2010. In 1995 only three of the cities (Athens, Lyon and Milan) exceeded the 1995 CO objective. In 2010 it was predicted that none of the cities would exceed the CO objective (EC, 2000). In 1995 six cities (Athens, Berlin, London, Lyon, Madrid, Milan and Utrecht) exceeded the objective for benzene. However, in 2010 only Athens, Lyon and Milan were predicted to slightly exceed the limit over a relatively limited portion of the city area. The highest predicted concentration in all cities was less than 1 µg/m3 above the objective of 5 µg/m3 as an annual average. For NO2, six of the cities (Athens, Cologne, London, Lyon, Madrid, Milan) exceeded the annual objective in 1995. In 2010 the number is reduced from six to two (Athens, Lyon) with significant improvements in emissions of NO2. The combination of topographical and climatic conditions together with NO2 emissions is responsible for exceedences in these two cities (EC, 2000). Due to the high uncertainties associated with modelling PM10, the study could only provide a tentative indication of the European situation. Nonetheless, the results suggest that approximately half of the cities considered would exceed the 2010 annual mean objective of 20 µg/m3 for PM10 and in some cases by a considerable margin (EC, 2000).
From modelling future air quality in the ten cities it was concluded that action at the European and national/local level would be required in order to reduce the exceedences of PM10 objectives as well as city-based or targeted measures to address remaining NO2 problems. The slight exceedences of benzene objectives may be eliminated as a consequence of implementing measures to address the other pollutants (EC, 2000).
1 In 1992 the EC established the first Auto-Oil Programme (AOP I) to provide the analytical foundation for the setting of vehicle emission and fuel quality standards for the year 2000 and beyond. In order to gain an objective assessment of the cost-effectiveness of different ways to reduce emissions from road transport and to achieve new air quality standards, the EC invited automobile and oil refining industries to participate in a technical work programme. This was the first time that industries, which would bear the burden of the environmental measures, were involved in their development from the beginning. Auto-Oil II Programme (AOPII) ran from 1997 to 2000. The aims of AOPII were: to make an assessment of the future trends in emissions and air quality; to establish a consistent framework within which different policy options to reduce emissions could be assessed using the principles of cost-effectiveness, sound science and transparency; and to provide a foundation (in terms of data and modelling tools) for the transition towards longer-term air quality studies covering all emission sources.
167

The conclusions of air quality modelling undertaken in the AOPII broadly supported the work undertaken by the European Environmental Agency’s (EEA) European Topic Centre on Air Quality, which developed the so-called ‘Generalised Exposure Assessment’ (GEA). The GEA used simple tools to calculate, in a consistent way, air quality in approximately 192 European Cities with a total population of 113 million for a reference year (1990 or 1995) and for the year 2010 assuming the AOPII base case scenario. The approach allowed the results to be generalised to the European Union scale (EEA, 2000). EEA Study on Air quality in European conurbations The EEA study modelled all cities within the EU with a population of more than 250,000 inhabitants. It provided information on current and future non-attainment of air quality objectives related to the protection of human health for the urban population in the EU. The air quality objectives used in the study are based on adopted or proposed daughter directives. Ambient concentrations must comply with these objectives by the year 2010 (de Leeuw et al, 2001).
Table 12.3 Predicted air quality in Athens (Greece) in 2010
Air
Quality Standard
Exceedence
Highest concentration
µg/m3
Annual city
concentration µg/m3
Percentage of
city with exceedence
1995 2010 1995 2010 1995 2010 1995 2010
NO2 annual
● ● 88 66 39 37 100% 98%
NO2 1hr ● ● 252 205 142 134 33% 2% CO 8hr ● ❍ 13mg 5mg - - 15% 0% Benzene annual
● ● 17 5.2 3 2 62% 2%
Ozone 8hr
N/A N/A - - - - - -
● exceedence of objective ❍ compliance with objective Table 12.4 Predicted air quality in Berlin (Germany) in 2010
Air
Quality Standard
Exceedence
Highest concentration
µg/m3
Annual city
concentration µg/m3
Percentage of
city with exceedence
1995 2010 1995 2010 1995 2010 1995 2010 NO2 annual
❍ ❍ 34 27 20 13 0 0
NO2 1hr ❍ ❍ 127 107 86 65 0 0 CO 8hr ❍ ❍ 5mg 2mg - - 0 0 Benzene annual
● ❍ 10 2 3 <1 52% 0
Ozone 8hr
N/A N/A - - - - - -
168

Table 12.5 Predicted air quality in Cologne (Germany) in 2010
Air Quality
Standard
Exceedence
Highest concentration
µg/m3
Annual city
concentration µg/m3
Percentage of
city with exceedence
1995 2010 1995 2010 1995 2010 1995 2010
NO2 annual
● ❍ 46 36 16 10 90% 0
NO2 1hr ❍ ❍ 158 132 75 53 0 0 CO 8hr ❍ ❍ 4mg 2mg - - 0 0 Benzene annual
❍ ❍ 2 1 <1 <1 0 0
Ozone 8hr N/A N/A - - - - - - Table 12.6 Predicted air quality in Dublin (Ireland) in 2010
Air Quality
Standard
Exceedence
Highest concentration
µg/m3
Annual city
concentration µg/m3
Percentage of
city with exceedence
1995 2010 1995 2010 1995 2010 1995 2010
NO2 annual ❍ ❍ 39 26 16 9 90% 0 NO2 1hr ❍ ❍ 139 104 75 74 51 0 CO 8hr ❍ ❍ 3mg 2mg - - - 0 Benzene annual
❍ ❍ 4 2 <1 <1 <1 0
Ozone 8hr N/A N/A - - - - - - Table 12.7 Predicted air quality in Helsinki (Finland) in 2010
Air Quality
Standard
Exceedence
Highest concentration µg/m3
Annual city
concentration µg/m3
Percentage of
city with exceedence
1995 2010 1995 2010 1995 2010 1995 2010
NO2 annual ❍ ❍ 31 27 23 19 0 0 NO2 1hr ❍ ❍ 119 108 95 85 0 0 CO 8hr ❍ ❍ 3mg 2mg - - 0 0 Benzene annual
❍ ❍ 2 1 <1 <1 0 0
Ozone 8hr N/A N/A - - - - - -
169

Table 12.8 Predicted air quality in London (United Kingdom) in 2010
Air Quality Standard
Exceedence
Highest concentration
µg/m3
Annual city
concentration µg/m3
Percentage of
city with exceedence
1995 2010 1995 2010 1995 2010 1995 2010
NO2 annual ● ❍ 60 39 31 19 40% 0 NO2 1hr ❍ ❍ 192 141 119 84 0 0 CO 8hr ❍ ❍ 6mg 2mg - - 0 0 Benzene annual
● ❍ 6 2 2 <1 7% 0
Ozone 8hr N/A N/A - - - - - - Table 12.9 Predicted air quality in Lyon (France) in 2010
Air Quality
Standard
Exceedence
Highest concentration
µg/m3
Annual city
concentration µg/m3
Percentage of city with exceedence
1995 2010 1995 2010 1995 2010 1995 2010
NO2 annual ● ● 93 46 20 11 54% 9% NO2 1hr ● ❍ 262 158 86 57 20% 0 CO 8hr ● ❍ 23mg 7.8mg - - 24% 0 Benzene annual
● ● 22 5.4 2 <1 50% 2%
Ozone 8hr N/A N/A - - - - - - Table 12.10 Predicted air quality in Milan (Italy) in 2010
Air
Quality Standard
Exceedence
Highest concentration
µg/m3
Annual city
concentration µg/m3
Percentage of
city with exceedence
1995 2010 1995 2010 1995 2010 1995 2010 NO2 annual
● ❍ 67 38 26 16 16% 0
NO2 1hr ● ❍ 208 137 106 73 1% 0 CO 8hr ● ❍ 17mg 7.8mg - - 6% 0 Benzene annual
● ● 19 5.3 3 1 43% 1%
Ozone 8hr N/A N/A - - - - - -
170

Table 12.11 Predicted air quality in Utrecht (The Netherlands) in 2010
Air Quality Standard
Exceedence
Highest concentration
µg/m3
Annual city
concentration µg/m3
Percentage of
city with exceedence
1995 2010 1995 2010 1995 2010 1995 2010 NO2 annual ● ● 78 47 28 20 0 0 NO2 1hr ● ❍ 232 160 111 88 0 0 CO 8hr ❍ ❍ 7mg 4mg - - 0 0 Benzene annual
● ❍ 11 3 2 <1 0 0
Ozone 8hr N/A N/A - - - - - - NB: exceedences are in Amsterdam, not Utrecht. Source for Table 12.3-12.11: EEA (2001) Urban background concentrations of pollutants were calculated as they are representative of the concentration in most of the urban area. The pollutants considered were SO2, NO2, PM10, Pb, O3, CO and benzene as well some results reported for benzo-a-pryene. The results from the GEA demonstrate that in 1995, a large proportion of the urban population in Europe was exposed to concentrations of one or more pollutants in excess of the air quality objectives set for the year 2010. Under the AOPII base case scenario the situation will be much improved. However, compliance with all air quality objectives is not expected. Additional reductions in sectors such as transport will be required. The study concludes that in 2010 about 4 per cent of the urban population living in 15 smaller cities will comply with air quality objectives. Non-attainment of objectives for PM10, NO2, O3 and benzene is predicted for more than half of the urban population. The breaching of air quality objectives is more likely to occur in southern European cities. In 1995 approximately 25 million inhabitants lived in cities where objectives for four pollutants were exceeded simultaneously. The study estimated that in 2010 this number will be reduced to less than 4.5 million. A large improvement in urban air quality is expected in European cities in 2010 due mainly to the benefits derived from implementing the directives which resulted from the first Auto-Oil Pogramme. However, frequent exceedences of short- and long-term PM10 objectives are expected as well as exceedence of long-term objectives for NO2. None or only minor exceedences are expected for lead and CO. Emissions for NO2, CO and benzene from the transport sector are reduced in 2010 compared to other sectors. However, in order for air quality objectives to be reached additional measures need to be taken for sectors other than road transport. Emissions of PM10 and NO2 pose the greatest challenge to future urban air quality in Europe. Although much progress has been made in reducing emissions from motor vehicles, road transport is still responsible for the greatest emissions of O3 precursors and particulate matter.
171

URBAN AIR QUALITY MANAGEMENT IN EUROPE The fifteen EU Member States have developed their own national policies to deal with urban air quality. For some countries such as Germany national air quality strategies were developed in parallel to EC air pollution policy and were subsequently adapted to comply with European regulations. For other countries, EC air quality regulations and standards have provided a stimulus to improve environmental protection and air quality. European Directives are increasingly influencing the management of air quality in EU Member States. EU action on improving air quality is based on four elements: 1. developing emission limit or target values for ambient air quality; 2. developing integrated strategies to combat the effects of transboundary pollution
(especially, acidification, ozone and eutrophication) through the adoption of national emission ceilings;
3. identifying cost-effective reductions in targeted areas through integrated programmes such as Auto-Oil I and Auto-Oil II;
4. introducing specific measures to limit emissions or raise product standards (or otherwise promote national or local action to reduce emissions) (EC, 2001).
The 1996 Framework Directive 96/62/EC on ambient air quality assessment and management provides a comprehensive framework for air quality improvement. The Directive covered atmospheric pollutants governed by existing ambient air quality legislation (SO2, NO2, PM, Pb, and O3) and air quality standards for unregulated pollutants: benzene, carbon monoxide, polycyclic-aromatic hydrocarbons, cadmium, arsenic, nickel and mercury. The objectives of the Framework Directive are to outline a common strategy to (CEC, 1996): • • •
•
•
•
establish emission limits to improve ambient air quality; assess ambient air quality in the EU on the basis of common methods and criteria; ensure adequate information is obtained and made available to the public, for example, via alert thresholds; and maintain ambient air quality where it is good and improve it in other cases.
The Framework Directive was followed by three daughter directives which set emission limits for a number of air pollutants. The objectives of the daughter directives are to harmonise monitoring strategies, measuring methods, calibration and quality assessment methods to achieve comparable measurements throughout the EU and good information to the public. Table 12.12 presents the limit values for different pollutants covered by the Framework and daughter directives. In order to develop a comprehensive, integrated and coherent framework for all EU air legislation and related policy initiatives the European Commission published a communication on the ”Clean Air For Europe” (CAFE) Programme in 2001. The main elements of the Programme are:
review the implementation of air quality directives and effectiveness of air quality programmes in the Member States; improve the monitoring of air quality and the provision of information to the public, including the use of indicators; priorities for further action, the review and updating of air quality thresholds and national emission ceilings and the development of better systems for gathering information, modelling and forecasting (EC, 2001).
172

Table 12.12 EU limit and threshold values for ambient air quality Pollutant Averaging
period Protects Value Target: Number of
exceedences To be met Directive
SO2
1 hour
Health
350 µg/m3
< 25 times
1 January 2005
First Daughter Directive:
1999/30/EC 24 hours
Health 125 µg/m3 < 4 times 1 January, 2005 First Daughter Directive:
1999/30/EC year/winter Ecosystems 20 µg/m3 none 19 May, 2001 First Daughter Directive:
1999/30/EC NO2 1h Health 200 µg/m3 < 19 time 1 January, 2010 First Daughter Directive:
1999/30/EC year Health 40 µg/m3 none 1 January, 2010 First Daughter Directive:
1999/30/EC year Ecosystems 30 µg/m3 none 19 July, 2001 First Daughter Directive:
1999/30/EC PM10
2 24h Health 50 µg/m3 < 36 times 1 January, 2005 First Daughter Directive: 1999/30/EC
year Health 40 µg/m3 none 1 January, 2005 First Daughter Directive: 1999/30/EC
Pb year Health 0.5 µg/m3 none 1 January, 2005 First Daughter Directive: 1999/30/EC
O3 8 hour Health 120 µg/m3 < 26 days 2010 COM (2000) 613 final June-July Ecosystems Accumulated Exposure over
Threshold (AOT) 40<18 mg/m3. h4
none 2010 COM (2000) 613 final
CO
8 hour Health 10 µg/m3 none 1 January, 2010 Second Daughter Directive: 2000/69/EC
Benzene year Health 5 µg/m3 none 1 January, 2010 Second Daughter Directive: 2000/69/EC
2 These limits should be reached by 2005; more stringent limit values will be dependent on a review in 2003-2004.
173

Local Air Quality Management Practice Each EU Member State has developed different approaches to the requirements of the Air Quality Framework Directive. A review of good practice in European urban air quality management (UAQM) was undertaken by Eurocities (1996)3, which is an association of European metropolitan cities. The review addressed UAQM issues in six European cities: Bologna (Italy); Bratislava (Slovakia); Delft (Netherlands); Helsinki (Finland); Lisbon (Portugal); and Sheffield (United Kingdom). The six countries examined national and European legislation to improve urban air quality. However, this was in addition to a variety of initiatives such as Local Agenda 21, urban CO2 reduction, public transport provision and public awareness campaigns. The contribution of city authorities to the management of urban air quality in Europe is considered to be of key importance as they play a crucial role in controlling industrial and commercial emissions. One main point highlighted in the UAQM study was that local action and cooperation is the most effective way of addressing urban air quality problems. This involves cooperation with city authorities and industry, commerce, public transport providers and the public. It is becoming widely accepted that local air quality management is an appropriate response to address urban air quality issues. Local air quality management has been defined as the application of a systematic approach to the control of air quality issues in which all factors determining air quality are considered in an integrated way (Longhurst et al, 1996). The Air Quality Framework Directive includes actions which can be taken at the local level. Local authorities have a wide experience or air quality issues and are uniquely positioned to involve a variety of players in air quality management issues. In the national UAQM strategies of Finland, Italy, The Netherlands, Slovakia and the UK the local authority plays a key role in air quality management. The reciprocal nature of local authority action and government legislation has meant that national strategies are generally accepted. However, there are still key areas where the capacity of city authorities to take initiatives is limited e.g. speed limits on major highways (Eurocities, 1996). All six European cities recognised road traffic emissions as being the single most important and complex issue for air quality management to address. The range of measures to combat car ownership and use should be integrated within the principles of Local Agenda 21. The UAQM study recommends that Local Agenda 21 should be a common thread which runs through all the measures that aim to reduce vehicle emissions. A long-term commitment to public transport, with adequate investment, is important for the cities of the future. All the cities involved in the study believe that simply supplying air quality measurements to the public is no longer sufficient or acceptable. Information on air quality should be used to instigate awareness and education campaigns. These can play a major role in changing stakeholders’ perceptions of air quality and encouraging them to contribute to, and be involved in, improving air quality. The UQAM study concluded that there is: 3 The association represents 90 cities from 26 European countries and 17 associated members and, through its thematic sub- networks, many more large, medium-sized and small cities in Europe and beyond. The network aims to improve the quality of life of the 80 per cent of Europeans living in cities and urban areas by influencing the European agenda, and promoting the exchange of experience and best practice between city governments. Website: http://www.eurocities.org/
174

“ … a need for a flow of information on air quality management between cities and countries, so that a unified approach to meeting the needs of the Air Quality Framework Directive can be achieved. Examples have been cited which outline the need for co-ordination and co-operation within agencies. One of the main aspects of successful air quality management will be inter and intra co-operation. Once this has been achieved, a coherent planning stage can be instigated. A planning stage which is clear and accessible to those outside the local authority must be produced. This in turn will be the basis for the essential next step – involving the wider community in air quality management.”
The UQAM study was followed by the Air Action project entitled “Achieving Change Locally”, the final report of the study being published in June 2000 (Eurocities, 2000). The aim of the study was to develop local air quality action plans in collaboration with business partners with an emphasis on land use and transport issues. The study examined the action plans undertaken in Bratislava (Slovakia), Helsinki (Finland) and Sheffield (UK) and concluded that the road transport culture is the prime cause of poor air quality in all three countries. It recommended that: •
•
•
•
the inappropriate use of motor vehicles should be tackled by cities authorities working together with other cities and countries to develop affordable, attractive and accessible alternatives to the private car; business travel plans should be used to address the commuter journey as they can bring about a combination of improvements and cost savings for organisations as well as many less tangible benefits for staff and society as a whole; decisions on appropriate use of transport should be made at the local level in consultation with a wide range of stakeholders e.g. planners, developers and public; and air quality management should be part of a wider strategy and action for sustainable development. The policies of transportation, land use, planning, economic regeneration and air quality must be integrated to ensure that separate policies and actions are working in harmony in achieving common goals.
The next section examines the issue of transport in more depth and the range of local measures that can be implemented to reduce the use of the motor vehicle and thus improve air quality. AIR QUALITY AND TRANSPORT Since the early 1980s the road transport of freight and passengers in the European Union has increased by approximately 45 and 41 per cent respectively. In contrast, the transport of freight by rail has decreased while passenger rail transport has increased by 10 per cent. In the period 1970-1993 passenger transport in the EU Member States grew at an annual rate of 3.2 per cent. The average distance travelled every day by each European citizen in this period increased from 16.5 km to 31.5 km. This growth in the demand to travel has been met mainly by the motor vehicle, which now accounts for 75 per cent of all kilometres travelled in the EU. Car ownership in the period 1975-1995 grew from 232 per 1,000 people to 435 per 1,000 people (EC, 1995). In Western Europe, forecasts in transport growth for a “business as usual” scenario indicate that the demand for freight and passenger transport by road could double between 1990 and 2010. The number of cars could increase by 25 to 30 per cent and annual car kilometres travelled could increase by 25 per cent. Air transport is also expected to increase by 182 per cent during the period 1990-2010 (EC, 1992). 175

Motor vehicles and the combustion of gaseous fuels in western Europe have replaced industrial processes and the combustion of coal and high-sulphur fuels as the dominant sources of pollution. As transport is expected to increase considerably, transport-related emissions are also expected to rise, intensifying air pollution in cities (EEA, 1998). Air pollution from the transport sector has important health and environmental effects. Road transport is responsible for a significant proportion of NO2 and PM10, which, as discussed above, are the pollutants most likely to exceed air quality objectives. Therefore reducing emissions from road transport is a key part of local air quality management. A number of strategies can be adopted at the local level which address not only vehicle pollution control but demand management. To achieve an environmentally sustainable transport system, which ensures a minimal environmental impact both in the short- and long-term, measures will need to be taken to reduce the overall demand to travel and to encourage the use of less polluting modes of transport. This requires the adoption of a combination of measures ranging from emission standards to land-use policies, in order to ensure that the overall need to travel and vehicle pollution are reduced. Local Traffic Management
In the development of strategies to deal with urban air quality issues local traffic management can be used to reduce vehicle emissions. Traffic management measures have included computerised traffic light control, network and junction design, parking controls, reducing the supply of space allocated to car parks, park and ride schemes, speed limits, restricted access for non-essential traffic, bus priority lanes, pedestrian areas and cycling facilities. These measures not only reduce energy use but also provide an environment, which is more people-friendly and which encourages greater walking and cycling. Small traffic management schemes can influence air quality in their immediate vicinity, but are likely to have a relatively small effect over a larger area. Free-flowing traffic and smooth driving techniques usually mean lower emissions and better fuel consumption. It should be a general objective of traffic management to reduce congestion, making smoother driving possible, but without speeding. However, improving traffic flow and reducing congestion may attract more vehicles and additional measures may be required to prevent an increase in vehicle movements (DETR, 2000d). Table 12.13 outlines a number of local traffic management measures that the UK Government have advocated in dealing with the issue of transport and air quality in towns and cities. Havlick and Newman (1988) examined traffic management measures in four European cities: Copenhagen, Freiburg, Stockholm and Zurich (see Table 12.14). They concluded that even though consumer preferences for cars are a powerful force, people would respond to public policy, which gives them options to be more environmentally responsible. Governments can therefore be more confident in proposing traffic demand management strategies, especially if they have a strong element of facilitating the common good. A number of European cities are now adopting car free policies such as Amsterdam. In March 1994 a Car Free City Club sponsored by the EC was launched to make progress towards banning the car from city centres. The club encourages urban sustainable mobility and allows exchange of experience and information between European cities.
176

Table 12.13 Local traffic management measures
Measure
Description
Traffic management
Smoothing traffic flow and reducing speed, banning or restricting traffic, or particular types of vehicle, from some roads; making walking, cycling and the use of public transport more attractive; and working with business and the public to raise the awareness of the implications of transport choices.
Traffic regulation
The authorities may have the power to prohibit, restrict or regulate traffic or particular types of vehicles. They may apply to part of a road, a single road, or a number of roads. They may be in force all the time or only for specified periods. Traffic authorities may exempt some classes of vehicle or permit holders.
Low emission zones
These zones might cover areas with particular air quality problems and only vehicles meeting or exceeding stringent emissions standards might be allowed into the zone.
Home zones
Home zones aim to change how residential streets are to used to benefit the wider community. Home zones allow the road space in residential streets to be shared between motor vehicles and other road users, with the needs of the pedestrians (including children) and cyclists being given priority.
Clear zones
Clear zones aim to improve the quality of life for people living in, working in and visiting an area by reducing traffic congestion, traffic noise and air pollution.
Access restrictions – physical measures
City authorities can use physical restrictions to narrow ‘gateways’ to urban centres. This technique may discourage car access to particular areas, as long as there are suitable alternative routes for through traffic. However, if traffic has to queue at the gateways there could be an increase in local emissions.
177

Table 12.13 Local traffic management measures (continued) Traffic calming
Traffic calming is the introduction of a range of physical measures to slow traffic. Traffic calming schemes direct the flow of slowing traffic and deters traffic from using residential roads as a short cut. The design of the scheme should encourage a smooth driving style that avoids repeated acceleration and deceleration.
Relocation of road space
Reallocating space to buses and cycles can make these forms of transport more attractive.
High occupancy vehicle lanes
A significant proportion of vehicles contain only one occupant, especially during peak periods. In principle, high occupancy lanes (HOV) are a means of using the road network more efficiently and encouraging car sharing. HOV can be introduced by creating an additional lane or by converting an existing lane.
Speed limits
Reducing maximum speeds is likely to do more to improve flow and capacity on roads outside towns and cities than in urban areas, but it may still have some benefit.
Public transport
The promotion of rail, buses, park and ride schemes, walking and cycling can reduce the use of the motor vehicle in the city centre. The cost and quality of public transport are important factors then may influence its use. The maintenance of the bus fleet is important so they do not add to existing air quality problems. In order to encourage more walking and cycling then it is important to provide safe and convenient facilities. Local authorities may develop awareness campaigns to increase walking and cycling.
Green travel plans
Green transport plans (GTPs) are management tools that brings together transport and other business issues in a co-ordinated strategy. GTPs contain a package of measures to car use by addressing different transport needs such as commuter journeys, customer access, business travel and fleet management. Green transport include the: provision of public transport information; public transport discount from bus or rail companies; public transport subsidy form company for works buses; encouragement of use of rail for business travel; telecommuting/teleworking; teleconferencing; green company car fleet; parking controls/restrictions; pay staff to give up their parking space; cycle parking, showers and lockers; car-sharing database with preferential parking spacies; emergency ride home; and walking initiatives (DETR, 1999).
178

Table 12.14 Traffic management measures taken in four European cities
Denmark Copenhagen
Germany Freiburg
Switzerland
Zurich
Sweden
Stockholm
Traffic calming
• Regional
traffic calming but extensively pedestrian in city centre
• Extensive 30 km/h zones
• Enforcement
• Regional
traffic calming but extensively pedestrian in city centre
• Extensive 30 km/h zones
• Enforcement
• Regional
traffic calming
• Extensive 30 km/h zones
• Enforcement
• Regional
traffic calming but extensively pedestrian around each rail station
• Extensive 30 km/h zones
• Enforcement
Favouring alternate modes
• Emphasis of
bike lanes and pedestrianisation
• No extra road capacity, reduction of parking by 3% p.a. for 15 years
• Culture of respect for cyclists
• Strong
commitment to transit and bicycle infrastructure
• Little extra road capacity
• Transit pass
• Expansion of
light rail system and bike/pedestrian lanes
• No extra road capacity, cap on parking
• Rainbow pass for transit system
• Strong
commitment to transit
• Little extra road capacity
• Transit culture
Economic penalties
• Usual
European fuel tax but very high vehicle registration
• Usual
European fuel tax and vehicle registration
• No congestion pricing
• High parking fees
• Usual
European fuel tax and vehicle registration
• No congestion pricing
• High parking fees
• Usual
European fuel tax and vehicle registration
• No congestion pricing
• High parking fees
Non auto-dependent and land-use
• Corridors of
growth • Urban villages
around rail lines
• Mixed use in centres
• Corridors of
transit-oriented growth and no other growth
• Urban villages around rail stops
• Mixed use in centres
• Containment
of growth • Urban
villages around new light rail lines
• Some mixed use
• Corridors of
transit-oriented development and no other growth
• Urban villages around new rail stops
• Mixed use in centres
Source: Havlick and Newman (1988)
179

Air Quality and Land-Use Planning Land use planning has important implications for energy consumption and vehicle-related air pollution (DETR, 2000e).Travel and transport developments have interacted to allow significant land-use changes. The result has been the development of more energy-intensive land-use and increased vehicle activity patterns. Land-use planning has been shaped by the increasing dominance of the motor vehicle as the main mode of transport. In Europe developments have tended to become more decentralised, moving to the urban fringe with an increase in out-of-town retail developments. The result has been an increase in car dependence to undertake normal everyday activities such as travelling to work, school, shopping and leisure activities. There is a need to integrate land-use and transport planning within local air quality management strategies in order to improving air quality and change travel behaviour. The provision of infrastructure in the past has shown it exacerbates rather than solves the problem. New roads can generate more new traffic (SACTRA, 1992). A study for the UK Department of Environment (DoE, 1993) examined the extent to which land-use planning could contribute to reducing demand to travel, and hence carbon dioxide emissions. The study concluded that planning policies in combination with transport measures could reduce projected transport emissions by 16 per cent over a 20-year period. A 10-15 per cent saving in fuel use, and hence emissions from passenger transport, might be achieved through land use changes at the city and region scale over a 25-year period. A number of land-use measures can be taken to concentrate living, working, shopping and recreational facilities in a specific area and thus reduce the need to travel. The Dutch have adopted a location policy, which sites new businesses and services at appropriate locations accessible by both road and public transport. Each company has its own transport needs and it is the aim of location policy to ensure the company is sited in the most effective location (Haq, 1997). More sustainable and less polluting forms of transport should be encouraged to reduce the use of the motor vehicle. This involves taking measures to improve the attractiveness of public transport, walking and cycling. Public transport should be cheap, clean and comfortable, and services should be regular, predictable and reliable. Information on service should be easily available for customers. Pedestrianisation schemes can improve the attractiveness and the commercial success of central areas by removing traffic pollution and providing a more friendly environment for walking (RCEP, 1997). Both cycling and walking provide a number of health benefits (BMA, 1997). Walking offers a viable alternative for trips of up to 3 kilometres. Poor traffic management, congestion, exposure to traffic pollution and fear of accidents are a disincentive for people to both walk and cycle in an urban environment. To encourage more cycling, safe cycle routes need to be provided. Table 12.15 presents a number of bicycle schemes in five European cities. In The Netherlands, cycling accounts for about 30 per cent of all journeys and 8 per cent of passenger kilometres travelled. In the city of Delft ,cycling accounts for 43 per cent and in other medium-sized Dutch cities this figure varies between 20-50 per cent of the modal split (Haq, 1997).
180

Table 12.15 Bicycle schemes in five European cities Country
City
Population
% of journeys by bike
(city centre)
Increase in bicycle use (over time)
Main traffic
management measures
Austria
Graz
240,000
14
7-14%
(1979-1991)
• pedestrian measures • parking reduction • traffic calming • cycle parking and
cycling
Germany
Hanover
550,000
16
9-16%
• land use planning • traffic calming • cycle routes (450
km) • car parking control
Munster
280,000
43
29-43%
(1981-1992)
• quality of cycle routes
• links to public transport
• traffic calming
Netherlands
Delft
80,000
43
40-43%
(1982-1985)
• compact land use • traffic cells • complete cycle
network
Switzerland
Basel
172,000
16
8-16% (1979-1990)
• tram priority • traffic restraint • cycle network (city
wide) Source: CTC (1995) KEY PRINCIPLES OF THE EUROPEAN AIR QUALITY MANAGEMENT The European Commission has identified seven key issues which it recommends that existing and prospective Member States of the EU should implement in order to improve urban air quality. These key issues address action to be taken at both the national and local level and are adaptable to other countries outside Europe which need to address the problem of deteriorating urban air quality (EC, 2000): 1. air quality management and regulation should be effectively integrated with that of other
environmental sectors (e.g. water, noise and waste), preferably throughout a single environmental protection agency and a single legal instrument;
2. quality assured assessment of ambient air quality should be undertaken before formulating a strategy for air quality improvements, and mapping and compiling an inventory of emissions;
3. a comprehensive air quality management strategy should be drawn up to improve and maintain air quality, addressing all issues of concern and focusing on issues of immediate concern in terms of complying with air quality criteria;
181

4. arrangements should be put in place for effective public participation and the involvement of interest groups which have a significant role or function to perform in relation to air quality management;
5. adequate provision should be made for monitoring, regulation and enforcement of legislation, regulations, permits and licences. In particular, sufficient human and technical resources need to be allocated to enable all functions to be properly performed;
6. record keeping and reporting should be performed to meet the requirements of air quality standards and guidelines and to inform the public; and
7. air quality management plans should be regularly reviewed and updated to ensure that they remain relevant to the key issues of concern.
Local air quality management is now considered the most effective way to address urban air pollution problems. City authorities have a wide experience of air quality issues and therefore are in a good position to take action to develop local air quality strategies in cooperation with all stakeholders. They are well placed to directly improve poor air quality hotspots. The use of Air Quality Management Areas in the UK is just one way to address poor air quality hotspots and to develop appropriate action which requires the integration of policies on transport, land use and industrial location. Although it is too early to determine the success of these zones in improving air quality, it does provide a more focused approach in addressing particular air quality problems and bringing about the associated health benefits for certain parts of the city. Air quality information should be used not only for reporting but to educate and encourage a range of different stakeholders to participate and engage in air quality management initiatives. Road transport poses the greatest threat to achieving and maintaining good urban air quality. In cities which have a poorly maintained vehicle stock and less stringent emission standards, pollution from motor vehicles poses a significant threat to human health. A wide range of measures can be taken by city authorities to reduce the use of the motor vehicle and encourage the use of less polluting modes of transport, which result in improvements in air quality. The integration of public transport and land use is important in reducing the need for travel. Measures such as travel plans have been used to encourage private and public employers to take responsibility for the way their employees travel to work. A number of European networks have been established to address a range of issues related to the city. These networks aim to foster a spirit of cooperation and exchange of information and best practice between cities which are addressing similar issues in urban air quality management, but which have different economic, political and cultural back grounds.4 LEARNING FROM OTHER MEGACITY EXPERIENCES A number of megacities and large urban conurbations throughout the World have adopted similar measures used in Europe as well as developing their own unique methods to deal with air quality management and the causes of poor air quality such as transport. 4 see: www.sustainable-cities.org; www.who.dk/health-cities; http://www.carfreecities.org/;
http://www.eurocities.org/; http://www.alter-europe.org.uk/ 4 see: www.ecoplan.org
182

Curitiba in Brazil is a city of approximately 1.6 million residents which has grown fourfold in the last thirty years. Unlike many large urban conurbations throughout the world, Curitiba has not suffered the poor quality of life associated with the growth in motor vehicle use. Instead, it has developed a public transport system that provides residents with access to jobs, homes, recreation and other elements of the urban community by implementing small improvements guided by a long-term transport plan. Public transport in Curitiba now provides a high quality service at a low cost with reduced travel times. Curitiba’s buses attract more passengers per operating kilometre than in any other Brazilian city. The result has been less traffic congestion, reduced pollutant emissions and substantial fuel savings of approximately 27 million litres of fuel per year (Rabinovitch and Hoehn, 1995). The City of Bogotá in Colombia is a fast growing city of approximately seven million people and is considered to be the fifth most polluted city in Latin America after Mexico City, Santiago, Sao Paulo and Rio de Janeiro.5 The cause of poor air quality is increasing motor vehicle use. However, Bogotá is just one country that has adopted similar measures used in Europe to develop a new model to deal with transport and mobility, with the aim to create a highly participatory process and a genuinely sustainable transportation system, which serves the multiple of objectives of economic viability, quality of life, environmental integrity and social justice. The city decided that the transportation system of Bogotá should be for people rather than cars and to achieve this goal the city authority has developed a programme to take away street and other urban space consistently and strategically from private cars and to transfer it to better and more productive uses. The programme includes the following measures: • • • • •
• •
•
•
•
parking control and constraint; successful even/odd number plate car restraint days; traffic calming measures and pedestrianised areas; construction of more than 200 km of bicycle paths; provision of high capacity fine mesh network for public transport offering high speed service over the metropolitan region; renewal of public transport fleet to reduce noise and air pollutant emissions; and a Car Free Day.
On 24 March 2000 Bogotá held a Car Free Day similar to those held in European cities of Amsterdam and Bologna. The day required one month of planning, consultation, preparations and media campaigns under the direction of the office of the Mayor of Bogotá, with the cooperation of concerned local, regional and national organisations. Between 6.30 in the morning and 19.30 in the evening an estimated 800,000 private cars stayed at home which had a number of benefits for the city. On the day people moved around by a combination of walking, skating, running, cycling and other two–wheel transport and public transport, including 55,000 taxis and approximately 25,000 small buses. More that 250 km of special paths were reserved for bicycle use on the day. The Car Free Day resulted in a reduction in :
traffic accidents, with only 27 accidents being reported compared to a daily average of 100; traffic deaths with no deaths occurring compared to a daily average of 2-3 deaths caused by road traffic accident; traffic injuries – 28 reported injuries of which 8 were slight accidents involving cyclists compared to an average day of 70-80;
5 see: www.ecoplan.org
183

• vehicle emission with a 20 to 30 per cent decrease in vehicle exhaust emissions. There was an 8 per cent reduction in NOx emissions, a 22 per cent reduction in CO and a 21 per cent reduction in PM.
CONCLUSION A number of measures from the recent experience of air quality management in Europe can be identified which could be adaptable to other countries throughout the world and in megacities where similar problems of poor air quality and the growth in motor vehicles are being experienced. Measures taken in Europe on improving air quality have included zoning to improve air quality in certain parts of the city, regular monitoring of air quality and provision of information to the public on air quality as well as specific measures directed at the control and use of motor vehicles. Lessons in urban air quality management can be learnt not only from the European experience but also from other megacities which are also pioneering new ways and policies to improve urban air quality and its causes. Improvements in urban air quality require the cooperation of the stakeholders involved and the exchange of best practice. Networks provide one way of encouraging this cooperation and the exchange of information on air quality management among different cities and countries to enable the development of a unified approach to deal with urban air quality issues. REFERENCES Beattie, C I, Longhurst, J W S, Woodfield, N K (2001) Air quality management: evolution of
policy and practice in the UK as exemplified by the experience of English local government. Atmospheric Environment, vol 35, pp1479–1490
BMA (1997) Road Transport and Health, British Medical Association, London Boubel, R W, Fox, D L, Turner, D B and Stern, A C (1994) Fundamentals of Air Pollution,
Academic Press, London Boehmer-Christansen, S and Skea, J (1991) Acid Politics, Belhaven Press, London Brimblecombe, P and Maynard, R L (2001) The Urban Atmosphere and Its Effects, Imperial
College Press, London BUND (1993) Vorbildliche Kommunale Transportprojekte, Bund fur Umwelt und
Naturschutz Deutschland, Germany CEC (1996) Council Directive 96/2/EC of 27 September 1996 on ambient air quality
assessment and management, Official Journal, L296, 21/11/1996, pp0055–0063 CEC (1999) Council Directive 1999/30/EC of 22 April 1999 relating to limit values for
sulphur dioxide, nitrogen dioxide and oxides of nitrogen, particulate matter and lead in ambient air, Official Journal, L163, 29/06/1999, pp0041–0060
CEC (2001) The Clean Air For Europe (CAFE) Programme: Towards a Thematic Strategy for Air Quality, Commission of the European Communities, Brussels, COM(2001) 245 final, 04.05.2001
Clapp B W (1994) An Environmental History of Britain Since the Industrial Revolution, Longman, Harlow
CTC (1995) More bikes- policy into best practices, Cycling Touring Club, Goldaming, Surrey
DETR (1999) The Benefits of Green Transport Plans: The Guide. Department of Environment, Transport and Regions, London Environment, HMSO, London
DETR (2000a) The air quality strategy for England, Scotland, Wales and Northern Ireland. Working together for clean air. CM 4548. The Stationary Office Ltd, London
DETR (2000b) Framework for Review and Assessment of Air Quality, LAQM.G1(00), Department of Transport, Environment and the Regions, London
184

DETR (2000c) Developing Local Air Quality Action Plans and Strategies: The Main Considerations, LAQM.G2(00), Department of Transport, Environment and the Regions, London
DETR (2000d) Air Quality and Transport, Department of Transport, Environment and the Regions, London
DETR (2000e) Air Quality and Land Use Planning, LAQM G4(00), Department of Environment, Transport and the Regions, London
DoE (1997) The United Kingdom national air quality strategy, CM3587. The Stationary Office Ltd. London
DoE (1993) Reducing Transport Emissions through Planning, Department of the Energy EC (1995) The Citizen’s Network: Fulfilling the Potential of Public Passenger Transport in
Europe, European Commission, Brussels, Belgium EC (1992) Towards Sustainability: A European Community Programme of Policy and Action
in Relation to Environment and Sustainable Development, COM (92) 23 final, Vol. II, Brussels, 27 June 1990
EC (1999) EU focus on Air, European Commission, DG Environment, Brussels, Belgium EC (2000) Handbook on the Implementation of EC Environmental Legislation: Air Quality,
European Commission, Brussels, Belgium EC (2001) Communication from the Commission: The Clean Air For Europe (CAFÉ)
Programme: Towards a Thematic Strategy for Air Quality, COM (2001) 245 final, 04.05.2001, Brussels, Belgium
EEA (1998) Europe’s Environment: The Second Assessment, European Environmental Agency, Copenhagen, Denmark
EEA (2000a) Environmental Signals 2000, European Environmental Agency, Copenhagen, Denmark
EEA (2000b) Air quality in larger conurbations of the European Union, European Environmental Agency, Copenhagen, Denmark
EEA (2001) Environmental Signals 2001, European Environmental Agency, Copenhagen, Denmark
Encyclopaedia of the Atmospheric Environment (2001) http://www.doc.mmu.ac.uk/aric/eae Elsom, D M (1992) Atmospheric Pollution: A Global Problem, Second Edition. Blackwell,
Oxford Elsom, D M (1996) Smog Alert: Managing Urban Air Quality, Earthscan, London de Leeuw, F A A M, Moussiopoulos, N, Sahm, P, Bartonova, A (2001) Urban air quality in
large conurbations in the European Union, Environmental Modelling & Software. 16, pp399–414
Eurocities (1996) Good Practice in European Urban Air Quality Management Eurocities (2000) The Air Action Project: Achieving Change Locally, Eurocities Haq, G (1997) Towards Sustainable Transport Planning: A Comparison Between Britain and
the Netherlands, Avebury Press, Aldershot Havlick, S W and Newman, P W G (1988) Can demand management tame the automobile in
the metropolitan region?, World Transport Policy & Practice, vol 4, no 1, pp30–35 Longhurst, J W S, Lindley, S J, Watson, A F R and Colan, D E (1996) The Introduction of
Local Air Quality Management in the United Kingdom: A Review and Theoretical Framework, Atmospheric Environment, vol. 30, no 23., pp3975–3985
Rabinovitch, J and Hoehn, J (1995) A Sustainable Urban Transportation System: The “Surface Metro” in Curitiba, Brazil, Working Paper No. 19, UNDP, New York, USA.
RCEP (1997) Transport and the Environment – Developments Since 1994, Royal Commission on Environmental Pollution, Twentieth Report, HMSO, London
SACTRA (1992) Truck Roads and the Generation of Traffic, The Standing Advisory Committee on Truck Road Assessment, HMSO, London
Wilkins, E. T. (1954) Air pollution aspects of the London fog of December 1952, Quart. J. Royal Meteorological Society, vol 80, pp267–271
185

13 URBAN AIR POLLUTION INITIATIVES IN THE ASIA REGION
Jae-Hyun Lee, United Nations Environment Programme, Nairobi, Kenya INTRODUCTION The deterioration of air quality in Asia due to the explosive rate of population growth, development, and urbanization, in conjunction with the corresponding growth of industry and transport systems, has intensified concerns for effective air quality management. Most national and municipal governments in Asia have assessed the negative health and economic effects of air pollution and have thus initiated abatement measures and policies to address air pollution and air quality management. In some Asian cities, like Taipei and Tokyo, air quality management policies have led to cleaner skies and healthier living conditions for its residents. However, even combined, these local and national efforts are insufficient to address the general air pollution problem because of the nature of the air pollution sources and pollutants in the Asian Region. Much of Asia’s air pollutants are caused by low quality fuel, inefficient energy production and use, increase use of motor vehicles and poor inspection and maintenance systems. According to some estimates, Asia is expected to exceed Europe and United States combined by 2005 and equal all industrialised countries in sulphur dioxide (SO2) emissions caused by the burning of fossil fuels by 2010 (Brandon and Ramakutty, 1993). The high level of emissions of sulphur dioxide and nitrogen oxides (NOx) from fossil fuel combustion in the energy, industry and transportation sectors, are known to be transported over large distances that have the potential to cause increased emissions in other countries. The problems caused by transboundary air pollution have been evident in the cases of recent Indonesian forest fires and the yellow dust storms from Western China. In addition, major weather patterns in Asia are known to facilitate the transboundary transport of air pollutants from land to sea and the reverse in summer (SEI, 1999). Pollutants, therefore, can easily travel from country to country in the region. Thus, it is not feasible for individual countries to solve the associated problems alone. There is need for regional cooperation on urban air pollution measures in Asia. Currently, regional/sub-regional level agreements on the issue, whose policies and infrastructure will decide the emissions over the next 25 years, do not exist or are at initial stages. However, NGOs, regional and international development agencies have begun to work towards regional cooperation on air quality and have launched initiatives that have aimed to instigate cooperation between various national and local stakeholders, and build foundations for policies on the regional level. Although there was a marked increase in the number of regional air pollution initiatives that were launched in the 1990s, due to unreceptive political conditions, some of those first initiatives were postponed or deemed unsuccessful. However, these early regional initiatives lay the way for recent initiatives that have focused on transboundary air pollution or urban air pollution issues. The new initiatives launched in the past few years are seen to have great potential forces in the Region: the Kitakyushu Initiative, Air Pollution in the Megacities of Asia (APMA) project and Clean Air Initiative for Asian Cities (CAI-Asia). Each of these initiatives is unique with its own specific objectives, activities and characteristics; however, a more comprehensive coverage of countries and coordination between the many different
186

initiatives and stakeholders is required. If these projects coordinate their individual activities then a synergy could be created that will effectively contribute to improving air pollution in the region. It is also important that these regional initiatives address the diverse nature of air pollution problems that much reflect the variety of cultural, socio-economic and political realities of the Asian Region. The difference in the rate and characteristics of economic growth and urbanisation of each country in the region generates different pollution problems. Some countries are concerned about the emissions of sulphur oxides (SOx) mainly generated from heating while other countries focus on the control of volatile organic compounds (VOCs), nitrogen oxides (NOx), particulate matter (PM) and hazardous air pollutants generated mainly from the increased use of motor vehicles. It will be a challenge to address all the major issues from various countries in addition to dealing with the political realities. But, it is a necessary challenge to overcome for the sake of effectively targeting regional air quality in a comprehensive way in order to improve the well-being of the Asian population and environment. The aim of this paper is to review the current initiatives in the Asian region that have been implemented by different organizations to address the problem of air pollution. It first reviews initiatives that deal with transboundary air pollution and then examines initiatives that address urban air pollution. LONG-RANGE TRANSBOUNDARY INITIATIVES FOR NORTH-EAST ASIA Countries in the Northeast Asian region, mainly China, Korea and Japan, have recently launched several initiatives and agreements for the purposes of environmental cooperation. Transboundary air pollution has been the main thrust and focus of many of these Northeast Asian discussions. The Northeast Asian Long-range Transboundary Air Pollution Initiative attempts to present and discuss the results of the past year of research in the form of a national report submitted by each country and to discuss scientific research needs required clarifying uncertainties. The initiative intends to improve our understanding of the long-range transport of air pollutants in Northeast Asia and to contribute the development of systematic research. The general objective is to provide policy-makers with useful information aimed at preventing or reducing adverse impacts on the environment of Northeast Asia. The first Northeast Asian Workshop on Long-range Transboundary Pollutants (LTP) was held on 14-15 September, 1995 in Seoul, Korea. At the Workshop, an agreement was made to launch a working group composed of government officials and experts from China, Korea and Japan to support joint research on long-range transboundary air pollution and to establish an Interim Secretariat at the National Institute of Environmental Research (NIER) in Korea to support the organization and affairs of the working group. At the Workshop, it was also agreed that the three Northeast Asian countries would perform joint research on monitoring and modelling for long-range transboundary air pollution, and work on further organizational structuring and future cooperation the following years.
187

TRIPARTITE ENVIRONMENT MINISTERS MEETING (TEMM) Background Through the Tripartite Environment Ministers Meetings (TEMM), Korea, China and Japan have tried to discuss ways of improving the environment in Northeast Asia. The meetings thus far have focused on issues of transboundary air pollution as a result of the ecological system in western China and various ways of controlling “yellow dust storms,” as well as possible joint research on trans-border air pollutants in Northeast Asia. Ecological degradation in western China and measures to remedy the problem have had priority at the TEMM meetings as dust storms originating from western China have begun to hit neighboring countries more often in recent years. The ministers have tried to work out detailed measures to combat the sand storms. The three nations adopted the issue of ecosystem rehabilitation as a collaborative project. TEMM, launched at Korea's initiative in 1999, is the only cabinet ministers' meeting to be held annually among the three nations. Objectives and Activities TEMM hopes to tackle the worsening state of environment in the region through active cooperation between the three countries. At the first TEMM held in Seoul on 12 January, 1999 under the initiative of the Ministry of Environment of Korea, the three environment ministers identified the following as priority areas for cooperation:
i) strengthening community awareness and exchanging information; ii) preventing air pollution and protecting the marine environment; iii) reinforcing cooperation on environmental technology, industries and research.
The main projects designated at the meeting included creating the appropriate cooperation channels between the three countries’ environmental ministries and agencies, encouraging cooperation between NGOs and research institutes, and fostering international and domestic cooperation between local governments. The Second TEMM was held in Beijing, 26-27 February, 2000. At the meeting, the ministers reaffirmed the TEMM mechanism as a unique forum for fostering regional environmental cooperation and sustainable development in Northeast Asia, and noted that TEMM has produced positive effects in the region and globally. After the ministers reviewed the efforts made by the three countries since the 1st TEMM, they agreed to jointly undertake concrete project-style and cooperation methods, including holding a roundtable for environmental industry cooperation and developing a joint education curriculum on the Northeast Asian Environmental Community. They also discussed various issues of common concern in detail, including air pollution and climate change issues. The ministers were interested in the ongoing air pollution control programs such as the three countries’ joint research project on the Long-range Transportation of Air Pollutants (LTP), the establishment of a sub-regional centre in Korea for environmental pollution data monitoring and analysis. The ministers noted that these projects would enter the implementation stage as planned. The ministers also recognised
188

the importance of promoting various activities under the North-West Pacific Action Plan (NOWPAP). They also agreed to jointly participate in cooperative projects to promote environmental protection in China’s northwestern regions. MALÉ DECLARATION The Malé Declaration on control and Prevention of Air Pollution and its Likely Transboundary Effects for South Asia is an inter-governmental agreement to tackle the problems of regional air pollution, established in 1998 by the South Asian countries. Of all regional initiatives, it is the only environmental agreement covering all the countries of South Asia. A draft declaration on transboundary air pollution was formulated in March 1998 when various senior government officials and experts met at the Asian Institute of Technology in Bangkok. In April 1998, Ministers of the Environment at the seventh meeting of the Governing Council of South Asia Cooperative Environment Programme (SACEP) in Malé, Republic of Maldives, adopted the Malé Declaration on control and Prevention of Air Pollution and its Likely Transboundary Effects for South Asia. Participants Implementation of the Malé Declaration is coordinated by the UNEP Regional Resource Centre for Asia and the Pacific (UNEP/RRC-AP) and SACEP in collaboration with national government from the eight participating countries. The countries are providing national resources for the implementation of the Malé Declaration. The Stockholm Environment Institute (SEI) provides the technical support to the Declaration. The eight countries of South Asia participate in the Declaration: India, Bangladesh, Bhutan, Iran, Maldives, Nepal, Pakistan, and Sri Lanka. In the case of India, the Ministry of Environment and Forest is the national focal point for the Declaration and the Ministry has appointed the Central Pollution Control Board (CPCB) as the National Implementing Agency to undertake the scientific work required. A baseline study and a national action plan for the implementation in India and other countries have already been prepared. SACEP is an inter-governmental sub-regional organization. The aims and objectives of SACEP are: to promote and support the protection and enhancement of the environment of South Asia individually, collectively and co-operatively, to encourage the judicious use of the resources of the environment with a view to alleviating poverty, reducing socio-economic disparities, and to improve the quality of life of the people.
UNEP/RRC-AP envisions being the key agency in the Asia-Pacific region for environmental data and information. UNEP/RRC-AP is implemented in collaboration and partnership with a collaborative assessment network comprising of national sub-regional and regional institutions in the Asia Pacific region.
The Stockholm Environment Institute (SEI) is an independent, international research organization committed to the implementation of practices supportive of global sustainable development. SEI conducts a comprehensive research, consulting and training programme that focuses on the links between ecological, social and economic systems at global, regional, national and local levels. In its commitment to bridge the gap between science and policy-making, SEI employs innovative methods to communicate its work to governments, the private sector and society as a whole.
189

Phase I Phase I of the Malé Declaration focuses on agreement and awareness raising. Activities under Phase I include the establishment of a network based on the existing institutional structure and network of the United Nations Environment Programme’s (UNEP) Environment Assessment Programme for Asia and the Pacific (UNEP/EAP-AP). The main objective of the network is to develop links between regional experts and policy-makers. The ministries of environments are the policy level focal points. The ministries nominate the National Implementing Agencies (NIAs) to carry out the national baseline studies and action plans. The establishment of the National Focal Points (NFPs) in Ministries of Environment and the designation of NIAs by the NFPs was completed by 1999. The NIAs developed baseline studies and national action plans for each country. The baseline studies were then developed to ascertain the status of air pollution knowledge and research in the countries and identified gaps. The objective of baseline studies is to gather national information on air pollution in order to facilitate the implementation of the Malé Declaration to achieve significant environmental and public health benefits through reductions in emissions of air pollutants. The action plans outlined activities to fill the gaps in order to build a firm basis of future agreements on air pollution emissions. The objective of the action plan is to carry out activities that fill gaps in knowledge or understanding required for the development of the policy process. Implementation of the action plan puts in place expertise, equipment and information for quantitative monitoring, analysis and policy recommendation for eventual prevention of air pollution. Phase II Phase II of the Malé Declaration focuses on capacity building and is currently in progress (2001-2004). At the final workshop held in March 2000, baseline studies and action plans were reviewed and agreement reached on the Phase II of the implementation plan. A review of the baseline studies and national action plans shows gaps in the existing monitoring system. Phase II implementation aims to achieve the following capacity building objectives: • Further development of the NFPs/NIAs network, including the development of
National Advisory Committees; • Initial development of a monitoring network; • Carrying out parallel studies on integrated assessment modelling and emission
inventory methodologies. Phase III This phase will focus on tackling air pollution problems by using information and knowledge concerning air pollution problems in South Asian countries as a basis for the further development of the policy cycle in the region. Studies informing the policy process will continue into pollutant emission inventories; modelling atmospheric transfer of air pollutants; monitoring pollutant depositions and concentrations; assessing the risk of impacts to health, crops, materials and ecosystems; mitigation options; and developing/using integrated assessment models.
190

Network Development The established network is to be expanded during this phase at national, sub-regional and regional levels. The decision-making body of the Malé Declaration is the Steering Committee made up of the NFPs, UNEP and SACEP. Technical implementation is carried out under the auspices of the Technical Committee, comprised of the NIAs, the Monitoring Committee (MoC), UNEP, SACEP and SEI. Each year a network meeting of members of the Steering and Technical committees and invited technical experts is held to review progress. At the national level NIAs will incorporate more national experts and institutions into the process by developing National Advisory Committees and they will broaden participation through the development of national stakeholder meetings. More collaboration will be effected with other related activities in South Asia, e.g. Indian Ocean Experiment (INDOEX). At a regional level, close links will be forged with other major players in the Asia-Pacific region, such as the East-Asia Network on Acid Deposition (EANET), Integrated Monitoring Program on Acidification of Chinese Terrestrial Systems (IMPACTS), and the Composition of Asian Deposition (CAD), Pollution Monitoring for the Malé Declaration A network of monitoring stations is being developed to provide the Malé Declaration with information about the level of regional-scale air pollution. The monitoring sites will be located in rural areas remote from point sources of pollution and will be able to provide information about long distance transport of air pollutants. The activities are being technically supported by the Monitoring Committee (MoC) who are responsible for advising national monitoring institutions, creating manuals and ensuring the quality and sustained development of the monitoring network. At each station, rainwater, particulate matter and certain gaseous pollutants will be sampled. A number of parallel studies will be carried out to prepare information and tools required by the policy process in South Asia. Currently, the emphasis is placed on the development of an integrated assessment tool which combines emissions, atmospheric transfer of pollutants, regional impacts (such as acidification) and mitigation options. As part of this process an emissions inventory manual is being produced. All these tools are being developed with intense consultation and collaboration of the NIAs. EANET The adverse effects of acid deposition in East Asia will become a critical problem in the near future. Expert meetings have been held four times since 1993 to discuss the state of acid deposition in the region, its effects on ecosystems and possibility of developing regional cooperation on this issue. One conclusion from the expert meetings was that a comprehensive approach was most appropriate for assessing the impacts of acid deposition due to multiple factors such as deposition acidity, chemical components and soil sensitivity. In addition to the measurement of pH, the results of the expert meetings recommended that acid deposition monitoring should be improved and strengthened to cover chemical components. At present it is difficult to evaluate the state of acid deposition in East Asia due to the availability of monitoring data, monitoring methods and the different analytical techniques used in each country. The expert meetings agreed on the desirability of establishing a regional collaborative monitoring network. For this purpose, the expert meetings developed a preliminary outline for the design of such a network as well as proposed guidelines for monitoring methods.
191

The First Intergovernmental Meeting on the Acid Deposition Monitoring Network in East Asia was held in March 1998 in Yokohama, Japan. The meeting discussed the fundamental characteristics of the Network such as objectives, activities, establishment period, and institutional and financial matters, and identified the tentative “Design of the Acid Deposition Monitoring Network in East Asia (EANET)”. Objectives The Network is intended to be established by the Second Intergovernmental Meeting taking into account the results of the preparatory-phase activities, which will have been implemented prior to the formal establishment of the Network. The Network has the following objectives: • to create a common understanding of the state of the acid deposition problems in the
East Asia • to provide useful inputs for decision-making at local, national and regional levels
aimed at preventing or reducing adverse impacts on human health and the environment due to acid deposition
Activities From April 1998, preparatory-phase activities for the EANET have been implemented on an interim basis to provide useful inputs to the Second Intergovernmental Meeting, tentatively to be held in mid-2000. During the preparatory-phase, each participating country implements acid deposition monitoring with specified methods and variables to the extent practical with available resources. In addition, the following activities are carried out: 1. development and implementation of quality assurance/quality control (QA/QC)
programs; 2. development and implementation of training programs; 3. compilation, evaluation, storage of, and provision of access to information; and 4. preparation of a report on the state of the acid deposition problem. The results of the preparatory-phase activities are reviewed by the Second Intergovernmental Meeting to facilitate discussion on the activities and institutional and financial arrangements of EANET. Some of the main outcomes of the meeting are outlined below: • Examination of the feasibility of the designed network activities and relevant
guidelines and technical manuals • Provision of time for participating countries to further develop national monitoring
systems for the Network • Formulation of policy recommendations for the further development of the Network Structure For the implementation of the preparatory-phase activities, three interim bodies namely the 1) Interim Scientific Advisory Group, 2) Interim Secretariat, and 3) Interim Network Center, were established. The Interim Scientific Advisory Group consists of scientists/experts nominated from each participating country and implements tasks
192

concerning the scientific aspects of the preparatory-phase activities. The Environment Agency, Government of Japan, has been designated as the Interim Secretariat and the Acid Deposition and Oxidant Research Center was established in Niigata, Japan, as the Interim Network Center. The Working Group, composed of representatives of the participating countries, acts as the decision making body during the preparatory phase. Participants The Network consists of countries in the East Asian region, which includes Northeast and Southeast Asia, expressed at the Second Intergovernmental Meeting in April 1999, their intention to participate in the Network ; China, Indonesia, Japan, Malaysia, Mongolia, Philippines, Republic of Korea, Russian Federation, Thailand, Vietnam. KITAKYUSHU INITIATIVE Kitakyushu is a city renowned for having successfully overcome the environmental pollution that was once very severe in its urban area. The city aimed to form a cooperative arrangement to assist a number of local authorities in the Asian and Pacific region. The “Kitakyushu Initiative for a Clean Environment” was developed in close cooperation with the city authorities to take maximum advantage of their determination to contribute, through their experience, for the purposes of making tangible process in the environment and development in Asia and the Pacific. The First Meeting of the Kitakyushu Initiative Network was organized by UN-ESCAP in cooperation with the Institute for Global Environmental Strategies (IGES), City of Kitakyushu, Ministry of Foreign Affairs of Japan, Ministry of the Environment of Japan, and Government of Japan, and was held on 20-21 November, 2001 in Kitakyushu. The primary objectives of the meeting included enhancing the interaction among national and local governments participating in relevant activities, and international organizations and the formulation of a programme on further promotion of inter-city cooperation through the Kitakyushu Initiative Network. The Second Meeting will be held in 2003 and the third in 2004 or 2005.
Objectives The Kitakyushu Initiative attempts to draw lessons from the city's practices and experiences and put them together as a menu of effective action that could be useful in other cities in the region. In order to explore the applicability of the experience of Kitakyushu to other cities of the region, it is essential to consider the socio-economic and technological conditions that ensured the success of reducing environmental pollution in Kitakyushu. It is also understood that, in the application of this initiative, good practices and successful programmes from elsewhere should be fully taken into consideration. The initiative is intended to assist in the implementation of the regional action programme on environmental quality and human health. Its aim is to achieve measurable progress in a given time frame, in improving the environment in the urban areas in Asia and the Pacific, principally through local initiatives aimed at control of air and water pollution, minimisation of all kinds of wastes and alleviating other urban environmental problems.
193
The Kitakyushu Initiative Network for a Clean Environment promotes the participation of local governments of UN-ESCAP members and associate members. The Network has the primary function of being a permanent forum to strengthen intercity cooperation in implementing the Kitakyushu Initiative in Asia and the Pacific. Activities To monitor achievements in implementing the Kitakyushu Initiative, quantitative targets will be set for a few action areas for a certain number of measurable indicators. In order to achieve these quantitative targets, policy and action targets need to be developed. The indicators are intended to measure the effectiveness or success of the policies to enable periodic review and adjustment. The indicators would first be measured at the local level and then aggregated for the national and regional level, and the detailed measurement and aggregation procedures will be further defined through continuous consultation.
The Kitakyushu Initiative aims is to improve air quality by meeting WHO standards or local standards where they exist and focuses on the following Action Areas: • enhanced integrated urban planning strategies; • improvements in water quality to meet WHO standards or local standards; • management of wastes to meet minimum hygienic standards and reduction of per
capita waste generation; and • capacity-building, awareness-raising and stakeholder participation. CLEAN AIR INITIATIVE FOR ASIAN CITIES The Clean Air Initiative for Asian Cities (CAI-Asia) intends to promote and demonstrate innovative ways to improve the air quality of Asian cities through partnerships and sharing experiences. CAI-Asia has brought together relevant stakeholders from government, private sector, and civil society that have an interest in improving air quality in major cities in Asia. In addition to these local stakeholders, CAI-Asia intends to include international development agencies, internationally organized NGOs, and private sector entities that have a collective advantage and are interested in assisting cities in Asia to address their air quality problems. The general objective of CAI-Asia is to increase the capacity of Asian cities to effectively tackle their air pollution problems. It aims to deepen the understanding and to broaden the acceptance of the region’s best practices into improved policies and programs, and effectively communicate the lessons from experience to targeted audiences. CAI-Asia intends to achieve this objective by: sharing knowledge and experiences on air quality management; improving policy and regulatory frameworks at the regional level; promoting the implementation of integrated air quality management strategies and regulations; and piloting projects to encourage innovation.
CAI-Asia builds on the large body of existing experience of its participating organizations such as cities, government agencies, companies, academia, civil society (e.g., NGOs) and international development organizations. While CAI-Asia is designed to raise awareness
194

and disseminate good practice it is not intended to be a source of funds for planning and implementation of air quality management projects and programs. The geographic scope of CAI-Asia includes South Asia, South-East Asia, and East Asia. The primary emphasis is on cities which have significant air quality problems and which have expressed a willingness to tackle air pollution in a broad-based manner involving concerned national government agencies, private sector groups, civil society groups, and representatives from academia and media. Smaller cities in Asia that demonstrate a specific interest in the activities of CAI-Asia can also take part in the Initiative. CAI-Asia addresses air pollution from mobile sources, stationary sources, and area sources. CAI-Asia does not intend to duplicate or overlap with ongoing programs and projects at the regional, national, or local city levels (e.g., from WB, ADB, WHO, UNEP, US-AEP, UN-ESCAP, bilateral donor organizations, and private sector companies) in the sector. Rather, coordinates with such activities to maximize the impact of CAI-Asia activities. Member organizations of CAI-Asia already undertake different types of activities related to air quality management such as the organization of workshops and the formulation and implementation of action plans or pilot projects. CAI-Asia actively encourages member organizations to increase their air quality management-related activities. It focuses its efforts on those activities where there is a clear advantage of working collectively, and with those member organizations who have voluntarily expressed interest in implementing them under the umbrella of the Initiative. CAI-Asia promotes the sharing of information on each partner’s activities and includes these activities on its website. It seeks active cooperation with existing networks of cities in Asia such as City Net and the network proposed under the Air Pollution in the Mega-cities of Asia (APMA) project supported by UNEP, WHO, Stockholm Environment Institute, and Korea Environment Institute. As CAI develops into a credible and effective regional network, more opportunities for synergy among partner activities will naturally evolve. AIR POLLUTION IN THE MEGACITIES OF ASIA PROJECT The Air Pollution in the Megacities of Asia (APMA) project was initiated in November 2000 by the United Nations Environment Programme (UNEP) and the World Health Organization (WHO) in collaboration with the Korea Environment Institute (KEI) and the Stockholm Environment Institute (SEI). APMA builds upon UNEP/WHO efforts on air pollution in Megacities under the Urban Air Quality Monitoring Programme (GEMS/Air), which formed part of the UN Global Environment Monitoring System (GEMS) to acquire scientific data and information on the environment through monitoring and assessment. The APMA project focuses on the development of policy to address urban air pollution in large Asian cities. It aims to increase the capacity of governments and city authorities to deal with urban air pollution issues by developing regional action plans and establishing an urban air pollution network for Asian Megacities. APMA is being funded by the Korea Ministry of the Environment (MoE-Korea) together with the Swedish International Cooperation Development Agency (Sida) as part of Sida’s Regional Air Pollution in Developing Countries (RAPIDC) Programme. The overall objective of the APMA project is to contribute to the improvement of urban air quality in large urban conurbations and megacities in Asia and to reduce the impact on
195

human health to achieve a more sustainable urban environment. The APMA project aims to strengthen Air Quality Management (AQM) practice in large urban conurbations and megacities of Asia by establishing an information network to provide information on AQM, technical support and training and to facilitate the adoption of regional and local AQM action plans. The APMA project has three main objectives: Information Provision - to undertake a benchmarking exercise for AQM in Asia by
collating and disseminating existing information on urban air quality, determining gaps in information and identifying best practice and lessons learned
Technical Support and Training - to provide technical support specific AQM related issues and to provide appropriate training in order to enhance capacity in the region
Regional and Local AQM Action Plans - to facilitate the harmonization of AQM approaches and the adoption of regional and local AQM action plans
The APMA project is aimed at increasing the capacity of the following stakeholders to deal with urban air pollution issues: National and local governments; Transport, energy and industry organizations; Organized society and non-governmental organizations responsible for education,
training and awareness of the population; Academic and scientific institutions; and International organizations, responsible for providing technical, financial, and human
support. The cities being considered in the APMA project include: Bangkok, Beijing, Busan, Calcutta, Chongqing, Colombo, Dhaka, Guanzhou, Hanoi, Hong Kong, Jakarta, Karachi, Katrhmandu, Manila, Mumbai, New Delhi, Osaka, Seoul, Shanghai, Singapore, Taipei and Tokyo. In order to avoid duplication and work towards more efficient and comprehensive approaches to regional urban air quality management in Asia, APMA and CAI-Asia have planned to collaborate and work together on various air quality issues in Asia. CONCLUSION Many countries in Asia have been experiencing the effect of air pollution especially a deterioration of air quality in major and mega cities. There is an urgent need for the issue of urban air pollution to be addressed in the short time as the situation has already reached a critical dimension affecting human health, the natural economy and the natural ecosystem. Considering the acceleration of economic condition in the region in the 21st century, air quality is expected to worsen. Even though many initiatives have been introduced in the region, they have not always resulted in a rapid change in the situation. This is partly due to political will which has slowed down the implementation of such initiatives, with some actions being implemented too late to achieve the necessary changes.
196

In order to facilitate efficient and effective implementation of the regional action programme, a priority mechanism for implementation is required. On going international initiatives should strengthen linkages and develop a synergy allowing mutually beneficial partnership to be developed. If current initiatives can be implemented in a coordinated way then this would provide a more effective approach to address air pollution in the region. An overall networking is required to encourage the exchange of initiatives and expertise, to be proactive in developing local air quality management initiatives. Networking can allow Asian countries to gather into one place and to assist in improving local air quality management initiatives in Asia. It can help: • to promote regional co-operation among Asian countries and other similar air-pollution
related initiatives and develop and implement regional action. • to increase awareness of air pollution issues through Asia and to act as a forum for
sharing the experience of air pollution management among stakeholders, such as experts and policy makers in Asia.
• to develop practical regional implementation action. The APMA project recently launched a new website in order to link each initiative addressing the problem of urban air pollution in the region. And many international organizations such as UNEP, WHO, World Bank need to be more active to participate in the initiatives. They may be able to solve the more sensitive problems, such as the political problem. And also a lot of experienced institutes from other regions such as SEI (Stockholm Environment Institute) assistance would be needed for their valuable experiences. The collaborative efforts of APMA and CAI-Asia, along with other initiatives, are an example of the current actions that will help to facilitate such networking on air quality management in the Region and improve the health, economic and environmental well being of Asia. REFERENCES Asian Development Bank (2001) Fire, Smoke, and Haze – The ASEAN Response
Strategy,2001,ADB ADORC (2001), EANET, 2001, Japan, Internet address: http://www.adorc.gr.jp/eanet Brandon, Carter and Ramesh Ramankutty (1993) Toward an Environmental Strategy for
Asia, World Bank Discussion Papers #224, World Bank Clean Air Initiative for Asian Cities (2001) Clean Air Initiative (CAI) for Asian Cities
Charter, 2001, Manila, Philippines IGES/UNESCAP (2001), Kitakyushu Initiative for a Clean Environment- Agenda and
Report of First Meeting, 2001, Japan MOE (2000), Green Korea 2000 – Towards an Eco-Efficient Society for a New Era, 2000,
MOE, Korea NIER (2001), LTP Project, 2001, Korea SAARC (2001), South Asia Association for Regional Cooperation, 2001, SAARC, Internet
address: http://www.saarc.org SACEP/UNEP/SEI (2000) Malé Declaration on Control and Prevention of Air pollution
and its likely Transboundary Effects for South Asia
197

Stockholm Environment Institute (SEI) (2000) “Regional Air Pollution in Asia” Regional Air Pollution in Developing Countries , SEI, Stockholm, Sweden, Internet address: http://www.york.ac.uk/inst/sei/rapidc2/asia/aspoltex.html
UNEP (2001), Report of the 7th meeting of Senior officials on Environmental cooperation in North-East Asia, 2001, Beijing, Korea
UNEP (2001) Malé Declaration on Control and prevention of Air pollution and its likely Transboundary Effects for South Asia, 2000, UNEP, Internet address: http://www.unep.org/unep/regoffs/roap/male
UNESCAP (2001) Kitakyushu Initiative for a Clean Environment, 2001, UNESCAP, Internet address: http://www.unescap.org/mced2000/kitakyushu.pdf
World Bank (2001) Clean Air Initiative, 2002, Washington, DC, Internet address: http:// www.worldbank.org/cleanair/
198

14 ENHANCING THE CAPACITY FOR EFFECTIVE URBAN AIR QUALITY MANAGEMENT IN ASIA
John E. Hay, Regional Office for Asia and the Pacific, United Nations Environment Programme, Bangkok, Thailand
INTRODUCTION Thirteen of the world’s largest urban centres (megacities with more than 10 million residents) are in the Asia-Pacific region. By the year 2015, Asia will have 27 of the 33 largest cities. Currently most megacities exceed World Health Organisation (WHO) guidelines for particulate matter by a factor of at least three and in some cases it is ten times higher. Levels of smoke and dust, a major cause of respiratory diseases, are generally twice the world average. Quality of air in terms of carbon monoxide (CO), sulphur dioxide (SO2),and nitrogen oxides (NOx) are in many cases above the WHO standards despite initiatives taken by many governments. High traffic volumes and frequent congestion, as well as industrialisation, are the major causes of air pollution in these cities. Specifically, excessive industrial emissions, poor quality of fuel and inefficient and insufficient public transport systems are the principal factors behind the increasing air pollution. According to some estimates, automobile emissions account for two-thirds of the pollutants. Local reductions in particulate air pollution are being achieved in some countries by switching to cleaner fuel. Phasing out of leaded gasoline in some countries in some countries is resulting in the reduction of lead pollution but in many cities the levels of lead in air remain dangerously high. Health affects of air pollution are serious threats to the inhabitants of large urban centres. This paper identifies and elaborates the steps that need to be taken in order to enhance the capacity for effective management of air quality in the megacities of Asia, thereby increasing the ability to remedy the environmental problems summarized above. A broad, holistic view of capacity enhancement is advocated, including monitoring, assessment and prediction of pollution levels and the attendant impacts, establishing and enforcing legal provisions, promotion of clean fuels and technologies, use of economic instruments and voluntary provisions, strengthening of institutional mechanisms for coordination of, and cooperation with, the multiple key players and stakeholders, including enhancing public awareness and participation, and sharing of data and other forms of information. POLICY-ORIENTED MODELS FOR ADDRESSING AIR QUALITY ISSUES Approaches to air quality management have undergone substantial evolution over recent decades. This is demonstrated in Figure 14.1. From the 1960s, when problem identification was the focus, we now have an emphasis on problem prevention and on highly integrated approaches to urban environmental management (of which air quality management is an important part), as captured by the systems approach of urban ecology. Thus it is now very clear that enhancing the capability of key players to improve the air quality of the megacities of Asia must take place in the context of an integrated and comprehensive policy framework. Only if such a framework is in place will it be possible to achieve the desired environmental and related outcomes related to improved air quality.
199

1960s
1970s
1980s
1990s
ProblemIdentification
Problem “Fixing”
Problem Prevention
?2000s
Urban Ecology
Potential forImprovedAir Quality
1960s
1970s
1980s
1990s
ProblemIdentification
Problem “Fixing”
Problem Solving
Problem Prevention
?2000s
Urban Ecology
Potential forImprovedAir Quality
Figure 14.1 The evolution of approaches to urban air quality management An increasingly common high-level approach to environmental management is to adopt some variant of the Pressure-State-Response (PSR) model (see Figure 14.2) which is based on a concept of causality. This is despite its overtly anthropocentric focus. Human activities exert pressures on the environment, changing both its quality and the quantity of environmental services that can be provided. These changes alter the state, or condition, of the environment. The human responses to these changes include any organised behaviour which aims to reduce, prevent or mitigate undesirable changes. In the context of addressing urban air quality issues, pressures on the environment are a consequence of pollution discharges, these in turn bring about changes in natural, managed and human ecosystems, prompting such actions as regulating emissions and efforts to reduce exposure to the atmospheric contaminants.
Figure 14.2 The Pressure-State-Response Model Source: Ministry for the Environment, New Zealand (1997)
200

In terms of the policy process itself, this generally consists of three levels (see Figure 14.3). If efforts directed at capacity enhancement are to be fruitful there needs to be full integration both within, and between, these levels.
Assessment
Outcomes Eg air quality, urban environment,
Standard of living
Patterns of interaction
Institutional arrangements: administrative rules, eg work conditions in
factories, planning laws
OPERATIONAL LEVEL firms, households
ORGANISATIONAL LEVEL departments, agencies, local government,
school boards, iwi authorities
Institutional arrangements: organisations, rules, laws, taxes, property rights
POLICY LEVEL Legislature, judiciary, executive
(formulation of the sort of society we want)
Figure 14.3 The policy process. Source: Ministry for the Environment, New Zealand The prerequisites for sound policy analysis provide a helpful indication as to where capacity enhancement efforts should focus when improved policy outcomes are desired. These prerequisites include: •
• • • •
•
Maximum possible information, including the economic, social, cultural and environmental sectors; Clear understanding of relevant objectives and values; No predetermined solutions; No vested interest in the outcome(s); Rigorous application of cross-disciplinary analytical techniques such as cost-benefit analysis and environmental technology assessment; and Clear presentation of options and recommendations to decision makers.
201

These prerequisites, and other elements of the policy management process, are operationalised in Figure 14.4 in the context of the governmental process. A similar management process is also pertinent to the private sector.
Public Interest Groups
Political Institutions
Other External Pressures
MO
NIT
OR
ING
SOLUTION OPTIONS- Regulation - Information - Service Delivery - Do Nothing
RECOMMENDED SOLUTION/OUTPUT
DECISIONS BY GOVERNMENT
IMPLEMENTATION
ACTUAL OUTCOME
PROBLEMS/BARRIERS
DESIRED OUTCOME Values
Outcomes Community Values Analytical Methods
POLI
CY
AN
ALY
SIS
Figure 14.4 The governmental policy management process Source: Ministry for the Environment, New Zealand The preceding policy-related frameworks and processes are highly relevant in terms of understanding and strengthening the operational components of an integrated air quality management programme, such as is described in Figure 14.5. The pressures that degrade air quality are typically characterised by way of ambient monitoring, atmospheric dispersion modelling and emissions inventories. The ultimate objective of these assessment activities is to generate information and understanding that can be used to make informed decisions about how to best manage and improve air quality. The assessment tools provide the scientific basis for developing policies and strategies, for measuring compliance with guidelines or standards, and tracking progress towards environmental goals or targets. Implementation of the policies, strategies and plans are by way of a variety of instruments (regulatory, voluntary) and involves public awareness and action. Coordinated capability enhancement across all components shown in Figure 14.5 is essential to achieving the desired improvements in urban air quality.
202
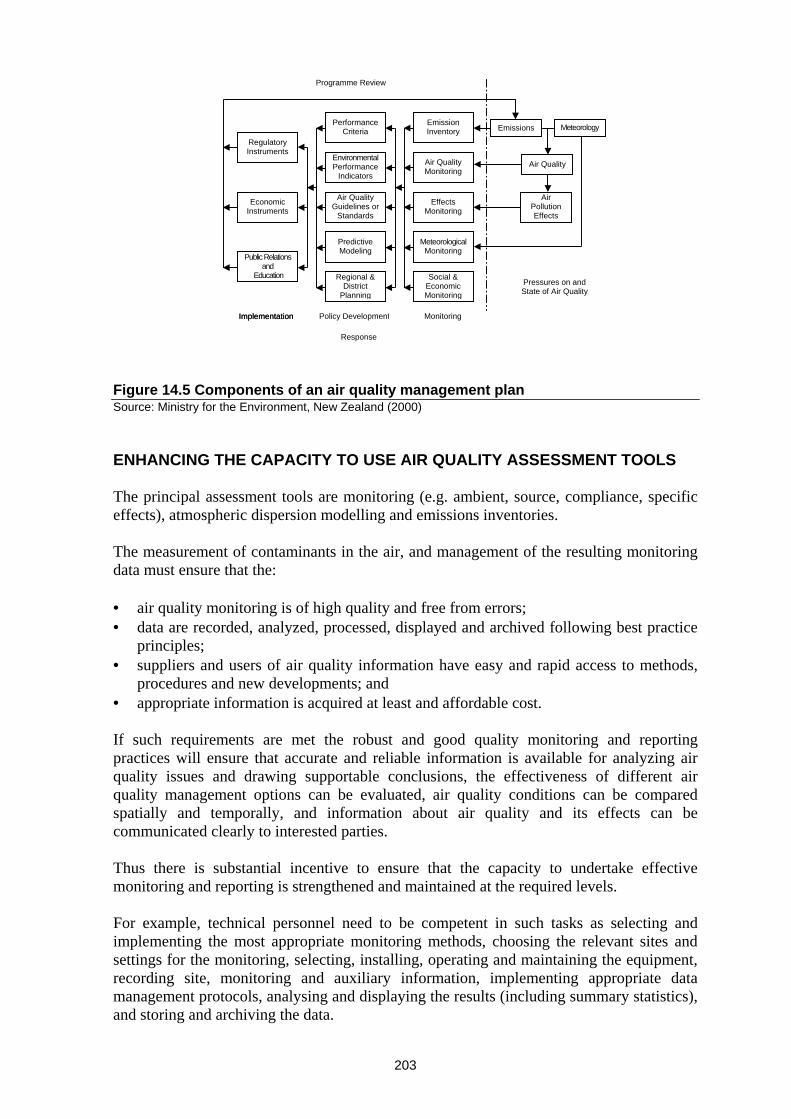
Response
Programme Review
Monitoring Policy DevelopmentImplementation Implementation
Pressures on and State of Air Quality
Meteorology
Emissions
Air Quality
Air Pollution Effects
Emission Inventory
Air Quality Monitoring
Effects Monitoring
Meteorological Monitoring
Social & Economic Monitoring
Performance Criteria
Environmental Performance
Indicators
Air Quality Guidelines or
Standards
Predictive Modeling
Regional & District
Planning
Public Relations and
Education
Economic Instruments
Regulatory Instruments
Figure 14.5 Components of an air quality management plan Source: Ministry for the Environment, New Zealand (2000) ENHANCING THE CAPACITY TO USE AIR QUALITY ASSESSMENT TOOLS The principal assessment tools are monitoring (e.g. ambient, source, compliance, specific effects), atmospheric dispersion modelling and emissions inventories. The measurement of contaminants in the air, and management of the resulting monitoring data must ensure that the:
air quality monitoring is of high quality and free from errors; • •
•
•
data are recorded, analyzed, processed, displayed and archived following best practice principles; suppliers and users of air quality information have easy and rapid access to methods, procedures and new developments; and appropriate information is acquired at least and affordable cost.
If such requirements are met the robust and good quality monitoring and reporting practices will ensure that accurate and reliable information is available for analyzing air quality issues and drawing supportable conclusions, the effectiveness of different air quality management options can be evaluated, air quality conditions can be compared spatially and temporally, and information about air quality and its effects can be communicated clearly to interested parties. Thus there is substantial incentive to ensure that the capacity to undertake effective monitoring and reporting is strengthened and maintained at the required levels. For example, technical personnel need to be competent in such tasks as selecting and implementing the most appropriate monitoring methods, choosing the relevant sites and settings for the monitoring, selecting, installing, operating and maintaining the equipment, recording site, monitoring and auxiliary information, implementing appropriate data management protocols, analysing and displaying the results (including summary statistics), and storing and archiving the data.
203
An emissions inventory is a compilation of pollution emission estimates for sources such as electric utilities, motor vehicles, industrial processes and natural sources. The results are typically combined with monitoring and modelling results to assess local and regional air quality. Other uses are in health risk assessments, development of regulations, standards etc, in giving regulatory approvals and setting conditions, as a management tool for assessing performance of industry and other key players, as a basis for charges and incentives, for apportioning blame and liability, as a planning tool, including evaluation of policy options, and for validation of air quality models. Inventory methods include the traditional “bottom up” approach where the inventory is based on an aggregation of detailed surveys of point sources and the “top down” approach which involves prorating national data on basis of scaling factors to obtain the required spatial detail. Limitations of the former approach include the inability to survey all point sources and problems with including non-point sources. In order to ensure the inventory is comprehensive and provides the required level of detail, implementing the inventory procedures is often time consuming and expensive. Limitations of the “top down” approach include issues related to the validity and applicability of emission factors, a lack of emission factors for some processes and contaminants, the validity of spatial scaling factors, the compatibility of the methods used to generate the national totals, the double accounting (e.g. of point and non-point sources), and the difficulty of validating the inventory findings. These and other limitations need to be overcome through concerted programmes that involve not only the air quality management agencies but also the private sector and educational and research and development institutions. Typically atmospheric dispersion models are used in conjunction with meteorological and emissions data to: •
• • •
predict ground-level concentrations of pollutants emitted from one or more sources, where ambient measurements are not available; assess the effectiveness of stack height changes and various control technologies; determine effects of new sources; assist in designing and assessing monitoring networks;identify the principal contributors to existing air pollution problems; and study potentially hazardous situations, such as low probability/high risk scenarios.
Given the obvious importance of atmospheric dispersion modelling as one of the suite of assessment tools, it is apparent that considerable effort needs to be devoted to ensuring that there is adequate capability, in terms of institutional, human, information and technical capacity, to undertake the requisite studies. ENHANCING THE CAPACITY TO ESTABLISH AND UTILISE PERFORMANCE MEASURES Air quality standards specify the concentrations of contaminants in ambient air that will ensure no adverse effects will occur in short or long term. In many cases the current uncertainty in scientific knowledge precludes establishing, unequivocally, these critical levels. In many cases guidelines rather than standards are used. Selection of the ambient air pollutants to be covered by either the standards or guidelines is usually made on the basis of danger to human health and well being, presence in the ambient air, identified threshold levels below which no adverse health effects will occur and the contaminants are regulated
204

by other countries with air quality management plans. In addition to widespread presence in environment, other considerations are the severity of effects from exposure, the number of people exposed, the potential for the pollutant to transform into additional hazardous compounds, persistence and the potential to bioaccumulate. Guideline values can be established for each pollutant, based on such factors as the sources of the pollutant, existing levels in the environment, known routes of exposure, the pollutant’s kenetics and metabolism and the lowest concentration at which effects on humans, animals, plants may be observed. Often “margins of safety” are added. Another powerful management tool is the air quality indicator. Indicators are information tools, providing quantitative measures that summarise complex environmental conditions and indicate the status of, and trends in, those conditions. Thus indicators serve three basic functions: simplification, quantification and communication. To be useful as a management tool and indicator must be analytically valid, cost effective, simple and easily understood and policy relevant. In the context of air quality, relevant indicators include measures of contaminants discharged into the air (source indicators), measures of concentrations of contaminants in air (physical/chemical indicators), and measures of the effects of air contaminants (health/environmental indicators). Examples of source indicators are fuel consumption, volatile hydrocarbon production, and vehicle kilometres travelled. Examples of physical/chemical Indicators include CO, particulate matter, total suspended particulate (TSP), inhalable particulates less than 10 microns (PM10), particulate matter less than 2.5 microns (PM2.5) and visibility reducing particulates (0.1-2 microns). Examples of environmental and human health indicators include air quality complaints, hospital admissions relating to degraded air quality, odour complaints, impaired visibility and air contaminants in the human body (e.g. blood, hair, teeth). Air quality indicators can be compared to guideline values, allowing development of categories of air quality for compliance and policy assessment purposes. Indicators can be used to assess conditions at “benchmark” sites - e.g. where the air quality is “natural” – allowing “baseline” conditions to be established retrospectively and also for trend analysis to assess changes in air quality over time. Such assessments identify the efficacy of air pollution abatement policies and plans. For example, air quality categories could be defined as: • • • • •
Action – ambient concentrations exceed the guideline value; Alert - 66 to 100 per cent of guideline; Acceptable - 33 to 66 per cent of guideline; Good - 10 to 33 per cent of guideline; and Excellent - < 10 per cent of guideline
Establishment and effective use of performance measures such as guidelines and indicators is critical to the sustained and sound management of atmospheric resources. Every effort should be made to ensure than the required institutional, technical and financial support is available to facilitate such efforts, and that the necessary expertise is also available.
205

ENHANCING THE CAPACITY TO IDENTIFY AND IMPLEMENT A SUITE OF APPROPRIATE MEASURES Air pollution abatement involves application of a complex suite of measures, tools and instruments including land use zoning, introduction of economic instruments, regulation of emissions from point sources, regulation of emissions in order to achieve ambient air quality targets, and regulation of emissions to avoid unacceptable effects, technological interventions and uptake of voluntary incentives promoted through education and awareness raising. Economic instruments are often applied under the “Polluter Pays Principle”, through the impositions of taxes based on emission and pollution loads, through the reduction of subsidies on highly polluting fuels, and by way of subsidies that encourage the minimization of hazardous wastes and use of toxic chemicals. Regulatory controls can foster the use of clean technologies by industry and in vehicles, and also include zoning criterion for new industries and stringent standards for emissions from internal combustion engines. Technological interventions include improvements in energy efficiency, emission control technologies, use of alternate fuels and other clean technologies. Such measures need to be complemented with a strengthening of national policy making and regulatory bodies with trained manpower and monitoring equipment and giving municipalities and local bodies the authority to control pollution from small-scale industries and from mobile sources such as motor vehicles. The private sector is a key partner in achieving improvements in air quality in the megacities of Asia, through such actions as continuous improvement in the efficiency of their operations and also through the provision of financial resources. Cleaner production and similar strategies provide a well defined approach for participation by the private sector, given that meeting environmental and economic targets is a win-win situation. There are many key approaches and tools available to facilitate the involvement of the private sector, including Urban Environmental Management Systems. But with reference to technology-based solutions of urban air quality problems, it is important to note that the most advanced technology may not be the “best”. A technology must be appropriate and the capacity for effective use must be assured. Civil society is also a key player in achieving improvements in air quality in the megacities of Asia. Sustainable development and democracy go hand in hand. Sustainable development requires action by each individual, family, community, business and industry. Successful solutions to problems need to be rooted in the ideas of local people, if they are to support and cooperate with change. Public participation needs to be accepted as a fundamental part of air quality management, not just an addition at the margin. People will not act if they do not feel capable and do not have the time and resources to do so. In order to engage civil society in the actions to improve the air quality of the megacities of Asia a four point strategy must be implemented in order to: • •
•
•
Ensure the public are aware of the need for action, and are ready to take action; Provide a vision of a better way to address air quality issues, so that people can see what they are working towards; Identify viable pathways so that people can see that there are practical and practicable ways to remedy the degraded air quality; and Achieve public commitment to undertake the necessary actions.
206

ENVIRONMENTAL MANAGEMENT SYSTEMS FOR CITIES AND LOCAL AUTHORITIES Currently cities in the developing countries of the Asia-Pacific region are home for the majority of the poor and deprived citizens of these countries. They are also the site and sources of the most intense environmental pressures as well as of most environmental disasters (ESCAP, 2000). The projected urban population for the Asia-Pacific region for 2020 is approximately 50 per cent of total population, a rapid increase from around 25 per cent in 1975 and 38 per cent in 1999. The consequences of this urbanisation of the region, and the required substantial, constructive responses are identified in such documents as the Regional Action Programme for Environmentally Sound and Sustainable Development in the Asia-Pacific Region, 2001-2005 and the ASEAN Environmental Action Plan, 2001-2005. The former programme was approved last year by the Environment Ministers of the Asia-Pacific region.
In response, and to help achieve successful implementation of such action plans and strategies, UNEP’s International Environmental Technology Centre (UNEP/IETC) has identified Urban Environmental Management: Cities as Sustainable Ecosystems as one of its principal activity areas. It has further recognised Environmental Management Systems (EMS) for Cities and Local Authorities as a systematic way to ensure environmental issues are managed consistently and in an ordered manner, throughout each responsible organisation. For cities and local authorities, an EMS can assist in comprehensively addressing environmental issues, while achieving increased credibility with key stakeholders, including regulatory agencies and citizens. Effectively applied, an EMS can help integrate environmental considerations with overall operations. It sets out environmental policies, objectives and targets with pre-determined indicators that provide measurable goals, and a means of determining if the performance level has been reached. The process of establishing an EMS requires “buy-in” from different levels of management and from employees. Successful implementation of an EMS creates positive change, environmental awareness and continuous improvement. UNEP/IETC, the International Federation of Consulting Engineers (FIDIC) and the International Council for Local Environmental Initiatives (ICLEI) have developed the UNEP/FIDIC/ICLEI Urban Environmental Management: Environmental Management Systems (EMSs) Training Resource Kit. The Kit is a “train the trainer” modular system designed to assist local authorities, municipalities and local governments (or trainers thereof) in the development of a practical and pragmatic approach to implementing an EMS in their own organisation. The Kit aims at answering the need for a more systematic approach to environmental problems in cities. A growing number of local authority and city managers are facing an increasing demand for environmental quality from citizens. However, despite some cities adopting and successfully implementing an EMS, the number of local authorities to do so is very small compared to organisations in the private sector. The Kit attempts to remedy the lack of education and training tools specifically designed to enable local authorities to assess the benefits, design and implement an EMS that meets their specific needs. For this reason, the Kit was designed and drafted in close co-operation with its users to be adaptable to various cultural and political situations. The Kit provides a
207
systematic approach to manage environmental issues and is based on the model of ISO 14001:1996 requirements. For those who intend to be certified against this standard, even if only at a later stage of the EMS development, the Kit provides information on how to proceed. By guiding city managers through the implementation of an EMS, the Kit also intends to provide a series of tools to integrate sustainable development planning (such as Local Agenda 21, Climate Change Convention and other international agreements) into the various aspects and priorities of city management. The Kit is targeted at change agents such as: • • • •
•
•
•
People who will promote the concept and practice of an EMS for local authorities Local government associations and training institutes Trainers who will implement the Kit by organising workshops City managers who will use it as a self-teaching tool to implement an EMS in their municipality
The Kit contains:
Thematic modules (per ISO14001:1996 element.) including Resource Kits, case studies, information material and exercises for the implementation of an environmental management system in local authorities A method for training, organising workshop (distribution) and their follow-up (feedback) Tools for the dissemination of the concept of EMS for local authorities.
UNEP and its partners will build on, and facilitate, synergies and networking to promote the use and further development of the Kit. To this end UNEP is activating its global networks of local and national authorities, professional associations and also international organisations involved in urban development. These networks will also provide the feedback necessary to make the Kit a “Living Resource” which will be improved and enriched constantly. ENVIRONMENTAL TECHNOLOGY ASSESSMENT (ENTA) There is growing recognition of the importance of applying technologies that support implementation of air quality management plans in an environmentally sound and sustainable manner. This requirement was highlighted in Agenda 21 and is now being addressed in many international, regional and national initiatives, including the International and Regional Round Tables on Cleaner Production. Environmentally sound technologies protect the environment, are less polluting, use all resources in a more sustainable manner, recycle more of their wastes and products, and handle residual wastes in a more acceptable manner than the technologies for which they are substitutes. Environmentally sound technologies are more than just the specific application of know-how. Such technologies are the total systems that include know-how, technical procedures, goods and services, equipment, and organisational and managerial procedures. Consequently, the assessment, transfer and assimilation of these technologies involves consideration of such requirements as human resources development and other local capacity building needs. Moreover, environmentally sound technologies should be compatible with nationally determined socio-economic, cultural and environmental priorities.
208

Sometimes the environmental and human health and safety impacts of a proposed technology investment are overlooked by those advocating the use of a new or upgraded technology. Policies that promote the development and use of environmentally sound technologies (often called “cleaner technologies” in the context of pollution prevention and control) have been adopted by many national agencies. An important aspect of implementing such policies is the ability to recognise the most appropriate (clean) technology among all the options under consideration. Without an appropriate method for evaluating technology options in terms of their environmental and related impacts, the process of technology transfer remains a chancy affair. Thus the tool of “Environmental Technology Assessment” – or EnTA for short – was born. EnTA is being developed and promoted by the United Nations Environment Programme’s (UNEP) Division of Technology, Industry and Economics, and specifically by its International Environmental Technology Centre (IETC) and its Production and Consumption (P&C) Unit. The P&C Unit focuses on EnTA for process technologies used by industry while IETC focuses on EnTA technologies used in urban environmental and freshwater management, whether by governments, civil society or industry. EnTA helps ensure the right decisions are made on technology choice. These can be commercial decisions of what to import, government decisions on what processes to license, decisions on what environmental technology to adopt and apply, on regulatory decisions relating to issuing a permit, decisions by community and other groups regarding support for, or opposition to, a proposed technology investment, and even decisions by exporters on how to market their new processes or environmental technologies. EnTA thus addresses the needs of various groups. It applies to local processes and technologies as much as imported ones, and can be used at small scale and for big industrial plants. It is just as useful for industry departments as it is to environmental organisations, since it reveals aspects of efficiency and effectiveness, infrastructure needs and supply chains. UNEP is an advocate of EnTA for two interconnected reasons. From the production or industry perspective, an apparently easy solution to pollution prevention is to include a treatment plant as part of the technology system. But treatment plants are expensive to buy, expensive to run, and make no return on the investment. In many cases the treatment is not as effective as is desired. The cleaner production approach avoids this dilemma by using improved and environmentally sound production technologies, and more efficient operation. The result is less pollution, and a more productive enterprise - a win-win situation. But it is sometimes hard to persuade people to adopt this approach. UNEP has been promoting the cleaner production approach for over 10 years, and there is now very satisfying uptake of the approach, by both governments and the private sector. But the growing acceptance of cleaner production brings with it a growing need to identify cleaner and safer technology alternatives. It is not always appropriate to believe the enthusiastic claims of those promoting a particular technology. Technology options should be assessed in a systematic and comprehensive manner, so that the eventual choice represents the most environmentally sound alternative, while at the same time meeting the other requirements for the intervention. As cleaner production becomes a household word, there is need for a tool like EnTA to facilitate the change. On the other hand, from a consumption perspective, solid waste and wastewater are also a consequence of resource use. Such wastes can be reduced but not totally avoided. Waste avoidance is ideal, but it is not yet popular. Waste avoidance and reduction are value laden practices that require value orientation or reorientation in societies, if they are to be accepted. Much of the responsibility to ensure people and individuals are aware of the
209

appropriate values and of the 'soft' technologies to apply (such as the appropriate management systems and procedures, and the practices that avoid waste, reduce waste or reuse or recycle waste) rests with municipal and other local government authorities. EnTA is a method that will help such government agencies, and local communities, identify and select the most appropriate technology option. A Manual (Anticipating the Environmental Effects of Technology: A manual for decision-makers, planners and other technology stakeholders) has been developed by UNEP to inform and guide planners, decision makers and other stakeholders regarding a practical tool that will help them identify the potential impacts of different technological choices, before any environmental problems occur. The tool aims to assist stakeholders to explore options and make informed choices about technologies that are compatible with sustainable development goals. In its simplest form, EnTA is about helping people make good choices – for the environment, as well as for themselves. The Manual presents a practical and structured approach to analysing the consequences of, and the alternatives to, a proposed technology investment. The techniques used are qualitative and exploratory. While not all environmental and related issues associated with a technology will be considered in depth, the assessment should lead to recognition of the major concerns, guide selection of the most appropriate option, and indicate whether a more in-depth analysis would be appropriate. The Manual provides practical suggestions for the use of EnTA in ways that are designed to help facilitate a dialogue between multiple stakeholders, ultimately leading to a more informed choice between selected technological alternatives. The procedures described in the Manual are not intended to discourage technological development or restrict technological choices. Rather, they are aimed at improving the environmental outcomes associated with the decisions made by planners and others making choices related to technologies. UNEP’S ENVIRONMENTAL EDUCATION AND TRAINING INITIATIVE FOR COUNTRIES OF ASIA AND THE PACIFIC (EETICAP) UNEP’s Regional Office for Asia and the Pacific is undertaking several initiatives to help ensure successful implementation of the sub-regional environmental education action plans and the complementary Regional Action Programme for Environmentally Sound and Sustainable Development in the Asia-Pacific Region, 2001-2005. The latter programme, approved last year by the Environment Ministers of the Asia-Pacific region, includes the section “Environmental Education, Training and Awareness” in Chapter G - Tools for Implementation. One initiatives is UNEP’s Environmental Education and Training for Countries of Asia and the Pacific (EETICAP). This project will help address the need to increase the motivation, knowledge, skills and actions of the key players responsible for managing the environmental and related resources of the major metropolitan centres of the Asia-Pacific region, with an initial focus on the major cities of the ASEAN region. Issues to be addressed include urban air quality. EETICAP will make a major contribution to ensuring that staff of the relevant agencies are, collectively, equipped with the practical knowledge and technical and policy-related skills necessary for the agency to meet its responsibilities related to environmental and resource management.
210

An important feature of EETICAP is the intention to achieve the planned outcomes by making maximum use of existing capabilities in the region, through such actions as: •
• •
•
•
enhancing access to existing information on state of the art policy-based instruments and tools that facilitate best practices in urban environmental management; adapting existing training materials, tools and packages; identifying cities within the region that have already adopted the principles of best practices in urban environmental management, and using these examples to encourage other cities to adopt such practices; training the trainers in relevant institutions in each city - these local trainers will in turn train those with responsibilities for maintaining and enhancing the quality of the urban environments; and developing and implementing a regional cooperation strategy for better urban planning and environmental management.
Examples of sources of relevant resources are UN/CHS (Habitat) (Urban Indicators Programme), UNEP’s International Environmental Technology Centre (Cities as Sustainable Ecosystems), the International Council for Local Environmental Initiatives’ Best Practice Study, and the Urban Environment Project of the Institute for Global Environmental Strategies. In keeping with the philosophy of maximizing the use of existing capabilities, CITYNET will be a key electronic networking system for EETICAP. The planned operational structure of EETICAP is shown in Figure 14.6. The first substantive activity towards developing a regional cooperation strategy will be the ASEAN Regional Workshop on Better Urban Planning and Environmental Management, scheduled to be held in Jakarta, Indonesia in November, 2001. The workshop will be implemented jointly by the Hanns Seidel Foundation (Jakarta Office) and UNEP’s Regional Office for Asia and the Pacific. In addition, a prototype activity will be undertaken to support effective urban environmental management in Bangkok. The institutions and individuals that have participated in the Thai National Network for Training and Research in Environmental Management (ThaiTREM) are ideally placed to participate in the planned training the trainers programme in environmental management systems for cities. Thaitrem was established by UNEP, with the support of DANCED, to assist universities in Thailand to develop multidisciplinary teaching and research programmes that would help meet the needs of public and private sector organisations whose activities have an impact on the environment. The resulting programmes are sufficiently flexible to meet the needs of mid-career professional as well as full time students who have not yet entered the work force. Strategic actions which are both effective and efficient are needed to ensure the widespread and successful uptake of EMS by agencies responsible for managing the environmental assets and resources of urban areas. In response, a series of activities will be undertaken as part of a coherent, integrated strategy that will ensure environmental issues (including urban air pollution) are managed by the responsible agencies in an integrated, systematic, accountable and transparent manner. The strategy involves using an existing EMS outreach and training resource accessible via the Web and CD-ROM, and a conventional, hands on, practical training workshop involving “learning by doing”, to transfer relevant information, develop strategic and critical understanding of urban environmental management and impart appropriate technical, managerial, policy and administrative skills. The challenge is to equip
211

institutions, and empower individuals and groups so that current urban areas are managed in a more environmentally sound and sustainable manner. Newly developed urban areas can be planned, constructed and managed in ways that avoid the environmental and human health impacts normally associated with urban land uses. There is a need to enhance the motivation, knowledge, skills and actions of the key players responsible for managing the environmental and related resources of the major metropolitan centres of the Asia-Pacific region. But there is a concomitant need for institutional changes that will ensure the environmental assets and resources of urban areas are managed in a consistent, integrated and rational manner. This project responds to the need to enhance the capacity to manage the urban environment, through a joint approach to both human resources development and institutional strengthening. The activities conducted under the EETICAP umbrella will develop a cadre of trainers who have both the knowledge and skills required to enhance the ability of individuals to manage the environment and related resources more environmentally sound and sustainable manner. They will also encourage further adoption and effective use of environmental management systems by cities in the Asia-Pacific region, thereby ensuring that cities adopting an environmental management system have staff with the motivation, knowledge, skills to ensure effective implementation of such systems Selected staff from ThaiTREM institutions will be trained through the use of a combination of the existing EMS outreach and training package and conventional, hands on, practical training through “learning by doing”. Staff of urban environment management agencies will then be equipped with the practical knowledge and technical and policy-related skills that will ensure the agency can meet its responsibilities related to environmental and resource management. As a result, cities will be committed and able to manage their environmental assets and resources in more a consistent, integrated and rational manner as a result of adopting and implementing appropriate environmental management systems. In summary, EETICAP has a focus on transferring relevant information, developing strategic and critical understanding and imparting appropriate technical, managerial, policy and administrative skills, and will achieve a balance between training in the technical- and policy-related dimensions of environmental and resource management on the one hand, and more general professional development on the other. SUMMARY AND CONCLUSIONS This paper has identified and described the actions that need to be taken in order to enhance the capacity for effective management of air quality in the megacities of Asia. A broad, holistic view of capacity enhancement was taken, including monitoring, assessment and prediction of pollution levels and the attendant impacts, establishing and enforcing legal provisions, promotion of clean fuels and technologies, use of economic instruments and voluntary provisions, strengthening of institutional mechanisms for coordination of, and cooperation with, the multiple key players and stakeholders, including enhancing public awareness and participation, and sharing of data and other forms of information.
212

213
NET
TLAP
)
Regional ♦ Technical and Policy Support
♦ UNEP’s Regional Office forAsia and the Pacific (ROAP)
♦ Private Sector Organisations♦ Nongovernmental
Organisations ♦ Financial Support
♦ Asian Development Bank ♦ Nongovernmental
Organisations ♦ Foundations ♦ Private Sector
UN
EP’s
Net
wor
k fo
r Env
iron
men
tal T
rain
ing
at T
ertia
ry L
evel
in A
sia-
Paci
fic
(
Sub-
regi
onal
Net
wor
ks o
f Urb
an E
nvir
onm
enta
l Man
agem
ent A
genc
ies
Sub-regional
♦ Southeast Asia ♦ Pacific ♦ NortheastAsia ♦ Central Asia ♦ South Asia
National
♦ Countries of the Asia-PacificRegion
Global ♦ International Advisory Board ♦ Technical and Policy Support
♦ UNEP ♦ Other UN Agencies and Bodies ♦ Specialised Agencies ♦ IGBP/START ♦ Nongovernmental
Organisations ♦ Financial Support
♦ World Bank ♦ UNDP ♦ Nongovernmental
Organisations ♦ Foundations ♦ Private Sector
♦ Sub-regional Intergovernmental
Environmental Organisations ♦ Industry Organisations ♦ Nongovernmental Organisations
♦ Urban Environmental Management Agencies ♦ Central Government Environmental Agency ♦ Universities ♦ Training Institutes ♦ Environmental Education and
Training Networks
Partner Countries, Agencies and Institutions (examples only) ♦ University of Waikato (International Global Change Institute) ♦ Griffith University ♦ Kingett Mitchell and Associates ♦ Central Government Agencies ♦ Urban Environmental Management Agencies
Figure 14.6 Schematic of Possible Institutional Arrangements for EETICAP

15 REGIONAL ACTION PLANS FOR URBAN AIR QUALITY MANAGEMENT IN ASIA
Wha-Jin Han, Korea Environment Institute, Seoul, Korea Gary Haq, Stockholm Environment Institute, York, United Kingdom Christine Kim, Korea Environment Institute, Seoul, Korea Hiremagalur Gopalan, United National Environment Programme, Nairobi, Kenya Jae-Hyun Lee, United Nations Environment Programme, Nairobi, Kenya Dietrich Schwela, World Health Organization, Geneva, Switzerland INTRODUCTION Recent estimates suggest that over one billion people in Asian countries are exposed to air pollutant levels exceeding World Health Organization guidelines (WHO 2000; WHO/EURO 2000). These estimates do not include the millions of individuals who are exposed to indoor air pollution due to biomass burning and other sources. The adverse health and environmental effects of air pollution are particularly apparent in the major and mega cities of Asia, where the problems of population growth, industrialization, ever-increasing motor vehicle use and unsustainable development are concentrated. Thousands of people die prematurely each year as a result of air pollution in Asia’s most polluted cities. According to a World Bank report (1998), in Jakarta, Bangkok and Manila, where the motor vehicle is a major cause of pollution, the social costs from exposure to airborne dust and lead accounted for nearly 10 per cent of average urban incomes in the early 1990s. In many Chinese cities a coal-based energy economy has resulted in poor air quality and even higher costs of pollution-related illness and death. Urban air quality is increasingly recognized as a major public health and environmental issue that poses a significant threat to human well-being and the environment. Unfortunately, urban air pollution in most Asian major and mega cities such as Beijing, Delhi and Hanoi has worsened. The worsening air quality in urban areas is of concern to both Asia and the global community. More than half of the World’s population lives in urban areas in Asia. Additionally, major sources of air pollution originate from and directly affect urban areas, which in turn have negative environmental effects on surrounding regions. These factors, in addition to alarming rates of urbanisation, industrialization and motorization, have increased regional concerns with regard to pollutants such as sulphur dioxide, nitrogen oxides and particulate matter. In response to the alarming air pollution problem and its effects on human health, countries from the Asian region have begun to develop their capabilities to improve urban air quality management. Following in the steps of other regional initiatives, an effective way of addressing the problem of urban air pollution is for Asian countries to be part of a regional action plan to improve urban air quality. Regional cooperation from both governmental and non-governmental sectors is necessary in order to achieve a reduction in urban air pollution in Asia. Regional action plans would need to facilitate national and international organizations in the setting of air quality objectives, improve coordination and cooperation of existing urban air quality programmes in the region and identify potential sources of funding and other resources to support air quality initiatives. Regional action plans would also need to
214

address the issue of transboundary air pollution resulting from local air pollution, which is currently being addressed by protocols such as the Malé Declaration on Control and Prevention of Air Pollution and Its Likely Transboundary Effects for South Asia. From past experience, regional action plans can be effective in acting as a catalyst for national and local action. However, the implementation and success of reaching goals and objectives have not always been achieved due to weak institutional capacities and the slow pace of reform. The major challenge for the Asian region as a whole is the integration of environmental, economic and social policies in order to achieve effective air pollution prevention and control. This is difficult due to the varying urban air quality management (UAQM) practices adopted throughout the region. This chapter describes the current status and trends in UAQM in Asia and proposes objectives and actions that are necessary for an effective regional action plan for UAQM in Asia. APPROACHES TO ADDRESSING URBAN AIR QUALITY IN ASIA The Global Air Quality Monitoring Programme was established in 1974 by the World Health Organization (WHO) and the United Nations Environment Programme (UNEP), as part of the Global Environmental Monitoring System (GEMS). In 1980 forty countries participated in this programme and provided information on air pollutant concentrations in their cities. However, only two countries provided information in 1994. During the 1990s WHO set up the Air Management Information System (AMIS) and incorporated GEMS activities (Schwela, 1999). AMIS provides comprehensive information required for effective air quality management. It includes air quality monitoring, instruments for conducting emission inventories and dispersion modelling, estimation of the global burden of disease due to air pollution and the proposal of detailed air quality action plans. AMIS also provides information on the air quality management capabilities of major and mega cities (WHO, 2001). Participation in AMIS automatically links countries to a support network of resources and expertise. Concern over air pollution in Asia began in the 1960s when universities and Ministries of Environment undertook the first air pollution measurements. In recent years Asian countries have tried to develop their institutional and technical capabilities to improve air pollution monitoring and pollution prevention and control. However, efforts to control urban air pollution in Asia have been inconsistent. Results of a regional survey conducted in 1996 and a review of international scientific literature by the Monitoring Assessment Research Centre (MARC) indicated that of the twelve countries studied: •
•
•
•
•
•
twelve countries had established national ambient air quality and emission standards but in general, they were not revised periodically; ten countries had cities with air quality monitoring networks, however, few cities had established quality assurance and quality control programmes; nine countries had prepared emission inventories, however, these inventories were usually incomplete and were not updated regularly; nine countries have established pollution control measures but only five had evaluated their impact; few countries had conducted studies using air quality models. The models, however, were usually inadequate and had limited local application; in many countries, the level of knowledge about air pollution impact on health was
215

limited or minimal even though it was considered a high or medium priority issue; • the dissemination of information, training and public awareness on air quality was
given low priority in many countries. Nonetheless, many cities in Asia including Busan, Hong Kong, Taipei and Singapore have developed comprehensive air quality management programmes. These cities have well-defined monitoring programmes and are implementing feasible air pollution prevention and control plans that have been assessed (MARC/UNEP/WHO, 1996; WHO, 2001). They have extensive information and experiences that can be valuable for stakeholders in the rest of Asia. The air pollution control measures discussed in this report demonstrate that action is currently being taken by Asian city authorities to improve urban air quality. Some countries such as India have opted for a regulatory-based air quality management system. These measures include tightening of vehicle and industrial emission stamdards, switching to cleaner fuels (unleaded petrol, reduction of sulphur in diesel, moving from coal to gas for industries) and closing or relocating polluting industries. Meanwhile, Taipei’s UAQM strategy is to enforce reduction strategies through methods of controlling mobile and fugitive sources and targeting specific air pollutants. The Republic of Korea focuses on clean fuels through scientific and systematic management of motor vehicles; while Japan targets specific legislative and technical measures. The city government of Jakarta prefers to take a “command and control strategy” via their Clean Air Programme, which involves the private sector playing a role in improving urban air quality. Bangkok has chosen to address the vehicular issue through a multi-prong approach which inlcude: emission standards for new and in-use vehicles; fuel reformulation; gasoline vapour recovery system; in-use vehicle inspection and maintenance programme; installation of catalytic converters; and mass transit system. In addition, urban air quality management through enhancing the capacity of city authorities is taking on a broader approach: monitoring; assessment and prediction of pollution levels and the attendant impacts; establishing and enforcing legal provisions; promotion of clean fuels and technologies; use of economic instruments and voluntary provisions; strengthening of institutional mechanisms for cooperation between multiple stakeholders; enhancing public awareness and participation; and sharing of data and other forms of information (Hay, 2001). While an UAQM strategy may differ according to the specific characteristics of each country, each strategy contains the basic elements of effective UAQM. However, the concerted and individual efforts of national and local authorities in Asia have faced significant barriers to urban air pollution prevention and control. The current capabilities of the local or national authorities to monitor urban air quality or to collect information on sources and emissions are inadequate. In some cities, adverse topographical and meteorological conditions result in the poor dispersion of pollution and thus intensify its adverse impacts. Not only does the concentration and combination of pollutants vary by city but so do the economic and industrial sectors. The lack of sufficient technically trained personnel and financial resources contributes to the lack of quality data, which can be a key barrier to the implementation of effective urban air quality management programmes. The rapid increase in the sources of emissions and the lack of effective strategies have resulted in urban air quality becoming a important issue for many Asian cities.
216

Although various initiatives to prevent and control urban air pollution in Asia have been taken, the existence of such initiatives does not guarantee institutional effectiveness. In some cases, regional cooperation on environmental issues has not been developed due to gaps between the planning and implementation stages. The failure of these regional initiatives is also the result of the poor exchange of information on best practice in UAQM and the lack of coordinated air pollution policies in the region. These factors have contributed to the absence of any substantive regional cooperation in addressing the issue. The increasing problem of urban air pollution and its impact on human health and environment in Asia cannot be ignored. In order to improve the situation the preparation and implementation of effective UAQM strategies is required. The simultaneous increase in urbanisation, industrialization and transboundary pollution highlights the need for action at the regional level. At present there are two ongoing regional air quality programmes in the Asian Region. The Air Pollution in the Megacities of Asia (APMA) project was initiated in December, 2000 by UNEP and WHO together with the Korea Environment Institute (KEI) and the Stockholm Environment Institute (SEI). The project is being funded by the Korean Ministry of Environment and the Swedish International Cooperation and Development Agency (Sida) under its regional air pollution in developing countries programme (RAPIDC). The main objective of the programme is to strengthen urban air quality management in the major and mega cities of Asia by undertaking a benchmarking exercise of UAQM in Asia and establishing an information network of city authorities. At a workshop on air pollution in megacities held in Seoul, Korea in September, 2001 a framework for a draft regional action plan for urban air quality management for the major and mega cities of Asia was prepared. In 2001, the World Bank (WB) together with Asian Development Bank (ADB) launched the Clean Air Initiative for Asian Cities (CAI-Asia). One of the main goals of this initiative is to promote the integrated development or enhancement of action plans to improve air quality in large urban cities. Currently, city-specific action plans are being envisaged for Bangkok, Beijing, Ho Chi Minh City, Hong Kong, Jakarta, Manila, Shanghai, Singapore and Surabaya. In partnership with the CAI, the ADB has initiated a Regional Technical Assistance (RETA) project to provide a forum for countries to share experiences and strategies to specifically reduce vehicle emissions and to set up a website to facilitate communication among stakeholders. REGIONAL ACTION PLANS FOR URBAN AIR QUALITY MANAGEMENT IN ASIA APMA and CAI-Asia stress the importance of initiating regional action plans for improving urban air pollution in the cities of Asia. The role of a regional action plan is to provide a strategy and to develop a coordinated effort in the region at local, national, and international levels for the purposes of mutual assistance. This could be through activities such as networking, information sharing, standardization of technology and opportunities for investment. One objective of this chapter is to provide an overview of the range of approaches which could be used to implement a regional action plan for UAQM in Asia. The approaches which are reviewed here for a regional action plan are important since they determine which processes, actors, frameworks, and measures should be implemented.
217

A regional action plan for urban air quality management in Asian cities should promote a comprehensive global approach to strengthen cooperation among countries. For example, the framework for the regional plan proposed at the APMA workshop aims at increasing urban air quality management actions and human health protection. The regional plan describes the activities that should be developed and implemented at the regional, national and local levels over the next 5-10 years in order to create the conditions which lead to a reduction in health threats from exposure to air pollutants. A regional action plan should cover all sectors and disciplines and should include other national and international cooperation and development agencies and should address five key strategic actions: policies, standards and regulations; air quality management measures; monitoring of urban air quality and human health impacts; education, training and public awareness; and funding. The plan should recognize the development of national and local leadership (from the government and society), which is central to addressing urban air pollution, protecting human health without inhibiting economic development. The APMA regional plan, for example, addresses both regional, national and local measures. A regional action plan also needs to based on certain principles which guide the process and support the objectives of the plan. The guiding principles outlined in the draft APMA regional plan are presented in Box 15.1. A viable regional action plan also needs clear goals and objectives. With this in mind, the goal of the APMA Regional Action Plan on Air Quality Management was framed to:
Contribute to the improvement of indoor and outdoor air quality and prevention of its deterioration in the countries of the Region within the sustainable human development framework, protecting human health with equity.
Box 15.1 Guiding principles of the APMA Regional Action Plan Universality: greater coverage of air quality management programmes Equity: air quality management improvement regardless of sex,
age, ethnicity, etc. Participation: active participation of the population in the development
and implementation of the plans to minimize air pollution and prevent the deterioration of air quality
Concerted effort: discussion and cooperation among all sectors involved Integrity: development of integrated programmes on air quality
management (prevention, monitoring, control, and education)
Coherence: orientation of the efforts of all stakeholders towards a common objective
Opportunity: sound solutions at the suitable moment Sustainability: development of economically self-sustainable programmes Decentralization: implementation of decentralized programmes with
regional, national and local components Compatibility: development of air quality management programmes
compatible with regional, national and local needs.
218

The general objective of the regional plan is:
To contribute to the strengthening of the technical and institutional capabilities of the countries and of the mechanisms for cooperation among the countries of the Region for the implementation of plans and programmes to improve air quality and prevent indoor and outdoor air pollution, based on standards and regulations that protect human health, within the sustainable human development framework.
The specific objectives of the regional plan are: •
• •
•
•
• •
to include or strengthen the concept of air quality management in the national laws, regulations, plans and strategies of the countries of the region; to establish or strengthen national and local air quality management programmes; to establish or strengthen monitoring programmes of air pollution impact on health and to implement operative research programmes on this issue; to inform, educate, train, and strengthen public participation in all aspects related to air quality management, including air pollution reduction and prevention; to establish self-sustainable mechanisms in national and local air quality management programmes; to foster the exchange of best practice in urban air quality management; and to mobilise resources for individual and joint efforts to combat adverse impacts of air pollution.
Based on the objectives described above, the regional action plan is structured into the following six interrelated programmatic areas: 1. policies, standards and regulations 2. air quality management 3. monitoring the adverse effects of air pollution 4. education, training, and public awareness 5. financing 6. networking Areas 1, 2, and 3 provide the basis of the regional plan while areas 4, 5 and 6 support the first three areas. The core elements of the APMA regional plan are taken from the recommendations by UNEP and WHO (1992) as presented in Table 15.1 Table 15.1 Main elements of an air pollution programme
Stage
Method
Emissions emission inventory models Concentration monitoring network models Exposure exposure data; models
Source: UNEP/WHO (1992) Each area has a specific objective, a set of expected results and a group of activities to be developed and implemented. Each area includes regional activities to be promoted by the regional body, in this case APMA, and national and local authorities and civil society. Regional activities should be coordinated with the programmes of other
219
international agencies as well as private sector and non-government organisations. The implementation of the regional action plan should be continually evaluated to assess the progress being made. In addition, countries should prepare air quality and impact reports periodically to monitor the progress and success of their own programmes. It should be noted that, due to the differences in conditions (e.g. human and economic resources, air pollution problems, etc.) and air quality management programmes among and within the countries of the region, the activities described below should be implemented taking into consideration national and local capacities and needs. Policies, Standards and Regulations This area includes the most popular and effective air pollution abatement measures. The objective of these legal instruments should be to introduce and strengthen the concept of air quality management in national laws, regulations, plans and strategies. In order to achieve results, the regional body will need to promote the development and implementation of national laws and regulations on air quality and provide technical support to the countries, for example, through the distribution of WHO global air quality guidelines, compiling a compendium of existing legislation in the region and exchange of experiences and knowledge among countries. In turn, the countries should: 1. establish multi-institutional and interdisciplinary technical committees to support
the preparation and revision of policies, standards, and regulations; 2. establish programmes for the preparation and revision of standards, regulations and
contingency plans; 3. develop ambient air quality and emission standards and to design mechanisms that
will ensure their wide dissemination; 4. develop policies to promote the development of programmes that will improve air
quality and prevent its deterioration and to design mechanisms to disseminate them; and
5. promote the use of ISO 14000 standards.
The regional body should promote the establishment and strengthening of national and local institutions with the capability to enforce air quality laws and regulations and provide technical support to countries through education, participation in technical missions and exchange of experiences and knowledge among countries. The countries should correspondingly establish or strengthen national and local institutions with the capability to enforce air quality laws and regulations; strengthen technical and institutional capabilities to design and implement action plans at the national and local levels and establish multi-institutional and interdisciplinary technical committees to provide permanent support, follow-up, and monitoring of the activities. Air Quality Management The success of any air pollution abatement programme is based on the efficiency and effectiveness of its air quality management. The objective of the air quality management component of the regional action plan should be to establish or strengthen national and local outdoor and indoor air quality management programmes. These programmes should contain four specific areas: air quality monitoring; emission controls; air pollution prevention; and information, training, and public awareness.
220

To achieve this result, the regional body should promote the exchange of experiences and knowledge among countries; promote control and preventive measures in the countries; provide technical support through the preparation of conceptual and methodological instruments; and participate in technical missions. The main functions of the regional body, in coordination with the network, should be: •
• • •
• •
•
to prepare regional plans on quality assurance and quality control of air quality sampling and analysis, laboratory accreditation and standardisation of air quality data management; to prepare guidelines for the development of air quality management programmes; to prepare protocols for multi-centre studies and research guidelines; to provide technical support to the countries in the preparation and execution of action plans; to train specialised personnel in the countries; to establish a regional air quality management information centre. This centre will work closely with the WHO AMIS database; and to prepare information, training, and public awareness material on prevention and reduction of outdoor and indoor air pollution.
The countries should: 1. perform outdoor and indoor air quality studies wherever applicable in urban areas,
including peri-urban areas; 2. design national and local monitoring, control, and preventative action plans that are
technically and economically viable; 3. establish national and local air quality monitoring systems based on action plans.
These monitoring systems should have networks and protocols for meteorological and air quality sampling, emission inventories updated regularly, inventories of indoor exposure sources, and air quality forecast systems based on standardized meteorological information and forecast models;
4. prepare a national programme for quality assurance and quality control of air quality sampling and analysis following the guidelines of the regional plan;
5. create national and local programmes for control of stationary and mobile emission sources based on the action plans. These programmes should consider command and control strategies and market- based incentives;
6. implement national and local air pollution prevention programmes based on action plans. These programmes should include strategies for efficient use of energy, use of renewable energy sources, protection of clean air sources such as parks and forests, sustainable urban development, and behavioural changes;
7. request environmental impact assessments of large development projects that may impact air quality significantly;
8. organise national and local information and training centres for air quality management; and
9. train specialised personnel. Monitoring the Adverse Effects of Air Pollution An essential component to measure progress in air quality is the monitoring of air pollution impact on the public health and environment. The aim of air pollution monitoring for the regional body should be to establish or strengthen monitoring programmes and to carry out operative research programmes on this issue. National and local programmes for the monitoring of air pollution effects should have a permanent
221
recording system of morbidity and mortality cases associated with air pollution, risk assessment, effective information systems and standardised calculation of the social cost of air pollution In order to achieve this the regional body should promote the exchange of experiences and information among countries and the implementation of actions in the countries and provide technical support to the countries through the preparation of conceptual and methodological tools and participation in technical missions. The regional action plan will need to identify, organise and implement accordingly a network of collaborating centres working in this area. The main functions of APMA, for example, in coordination with this network is: 1. to collate data on AQM with respect to the existing situation; 2. to identify gaps in implementation of AQM in major and megacities; 3. to share information on best practices of and lessons learned from AQM; 4. to provide information on air quality management from existing databases; 5. to support capacity enhancement; 6. to facilitate harmonisation of approaches to AQM to the extent that is appropriate;
and 7. to provide leadership and examples of sound AQM to the smaller cities of Asia, in
order that they might avoid the AQ problem being experienced by Asia’s megacities.
The countries should: 1. establish or strengthen national and local epidemiological monitoring programmes
that record morbidity and mortality cases associated with air pollution on a regular basis and use environment and health indicators following regional guidelines;
2. create or support national and local risk assessment programmes and request risk assessments to large development projects that may impact air quality significantly;
3. establish national and local information and training centres focused on air pollution effects on health;
4. train specialised human resources and to incorporate the topic of air pollution effects on health in the general education of health professionals; and
5. estimate the economic impact of air pollution on health. Education, Training and Public Awareness This area is most often overlooked by air quality management action plans but it is one of the most effective measures for success. The goal of this area should be to inform, educate, train and strengthen public participation in all aspects related to air quality management and air pollution prevention and control. A concerted effort will be required by decision-makers, political leaders, entrepreneurs and the general public in the area of outdoor and indoor air pollution prevention and reduction. To achieve this result, the regional body should support the training of personnel and design the required tools such as informative material for raising public awareness about prevention and reduction measures and mechanisms for promoting the implementation of these measures in the countries. At the national and local levels, strategies should be developed to work with the mass media and to strengthen their participation. Specialized personnel should be trained to achieve a multiplier effect (training the trainers), mechanisms designed to communicate risks and disseminate policies,
222

standards, regulations and alert systems should be established including air quality indices to inform the public so that the necessary mitigation measures can be taken. In addition, air quality management issues should be incorporated into educational systems of the region. In order to achieve this, it is recommended that the regional body support the education of specialized groups and design corresponding instruments, prepare distance-learning courses and promote the implementation of actions in the countries. The countries should: • incorporate the topic of air quality management in the elementary and high school
level science curricula; • develop university programmes on air quality management; • develop and promote training programmes for the institutions responsible for
managing air quality programmes and monitoring air quality impact on health; • train specialized personnel; and • include the topic of air quality management in these institutions’ research
priorities. Financing Financing is the fuel for the air quality management plans and a necessity for establishing mechanisms for sustainability in national and local air quality management programmes. To be effective on the regional level, it is recommended that operational short-, medium-, and long-term programmes are established to promote self-sustainability of the national and local programmes of air quality management To achieve this result, the regional body should: • promote the development and implementation of operational financing programmes; • prepare an inventory of potential financing institutions at the international level; • facilitate the dialogue among national and local institutions and potential
international financing institutions; and • provide technical support to national and local institutions in the formulation of
funding proposals for their programmes. The local and national institutions should also: • prepare economic, financial, and cost-benefit analyses for air quality management
programmes; • define short-, medium- and long-term investment programmes to comply with air
quality management programmes; • raise awareness among decision-makers on the need for financing air quality
management programmes and the monitoring of air pollution impact on health; • create economic incentive mechanisms for emission reduction; and • work with international organizations to mobilize the resources necessary to
implement air quality management programmes as described above. Furthermore, a regional action plan should also address all stakeholders involved and not only the regional body and national and local governments. As air quality is a global issue, there are many actors and agents who are part of the problem and/or solution.
223

Thus, a regional action plan will need to involve all of the following stakeholders, in a cooperative way to effectively implement urban air quality management in Asia: •
•
•
•
•
•
•
•
national and local governments: responsible for the setting and enforcement of policies, laws and regulations, air quality monitoring and control, emission control, monitoring of air pollution impact on health, and education, training and awareness-raising of the population; transport, energy and industry organizations: responsible for making the improvement of air quality and air pollution prevention a strategic goal in their daily actions; civil society and non-governmental organizations: responsible for the education, training, and awareness-raising of the general public; academic and scientific institutions: responsible for research on technological, economic, and social problems concerning air quality management; and international organizations: responsible for providing technical, financial, and human support.
Networking Overall networking is required to encourage exchange of initiatives and expertise and to be proactive in developing local air quality management initiatives. Networking can allow Asian countries to gather in one place and to assist in improving local air quality management initiatives in Asia. It can:
promote regional co-operation among Asian countries and other similar air-pollution related initiatives and develop and implement regional action; increase awareness of air pollution issues through Asia and to act as a forum for sharing the experience of air pollution management among stakeholders, such as experts and policy makers in Asia; and develop practical regional implementation action.
IMPROVING AIR QUALITY IN THE MAJOR AND MEGACITIES OF ASIA Although it is helpful to outline recommendations for a regional action plan for UAQM in Asia, there is still much that needs to be done before such a plan is drafted and adopted. The current situation of UAQM in Asia is in its early stages and will require further measures before a regional action plan can be initiated. Firstly, a benchmarking assessment of air quality data and current UAQM practices in major and mega cities of Asia is needed because such information is currently lacking or unreliable. The APMA project, in addition to other regional initiatives, is currently in the process of collecting air quality emissions data from a select number of Asian cities, as well as obtaining current air quality management information in a benchmarking implementation assessment of the UAQM situation to gain a detailed understanding of the state of urban air quality in Asia and UAQM processes. Existing data available on UAQM in Asia is being collated. This includes the WHO AMIS database as well as other sources from other international and regional organizations such as the WB, ADB and UNEP. The data will cover types of urban air pollutants and emission data by sector. Gaps in information will be identified and national and local authorities will be contacted to gain further information.
224
After this initial assessment of the status of UAQM in Asia, a second step would be to seek out which UAQM models have been successful and if other cities in the region could also adopt such models into their UAQM programmes. The APMA project is currently examining best practice in UAQM in Europe as well as elsewhere in order to provide insight and past experiences on creating successful UAQM programmes in Asia. After this analysis of best practice is completed, the next step will be to establish a mechanism for communication between the authorities of each municipal/national body so that they can share and compare common experiences, problems, resources in establishing and/or operating UAQM programmes in the region. Through this comparison process, the APMA project also plans to conduct an analysis of UAQM in Asia based on the results of the initial information assessment, analysis of best practice and comparison and assessment of current UAQM practice in Asia. This analysis will help to identify the changes that are required to achieve satisfactory practice in Asia or improve on existing practice. These measures will contribute to the formulation of regional and local action plans for UAQM, which will be the focus of Phase II of the APMA Project. The APMA project, as well as other UAQM initiatives in the region, was created to establish an effective regional response to the problem. Building on its benchmarking results, APMA plans on providing an information network for local and national authorities through a website to share information and function as an online resource for UAQM in Asia. Although this is not the only way in which to improve UAQM at a regional level, APMA aims to establish an information network to provide information on UAQM and technical support and training and to facilitate the adoption of regional and local UAQM action plans as a progressive step towards abating air pollution in the region. In its second phase, the APMA project aims to continue maintenance and development of the APMA website, host workshops on specific issues related to UAQM in Asia and the development of training materials, and organize a regional policy dialogue to facilitate the adoption of a regional action plan on UAQM. Air pollution is a wide-spread and complex problem. The impacts range from the kerbside in a city to the far reaches of the atmosphere. Consequently, combating air pollution in the World’s largest and rapidly urbanizing continent is not an easy task and will require sufficient resources, cooperation and effort. However, urgent and comprehensive action is needed because of the already significant impact on human health and environmental well-being. There is a clear need for a well co-ordinated, internationally-sponsored initiative to address the fundamental problem of urban air pollution and provide the basis for future regional cooperation. It is envisaged that a viable regional initiative, such as the APMA project, will meet this need to address urban air pollution in Asia.
225
REFERENCES Hay, John (2001) Enhancing the Capacity for Effective Urban Air Pollution
Management in Asia, UNEP-ROAP MARC/UNEP/WHO (1996) Air Quality Management Capabilities in 20 Major Cities,
UNEP/DEIA/AR.96.2. WHO/EOS/95.7. Monitoring and Assessment Research Centre, London, United Nations Environment Programme, Nairobi, World Health Organization Geneva
Schwela, D H (1999) Public Health and the Air Management Information System (AMIS). Epidemiology 10: pp647-655
WHO/EURO (2000) Air Quality Guidelines for Europe, Second Edition. WHO Regional Publications, European Series, No. 91. World Health Organization
WHO (2000) Guidelines for Air Quality, WHO/SDE/OEH/00.02. World Health Organisation, Geneva. Internet address: http://www.who.int/peh/
WHO (2001) Air Management Information System, AMIS 3.0, CD ROM. World Health Organization, Geneva
World Bank (1998) Pollution Prevention and Abatement Handbook 1998: Toward Cleaner Production, World Bank, Washington D.C.
UNEP/WHO (1992) Urban Air Pollution in Megacities of the World, United Nations Environment Programme and the World Health Organization, Blackewell, Oxford
226

A report of the Air Pollution in the Megacities of Asia project
www.asiairnet.org
cover photos donated by UNEP