Urban Activity Dynamics - ut
18
SPM2008, Tartu Urban Activity Dynamics Sensing Places Through Network Antennas Ad S kC l R i Andres Sevtsuk, Carlo Ratti Department of Urban Studies & Planning February, 2008
Transcript of Urban Activity Dynamics - ut

SPM2008, Tartu
Urban Activity DynamicsSensing Places Through Network Antennasg g
A d S k C l R iAndres Sevtsuk, Carlo RattiDepartment of Urban Studies & Planning
February, 2008
Overview:
Introduction
WiFi 802.11 MhZ on the MIT campus
GSM 900/1800 MhZ in the City of Rome
Conclusions
802.11 MhZ
MITMITWiFi signals
VS1. Academic buildings
2. Residential Buildings g3. Service Buildings
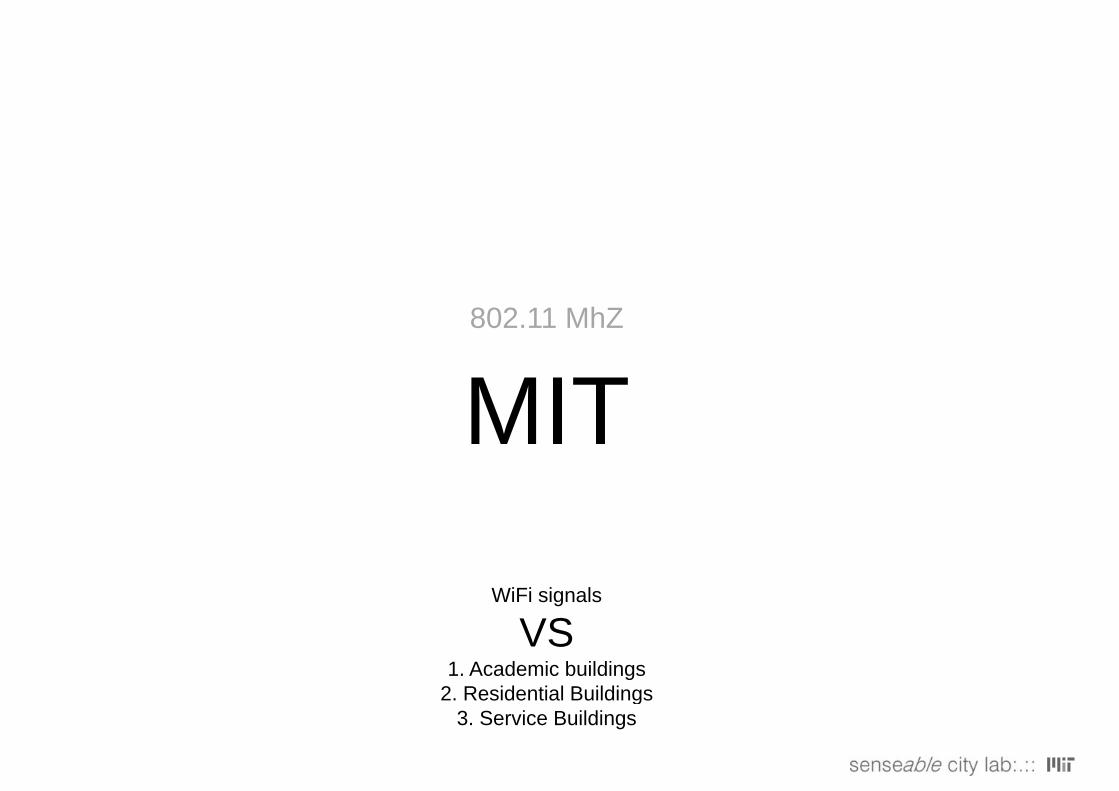
MIT campus, Cambridge, MA 02139: 168 acres, 190 buildings, 10,320 students and 9,414 employees
MIT wireless network coverage: All academic and residential buildings ,most service buildings, 3056 WiFi hotspots
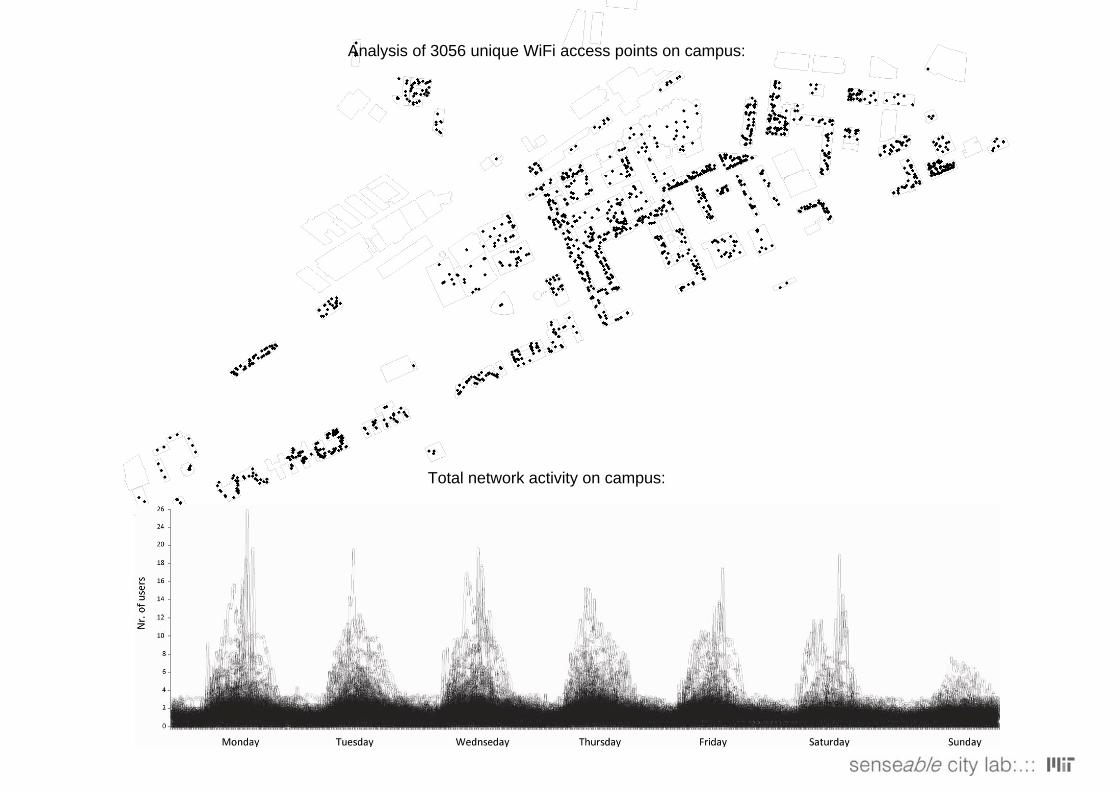
Analysis of 3056 unique WiFi access points on campus:
Total network activity on campus:

Average WiFi use by building type
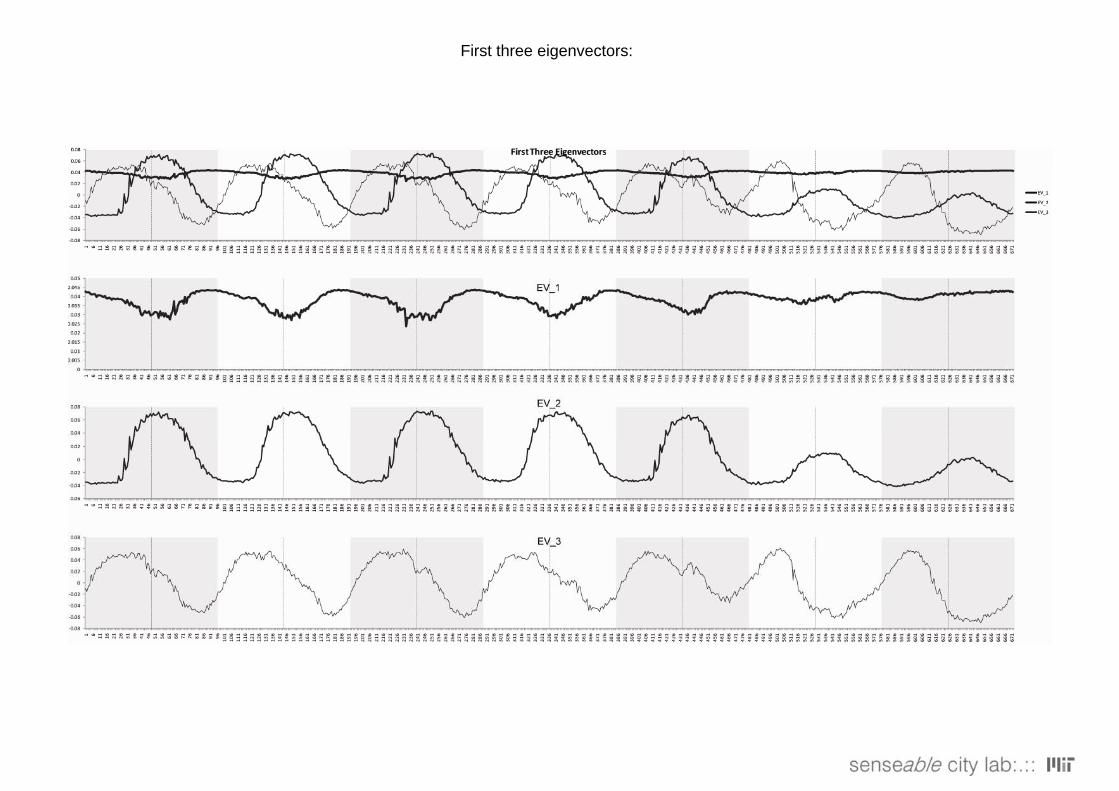
First three eigenvectors:
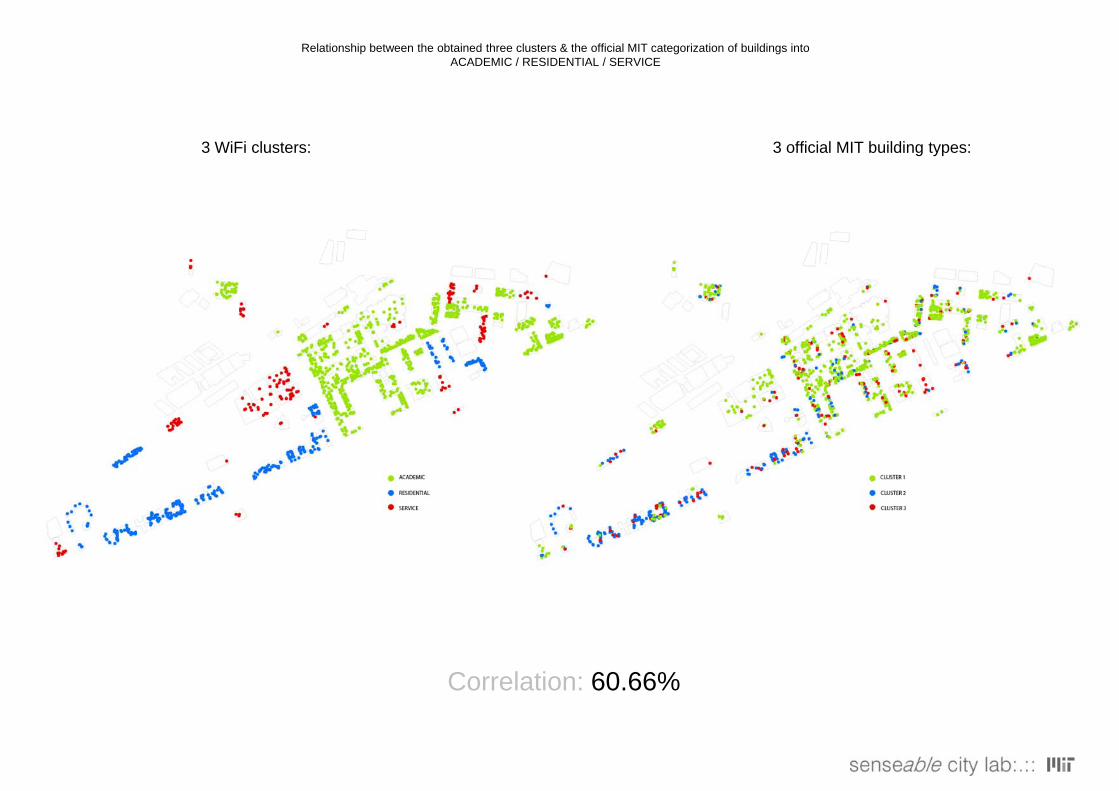
Relationship between the obtained three clusters & the official MIT categorization of buildings into ACADEMIC / RESIDENTIAL / SERVICE
3 WiFi clusters: 3 official MIT building types:
Correlation: 60.66%

Average activity in the three largest WiFI clusters:
Cluster 1: dominated by daytime usage, highest consumption of WiFi on weekdays typically occurs around 1 pm, activity y y g g y y y ydeclines steeply after 4pm. Such a pattern seems characteristic to academic working spaces.
Cluster 2: More stable throughout the day showing minor peaks around 9am in the morning and 11pm in the evening. Unlike in the previous cluster, weekend usage is quite similar to weekday usage, which well matches our assumption of its residential natureresidential nature.
Cluster 3: Rather than showing peak activity during working hours, as we would expect with service buildings, peaks occur instead around 10am and more sharply right before midnight. This suggests that the third cluster might not in fact characterize service spaces, but instead activity spaces that resemble more to residential areas but have higher average
tusage rates.
900 / 1800 MhZ
ROMEROMEGSM signals
VS 1. population distribution
2 Service distribution2. Service distribution3. Employment distribution?

398 cells covering the urban area within the city’s ring-road
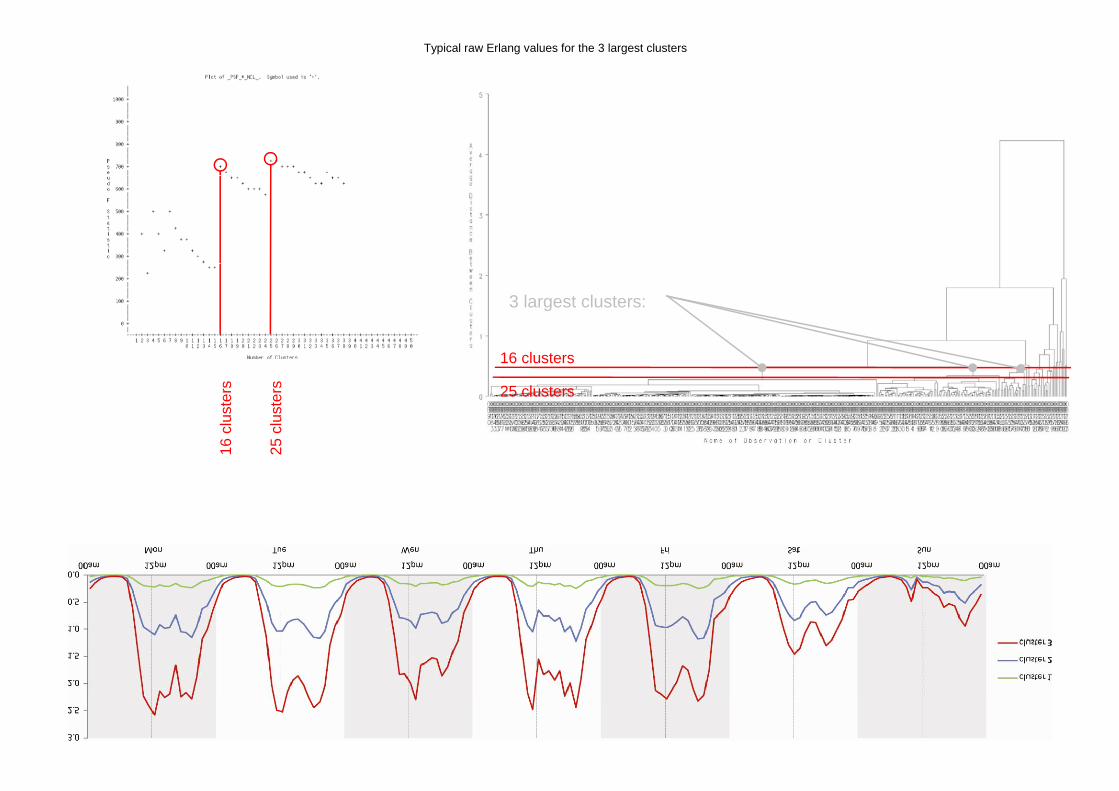
Typical raw Erlang values for the 3 largest clusters
3 largest clusters:
6 cl
uste
rs
5 cl
uste
rs
16 clusters
25 clusters
16 25
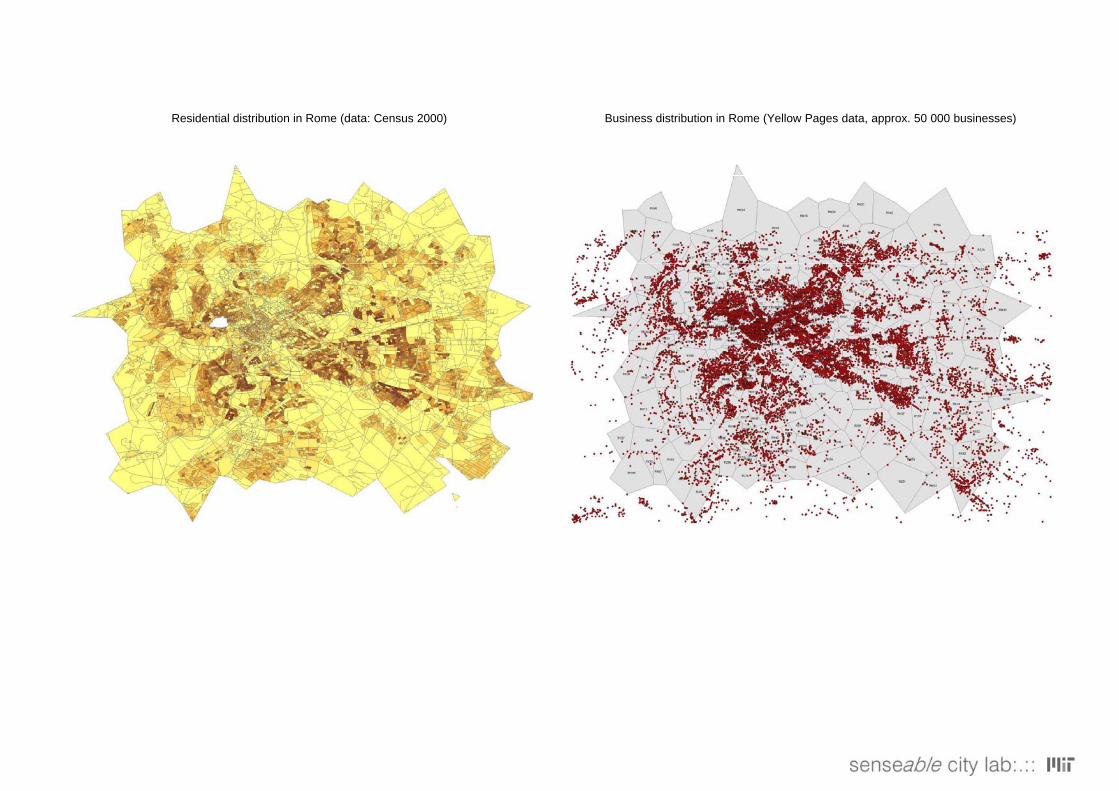
Residential distribution in Rome (data: Census 2000) Business distribution in Rome (Yellow Pages data, approx. 50 000 businesses)
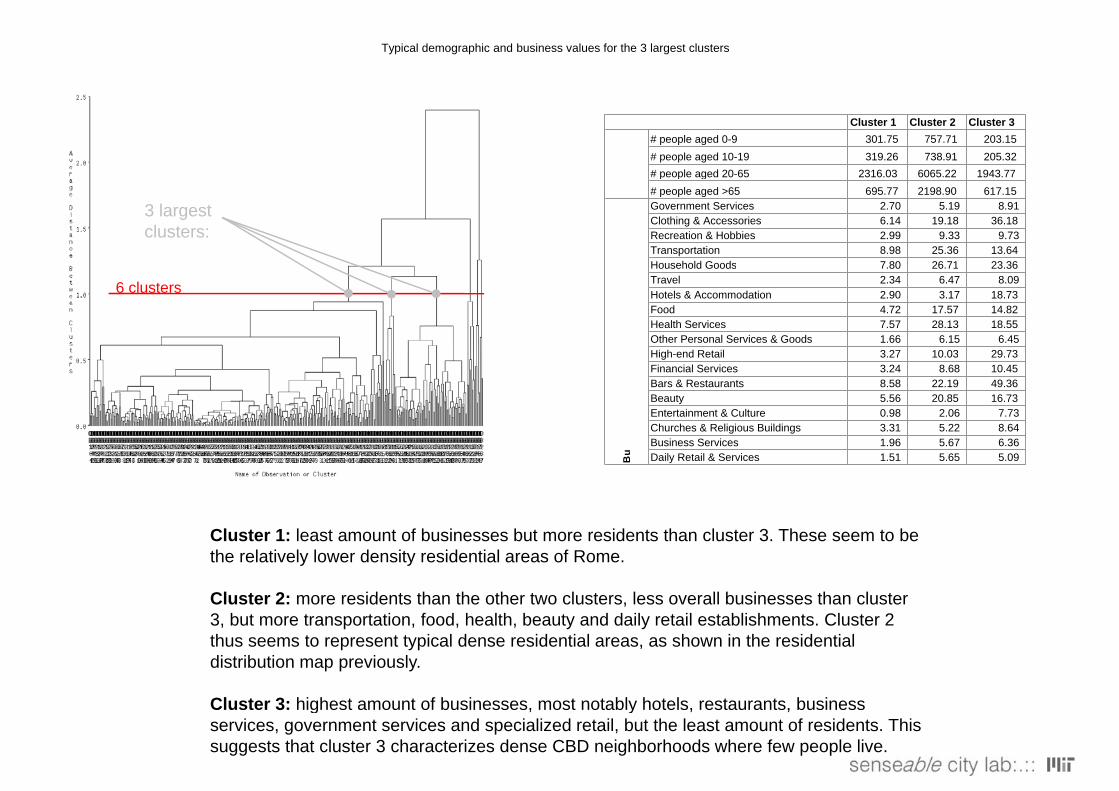
Typical demographic and business values for the 3 largest clusters
Cluster 1 Cluster 2 Cluster 3# people aged 0-9 301.75 757.71 203.15# people aged 10-19 319.26 738.91 205.32# people aged 20-65 2316 03 6065 22 1943 77
3 largest clusters:
# people aged 20 65 2316.03 6065.22 1943.77# people aged >65 695.77 2198.90 617.15Government Services 2.70 5.19 8.91Clothing & Accessories 6.14 19.18 36.18Recreation & Hobbies 2.99 9.33 9.73Transportation 8.98 25.36 13.64Household Goods 7 80 26 71 23 36
6 clustersHousehold Goods 7.80 26.71 23.36Travel 2.34 6.47 8.09Hotels & Accommodation 2.90 3.17 18.73Food 4.72 17.57 14.82Health Services 7.57 28.13 18.55Other Personal Services & Goods 1.66 6.15 6.45Hi h d R t il 3 27 10 03 29 73High-end Retail 3.27 10.03 29.73Financial Services 3.24 8.68 10.45Bars & Restaurants 8.58 22.19 49.36Beauty 5.56 20.85 16.73Entertainment & Culture 0.98 2.06 7.73Churches & Religious Buildings 3.31 5.22 8.64B i S i 1 96 5 67 6 36Business Services 1.96 5.67 6.36Daily Retail & Services 1.51 5.65 5.09B
u
Cluster 1: least amount of businesses but more residents than cluster 3. These seem to be the relatively lower density residential areas of Rome.
Cluster 2: more residents than the other two clusters, less overall businesses than cluster 3 b t t t ti f d h lth b t d d il t il t bli h t Cl t 23, but more transportation, food, health, beauty and daily retail establishments. Cluster 2 thus seems to represent typical dense residential areas, as shown in the residential distribution map previously.
Cluster 3: highest amount of businesses most notably hotels restaurants businessCluster 3: highest amount of businesses, most notably hotels, restaurants, business services, government services and specialized retail, but the least amount of residents. This suggests that cluster 3 characterizes dense CBD neighborhoods where few people live.

Residential distribution in Rome (data: Census 2000) Business distribution in Rome (Yellow Pages data, approx. 50 000 businesses)

Correlation: 63.14%
Other correlations for the 3 largest clusters:
Erlang VS businesses: 60.05% Erlang VS census: 51 29%Erlang VS census: 51.29%
Census VS businesses: 74.75%
Conclusions:
•Correspondence between antenna usage patterns and the demographic and functional characteristics of location.
•This suggests that the gross functional and demographic indicators of urban areas could be approximated from the mere consumption statistics of wireless networks. p
•Despite a generally good match, the correspondence between traditional land categorizations and wirelessbetween traditional land categorizations and wireless activity patterns is not exact, and should not be. The traditional categories of space usage typically describe the permanent aspects of places- their land use, the number of businesses, jobs or residents. The wireless network usage, on the other hand, reflects people’s temporary presence and communications behavior in these spaces.
•Employment data needed in addition to residential distribution & business distribution.