URANIUM The Largest U.S. Producer VANADIUM Resuming...
28
Energy Fuels Inc. NYSE American: UUUU TSX: EFR August 2018 URANIUM The Largest U.S. Producer VANADIUM Resuming Production in 2018
Transcript of URANIUM The Largest U.S. Producer VANADIUM Resuming...

Energy Fuels Inc. NYSE American: UUUUTSX: EFRAugust 2018
URANIUM The Largest U.S. Producer
VANADIUM Resuming Production in 2018

IMPORTANT INFORMATION
!2
• Please carefully review important information about this presentation – Forward looking statements, page 25 – Notice regarding technical disclosure, page 26 – Cautionary statements for US investors concerning mineral resources, page 27

ENERGY FUELS – INVESTMENT THEMES
!3
1#1 Uranium Producer in the U.S. Leading production portfolio to capitalize on recovery faster – and on a greater scale – than peers
2
3
4
5
6
U.S. Launches §232 Investigation on Uranium Imports Proposal for trade quotas reserving 25% of U.S. market for U.S. uranium miners
92
U Uranium
238.03
23
V Vanadium
50.94
Uranium Alternate Feed Materials Super low-cost uranium production able to generate cash flow in today’s challenging market
Land Cleanup & Copper Recovery Additional opportunities to generate significant future cash flow
Uranium & Vanadium Poised for Growth Nuclear energy growing at fastest rate in 25 years; Vanadium prices up 400% in past two years
Only Vanadium Producer in the U.S. Resuming production in Q4-2018; Up to 4 million lbs. of V2O5 recoverable in short term

MARKET-LEADING PORTFOLIOURANIUM & VANADIUM ASSETS IN THE U.S.
!4
Energy Fuels’ Uranium Production Rank in U.S.
• Track record of sustained market leadership • Ability to significantly increase production as
uranium prices rise • The only U.S. uranium supplier with both
conventional & in-situ recovery (ISR) – 3 existing low-cost production facilities in Utah
(conventional), Wyoming (ISR) & Texas (ISR)
• 100% owner of the only fully-permitted & operational conventional uranium & vanadium mill in the U.S. – The White Mesa Mill (Utah) offers broad revenue-
generating opportunities – Resuming vanadium production in 2018
20172016
#12015
#2#3

STRATEGIC URANIUM PRODUCTION ASSETS IN U.S. U.S. IS THE WORLD’S BIGGEST NUCLEAR MARKET
!5
Conventional mill
ISR plant and mine
Major mine/project
Existing nuclear power plant
Nuclear power plant under construction
Sheep Mountain
Nichols Ranch ISR
CanyonRoca Honda
Alta Mesa ISR
Henry Mountains
White Mesa Mill
WhirlwindLa Sal

PRODUCTION FACILITY: Alta Mesa ISR PlantNichols Ranch ISR Plant
UNMATCHED FLEXIBILITY TO SCALE-UP PRODUCTION ENERGY FUELS CAN PRODUCE MORE POUNDS – FASTER – THAN COMPETITION1
!6
10 yr.
20 yr.Mine Status2017 Production
(Lbs.)Speed to Increase
Production LifeM&I
(Lbs.)2Inferred
(Lbs.)
ANNUAL PRODUCTION TARGET AT $40 - $50 PER POUND SALES PRICE = UP TO 2.5M POUNDS OF U3O8 PER YEAR
Nichols Ranch Permitted/Operating 259,000 6 months 10 yrs. 5.5m 1.1m
Alta Mesa Permitted/Standby 0 12 months 15 yrs. 3.2m 16.8m
Canyon (U308 & Cu) Permitted/Standby 0 12 months 4 yrs. 2.4m 0.2m
Alternate Feeds – White Mesa Permitted/Operating 366,000 6 months Ongoing n/a n/a
Toll Processing – White Mesa Permitted/Operating 950,000 6 months Ongoing n/a n/a
ANNUAL PRODUCTION TARGET AT $60 PER POUND SALES PRICE = ADDITIONAL 1M – 4M POUNDS OF U3O8 PER YEAR
La Sal Complex (U308 & V2O5) Permitted/Standby 0 6 months 7 yrs. 4.1m 0.4m
Daneros Permitted/Standby 0 6 months 5 yrs. 0.1m 0.1m
Whirlwind (U308 & V2O5) Permitted/Standby 0 12 months 8 yrs. 1.0m 2.0m
Tony M Permitted/Standby 0 12 months 13 yrs. 8.1m 2.8m
Roca HondaAdvanced Permitting 0 4 years 9 yrs. 14.6m 11.2m
Bullfrog Pre-permitting 0 6 years 13 yrs. 4.7m 5.3m
Sheep Mt. Permitted 0 6 years 15 yrs. 30.3m n/a
1 All figures are Company estimates 2 All NI 43-101 compliant resources. Please see resource table on page 27 for further information on pounds, resource classification, grade and tonnage.
White Mesa Mill Heap Leach Facility

NICHOLS RANCH ISR FACILITYFULLY LICENSED, CONSTRUCTED, AND IN PRODUCTION
2017 U3O8 production
• Producing today • Ready to increase production within 6 months
of “GO” decision • Fully-permitted wellfields w/ significant in-
ground resources provide long-term production profile
– Nichols Ranch Wellfields – 4 future wellfields – Jane Dough Wellfields – 22 future wellfields – Hank Wellfields – 8 future wellfields
!7
259,000 lbs.Annual licensed capacity
2M lbs.Wellfields now in production
9
Jackson•
Casper•
Nichols Ranch ISR
Cheyenne•
URANIUM PRODUCTION

ALTA MESA ISR FACILITY FULLY-PERMITTED, CONSTRUCTED, AND READY TO RESUME PRODUCTION
U3O8 Produced 2005 – 2013
• On standby today • Ready to resume
production within 12 months of “GO” decision
• Significant in-ground uranium resources
• Potential to greatly expand resources through exploration
!8
4.6M lbs.Annual licensed capacity
1.5M lbs.Total project area (acres)
200,000
Corpus Christi
Alta Mesa ISR
•
Austin•
Houston •
•Dallas
URANIUM PRODUCTION

Salt Lake City•
White Mesa Mill
WHITE MESA MILL THE ONLY CONVENTIONAL URANIUM & VANADIUM MILL IN THE U.S.
2017 U3O8 Production
• Uranium – In production today with considerable excess capacity – Central to the highest-grade uranium deposits in U.S. – Separate circuit for processing low-cost alternate feed materials
• Vanadium – Separate vanadium production circuit – Significant past V2O5 production – Resuming V2O5 production in 2018
• Copper – Evaluating potential to process copper from Canyon mine
• Other Business Opportunities – Alternate feed materials, 3rd party toll milling, land cleanup work
!9
366,000 lbs.Annual licensed capacity
8M+ lbs.
Moab•
946,000 lbs.U3O8 Processed for 3rd Party in 20171
URANIUM + VANADIUM PRODUCTION

• 11.9M lbs. of Copper – 5.9% Cu(1)
CANYON MINEFULLY-PERMITTED, CONSTRUCTED, AND READY TO ENTER PRODUCTION
• High-grade uranium + copper • Surface development + main
shaft complete to 1,470-feet • Very low “all-in” cost of
production – Copper credits could reduce
costs further
• Process at White Mesa Mill • Reduced activity today
!10
2017 Resource Estimate:
• 2.4M lbs. of Uranium – 0.9% U3O8(1)
1 Please refer to page 27 for more information on grade, tonnage, and resource classification
Phoenix•
Tucson•
Canyon Mine
The highest-grade uranium mine in the U.S.
Production Ready:
•Flagstaff
URANIUM + COPPER PRODUCTION
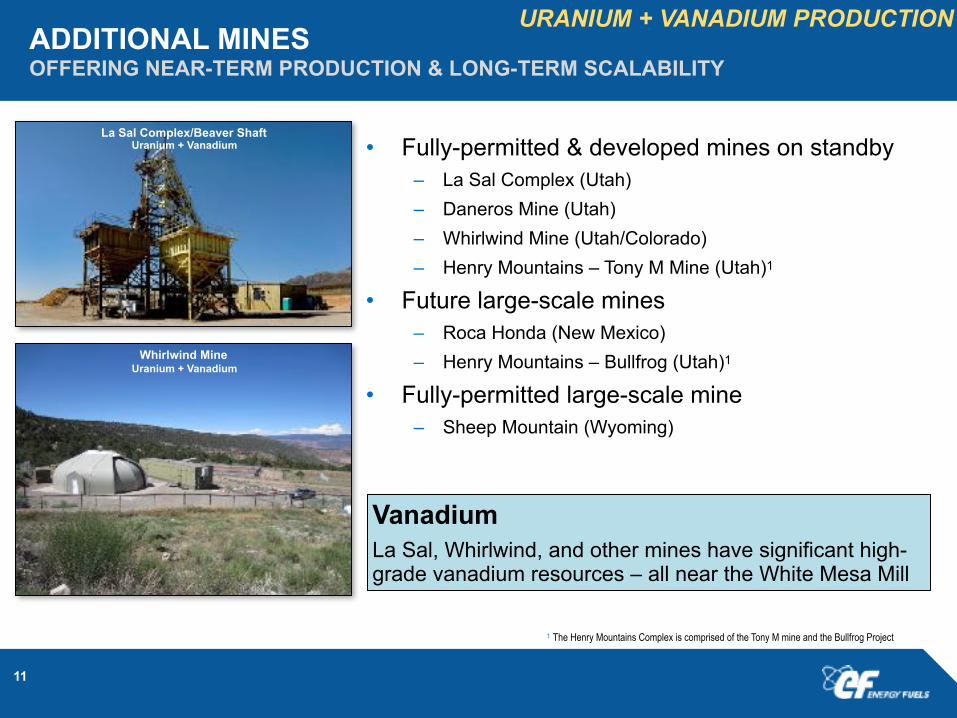
ADDITIONAL MINESOFFERING NEAR-TERM PRODUCTION & LONG-TERM SCALABILITY
• Fully-permitted & developed mines on standby – La Sal Complex (Utah) – Daneros Mine (Utah) – Whirlwind Mine (Utah/Colorado) – Henry Mountains – Tony M Mine (Utah)1
• Future large-scale mines – Roca Honda (New Mexico) – Henry Mountains – Bullfrog (Utah)1
• Fully-permitted large-scale mine – Sheep Mountain (Wyoming)
!11
1 The Henry Mountains Complex is comprised of the Tony M mine and the Bullfrog Project
La Sal Complex/Beaver Shaft Uranium + Vanadium
Vanadium La Sal, Whirlwind, and other mines have significant high-grade vanadium resources – all near the White Mesa Mill
Whirlwind Mine Uranium + Vanadium
URANIUM + VANADIUM PRODUCTION

VANADIUM ENERGY FUELS IS RESUMING V2O5 PRODUCTION IN 2018
VANADIUM MARKET • Steel, titanium, & other alloys • Strategic mineral for defense
applications • Commercialization of
advanced vanadium batteries • Increasing demand &
production cuts driving price increases
!12
WHITE MESA MILL • Separate vanadium recovery
circuit • Expect to produce 500,000 lbs.
of V2O5 in late-2018, early-2019 (low-cost capital preparations underway)
• Up to 4 million lbs. recoverable V2O5 in pond solutions
• Nearby stockpiles; alternate feeds, conventional mines
400%+Increase in vanadium prices since 2016
1.5M lbs.Most recent V2O5 production by Energy Fuels (2013)
32M lbs.1M&I vanadium resources at La Sal & Whirlwind Mines (1% avg. grade1)
PERMITTED & DEVELOPED MINES
1 Please refer to page 27 for more information on grade, tonnage, and resource classification

PETITIONING U.S. GOVERNMENT FOR URANIUM QUOTA INITIATING SECTION 232 INVESTIGATION
!13
• §232 Investigation into the effects of uranium imports on U.S. national security led by U.S. Department of Commerce (“DOC”)
• DOC has 270 days to prepare report and recommendation; President has 90 days to impose trade remedies (if any)
• Trade remedies proposed by Energy Fuels & Ur-Energy: – Quota reserving 25% of U.S. nuclear market for U.S. uranium miners – U.S. government utilities & agencies required to buy U.S. uranium
• If successful, Investigation likely to result in revitalization of U.S. uranium industry with negligible effects on U.S. utilities & consumers
12MUP TO
POUNDS/YEAR RESERVED
FOR U.S. MINERS
JULY 18, 2018: U.S. GOVERNMENT LAUNCHES INVESTIGATION INTO URANIUM IMPORTS

STRONG URANIUM CUSTOMER BASEMAJOR NUCLEAR UTILITIES
!14
• Favorable industry reputation, including perfect track record of on-time deliveries
• Low risk of non-payment due to customer profile and strength
• Near-term focus on U.S. with expansion potential in global growth markets
• Energy Fuels is the preferred U.S. uranium supplier due to multiple existing production facilities + proven track-record
650,000LBS
OF SALES IN 2018
(AT $48/LB.)1
1 Company guidance

GLOBAL ENERGY CONSUMPTION CONTINUES TO GROW
• Global energy demand more than doubled since 19701
• Demand for energy to double again by 20601
• Nuclear energy growing at fastest rate in 25 years3
!15
1 ”World Energy Needs and Nuclear Power,” World Nuclear Association, March 2017 2 IEA World Energy Outlook 2016; 3 World Nuclear Association
Nuclear Energy Forecast (TWh), 2014 – 20402World Energy Consumption (Quadrillion BTU), 1990 – 20402
2,000
3,250
4,500
5,750
7,000
2014 2020 2030 2040
Current Policies New Policies 450 Scenario

Nuclear60%
Hydro19%
Geothermal1%
Wind17%
Solar3%
URANIUM IS A KEY CLEAN ENERGY RESOURCE
!16
• Nuclear is the best clean energy – Operates 24/7 – Reliable – High capacity factors – Grid stability – Safe – Zero carbon and zero air pollution
• Nuclear provides 20% of all electricity – and 60% of all clean energy – in U.S.1
Lifecycle greenhouse gas emissions1
Non-emitting U.S. electricity sources21 World Nuclear Association
2 Nuclear Energy Institute; 2017 data
GH
G E
mis
sion
s (T
onne
s CO
2e/G
Wh)

BENEFITING FROM FAVORABLE U.S. POLICY DEVELOPMENTS
• U.S. is leading nuclear market – 99 units currently operational – 2 units under construction in GA1
• Push for energy independence + security – Section 232 Petition reserving 25% of U.S. market for U.S.
producers – Large quantities of uranium used in U.S. reactors comes from
Russia, Kazakhstan, and Uzbekistan3
• Growing support at U.S. federal and state levels – Trump Administration supportive of nuclear & domestic mining – DOE reducing uranium transfers2
– State legislation supporting nuclear passed in IL, NY, CT, NJ
U.S. reactor requirements met with uranium mined in U.S.
3
<3%
1 World Nuclear Association 2 U.S. Department of Energy, Office of Nuclear Energy 3 U.S. Energy Information Administration; Company guidance
!17
FUTURE URANIUM SUPPLY IS NOT GUARANTEED MULTIPLE GLOBAL SUPPLY RISKS
• Low prices setting the stage for next uranium price recovery ─ Kazakh production expected to decline 40% by 2030; 70% by 20352 ─ Kazatomprom CAPEX down 80%1 ─ Production suspended indefinitely at McArthur River (Canada) ─ Production dropping in Niger ─ Langer Heinrich (Namibia) halted production in 2018 ─ Ranger (Australia) shutting down in 2021 ─ Rossing (Namibia) shutting down in mid-2020’s (or sooner) ─ Husab – a majority-owned Chinese mine (Namibia) – not meeting targets ─ U.S. production dropping to historic lows ─ No new “Kazakhstans” on the horizon ─ Many new mines fail to meet expectations – or fail altogether ─ New, large-scale uranium projects take 10+ years to enter production
!181 Kazatomprom representative at 2018 WNFC Conference in Madrid, Spain 2 Uranium One representative at 2018 WNFC conference in Madrid, Spain

OTHER SIGNS INDUSTRY IS APPROACHING AN INFLECTION POINT
• Strong growth in China with 41 reactors operating + 17 new reactors under construction1
– Additional reactors under construction in India (7), Russia (6), South Korea (4), UAE (4), U.S. (2)
• Steadily increasing demand for uranium – Nuclear energy growing at its fastest rate in 25 years1 – Significant uncovered utility demand for uranium
• 2018 – 2027 = 650+ million lbs. of U3O83
• Japan – 9 reactors restarted – 15 additional reactors approved for restart or under review1 – Japanese government reaffirms goal of 20% - 22% nuclear by 2030
!191 World Nuclear Association 2 IEA World Energy Outlook, 2016
3 Ux Consulting

ENERGY FUELS’ STRONG COMPETETIVE POSITIONINGPROVEN TRACK RECORD OF PRODUCTION & SALES
!20
MARKET CAP
(US$MM)M&I
(MM LBS.)(1)
INFERRED (MM LBS.)
(1)
MKT. CAP PER LB. M&I
(US$MM)
WORKING CAPITAL
(US$MM)(2) ISRCONVENTIONA
LVANADIUM
PRODUCTION
ALTERNATE FEED
PRODUCTION
Cameco $4,123 883 190 $4.66 $1,675 ✓ ✓ ✗ ✗NexGen Energy $672(3) 180 122 $3.73 $106(3) ✗ ✗ ✗ ✗
Energy Fuels $295 81 49 $3.64 $55 ✓ ✓ ✓ ✓Denison Mines $269 109 8 $2.47 $28 ✗(6) ✗ ✗ ✗
Fission Uranium $229(3) 88 53 $2.60 $22(3) ✗ ✗ ✗ ✗
Uranium Energy $260 58 45 $4.48 $7 ✗ ✗ ✗ ✗
Ur-Energy $107 22 6 $4.86 $1 ✓ ✗ ✗ ✗
Peninsula Energy $50(4) 39(5) 72(5) $1.27 ($10) ✓ ✗ ✗ ✗
CURRENT COMMERCIAL-SCALE PRODUCTION
Positioning in North American Uranium Space – As of August 16, 2018
1 See Slide 27 for tons, grade and resource classification for Energy Fuels 2 For most recently reported period; June 30, 2018 for Energy Fuels 3 Cdn$1 = US$0.76 4 Au$ = US$0.73
5 In accordance with JORC; not NI 43-101 compliant 6 Does not include minority share of production of operating McClean Lake Mill
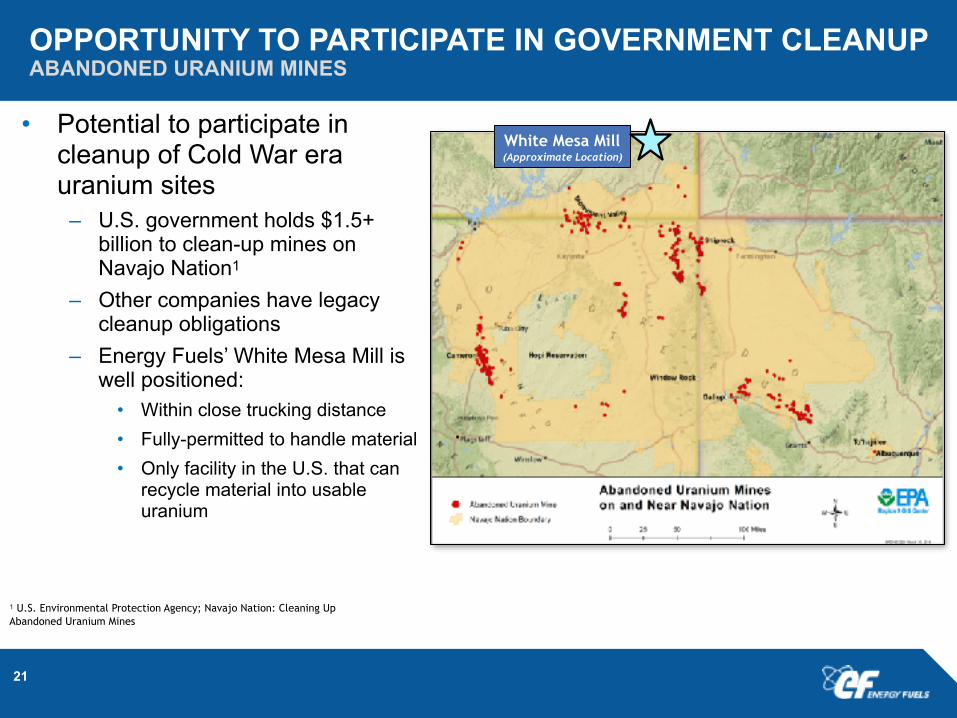
OPPORTUNITY TO PARTICIPATE IN GOVERNMENT CLEANUP ABANDONED URANIUM MINES
• Potential to participate in cleanup of Cold War era uranium sites
– U.S. government holds $1.5+ billion to clean-up mines on Navajo Nation1
– Other companies have legacy cleanup obligations
– Energy Fuels’ White Mesa Mill is well positioned:
• Within close trucking distance • Fully-permitted to handle material • Only facility in the U.S. that can
recycle material into usable uranium
!21
1 U.S. Environmental Protection Agency; Navajo Nation: Cleaning Up Abandoned Uranium Mines
White Mesa Mill (Approximate Location)

FOCUSED ON MAINTAINING FINANCIAL FLEXIBILITY
• Strategic positioning during current uranium market – July 18, 2018: U.S. launches §232 investigation on uranium imports into the U.S. – Resuming vanadium production in 2018 – Actively pursuing several sources of alternate feed materials and land cleanup work – Nichols Ranch wellfield construction on hold; Alta Mesa remaining on care and maintenance – Low level of activities at Canyon Mine as resource evaluation, metallurgical testing, and mine
planning advance • 2018 Guidance:
– 460,000 to 520,000 pounds of U3O8 production – 650,000 pounds of U3O8 contract sales at an expected average price of $48.00 per pound
!22
225,000POUNDS OF INVENTORY1
$43.2MCASH & CASH EQUIVALENTS1
$55.3MWORKING CAPITAL1
1 Quarter-ended June 30, 2018
FOCUSED ON MULTIPLE URANIUM & VANADIUM OPPORTUNITIES
• Multiple proven & permitted mines secure & de-risk Energy Fuels’ future production
• Resuming vanadium production in 2018
• Strong working capital position
• Long-term contracts & toll processing offering some protection from low uranium prices
• Committed to maintaining average cost of capital as low as possible
• Alternate feed material, copper, and land cleanup opportunities
!23
232 Petition – Potential Revitalization of the U.S. Uranium Industry

FORWARD LOOKING STATEMENTS
Certain of the information contained in this presentation constitutes "forward-looking information" (as defined in the Securities Act (Ontario)) and "forward-looking statements" (as defined in the U.S. Private Securities Litigation Reform Act of 1995) that are based on expectations, estimates and projections of management of Energy Fuels Inc. ("Energy Fuels“) as of today's date. Such forward-looking information and forward-looking statements include but are not limited to: the business strategy for Energy Fuels; Energy Fuels expectations with regard to current and future uranium and vanadium market conditions; the uranium industry’s ability to respond to higher demand; the impacts of recent market developments; business plans; outlook; objectives; expectations as to the prices of U3O8, V2O5, and Cu; expectations as to reserves, resources, results of exploration and related expenses; estimated future production and costs; changes in project parameters; the expected permitting and production time lines; the Company’s belief that it has significant production growth potential and unmatched flexibility to scale-up production; the potential for additional business opportunities including vanadium, copper, alternate feed materials, and the cleanup of historic mines on the Navajo Nation and in the Four Corners Region of the U.S.; the potential for optimizing mining and processing; the Company’s belief in its readiness to capitalize on improving markets; global uranium supply risks; and expected worldwide uranium supply and demand fundamentals.All statements contained herein which are not historical facts are forward-looking statements that involve risks, uncertainties and other factors that could cause actual results to differ materially from those expressed or implied by such forward-looking information and forward-looking statements. Factors that could cause such differences, without limiting the generality of the foregoing include: risks that the synergies and effects on value described herein may not be achieved; risks inherent in exploration, development and production activities; volatility in market prices for uranium and vanadium; the impact of the sales volume of uranium and vanadium; the ability to sustain production from mines and the mill; competition; the impact of change in foreign currency exchange; imprecision in mineral resource and reserve estimates; environmental and safety risks including increased regulatory burdens; changes to reclamation requirements; unexpected geological or hydrological conditions; a possible deterioration in political support for nuclear energy; changes in government regulations and policies, including trade laws and policies; demand for nuclear power; replacement of production and failure to obtain necessary permits and approvals from government authorities; weather and other natural phenomena; ability to maintain and further improve positive labour relations; operating performance of the facilities; success of planned development projects; and other development and operating risks. Should one or more of these risks or uncertainties materialize, or should underlying assumptions prove incorrect, actual results may vary materially from those anticipated, believed, estimated or expected. Although Energy Fuels believes that the assumptions inherent in the forward-looking statements are reasonable, undue reliance should not be placed on these statements, which only apply as of the date of this presentation. Energy Fuels does not undertake any obligation to publicly update or revise any forward-looking information or forward looking statements after the date of this presentation to conform such information to actual results or to changes in Energy Fuels’ expectations except as otherwise required by applicable legislation.Additional information about the material factors or assumptions on which forward looking information is based or the material risk factors that may affect results is contained under “Risk Factors” in Energy Fuels' annual report on Form 10-K for the year ended December 31, 2017 which was filed with the SEC on March 9, 2018. These documents are available on SEDAR at www.sedar.com and on EDGAR at www.sec.gov.
!24

NOTICE REGARDING TECHNICAL DISCLOSURE
All of the technical information in this presentation concerning Energy Fuels’ properties was prepared in accordance with the Canadian regulatory requirements set out in National Instrument 43-101 - Standards of Disclosure for Mineral Projects of the Canadian Securities Administrators (“NI 43-101”). The technical information on each of the properties which are currently material to Energy Fuels is based on independent technical reports prepared in accordance with NI 43-101, as detailed below. The following technical reports are available for viewing at www.sedar.com under Energy Fuels’ SEDAR profile: Technical information regarding Energy Fuels’ Colorado Plateau properties is based on the following technical reports: (i) “Technical Report on the Henry Mountains Complex Uranium Property, Utah, U.S.A.” dated June 27, 2012 authored by William E. Roscoe, Ph.D., P.Eng., Douglas H. Underhill, Ph.D., C.P.G., and Thomas C. Pool, P.E. of Roscoe Postle Associates Inc.; (ii) “Updated Report on The Daneros Mine Project, San Juan County, Utah, U.S.A.“ dated March 2, 2018 authored by Douglas C. Peters, C.P.G., of Peters Geosciences; (iii) “Updated Technical Report on Sage Plain Project (Including the Calliham Mine), San Juan County, Utah, USA” dated March 18, 2015 authored by Douglas C. Peters, C.P.G., of Peters Geosciences; (iv) “Updated Technical Report on Energy Fuels Resources Corporation’s Whirlwind Property (Including Whirlwind, Far West, and Crosswind Claim Groups and Utah State Metalliferous Minerals Lease ML-49312), Mesa County, Colorado and Grand County, Utah” dated March 15, 2011 authored by Douglas C. Peters, C.P.G., of Peters Geosciences. Technical information regarding Energy Fuels’ Arizona Strip properties is based on the following technical reports: (i) "Technical Report on the Arizona Strip Uranium Project, Arizona, U.S.A.“ dated June 27, 2012 and authored by Thomas C. Pool, P.E. and David A. Ross, M. Sc., P.Geo. of Roscoe Postle Associates Inc.; (ii) "Technical Report on the EZ1 and EZ2 Breccia Pipes, Arizona Strip District, U.S.A.“ dated June 27, 2012 and authored by David A. Ross, M.Sc., P.Geo. and Christopher Moreton, Ph.D., P.Geo., of Roscoe Postle Associates Inc.; (iii) “NI 43-101 Technical Report on Resources Wate Uranium Breccia Pipe – Northern Arizona, USA” dated March 10, 2015 and authored by Allan Moran, CPG AIPG and Frank A. Daviess, MAusIM, RM SME of SRK Consulting (US), Inc.; and (iv) “Technical Report on the Canyon Mine, Coconino County, Arizona, U.S.A.” dated October 6, 2017, and authored by Mark B. Mathisen, C.P.G., Valerie Wilson, M.Sc., P.Geo., and Jeffrey L. Woods, QP MMSA of Roscoe Postle Associates. The technical information in this presentation regarding the Sheep Mountain Project is based on the technical report entitled “Sheep Mountain Uranium Project Fremont County, Wyoming USA – Updated Preliminary Feasibility Study – National Instrument 43-101 Technical Report” dated April 13, 2012 authored by Douglas L. Beahm P.E., P.G. The technical information in this presentation regarding the Roca Honda Project is based on the technical report entitled “Technical Report on the Roca Honda Project, McKinley County, New Mexico, U.S.A.” dated October 27, 2016 authored by Robert Michaud, P.Eng; Stuart E. Collins, P.E.; Mark B. Mathisen, CPG, of RPA (USA) Ltd. and Harold R. Roberts, P.E. and COO of Energy Fuels. The technical information in this presentation regarding the La Sal project is based on a technical report entitled “Technical Report on La Sal District Project (Including the Pandora, Beaver and Energy Queen Projects), San Juan County, Utah, U.S.A.” dated March 26, 2014 authored by Douglas C. Peters, CPG. The technical information in this presentation regarding the Alta Mesa ISR Project is based on a technical report entitled “Alta Mesa Uranium Project, Alta Mesa and Mesteña Grande Mineral Resources and Exploration Target, Technical Report National Instrument 43-101”, dated July 19, 2016 authored by Douglas L. Beahm, P.E., P.G. of BRS Engineering.
The following technical reports are available for viewing at www.sedar.com under Uranerz’ SEDAR profile: The technical information in this presentation regarding the Nichols Ranch, Jane Dough, and Hank properties is based on the technical report entitled “Nichols Ranch Uranium Project 43-101 Technical Report – Preliminary Economic Assessment - Campbell and Johnson Counties, Wyoming" dated February 25, 2015” authored by Douglas L. Beahm, P.E., P.G. of BRS and Paul Goranson, P.E. of Uranerz Energy Corporation. The technical information in this presentation regarding the Reno Creek Property is based on the technical report entitled “Reno Creek Property: "Technical Report - Reno Creek Property- Campbell County, Wyoming, U.S.A." dated October 13, 2010” authored by Douglass H. Graves, P.E. of TREC, Inc. The technical information in this presentation regarding Uranerz’ West North Butte Properties is based on the technical report entitled “West North Butte Properties: "Technical Report - West North Butte Satellite Properties - Campbell County, Wyoming, U.S.A." dated December 9, 2008” Douglass H. Graves, P.E. of TREC, Inc. The technical information in this presentation regarding Uranerz’ North Rolling Pin Property is based on the technical report entitled " North Rolling Pin Property: "Technical Report - North Rolling Pin Property - Campbell County, Wyoming, U.S.A." dated June 4, 2010” authored by Douglass H. Graves, P.E. of TREC, Inc. John White, P.E., is a Qualified Person as defined by NI 43-101 and has reviewed and approved the technical disclosure contained in this document.
!25

CAUTIONARY STATEMENTS FOR US INVESTORS CONCERNING MINERAL RESOURCES
This presentation may use the terms "Measured", "Indicated“ and "Inferred" Resources. U.S. investors are advised that, while such terms are recognized and required by Canadian regulations, the United States Securities and Exchange Commission (“SEC”) does not recognize them. "Inferred Resources" have a great amount of uncertainty as to their existence, and great uncertainty as to their economic feasibility. It cannot be assumed that all or any part of an Inferred Resource will ever be upgraded to a higher category. Under Canadian rules, estimates of Inferred Resources may not form the basis of feasibility or pre-feasibility studies. U.S. investors are cautioned not to assume that all or any part of Measured or Indicated Mineral Resources will ever be converted into Mineral Reserves. Accordingly, U.S. investors are advised that information regarding Mineral Resources contained in this presentation may not be comparable to similar information made public by United States companies.
Mineral resources disclosed in this presentation and in the NI 43-101 technical reports referenced herein have been estimated in accordance with the definition standards on mineral resources and mineral reserves of the Canadian Institute of Mining, Metallurgy and Petroleum referred to in National Instrument 43-101, commonly referred to as "NI 43-101". The NI 43-101 technical reports may include estimations of potential mineral resources for further targeted exploration by Energy Fuels, disclosed pursuant to the applicable provisions of NI 43-101.The NI 43-101 technical reports referenced herein are a requirement of NI 43-101 and includes estimations of mineral resources and potential mineral resources for further targeted exploration by the issuer disclosed pursuant to the applicable provisions of NI 43-101. As a company listed on the TSX, Energy Fuels is required by Canadian law to provide disclosure in accordance with NI 43-101. US reporting requirements for disclosure of mineral properties are governed by the SEC and included in the SEC's Securities Act Industry Guide 7 entitled "Description of Property by Issuers Engaged or to be Engaged in Significant Mining Operations" ("Guide 7"). NI 43-101 and Guide 7 standards are substantially different. For example, the terms "mineral reserve", "proven mineral reserve" and "probable mineral reserve" are Canadian mining terms as defined in accordance with NI 43-101. These definitions differ from the definitions in Guide 7. The NI 43-101 technical reports and this presentation use or may use the terms “probable mineral reserve”, "mineral resource“, “measured mineral resource”, “indicated mineral resource”, “Inferred mineral resource”, "potential uranium exploration target", "potential mineral resource", "potential mineral deposit" and "potential target mineral resource". US Investors are advised that these terms and concepts are set out in and required to be disclosed by NI 43-101 as information material to the issuer; however, these terms and concepts are not recognized by the SEC or included in Guide 7, and these terms and concepts are normally not permitted to be used in reports and registration statements filed with the SEC. US Investors should be aware that Energy Fuels has no "reserves" as defined by Guide 7 and are cautioned not to assume that any part or all of an inferred mineral resource or potential target mineral resources will ever be upgraded to a higher category or confirmed or converted into Guide 7 compliant "reserves". US Investors are cautioned not to assume that all or any part of a potential mineral resource exists, or is economically or legally mineable.
!26

RESOURCE SUMMARY
URANIUM Measured Indicated InferredTons (‘000) Grade (% U3O8) Lbs. U3O8 (‘000) Tons (‘000) Grade (% U3O8) Lbs. U3O8 (‘000) Tons (‘000) Grade (% U3O8) Lbs. U3O8 (‘000)
Nichols Ranch 641 0.13% 1,694 428 0.13% 1,079 - - - Jane Dough2 - - - 1,533 0.11% 3,567 138 0.11% 309 Hank2 - - - 450 0.10% 855 423 0.10% 803 West North Butte Satellite Properties - - - 926 0.15% 2,837 1,117 0.12% 2,682 North Rolling Pin 310 0.06% 387 272 0.05% 278 39 0.04% 33 Arkose Mining Venture2 - - - - - - 1,667 0.10% 3,293 Wyoming ISR Total 951 0.11% 2,081 3,609 0.12% 8,616 3,384 0.11% 7,120
Alta Mesa ISR Project 123 0.15% 371 1,512 0.11% 3,246 6,964 0.12% 16,794
Henry Mountains Complex - - - 2,410 0.27% 12,805 1,615 0.25% 8,082
Sheep Mountain Project1 - - - 12,895 0.12% 30,285 - - -
Roca Honda Project 208 0.48% 1,984 1,303 0.48% 12,580 1,198 0.47% 11,206
Canyon 6 0.43% 56 132 0.90% 2,378 18 0.44% 134Wate - - - - - - 71 0.79% 1,118 EZ Complex - - - - - - 224 0.47% 2,105 Arizona 1 - - - - - - 26 0.26% 134Arizona Strip Total 6 0.43% 56 132 0.90% 2,378 339 0.51% 3,491
La Sal Complex 1,010 0.18% 3,732 132 0.14% 367 185 0.10% 361 Whirlwind - - - 169 0.30% 1,003 437 0.23% 2,000 Daneros - - - 20 0.36% 142 7 0.37% 52Sage Plain 444 .18 1,540 31 0.11% 71 12 0.16% 37 Colorado Plateau Total 1,453 0.18% 5,272 352 0.22% 1,583 641 0.19% 2,450
Total Uranium 9,764 71,493 49,143
1 Sheep Mountain Project’s 30m lbs. of Indicated Resources includes Probable Mineral Reserves of 18.4 million lbs. of U3O8 contained in 7.4 million tons at a grade of 0.123% U3O8 in accordance with NI 43-101.
2 Figure includes only joint venture share of mineral resources applicable to Energy Fuels.
!27
VANADIUM Tons (‘000) Grade (% V2O5) Lbs. V2O5 (‘000) Tons (‘000) Grade (% V2O5) Lbs. V2O5 (‘000) Tons (‘000) Grade (% V2O5) Lbs. V2O5 (‘000)
La Sal Complex 1,010 0.97% 19,596 132 0.73% 1,930 185 0.51% 1,902Other 240 1.32% 6,350 198 0.96% 3,816 447 0.74% 6,600
COPPER Tons (‘000) Grade (% Cu) Lbs. Cu (‘000) Tons (‘000) Grade (% Cu) Lbs. Cu (‘000) Tons (‘000) Grade (% Cu) Lbs. Cu (‘000)
Canyon 6 9.29% 1,203 94 5.70% 10,736 5 5.90% 570
Cautionary Note to U.S. Investors: The Company is without known mineral reserves under SEC Industry Guide 7. Measured, Indicated, and Inferred Resources are estimated in accordance with NI 43-101 (Canada) and do not constitute SEC Industry Guide 7 compliant reserves. See the section heading “Cautionary Statements for U.S. investors Concerning Mineral Resources” herein.