UPWELLING VARIABILITY AT JARVIS ISLAND A...
52
UPWELLING VARIABILITY AT JARVIS ISLAND A THESIS SUBMITTED TO THE GRADUATE DIVISION OF THE UNIVERSITY OF HAWAI'I IN PARTIAL FULFILLMENT OF THE REQUIREMENTS FOR THE DEGREE OF MASTER OF SCIENCE IN OCEANOGRAPHY MAY 2005 By Jamison M. Gove Thesis Committee: Mark Merrifield, Chairperson Russell Brainard Eric Firing Robert Bidigare
Transcript of UPWELLING VARIABILITY AT JARVIS ISLAND A...

UPWELLING VARIABILITY AT JARVIS ISLAND
A THESIS SUBMITTED TO THE GRADUATE DIVISION OF THEUNIVERSITY OF HAWAI'I IN PARTIAL FULFILLMENT
OF THE REQUIREMENTS FOR THE DEGREE OF
MASTER OF SCIENCE
IN
OCEANOGRAPHY
MAY 2005
ByJamison M. Gove
Thesis Committee:
Mark Merrifield, ChairpersonRussell Brainard
Eric FiringRobert Bidigare

© 2005, Jamison M. Gove
111

DEDICATION
I dedicate this thesis to my grandmother, Catherine Tice. Thank you for your
eternal support and encouragement and for playing such a significant and influential role
throughout my life. You have and always will be an inspiration to us all.
IV

ACKNOWLEDGEMENTS
I would like to express the utmost gratitude to Dr. Mark Merrifield for the
tremendous amount of time, supervision, and assistance he gave me throughout this
research. His guidance and advice will stay with me for many years to come. I would
like to thank Dr. Russell Brainard not only for funding this research, but for initially
presenting me with the opportunity to work on such a fascinating and exciting project. I
am also thankful to Dr. Eric Firing and Dr. Robert Bidigare for their valuable comments
and help during this project.
I would like to thank the many individuals who contributed greatly to this
research including Yvonne Firing, Jules Hummond, Ronald Hoeke, Robert Schroeder,
Matthew Dunlap, Oliver Dameron, Molly Timmers, Shikiko Nakahara, Dave Foley,
Jerome Aucan, June Firing, and a number of additional SOEST, CRED, and PIFSC staff.
Special thanks to Nancy Koike for the significant help with the seemingly endless
amount of forms and paperwork associated with graduate school and to both Nancy and
Rene Tada for always having such a positive influence on my day.
I am especially thankful and indebted to my family who has given me a
substantial amount of support and love. Particularly I would like to thank my mother,
sister, and grandmother for being such a solid foundation throughout my life and for their
invaluable advice and constant encouragement.
Lastly, I would like to thank my friends, who have played a crucial role in my
happiness throughout this research and my life here in Hawai'i.
v

ABSTRACT
The interaction of the equatorial undercurrent (EVC) with Jarvis Island results in
localized upwelling on the western (upstream) side of the island. Observed fish
densities and benthic habitat distributions relate strongly to the upwelling pattern. A
simple diagnostic model based on the Bernoulli equation confirms that upwelling
depends on the depth of the thermocline and the strength and depth of the EVC, which
are modulated by equatorial wind forcing. Strongest upwelling at Jarvis occurs in
boreal spring when annual wind forcing leads to a shallow thermocline and shallow and
strong EVC. Interannual variations in seasonal upwelling are tied to ENSO; La Nina
conditions enhance upwelling at Jarvis by inducing a regional shoaling of the
thermocline and the EVC. On intraannual time scales, cessation or reversal of strong
westerly wind events in the western Pacific generates Kelvin waves, which are
upwelling-favorable at Jarvis. Trade wind relaxations in the central Pacific result in
strong eastward surface jets at Jarvis (> 1.00 m S-I); however, these events are
downwelling favorable. During periods of EVC-driven upwelling, interactions of the
semidiurnal tide with Jarvis result in abrupt cold spikes (I-4°C) that tend to occur at
~12 hour periods. Tidal currents and temperature fluctuate 180° out ofphase, such that
maximum upwelling coincides with maximum eastward current. The presence of
internal tides, either locally or remotely generated, likely accounts for the tidal
upwelling signal.
VI

TABLE OF CONTENTS
Acknowledgements v
Abstract vi
L· fF' ...1st 0 19ures Vlll
Chapter 1: Introduction 1
Chapter 2: Background 4
2.1 Previous Studies of Jarvis Island .4
2.2. Oceanographic Setting 6
Chapter 3: Data Collection 9
Chapter 4: Spatial Surveys ofIs1and Upwelling 12
4.1 Current Structure 12
4.2 Sea Surface and Subsurface Temperatures 14
4.3 Biological Data 19
Chapter 5: Temporal Variability ofUpwelling .22
Chapter 6: Wind Variability and Kelvin Waves 27
Chapter 7: Diagnostic Upwelling Model 33
Chapter 8: Upwelling at Tidal Frequencies 35
Chapter 9: Conclusion 38
References 41
Vll

LIST OF FIGURES
Figure Page
3.1 Ikonos satellite image of Jarvis Island 11
3.2 Map depicting Jarvis Island, nearby TAO buoys and Christmas Island 11
4.1 Shipboard ADCP data taken to the west and east of Jarvis Island 13
4.2 Zonal current from the TAO buoy at OON, 170oW, January 2000 toDecember 2002 13
4.3 SST around Jarvis in 2000,2001, and 2002 15
4.4 Temperature at 25 m from shallow water CTD casts around Jarvisin 2000,2001, and 2002 16
4.5 Temperature profiles from shallow water CTD casts around Jarvisin 2000,2001, and 2002 18
4.6 Depth of the 25°C isotherm from the TAO buoy at OON, 155°W, March 2000to April 2002 19
4.7 Benthic habitat distribution around Jarvis obtained in 2002 20
4.8 Planktivore densities at four survey locations at Jarvis obtained in 2002 .21
5.1 Twenty-two month time series (March 2002 to December 2003) of in-situtemperature and current at Jarvis, depth of the 25°C isotherm from theTAO buoy at OON, 155°W, sea level from Christmas Island, and zonalcurrent from the TAO buoy at OON, 170oW .25
5.2 In-situ temperature at Jarvis, 15 April 2003 to 15 July 2003 26
5.3 Power spectrum of in-situ temperature and current 26
6.1 Longitude-time plots along the equator from March 2002 to December2003 of zonal winds, zonal wind anomalies, estimated zonal surfacecurrent, estimated zonal surface current anomalies, and 200 e isothermdepth anomalies 29
6.2 SST and wind anomaly vectors and zonal temperature-depth sectionanomalies along the equator, September 2002 to May 2003 32
7.1 Dynamic upwelling model 34
Vlll
8.1 In-situ temperature and current at Jarvis, 25 June to 26 June 2003 35
9.1 Sea level at Christmas Island, 1970 to 2005 .39
IX

CHAPTER 1: INTRODUCTION
Jarvis Island is a small island (~4.5 km2) located in the central equatorial Pacific
at 00 22.5'S, 1600 1.0'W (Figures 3.1, 3.2). Its proximity to the equator and isolation
from neighboring islands causes Jarvis to be directly in the path of the high velocity
equatorial undercurrent (EVC). The interaction of the EVC with Jarvis has been the
focus of previous studies (Hendry and Wunsch, 1973; Roemmich, 1984; henceforth
HW73 & R84, respectively). HW73 observed isotherm uplift on the west (upstream
relative to the EVC) side of Jarvis compared to the east. They attributed this to the
blocking of the EVC by Jarvis, resulting in flow stagnation and positive vertical isotherm
displacements on the upstream side in accord with the Bernoulli equation for steady,
inviscid flow past a cylindrical island. R84 found island pressure measurements to be
consistent with this scenario.
Oceanographic settings are inherently variable, especially when considering an
isolated island in the equatorial Pacific. Although variability in Bernoulli driven
upwelling was not a point of discussion in either of the previous studies, we observe that
isopycnal displacements and near shore temperatures vary on interannual to semidiurnal
time scales. We find that upwelling variability at Jarvis depends on a variety oflarge
scale, low frequency processes including the EI Nilfio-Southern Oscillation (ENSO),
intraseasonal equatorial trapped Kelvin waves, surface jets associated with trade wind
relaxations, and seasonal variations in the strength and depth of the EVC. In addition,
when conditions are conducive for EVC-driven upwelling, interactions of the semidiurnal
tide with the island result in high frequency temperature changes at the surface.
1

Like most near-equatorial islands, Jarvis features a well-developed coral reef
ecosystem (Maragos, 2004). Variable intrusions of cold water to the surface layer can
potentially serve as an important source of nutrients and suspended particles (Leichter
and Miller, 1999), thereby enhancing overall reef ecosystem productivity. We find that
the spatial variation in benthic habitat and planktivore distributions are strongly
influenced by upwelling at Jarvis. Both show a marked correspondence with the spatial
upwelling pattern.
In an attempt to assess upwelling variability near Jarvis, this paper incorporates
data from previous studies: oceanographic and biological data from three recent Coral
Reef Ecosystem Division (CRED) ship surveys of Jarvis; various meteorological and
oceanographic data from the Tropical Atmosphere Ocean (TAO) array; satellite derived
zonal surface currents and SST; historical sea level data obtained from the University of
. Hawaii Sea Level Center (UHSLC); and a two-year time series of in-situ data from a
current-temperature-salinity mooring. The objectives of this research are to describe the
large-scale oceanographic variability in the vicinity of Jarvis Island that promotes EUC
driven upwelling, to assess the role of equatorial Pacific winds in establishing these
conditions, and to consider tidal enhancement ofEUC-driven upwelling on semidiumal
time scales.
The paper is organized as follows: previous studies at Jarvis and the general
oceanographic conditions in the region are summarized (Section 2); the datasets used in
this paper are described (Section 3); recent hydrographic and ecological surveys are used
to depict spatial patterns of upwelling and biological conditions at Jarvis (Section4);
moored data at Jarvis and at nearby TAO buoys are used to describe temporal variations
2

in upwelling (Section 5); the importance of western Pacific winds and associated basin
wide adjustments to upwelling/downwelling Kelvin waves is considered (Section 6);
observed upwelling at Jarvis is shown to be consistent with a model for EVe-driven
upwelling based on the Bernoulli equation (Section 7); cold temperature spikes at the
semidiumal period are considered in relation to tidal processes (Section 8); and the major
results are summarized and suggestions for future work are considered (Section 9).
3

CHAPTER 2: BACKGROUND
2.1 Previous Studies ofJarvis Island
Through a series of salinity-temperature-depth (STD) casts taken during a two-
day survey of Jarvis in April 1971 , HW73 noted large deflections and vertical spreading
ofisopycnals directly upstream (west) and a distinct wake effect downstream (east) of the
island. Upstream isopycnal deflections were found to be consistent with the Bernoulli
equation (1) describing inviscid, steady, stratified shear flow past an obstacle;
1 2-u +gt;-D=.B2
(1)
where u is the horizontal velocity in the x-direction, g is gravity, t; is the sea surface
elevation andD is the "dynamic depth" (m2S-2) defined by;
D = fP a(x,y,p')dp'Parm
(2)
where a is the specific volume of water in cm2 g-l, P is the pressure level in decibars, x
and y are horizontal coordinates and Patm is the atmospheric pressure at the sea surface.
The Bernoulli constant (B) is conserved following streamlines, hence reduction in flow
near Jarvis results in pressure increases associated with t; and/or D. HW73 assumed a
negligible t; contribution compared to the baroclinic term. Thus, isotherm
displacements are related directly to changes in flow speed.
Using the ideal fluid model of Drazin (1961) and the potential flow solution of
Lamb (1932), HW73 computed isopycnal displacements (z) from a rest state (zo) caused
by flow around a cylindrical island as
(3)
4

where (4)
Far upstream, positive zonal flowU(z) and densityp(z) are specified, V is the velocity
scale, h is the height scale, N 2 =( - g / p) dp is the square of the Brunt-Viiisiiliidzo
frequency, (q,2 -1) is the velocity perturbation induced by an elliptical obstacle divided
by the far field velocity as computed by Lamb (1932), and both J and Mare non-
dimensional. When applied outside the downstream wake region, HW73 found that the
scale of displacement of a particular density surface computed by
(5)
is in good agreement with observed isopycnal displacements.
Expanding on the findings ofHW73, R84 conducted two ship surveys in
November 1982 and March 1983 around Jarvis to study the energetics of a swift current
encountering an island obstacle. Using an array of temperature-pressure recorders,
temporal variations in the pressure field around Jarvis were estimated and used to
compute the free stream velocity. Rather than assuming negligible surface effects, R84
observed current velocity close to zero at 250 m and assumed the pressure field was
approximately uniform at this particular depth, thus allowing for the vertical integration
of the hydrostatic relation to obtain the pressure distribution around the island. R84
showed that potential energy increases and kinetic energy decreases as the flow
approaches the upstream stagnation point and computed the pressure elevation to be
~YzU2 at the stagnation point, in accord with the analytic results ofHW73.
Wyrtki and Eldin (1982) examined locally wind-driven upwelling in the Jarvis
Island region, which is distinct from upwelling caused by flow interaction with the island.
5

During an 18 month study from February 1979 to June 1980, Wyrtki and Eldin used
equatorial cross-sections from the Hawaii-Tahiti Shuttle Experiment, zonal wind speeds
measured at Jarvis and at a mooring near 153°W, and SST and sea level from Jarvis to
capture equatorial upwelling events (defined as a positive vertical migration of the 26°C
isotherm). Five distinct easterly wind bursts (6-10 m S-I), each lasting ten days to three
weeks, caused a decrease in sea level and SST at Jarvis, and an average vertical migration
of 3-5 m dai1 of the 26°C isotherm near 153°W. Wyrtki and Eldin concluded that
easterly winds result in Ekman transport away from the equator, a decrease in sea level,
an uplift of isotherms, and an eventual decrease in SST.
2.2 Oceanographic Setting
The structure of the Pacific equatorial current system, specifically the EVC, has
been well studied by numerous investigators (Cromwell, 1953; Knauss, 1960; Wyrtki et
aI., 1981; Firing, 1981; Firing et aI., 1983; Wyrtki and Kilonsky, 1984; Yu and
McPhaden, 1999; Keenlyside and Kleeman, 2002). In general, the equatorial region is
dominated by easterly trade winds spanning the Pacific basin. These winds force a
complex system ofwestward-flowing surface currents and eastward-flowing surface and
subsurface counter-currents. The EVC, a cold and nutrient rich (Chavez et aI., 1999)
eastward-flowing subsurface counter-current, lies along the equator and within the
thermocline, with undercurrent core depths ranging from 200 m in the western Pacific to
20 m in the east, and a mean flow of 100 m S-1 (Yu and McPhaden, 1999). The South
Equatorial Current (SEC), a westward-flowing current, lies directly above the EVC and is
generally a much weaker and warmer current than the EVC (Yu and McPhaden, 1999;
Keenlyside and Kleeman, 2002).
6

The equatorial Pacific has been an area of intense study primarily due to ENSO,
which has a significant impact on regional and global climate (Yu and McPhaden, 1999).
This variability strongly influences oceanographic and atmospheric conditions throughout
the Pacific basin including sea surface temperature, precipitation, winds, currents, and
biological production (Philander, 1990; McPhaden et aI., 1998). During an EI Nifio, trade
winds weaken and occasionally reverse in the equatorial Pacific, resulting in anomalously
warm sea surface temperatures and eastward surface transport (Yu and McPhaden, 1999).
These wind anomalies are typically in the form ofwesterly wind bursts in the western
Pacific, which generate equatorial trapped Kelvin waves that propagate eastward, altering
the sea surface slope and depressing the thermocline. During an EI Nifio, the EVe has
been observed to weaken and, on rare occasions, reverse direction (Firing et aI., 1983;
Roemmich, 1984).
Oceanographic conditions in the equatorial Pacific display a prominent seasonal
cycle. The EVe and upper thermocline undergo large seasonal vertical migrations in the
central Pacific beginning in January, with maximum shoaling occurring during boreal
springtime (Yu and McPhaden, 1999; Keenlyside and Kleeman, 2002). Sea surface
heights seasonally vary 1800 out of phase with thermocline depth, with minima (maxima)
surface heights corresponding roughly to periods of shallowest (deepest) thermocline
depth (Wyrtki and Eldin, 1982; Yu and McPhaden, 1999). Eastward zonal subsurface
currents are strongest in boreal spring as a result of trade wind relaxations in the eastern
Pacific, which cause a basin-wide adjustment of the pressure gradient (McPhaden et aI.,
1998). From the surface to the EVe core, a pronounced basin wide eastward surge
occurs around April-July causing the EVe to strengthen and shoal, and the SEe to
7

weaken (McPhaden et aI, 1998; Yu and McPhaden, 1999; Keenlyside and Kleeman,
2002). Conditions during boreal spring are the most conducive for EVC-driven
upwelling at Jarvis.
8

CHAPTER 3: DATA COLLECTION
The Coral Reef Ecosystem Division (CRED), part ofthe Pacific Islands Fisheries
Science Center, conducted a series of hydrographic and biological surveys around Jarvis
Island during the winters of2000-2002 on the RIV Townsend Cromwell. Hydrographic
data include numerous shallow water CTD casts (max 30 m depth), shipboard Acoustic
Doppler Current Profiler (SADCP) surveys, and SST measurements around the perimeter
of Jarvis. Shallow water CTD casts were performed using a 2 Hz Sea Bird Electronics
(SBE) 19 SEACAT profiler (accuracy of 0.001 ms cm-1 in conductivity, O.Ol°C in
temperature, and 0.25% in depth). The CTD profilers were hand-lowered off a small
boat at approximately a 0.5 to 0.75 m S-l descent rate to a maximum depth of30 meters.
During 2002, mechanical failures limited the spatial extent of the surveys. Specific
locations of each cast were recorded using a hand held global positioning system (GPS).
SST data were obtained from the shipboard SBE thermo-salinograph. SADCP
measurements were taken using a 150 kHz narrow-band RDI ADCP. The system
configuration was an 8 m pulse length, 8 m depth bins (re-gridded to 10 m depth bins)
starting at 20 m and extending typically to 350 m, and 15 min averaged ensembles.
SADCP data were not obtained on the east side of the island in 2000.
Biological data include fish surveys and towed diver benthic video surveys. Non
invasive underwater belt-transects were conducted to enumerate planktivore assemblages
at replicate sites around Jarvis. During transects, a pair of scuba diver-observers
conducted parallel swims along three 25 m long transect lines (10-15 m depth, 2 m
width), recording fish number and length, enabling biomass density calculations by site
(for further explanation see Schroeder et aI., 2004). Benthic habitats were surveyed in
9

2002 using a towed diver on a towboard equipped with a downward high resolution
digital video camera to quantify habitat composition and complexity. Further detail on
belt-transect protocols, towboard protocols, and digital video data analysis is found in
Kenyon et al. (2004).
A 22 month time series (March 2002 - December 2003) of temperature and
current measurements was obtained from a 3 beam configured 1000 kHz SonTek
Acoustic Doppler Profiler (ADP) with an attached SBE 37 MicroCAT temperature
salinity recorder moored on the bottom in 14 m of water off the southwest tip of Jarvis
(Figure 3.1). SBE 37 temperature and salinity data were sampled every 15 min. Current
and temperature from the ADP were averaged for 7 min every 2 hr through the
deployment.
Equatorial Pacific oceanographic conditions were specified using the Tropical
Atmosphere-Ocean (TAO) array buoy data, including zonal wind, subsurface temperature
and 20°C isotherm depth anomalies. Zonal ADCP currents and the depth of the 25°C
isotherm were obtained from two specific TAO buoys on the equator at 1700 W and
155°W, 1000 km and 500 km away from Jarvis, respectively (Figure 3.2). Satellite
derived zonal ocean currents were obtained from the National Oceanic and Atmospheric
Administration's (NOAA) Ocean Surface Current Analysis - Real time (OCSCAR)
model and Pathfinder 9 km resolution SST data were obtained from the Central Pacific
Node ofNOAA Coast Watch.
Sea level data were obtained from the Christmas Island (1 ° 59.0'N, 157° 28.0'W)
tide gauge maintained by the UHSLC (Figure 3.2). Sea level was also measured on
Jarvis Island from September 1981 to December 1987. Although tide gauge
10

observations at Jarvis were not available during the time of the CRED surveys, the Jarvis
record is well correlated with that of Christmas Island (correlation of0.91). Thus, we use
Christmas Island tide gauge data as a proxy to represent sea level variations at Jarvis.
Figure 3.1 An Ikonos satellite image ofJarvis Island showing the location of the Acoustic Doppler Profiler(ADP) and SBE 37 MicroCAT temperature-salinity recorder moored on the bottom in 14 m water depth.
,ww 17G1"'W ,"OW ,..ow , ..'W ,..OW
Figure 3.2. Sea level data are obtained from Christmas Island (01 ° 59.0'N, 157° 28.0'W) and zonal ADCPdata and depth of the 25°C isotherm are obtained from TAO buoys at 0°, 1700 W and 0°, 155°W,respectively.
11

CHAPTER 4: SPATIAL SURVEYS OF ISLAND UPWELLING
4.1 Current Structure
The SADCP data indicate the strength and depths of the dominant currents, the
EVC and the SEC, at Jarvis during the 2000,2001, and 2002 survey cruises. Current
profiles taken ~4 Ian to the west of the island show EVC flow speeds strongest in 2000,
with a strong eastward flow of 1.06 m S-l centered at 145 m, and a broad profile spanning
~180 m of depth (Figure 4.1 a). The westward SEC is also apparent in the profile, but is
relatively weak (-0.10 m S-l) in the upper 40 m. In 2001, currents near Jarvis show a
weakening of the EVC and a strengthening of the SEC. The EVC core remains at a
similar depth (140 m) as the previous year, but is nearly 0.20 m S-l weaker with flow
speeds peaking at 0.87 m S-l. A stronger SEC (~0.25 m S-l) is observed in 2001 with
flows in the upper 40 m. In 2002, the EVC is weaker than in 2000, but similar to that of
the previous year with flow speeds peaking at 0.83 m S-l. Core depth deepens
substantially to 180 m, which is ~40 m deeper than in 2000 and 2001. The SEC extends
to a similar depth to that observed in 2001 but the flow speed weakens to 0.18 m S-l.
SADCP profiles on the east side of the island differ substantially from those on
the west (Figure 4.1b). In 2001, the SEC extends down to nearly 85 m with strong
westward flow speeds near the surface (0.36 m S-l). In 2002, the SEC is slightly
shallower and weaker than in 2001. Westward flow comprises the upper 60 m with
maximum flow speeds near the surface (~0.25 m S-l). Below the SEC, the downstream
profiles exhibit a weak and confused oscillatory flow pattern down to 250 m, likely
associated with wake effects derived from island-EVC interactions.
12

0.10
--- --.\,, , ··f..,, .,
.,~ .....
; I,-,, , ,
I,I ,,
-- -" --.
,,
(b) ea~t
-50
-lOll
-200-
-250 • 1001
~
'1-150
o
- 2000- • 1001
100)
.(/J()
-I
-200
020 - -- o.«r - o.eo -Ii. 1.00 20 -<1.10 0ZONI Current 1m r') ZDnaJ Cutmll 1m r?
Figure 4.1. Zonal velocity as a function ofdepth measured -4 km to the west (a) and east (b) of JarvisIsland during CRED survey years in 2000 (solid black line), 2001 (dashed red line) and 2002 (dotted blueline). Velocity was not measured to the east of Jarvis in 2000.
O-r---r------~'----_r_----------_..~-----_t_..224
.s=....Q.
~2
'..-.~=r,.-~.,.I.l.I.~......---..............Iloo-......W-,..L.;.~:-..__..--.:-.:::...::a----.....+..·224JFMAMJJASONDJFMAMJJASONDJFMAMJJASOND
2000 2001 2002Figure 4.2. Daily zonal current from the TAO buoy at OON, 170oW, January 2000 to December 2002. Thetime period encompasses the CRED surveys ofJarvis Island indicated by the black arrows in March 2000,February 2001, and March 2002.
The depth and strength of the EVe measured at the TAO buoy at OON, 1700 W are
similar to the SADep profiles on the upstream side ofJarvis (Figure 4.2). In all three
hydrographic surveys, the EVe is 0.05 to 0.20 m S·l faster at 1700 W than that measured at
Jarvis and 0 to 20 m deeper. The observed EVe depth difference is likely due the
downward slope of the thermocline toward the west; the TAO buoy is -1000 kIn to the
13
west of Jarvis. The decrease in flow speed at Jarvis relative to TAO is likely due to
proximity (~4 km) of the SADCP observations to the island.
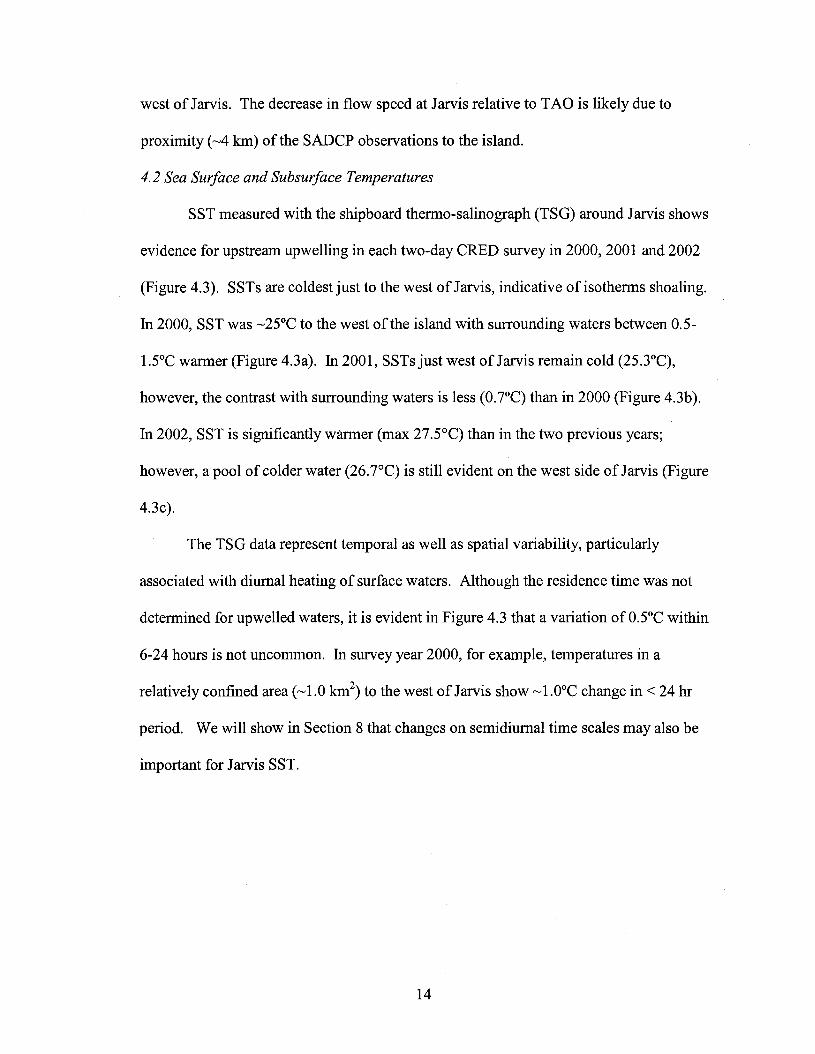
4.2 Sea Surface and Subsurface Temperatures
SST measured with the shipboard thenno-salinograph (TSG) around Jarvis shows
evidence for upstream upwelling in each two-day CRED survey in 2000,2001 and 2002
(Figure 4.3). SSTs are coldest just to the west of Jarvis, indicative of isothenns shoaling.
In 2000, SST was ~25°C to the west ofthe island with surrounding waters between 0.5
1.5°C warmer (Figure 4.3a). In 2001, SSTsjust west of Jarvis remain cold (25.3°C),
however, the contrast with surrounding waters is less (0.7°C) than in 2000 (Figure 4.3b).
In 2002, SST is significantly wanner (max 27.5°C) than in the two previous years;
however, a pool of colder water (26.7°C) is still evident on the west side of Jarvis (Figure
4.3c).
The TSG data represent temporal as well as spatial variability, particularly
associated with diurnal heating of surface waters. Although the residence time was not
detennined for upwelled waters, it is evident in Figure 4.3 that a variation of 0.5°C within
6-24 hours is not uncommon. In survey year 2000, for example, temperatures in a
relatively confined area (~1.0 km2) to the west of Jarvis show ~1.0°C change in < 24 hr
period. We will show in Section 8 that changes on semidiurnal time scales may also be
important for Jarvis SST.
14

(a 2000
~~37'.·O
~-G.38
-0.39
-160.03 -160.02 -160.01 -160 -1511.99 -1511.98 -159.97longhude
(b 2001
• 0.....
259
2S.8
257
25J;
2S5
25A
253
252
-0.041
-160.06 -160.lM -160.02 -160 -159.98 -159.96 -159.94longitude
(c) 2002
27••
21.J5~7.J
27.25
V.l.V.15
27.1VAIS27~6$5
26,lI
26.85
16..8
··•-:.
o.
0 ••
00
..- .._.,..:~ " ..;_ o -'_....«.f~.r••."
...0 0..·0.
-09
I-o.J04r·
-0..41 ...
,-14IIU14 -11Q.02 -1110 -I~. -159.96
LongItucM
Figure 4.3. SST obtained from the shipboard thermo-salinograph collected dming the CRED surveys atJarvis in 2000 (a), 2001 (b), and 2002 (e).
15

Low:23.34
Low 24.27
Low 26.76
Figure 4.4. Temperature at 25 m derived from nearest neighbor interpolation of shallow water CTD castsat 25 meters for CRED survey years 2000 (a), 2001 (b), and 2002 (c).
1h

Shallow water (30 m) CTD data (Figure 4.4) show that during all cruises the
coldest near-surface temperatures occur on the west/southwest side of Jarvis Island,
consistent with the SST. The coldest temperature at 25 m depth (23.34°C) and the largest
contrast between temperatures on the western side compared to surrounding waters
(2.52°C) occurred during the 2000 survey (Figure 4.4a). Outside ofthe cold pool,
temperatures were nearly homogeneous at 25.86°C. In 2001, upwelling was strongest off
the southwest tip of Jarvis, although the coldest measured temperature (24.27°C) is
nearly a degree warmer than the coldest recorded in 2000 (Figure 4.4b). A 1.4°C
difference is observed between the coldest (west side) and warmest (east side) recorded
temperatures. The spatial distribution of upwelling is less defined compared to the
previous year, with temperatures to the northwest showing intrusions of upwelled waters
(note change in color scales in Figure 4.4). Of the three survey years, the weakest and
most diffuse upwelling signal was observed during 2002 (Figure 4.4c). Equal-depth
temperatures show a 0.46°C east-west difference. Upwelled waters were ~2.5°C warmer
than the previous year.
The vertical structure of shallow water CTD profiles (Figure 4.5) varies
considerably over the three surveys. In 2000, the water column was well mixed to a
depth of 30 m in all casts except for the western most casts, which show variable
stratification (Figure 4.5a). In the western upwelling profiles, a temperature difference of
~2.1°C occurs between the surface and 30 m depth. In 2001, vertical profiles show
increased stratification from the previous year, with intrusions of cooler waters
influencing multiple casts at 15-30 m depths (Figure 4.5b). Upwelling is most prevalent
in the cast taken off the southwest tip of Jarvis, with surface temperature (25.49°C)
17

1.27°C wanner than at 30 m (24.22°C). Profiles taken in 2002 mostly show
homogeneous upper layer temperatures (Figure 4.5c). Slight influences ofcooler
temperatures are observed near the lower 15-20 m with differences ranging from 0.3°C to
(c) 2002(b) 2001(a) 2000
-5
-10~
-20.
-25-
E~-15.Q.~
f-30__ .. l L __ . L L i..... JL~ __
23 24 25 26 24 25 26 26.5 27 275Temperature (0C)
Figure 4.5. Temperature profiles obtained from shallow water ern cast taken during CRED survey yearsin 2000 (a), 2001 (b), and 2002 (c).
As reported in R84. the 26°C isotherm generally marks the transition between the
surface flow and the EVC. Here. we use the 25°C isotherm to represent the upper limit
ofEVe temperatures and to serve as a general indicator of variability and fluctuations in
core depth. During the three surveys. the depth of the 25°C isotherm taken from TAO at
155°W (Figure 4.6) shows similar variations to those observed in the CRED
hydrographic surveys at Jarvis. Isotherm depth is shallowest in the March 2000 survey,
when 25°C temperatures shoaled to 13 m. In February 2001. the 25°C isotherm depth
increased by over a factor of3 to 55 m and in March 2002. the depth reached to 97
18

meters; a 42 m increase in depth from 2001 and an 84 m increase compared to 2000
observations.
0r.r----.---.----.---.,.---.-----,----r-------..,..,
-20
-1"'0
-120
E- -80a~-100
-160 .~. L._ .4 I I • !
AptOO JulOO 0c100 JanOl APIOI JulO1 OctOl Jan02 Apr02Date
Figure 4.6. Depth of the 25°C isothenn obtained from the TAO buoy at OON, 155°W. CRED survey years(2000-2002) are shown as red diamonds.
4.4 Biological Data
Jarvis features a well-developed coral reef ecosystem (Maragos, 2004) however;
the biological implications of variable upwelling are poorly understood. Upwelling of
cool, nutrient rich water to reef ecosystems is potentially deleterious (Glynn et aI., 1977;
Atkinson and Falter, 2003) but episodic upwelling may influence the trophic structure
and overall production of the ecosystem by serving as an important source ofnutrients
and suspended particles (Leichter and Miller, 1999).
Although various forcing mechanisms co-occur at Jarvis, upwelling is potentially
influencing the zonation of the benthic community and favoring live coral growth (Figure
4.7). Analysis of towed diver benthic video taken in 2002 show live coral comprising
over 50 percent of the benthic community to the west'southwest side of Jarvis, with
19

surrounding areas exhibiting predominantly algae and coral rubble and/or pavement
substrate (Gove et aI., unpublished data).
Live Coral
Pavement/Rubble
• Coralline Algae
• Fleshy Algae
Figure 4.7. Towed diver videos of Jarvis Island taken in 2002 are used to specify benthic zonation, withlive coral comprising a majority of the substrate to the west/southwest. Pie charts are 15 min averages andrepresent percentages ofbenthic substrate as indicated by the key to the right.
In addition, fish biomass distributions show influence of upwelling (Figure 4.8).
Belt-transects at four locations around Jarvis show substantial differences in planktivore
densities (mean range 8-137 fish 10 m-2), with the greatest biomass densities occurring on
the southwest tip of the island (Gove et aI., unpublished data). No direct chlorophyll
measurements were obtained; however, it is likely that the increase in nutrients associated
with upwelling is stimulating planktonic growth, thereby increasing food availability and
favoring greater planktivore densities.
Although the implications of variable upwelling to coral reef ecosystems have yet
to be discerned, the injection ofEUC waters and the presumed increase in nutrients is
likely altering the trophic structure of the reef ecosystem near Jarvis Island.
20

Figure 4.8. Stationary point counts at four survey sites around Jarvis performed in 2002 indicate increasedplanktivore densities on the southwest tip compared to surrounding areas. Densities have a mean range of8-137 fish 10 m-2
21

CHAPTER 5: TEMPORAL VARIABILITY OF UPWELLING
In-situ temperature measurements at 14 m water depth on the southwest tip of
Jarvis from March 2002 to December 2003 provide the best available record of upwelling
variability on the upstream side of the island. The time series shows low frequency
variability, with changes of several degrees over weekly to monthly periods, superposed
with sporadic episodes of high frequency fluctuations with amplitudes of 0.5 - 4.0°C
(Figure 5.1a). Over the 22-month record, temperature ranged from 22.05 to 30.35°C with
a mean of27.85°C.
Upwelling occurs briefly in July 2002 but is mostly absent until boreal spring
2003 (Figure 5.1a). In April 2003, a distinct shift in near surface temperature occurs as
variable upwelling dominates the record and temperatures are the coldest of the time
series. Expanding this 3 month period, low frequency upwelling appears to be
modulated on variable high frequency time scales (Figure 5.2). Sustained cooling from
multiple days to weeks, rapid independent cold spikes, and semidiurnal fluctuations co
occur with low frequency upwelling. A power spectrum of the time series (Figure 5.3a)
shows a well-defined semidiurnal tidal peak (period = 12.4 hr) along with a weaker peak
at the harmonic (period ~ 6 hr).
Current data from the moored ADP is strongly oriented along local isobaths.
Current is rotated into principal axes defined as 150° for positive alongshelf flow, and
60° for onshore flow. Only the dominant alongshelf component (150°/330°) is presented
(Figure 5.1b). The data show episodic bursts of strong (peak of 1.30 m S-l) positive
alongshelf current lasting for 10-30 days, ephemeral pulses ofweaker
22
(peak ~ -0.7 m S-I) negative alongshelfflow, and sustained periods (e.g., January-April,
2003) when only weak tidal currents occur. Power spectrum for current shows energy
peaking at the semidiumal tidal frequency (Figure 5.3b). The dynamics of the alongshelf
current bursts are discussed in Section 6.
Sea level at Christmas Island and the 25°C isotherm depth at 155°W compared
with moored temperature and current at Jarvis illustrate the connection between large
scale forcing and near-shore variability (Figure 5.1c,d). Low frequency temperature
changes (weeks to months) at Jarvis are related to changes in isotherm depth and sea
level. The depth ofthe 25°C isotherm is the shallowest and sea level the lowest during
boreal spring 2003 when upwelling at Jarvis is most prevalent. In addition, during the
eastward (westward) current pulses at Jarvis, a contemporaneous increase (decrease) in
sea level and deepening (shoaling) ofthe 25°C isotherm occur (e.g., June-July 2002).
Zonal currents at TAO (1700 W) vary seasonally as the EUC shoals and
strengthens during boreal spring (the spring time surge, Keenlyside and Kleeman, 2002)
and slackens and deepens in boreal fall and winter (Figure 5.1e). The EUC is
substantially weaker in boreal spring to fall 2002 compared to the same time period in
2003 due to interannual variations. The current bursts observed at Jarvis also occur in
near-surface currents in the TAO ADCP record; however, strong westward currents
observed at TAO (January-April 2003) are not seen at Jarvis. We attribute this to the
blocking of westward flows by the island, leaving only weak tidal flows on the western
side.
Upwelling periods at the Jarvis mooring occur when isotherms are shallow, the
EUC is shallow and strong, and sea level is low on a regional basis (Figure 5.1). This is
23

consistent with the EUe being the main forcing mechanism for island upwelling, with
thermocline depth being a related (tied to EUe depth) and necessary condition.
Upwelling therefore occurs seasonally (boreal spring) with obvious interannual
modulations associated with ENSO variability (Figures 4.3-4.5,5.1). It is also evident
from Figure 5.1 that the strong eastward current bursts at Jarvis are not related to
upwelling (e.g., June 2003). They are associated with surface current bursts at TAO with
little expression in the EUe. In the next section, we relate upwelling and current burst
variability to equatorial wind forcing, primarily in the western and central Pacific.
24

.40
-=- 1.20~ 1.00_ 0.80
C 0.60~ 0.406 0.20b 0
§~~~~ -0.60 (b)
~~~....:.:-----=:...._----=...=:::---:_----=~-_:..::=========~E ~o- -70oS -80Q. 90l! -;00§-110.! -120§ -130- -140~ -150N -160 (e)
030~:--====::=====::::="'--~---==-=----=:""""::====::::=========~0.25
0.20
g 0.15li 0.10.!i 0.05IV 0J( -0.05 .
-0.10,US (d)
AprIl 2002 July October January AprIl July 2003 October
DateFipre 5.1. Twenty-two month time series (March 2002 to December 2003) of in-situ temperature (a) andalongshelf current (b) recorded at 14 m depth off the southwest tip ofJarvis, depth of the 25°C isotbermfrom TAO at 15SoW (c), demeaned sea level from Christmas Island (d), and zonal currents from TAO at1700 W (e).
25

23
2204/19 cW29 05/09 05119- --o~ 06/-08------:06-!'':'":"l'''"S-"'"06:L12::"CS:---,O::-::7'-=/08:-:----'
DateFigure 5.2. In-situ temperature (15 min sampling interval) taken in 14 m of water off the southwest tip ofJarvis from 15 April to 15 July 2003 show cold spikes occurring at -12 hr periods.
10'
~'8. "Ru ~~..... ..~ g
10- 10"i
1 )lal cyde1 per day (bl cydes per~
Figure 5.3. Power spectra for in-situ temperature (a) and alongshelf current (b) showing peaks at tidalfrequencies.
26

CHAPTER 6: WIND VARIABILITY AND KELVIN WAVES
During the Jarvis mooring deployment (March 2002-December 2003), zonal wind
conditions are characterized by steady trade winds with seasonal relaxations in the
eastern Pacific, variable trades with occasional relaxation events in the central Pacific,
and weak winds punctuated by westerly bursts in the western Pacific (Figure 6.1 a).
Westerly wind anomalies are prevalent in the western and central Pacific during boreal
summer-fall 2002 (Figure 6.1b). Zonal wind variability is weak at Jarvis (1600 W)
compared to locations farther west.
As a result of fluctuating winds in the western Pacific, intraseasonal upwelling
and downwelling Kelvin waves are generated (Miller et aI., 1988; McPhaden et aI., 1988;
Kessler et aI., 1995) producing variable sea level, thermocline depth and surface currents
with eastward phase propagation (Enfield, 1987; McPhaden and Taft, 1988; Johnson and
McPhaden, 1993) (Figure 6.1 c,d). As expected, westerly wind bursts produce
downwelling Kelvin waves with anomalously eastward surface currents (e.g., October
2002). Upwelling Kelvin waves with anomalous westward surface currents are observed
following easterly winds in the western Pacific (e.g., December 2002), and in some cases
following wind relaxation events (e.g., November 2002).
The strong eastward surface jets observed at Jarvis (Figure 5.1b) are
predominantly related to regional wind forcing. The strongest eastward jets in boreal
summer 2002 and 2003 are associated with a slackening of the trades across much of the
basin (Figure 6.1 a,b). Eastward jets result in response to a pressure gradient which is no
longer in balance with the wind stress. At the TAO buoy (1700 W) the eastward jets are
most apparent in the upper 75 m of the water column (Figure 5.1e). Isotherm
27

displacements and sea level confirm that these current events are downwelling favorable
(Figure 5.1c,d). As such, the EVC core tends to deepen during the eastward jets. In sum,
these events are not favorable for upwelling at Jarvis.
The strong westerly winds in the western Pacific in boreal spring-fall 2002 cause
the thermocline (here represented by the depth of the 20° isotherm) to deepen in the
central to eastern Pacific, and shoal in the western Pacific (Figure 6.1e), in accordance
with changes in the basin-wide zonal pressure gradient. This period coincides with
seasonally high sea levels and deep isotherms in the central equatorial Pacific (Figure
5.1c,d). The main upwelling event at Jarvis in boreal spring 2003 is preceded by the
slackening and/or weak reversal of the westerly winds in the western Pacific at the end of
2002. Anomalous upwelling (negative thermocline anomaly, Figure 6.1e) migrates
eastward to Jarvis and the eastern Pacific in the form of an upwelling Kelvin wave.
Therefore, remote winds and Kelvin wave propagation are instrumental for the main
upwelling events observed during the Jarvis mooring deployment. Wyrtki and Eldin
(1982) observed regional upwelling near Jarvis associated with local easterly wind
anomalies. The upwelling periods observed in our Jarvis temperature record (Figure
5.1 a) were not associated with easterly wind anomalies, although strong easterly wind
events did not occur during our field measurements. To the extent that easterly winds
cause a regional uplift of the EVC, we assume that EVC-driven upwelling at Jarvis would
be enhanced by this mechanism.
28

II
A
II
J
8o 4ms-'-4
(b) Zonal Wind Anomalies
-8
100"'" 1400 E 1600 E 1800 160"'" 140°. 12O"W 100"'"
4-4
1800 160"'" 1400 W
-8
so
A
(a) Zonal Wind
~~
D
J
F
It Jiifil)iiiZ:!A
II
::gJ
~~ 1,~~~~~soN
D
M
A
M
J
J
A
S
oN
D
J
F
M
A
M
J
J
A
S
oN
D...-t~4-
(d) Surface Zonal Current Anomalies~--'---.--......",.l,.....I-.......-~
I~~~..
1400 E 1600 E 180° 1600 W 1400 W 1200 W 1000 W, I I
1400 E 1600 E 180° 1600 W 1400 W 1200 W 1000 W
(c) Surface Zonal Currents
M
A
M
J
§JNA
S
o
N
D
J
F
M
A
M
MJ
~JA
S
oN
D
-1.2-0.8-0.4 0.0 0.4 0.8 1.2ms-1
-1.2-0.8-0.4 0.0 0.4 0.8 1.2ms·1
29

(e) 20·e Isotherm Depth Anamolies
A
S
oN
D
J,Iof
Amy
~JJ
A
160·E 180· 160"W 140·W 120·W 100·W
-40 0 40Depth (m)
Figure 6.1. Longitude-time plots, averaged over 2°N-2°S, showing 5 day averaged zonal winds (a), zonalwind anomalies (b), estimated zonal surface current (c), estimated zonal surface current anomalies (d) and20°C isotherm depth anomalies (e). All data are obtained from the TAO array, with the exception ofestimated zonal surface currents which are derived from OSCAR.
The importance ofequatorial Kelvin waves for establishing upwelling favorable
conditions at Jarvis is illustrated further by examining the temperature anomaly versus
depth across the Pacific before and during the 2003 boreal spring upwelling (Figure 6.2).
The anomalous westerly winds west of 1600 E cause warm sea surface temperature
anomalies (SSTAs) in the central Pacific, warm subsurface temperature anomalies
(STAs) in the central and eastern Pacific, and cool STAs west of the dateline (Figure
6.2a). The warm STAs indicate downward isotherm displacements which are most
evident within the thermocline. Winds in the eastern Pacific are close to normal (zero
anomaly), again emphasizing that the subsurface response in the eastern Pacific is set up
by downwelling Kelvin waves originating in the west, and not by local wind forcing.
The cold STAs in the western Pacific are consistent with a shallowing of the thermocline.
30

As the wind anomaly continues, the SSTA and STA strengthen (Figure 6.2b). In
December 2002, following a brief cessation ofwinds, an easterly wind anomaly develops
in the western Pacific, forcing an eastward propagation of the negative STA anomaly
(Figure 6.2c). The negative STA in the eastern Pacific is due to a short wind relaxation
in November, causing an upwelling wave to propagate to the east (Figure 6.1a,c,e).
Through January to March 2003 winds across the Pacific relax to normal conditions,
which coincides with a strengthening of cold STAs across the Pacific as the upwelling
Kelvin wave propagates eastward (Figure 6.2d,e). In March, negative STAs are observed
across the Pacific, indicating net equatorial upwelling of the thermocline for the entire
basin (Figure 6.2e). Upwelling at Jarvis occurs during this period (Figure 6.2e,f).
31

140'E 160'E 180' 160'1\' 140''// 120''11 100'11' 140'E 160"E 160" 160'l! 140"'11 l20"W IOO'1f
lC'N 16
,,"N 1~1ir~~~~~~~~~~§~~~~~ ,5~~~I;!:IL.!~~~~~~~~ ~ IJ6
10'6S~t:I~=:E~5::=I==t=5=:I=~5~ 12
4
8
o
12
-4
-8
12
8
4
0
4-
8
12
6420
-2-4-6
12
8
[4t-
1-0
~.-4
-8
-12
..c....,~300
:""\
400
500 , , ,(al September 14 2002
IO"N5"N
C'
5'S
lO"S0
100
r-.
5200 '
..c....,~30Q
00
400
500 , I
(el December 28 2002iO'N
5'N
0'
5"S
10'S0
(e) March 11 2003 (f) May 20 2003 -----';> 10m 5 1
Figure 6.2. Five day averaged SST anomaly and wind anomaly vectors (top portion of each plot) and zonaltemperature depth section anomalies averaged 2°N-2°S (bottom portion of each plot). Data are obtained fromTAO, September 2002 to May 2003. Temperature anomalies are in °C and the wind anomaly scale is in thelower right comer.
32

CHAPTER 7: DIAGNOSTIC UPWELLING MODEL
Kelvin wave dynamics are important for determining the depth of the
thermocline; however, it is the strength and depth of the EUC that is the main driving
force for island-induced upwelling. To emphasize this point, we compare the observed
upwelling at Jarvis with the theoretical model ofHW73;
We specify U and N from the surface to 250 musing ADCP and temperature
data taken from TAO at 1700 W to calculate theoretical isopycnal displacements for flow
near Jarvis. Climatological salinity values are used to compute N. At each time step, we
determine the deepest isotherm that upwells to the surface given the observed current and
temperature structure. From this temperature we subtract the measured surface
temperature at TAO to obtain the temperature difference (!1TM ) caused by island-induced
upwelling. We compare this with the observed upwelling at Jarvis (!1~bs)' which is daily
averaged SBE temperature minus an estimate ofregional SST. Regional SST is obtained
using the 9 km resolution Pathfinder SST which is interpolated to daily values. !1~bs is a
measure of upwelling strength at Jarvis; subtracting regional SST ensures that upwelling
events are specific to Jarvis and not a measure ofregional wind-forced upwelling (e.g.,
Wyrtki and Eldin, 1982).
There is surprisingly good agreement between !1TM and !1Tobs (Figure 7.1),
particularly given the ~1000 km distance between the two sites. Upwelling periods (July
2002, April-July 2003, September-October 2003) are reproduced by the model, although
the model tends to underestimate the observed upwelling, especially during peak events
33

(e.g., April-July 2003). The comparison presumably would improve with local measures
of U. N and SST. The generally good agreement supports the conclusion that upwelling
at Jarvis is a function ofEUC strength and depth as well as thermocline depth.
ot.... -15~:::J...~ -2.0Q.
E~ ·25
-!J.Tobs-3.0 -!J.TM
July 2003 OctoberAprilOctoberJulyApril 2002 JanuaryDate
Figure 7.1. Dynamic upwelling model ( toTM ) compared to observed upwelling (toTobs ) at Jarvis Island.
34

CHAPTER 8: UPWELLING AT TIDAL FREQUENCIES
During upwelling favorable conditions at Jarvis, abrupt cold spikes (1-4°C) tend
to occur at -12 hr periods (Figures 5.1-5.2, 8.1). In contrast, semidiurnal tidal currents
occur more regularly throughout the entire time series. At the semidiurnal frequency,
temperature and alongshelf currents are -180° out ofphase, such that maximum
upwelling coincides with maximum eastward current. We do not have sufficient data to
draw conclusions regarding the nature of the tidal upwelling. Multiple temperature
sensors have been deployed around Jarvis that will help elucidate the high frequency
signal. Until that data can be analyzed, we consider possible forcing mechanisms for the
cold temperature spikes.
285~----.-----------------.,----,o.60
00:00 -0.2012:0012:00
I-Current- Temperature
2SSOOoo
28
00:00Time
Figure 8.1. In-situ temperature and current (7 min average every 2 hrs) from 25 June to 26 June 2003taken in 14 m of water off the southwest tip of Jarvis.
35

Barotropic tidal currents may cause horizontal advection of the cold upwelling
patch located northwest of the mooring (Figure 4.4). Strong temperature gradients form
off the southwest tip of Jarvis during times of upwelling. Barotropic tidal currents could
potentially advect this gradient past the mooring at regular tidal intervals. Horizontal
advection would result in cold temperature spikes lagging south-eastward current by 90°;
however, observed currents and temperature are often 180° out of phase. It appears
unlikely that horizontal advection alone can account for the observed temperature signal.
Barotropic tidal flow around Jarvis also may generate semidiurnal internal tides
that enhance vertical isotherm displacements. This mechanism was cited to explain
100 m vertical displacements associated with the semidiurnal tide on the south shore of
Oahu, Hawaii (Eich et aI., 2004). Lacking a well-defined shelf region and given the steep
slopes (supercritical relative to the semidiurnal internal tide) of the island, Jarvis is an
unlikely location for strong internal tide generation (see Holloway and Merrifield, 1999
for a discussion of internal tide generation at isolated islands). Remotely generated
internal tides that impinge on Jarvis might also playa role. Model simulations by Niwa
and Hibiya (2001) show internal tide isotherm displacements up to 15 m in the region of
Jarvis Island. This amount of additional isotherm displacement is consistent with the
temperature tidal fluctuations observed at Jarvis during the main EVC-driven upwelling
periods.
Cold temperature spikes at the semidiurnal frequency have been attributed to
breaking internal waves, or internal tidal bores, that are generated at shoaling topography
and propagate shoreward at regular tidal frequencies (Baines, 1986). Sharp drops in
temperatures along the western coast ofthe U.S. (Pineda, 1995), rapid temperature,
36

salinity, nutrient and current fluctuations at the near surface in the Florida Keys (Leichter
et aI., 1996, Leichter and Miller, 1999), and high frequency nutrient and temperature
changes in Monterey Canyon (Shea and Broenkow, 1982) have been attributed to
semidiurnal internal tidal bores. Again, given the steep island slopes, it is not clear how
internal tidal bores might fonn at Jarvis. Detailed bathymetric surveys are needed to
better assess tidal-topographic interactions.
37

CHAPTER 9: CONCLUSION
Variable upwelling on the western side of Jarvis Island has been linked to changes
in the thermocline and the EVC, which are modulated by equatorial wind forcing on
intraannual to interannual time-scales. While the importance ofEVC-driven isotherm
displacements at Jarvis has been known since the 1970s, we have tried to emphasize the
temporal variability ofnear-surface temperatures and how it is linked to well-studied
aspects of wind-forced equatorial dynamics. Wind variability in the equatorial Pacific
affects the depth of the EVC, and hence upwelling at Jarvis on a variety oftime scales.
At seasonal time scales, island-induced upwelling tends to occur in boreal spring owing
to wind relaxations in the eastern Pacific (Keenlyside and Kleeman, 2002). At
intraannual and interannual time scales, wind fluctuations in the western Pacific are more
important for determining upwelling at Jarvis. In general, La Nina conditions favor
upwelling at Jarvis by inducing a regional shoaling ofthe thermocline and the EVC.
Based on long term sea level measurements, a proxy for thermocline depth
(Rebert et aI, 1985), we can now put the previous survey observations at Jarvis into a
similar context. Five of the six observation periods have occurred during times of low to
average sea level height, or equivalently, during mild upwelling conditions (Figure 9.1).
Only the November 1982 observations described by R84 occurred during a strong EI
Nino phase, when the EVe was anomalously weak in the central Pacific. Interestingly,
observations have not been obtained during maximum La Nina phases; the strongest
upwelling at Jarvis has yet to be sampled.
38

0.40
0.30
0.20
0.10
:g1 0~CQ
J:-0.10
-0.20
-0.30
1970 1975 1980 1985 1990 1995 2000 2005
YearFigure 9.1. Demeaned sea level measured at Christmas Island (01 °59.0' N, 157°28.0'W) from 1970 to2005. Red diamonds represent surveys performed at Jarvis by CRED (2000,2001,2002), Roemmich(1984) (November 1983; March 1984), and Hendry and Wunsch (1971).
Moored temperature observations provide the first indication of tidally-driven
upwelling at Jarvis. Similar tidal upwelling spikes have been observed at a Florida reef
(Leichter et aI, 1996, Leichter and Miller, 1999). During EVC-driven upwelling, the tide
can cause abrupt temperature drops of I-4°C every 12 hours. Given the available
evidence, we believe that internal tides, either locally or perhaps remotely generated, are
the most likely mechanism for the temperature variations.
Localized upwelling on the western side ofJarvis shows a marked influence on
the coral reef ecosystem. Benthic habitat surveys show live coral comprising> 50
percent of the benthic community to the west/southwest side of Jarvis with surrounding
waters having significantly less, consistent with the upwelling pattern. Likewise,
planktivore densities are an order ofmagnitude greater off the southwest of the island
compared to surrounding locations. Although the biological implications of variable
39

upwelling have yet to be determined, the injection ofEUC waters and the presumed
increase in nutrients appears to be altering the reef community near Jarvis Island. Future
studies are needed to examine the ecological importance ofvariable upwelling on the
spatial and temporal dynamics of the reef ecosystem.
40

REFERENCES
Atkinson, M., and Falter, J., 2003: Coral Reefs. In Biogeochemistry of Marine Systems.CRC Press, 40-64.
Baines, P. G., 1986: Internal tides, internal waves, and near inertial motions.Baroclinic processes on continental shelves. 3, 19-31.
Chavez, F., Strutton, P., Friederich, G., Feely, R, Feldman, G., Foley, D., McPhaden,M., 1999: Biological and chemical response of the equatorial Pacific Ocean to the1997-1998 El Niiio. Science. 286,2126-2131.
Christensen, N., 1971: Observations of the Cromwell Current near the Galapagos Islands.Deep-Sea Research. 18,27-33
Cromwell, T., 1953: Circulation in a meridional plane in the central equatorial Pacific.Journal ofMarine Research. 12, 196-213.
Drazin, P., 1961: On the steady flow of a fluid of variable density past an obstacle.Tel/us. 13,239-251.
Eich, M., Merrifield, M., and Alford, M., 2004: Structure and variability ofsemidiurnal internal tides in Mamala Bay, Hawaii. Journal of GeophysicalResearch. 109 (C050l0).
Enfield, B., 1987: The intraseasonal oscillation in eastern Pacific sea levels: How is itforced? Journal ofPhysical Oceanography. 17, 1860-1876.
Firing, E., 1981: Current profiling in the NORPAX Tahiti Shuttle. Tropical OceanAtmosphere Newsletter. 5.
Firing, E., Lukas, R, Sadler, J., Wyrtki, K., 1983: Equatorial Undercurrentdisappears during 1982-1983 El Niiio. Science. 222, 1121-1123.
Foley, D., Dickey, T., Mcphaden, M., Bidigare, R, Lewis, M., Barber, R, Lindley, S.,Garside., Manov, D., Mcneil, J., 1997: Longwaves and primary productivityvariations in the equatorial Pacific at 0°, 1400 W. Deep-Sea Research II. 44,(9-10), 1801-1826.
Glenn, P., 1977: Coral growth in upwelling and non-upwelling areas off the Pacificcoast ofPanama. Journal ofMarine Research. 35,567-585.
Gove, J., Dunlap, M., and Schroeder, R: Unpublished.
41

Hendry, R, and Wunsch, c., 1973: High Reynolds number flow past an equatorial island.Journal ofFluid Mechanics. 58, (1) 97-114.
Holloway, P., and Merrifield, M., 1999: Internal tide generation by seamounts, ridges,and islands. Journal ofGeophysical Research. 104,25937-25951.
Johnson, E., and McPhaden, M., 1993: On the structure of intraseasonal Kelvin waves inthe equatorial Pacific Ocean. Journal ofPhysical Oceanography. 23, 608-625.
Keesler, W., McPhaden, M., and Weickmann, K., 1995: Forcing of intraseasonal Kelvinwaves in the equatorial Pacific. Journal ofGeophysical Research. 100, (C6),10613-10632.
Keenlyside, N., and Kleeman, R, 2002: Annual cycle of equatorial zonal currents in thePacific. Journal ofGeophysical Research. 107, (C8), 1-13.
Kenyon, J., Brainard, R, Hoeke, R, Parrish, F., Wilkinson C., 2004: Towed-diversurveys, a method for mesoscale spatial assessment ofbenthic reef habitat: a casestudy at Midway Atoll in the Hawaiian Archipelago. Proc. Coastal ZoneAsia-Pacific Conference, Brisbane, Australia
Knauss, J., 1960: Measurements ofthe Cromwell Current. Deep-Sea Research. 6, 265285.
Koop, K., Booth, D., Broadbent, A, Brodie, J., Bucher, D., Capone, D., ColI, J.,Dennison, W., Erdmann, M., Harrison, P., Hoegh-Guldberg., Hutchings, P.,Jones, G., Larkum, A., O'neil, J., Steven, A, Tentori, E., Ward, S., Williamson,J., and Yellowless, D., 2001: ENCORE: The effect of nutrient enrichment oncoral reefs. Synthesis of results and conclusions. Marine Pollution Bulletin. 45(2),91-120.
Lamb, H., 1932: Hydrodynamics. Cambridge University Press.
Leichter, J., Wing, S., Miller, S., Denny, M., 1996: Pulsed delivery of subthermoclinewater to Conch Reef (Florida Keys) by internal tidal bores. Limnology andOceanography. 41, (7), 1490-1501.
Leichter, J., and Miller, S., 1999: Predicting high-frequency upwelling: Spatial andtemporal patterns of temperature anomalies on a Florida coral reef. ContinentalShelfResearch. 19,911-928
Mann, K., and Lazier J.RN., 1996: Dynamics ofMarine Ecosystems: Biologicalphysical interactions in the Oceans. Blackwell, Cambridge, MA
42

Maragos, J., 2004: Monitoring corals and other macro-invertebrates at fixed sites at USPacific remote and atolls. 1dh International Coral ReejSymposium - abstracts.137.
McPhaden, M., 1999: Genesis and evolution of the 1997-1998 El Nino. Science. 283,950-953.
McPhaden, M., Busalacchi, A, Cheney, R, Donguy, J., Gage, K., Halpern, D., Ji, M.,Julian, P., Meyers, G., Mitchum, G., Niiler, P., Picaut, J., Reynolds, R, Smith, N.,and Takeuchi, K., 1998: The Tropical Ocean-Global Atmosphere observingsystem: A decade ofprogress. Journal ojGeophysical Research. 103, (C7),14-169,240.
McPhaden, M., Freitag, H., Hayes, S., Taft, B., Chen, Z., and Wyrtki, K., 1988: Theresponse of the equatorial Pacific Ocean to a westerly wind burst in May 1986.Journal ojGeophysical Research. 93, (10),589-10,603.
McPhaden, M and Taft, B., 1988: On the dynamics of seasonal and intraseasonalvariability in the eastern equatorial Pacific. Journal ofPhysical Oceanography.18,1713-1732.
Miller, L., Cheney, R., and Douglas, B., 1988: Geosat altimetry observations ofKelvinwaves and the 1986-1987 EI Nifio. Science. 239, 53-54.
Niwa, Y., and Hibiya, T., 2001: Numerical study of the spatial distribution of the M2internal tide in the Pacific Ocean. Journal ojGeophysical Research. 106, (C10),22441-22450.
Noble, M., and Xu, J., 2003: Observation oflarge-amplitude cross-shore internal boresnear the shelfbreak, Santa Monica Bay, CA Marine Environmental Research.56, 127-149.
Pak, H., and Zaneveld, J., 1973: The Cromwell Current on the east side of the GalapagosIslands. Journal ojGeophysical Research. 78, (33), 7845-7859.
Philander, S., 1990: EI Nino, La Nifia and the Southern Oscillation. Academic Press.
Pineda, 1., 1995: An internal tidal bore regime at near shore stations along westernU.S.A: Predictable upwelling with the lunar cycle. Continental ShelfResearch,.15, 1023-1041
Rebert, 1., Donguy, J., Eldin, G., and Wyrtki, K., 1985: Relationships between sea level,thermocline depth, heat content and dynamic height in the tropical Pacific Ocean,.Journal ojGeophysical Research. 90, (11), 719-11, 725.
43

Roemmich, D., 1984: Indirect sensing of equatorial Currents by means of island pressuremeasurements. Journal ofPhysical Oceanography. 14, (9) 1458-1469.
Schroeder, R, Trianni, M., Moots, K., Zgliczynski, B., Laughlin, J., Tibbetts, R, andCapone, M., 2004: Status of fishery target species on coral reefs of the MarianasArchipelago. 1dh International Coral ReefSymposium - abstracts.
Szmant, A.M., 2002: Nutrient enrichment on coral reefs: is it a major cause of coral reefdecline? Estuaries. 25, (4b), 743-766.
Yu, X., and McPhaden, M., 1999: Seasonal Variability in the Equatorial Pacific. JournalofPhysical Oceanography. 29, 925-947.
Wyrtki, K., and Eldin, G., 1982: Equatorial upwelling events in the centralPacific. Journal ofPhysical Oceanography. 12, 984-988.
Wyrtki, K., and Kilonsky R, 1984: Mean Water and Current Structure during theHawaii-to-Tahiti Shuttle Experiment. Journal ofPhysical Oceanography. 14,242-254.
Wyrtki, K., B. Firing, D. Halpern, R Knox, G.J. McNally, W.C. Patzert, B.D. Stroup,RA. Taft, and R Williams. 1981: The Hawaii to Tahiti shuttle experiment.Science. Vol. 211(4477) 22-8
44