UPRAVLJANJE POTROŠNJOM U ELEKTRODISTRIBUCIJSKOM...
29
UPRAVLJANJE POTROŠNJOM U UPRAVLJANJE POTROŠNJOM U ELEKTRODISTRIBUCIJSKOM SUSTAVU S ELEKTRODISTRIBUCIJSKOM SUSTAVU S FOTONAPONSKOM ELEKTRANOM FOTONAPONSKOM ELEKTRANOM FOTONAPONSKOM ELEKTRANOM FOTONAPONSKOM ELEKTRANOM PRIMJENOM NAPREDNIH ( PAMETNIH ) PRIMJENOM NAPREDNIH ( PAMETNIH ) MJERENJA MJERENJA Se čilište JJ Strossma er a Osijek Sveučilište J.J. Strossmayer a u Osijeku Elektrotehnički fakultet Osijek Voditelj projekta: Doc.dr.sc. Zvonimir Klaic Suradnici: Prof.dr.sc. Damir Šljivac Dr sc Krešimir Fekete Dr .sc. Krešimir Fekete Zorislav Kraus, dipl.inž.el.
Transcript of UPRAVLJANJE POTROŠNJOM U ELEKTRODISTRIBUCIJSKOM...

UPRAVLJANJE POTROŠNJOM U UPRAVLJANJE POTROŠNJOM U ELEKTRODISTRIBUCIJSKOM SUSTAVU S ELEKTRODISTRIBUCIJSKOM SUSTAVU S FOTONAPONSKOMELEKTRANOMFOTONAPONSKOMELEKTRANOMFOTONAPONSKOM ELEKTRANOM FOTONAPONSKOM ELEKTRANOM PRIMJENOM NAPREDNIH (PAMETNIH) PRIMJENOM NAPREDNIH (PAMETNIH) ( )( )MJERENJAMJERENJAS e čilište J J Strossma era OsijekSveučilište J.J. Strossmayera u OsijekuElektrotehnički fakultet Osijek
Voditelj projekta: Doc.dr.sc. Zvonimir KlaicSuradnici: Prof.dr.sc. Damir Šljivac
Dr sc Krešimir FeketeDr.sc. Krešimir FeketeZorislav Kraus, dipl.inž.el.
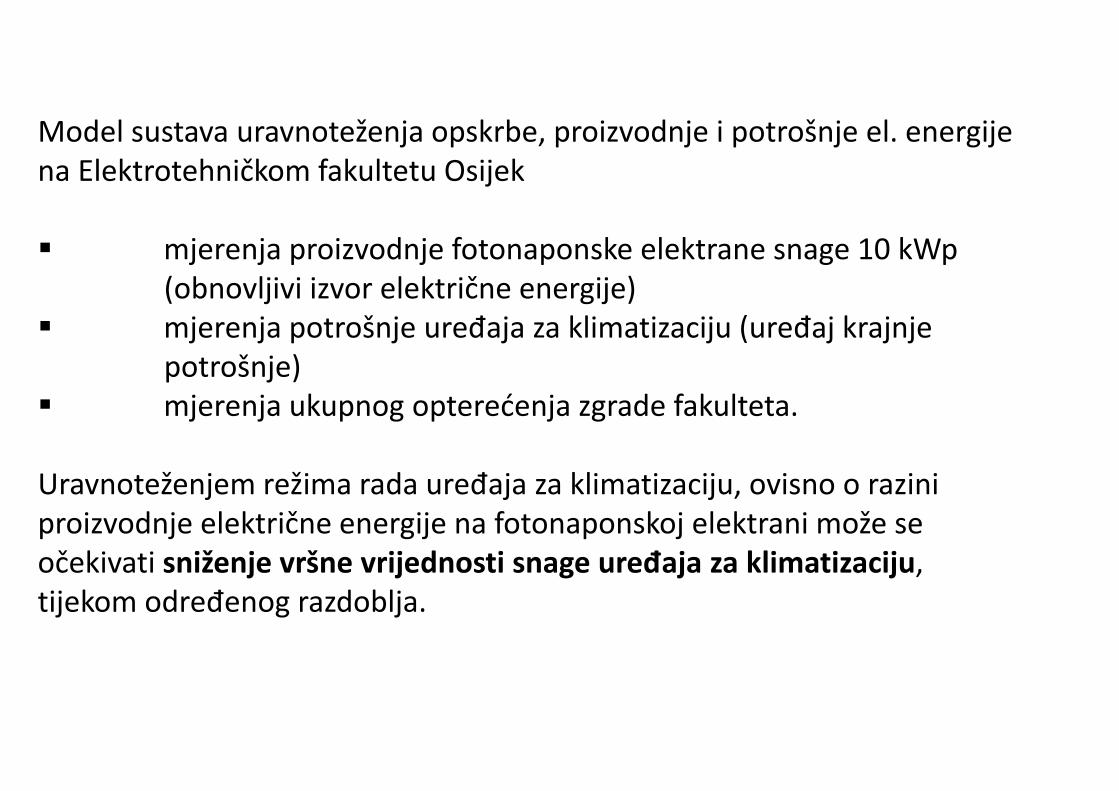
Model sustava uravnoteženja opskrbe, proizvodnje i potrošnje el. energije na Elektrotehničkom fakultetu Osijekna Elektrotehničkom fakultetu Osijek
mjerenja proizvodnje fotonaponske elektrane snage 10 kWpj j p j p g p(obnovljivi izvor električne energije)
mjerenja potrošnje uređaja za klimatizaciju (uređaj krajnjepotrošnje)
mjerenja ukupnog opterećenja zgrade fakulteta.
Uravnoteženjem režima rada uređaja za klimatizaciju, ovisno o razini proizvodnje električne energije na fotonaponskoj elektrani može seproizvodnje električne energije na fotonaponskoj elektrani može se očekivati sniženje vršne vrijednosti snage uređaja za klimatizaciju, tijekom određenog razdoblja.
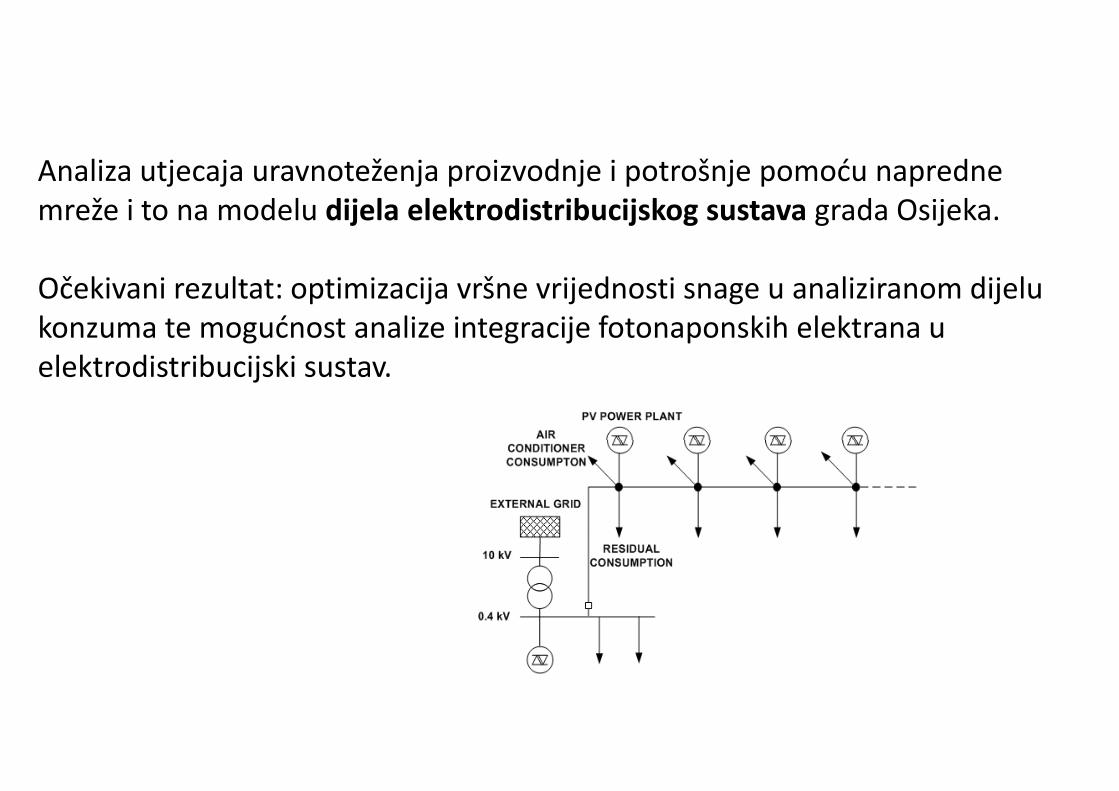
Analiza utjecaja uravnoteženja proizvodnje i potrošnje pomoću napredneAnaliza utjecaja uravnoteženja proizvodnje i potrošnje pomoću napredne mreže i to na modelu dijela elektrodistribucijskog sustava grada Osijeka.
Očekivani rezultat: optimizacija vršne vrijednosti snage u analiziranom dijelu konzuma te mogućnost analize integracije fotonaponskih elektrana u elektrodistribucijski sustav.

IPA Cross-border Co-operation Programme Hungary-Croatia 2007-2013Hungary-Croatia 2007-2013
Photovoltaic Systems as Actuators of Regional Development
REG-PHOSYS ; prof D.Pelin.
The project is co-financed by the European Union through the Hungary-Croatia IPA Cross-border Co-operation Programme
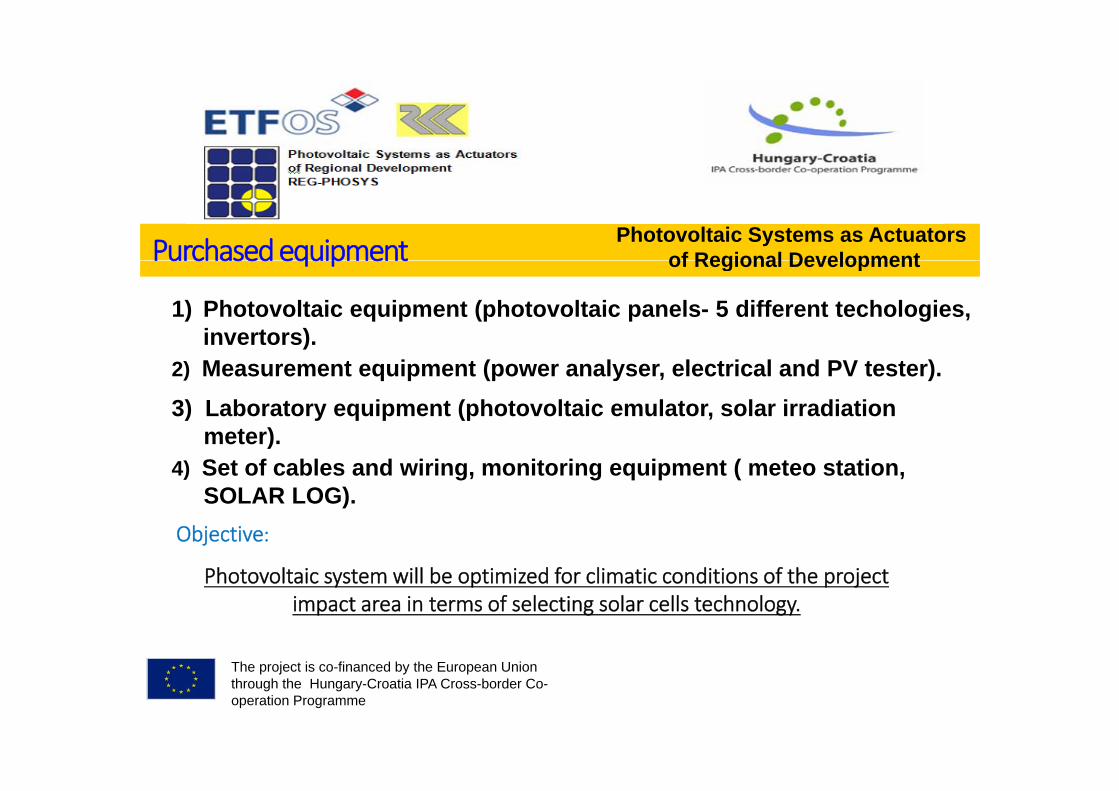
Purchasedequipment Photovoltaic Systems as Actuatorsof Regional DevelopmentPurchasedequipment of Regional Development
1) Photovoltaic equipment (photovoltaic panels- 5 different techologies,invertors).
2) Measurement equipment (power analyser, electrical and PV tester).3) Laboratory equipment (photovoltaic emulator, solar irradiation
meter)meter).4) Set of cables and wiring, monitoring equipment ( meteo station,
SOLAR LOG).ObjectiveObjective:
Photovoltaic system will be optimized for climatic conditions of the project impact area in terms of selecting solar cells technology.
The project is co-financed by the European Union through the Hungary-Croatia IPA Cross-border Co-operation Programme

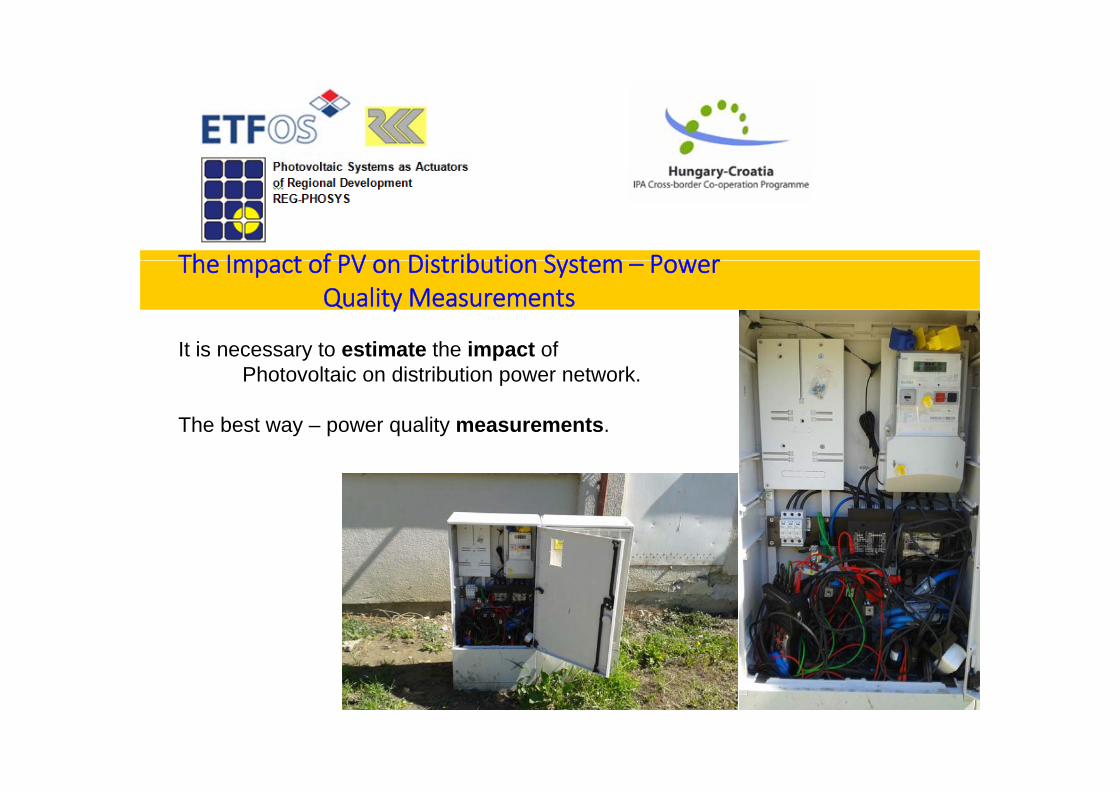
The Impact of PV on Distribution System PowerThe Impact of PV on Distribution System – Power Quality Measurements
It is necessary to estimate the impact ofIt is necessary to estimate the impact ofPhotovoltaic on distribution power network.
The best way – power quality measurements.
The Impact of PV on Distribution System PowerThe Impact of PV on Distribution System – Power Quality Measurements
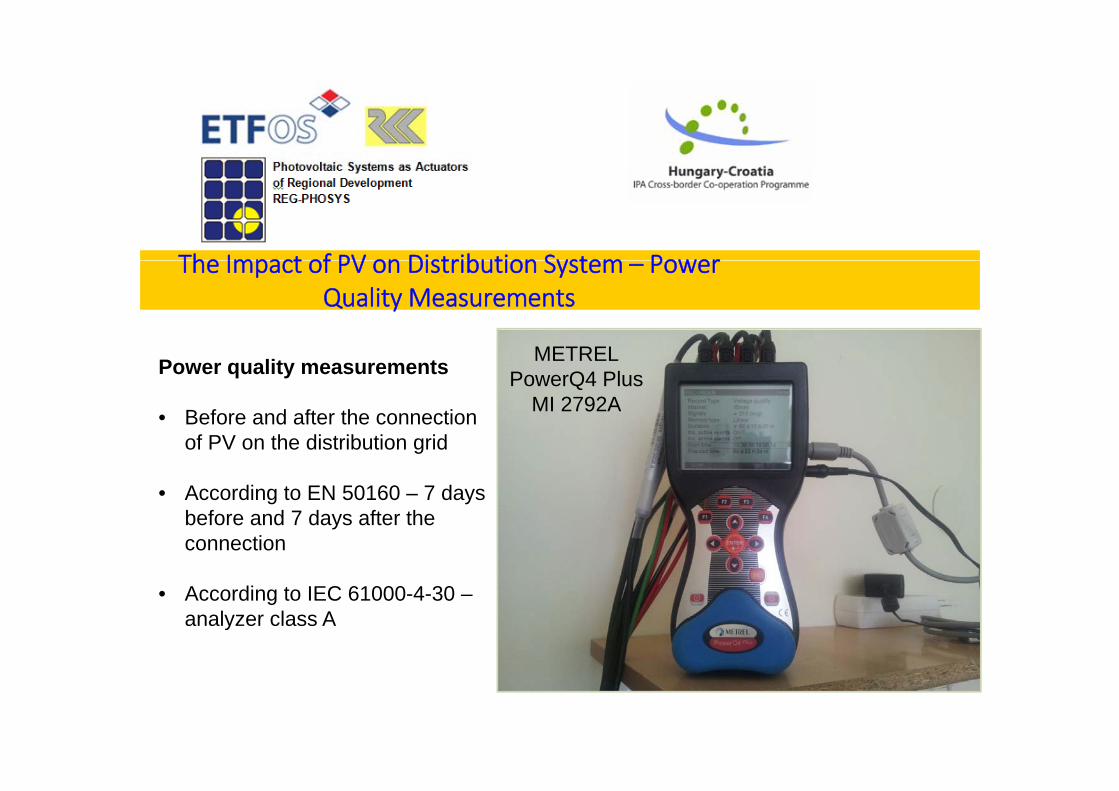
METRELPower quality measurements
• Before and after the connection of PV on the distribution grid
METRELPowerQ4 Plus
MI 2792A
of PV on the distribution grid
• According to EN 50160 – 7 days before and 7 days after the connection
• According to IEC 61000-4-30 –analyzer class Aanalyzer class A

TheImpactofPVonDistributionSystem PowerQuality
Th lt f P
The Impact of PV on Distribution System –Power Quality Measurements
The results of Power quality measurements:
• According to EN 50160g
• According to Croatian Grid Code
TheImpactofPVonDistributionSystem PowerQualityThe Impact of PV on Distribution System –Power Quality Measurements
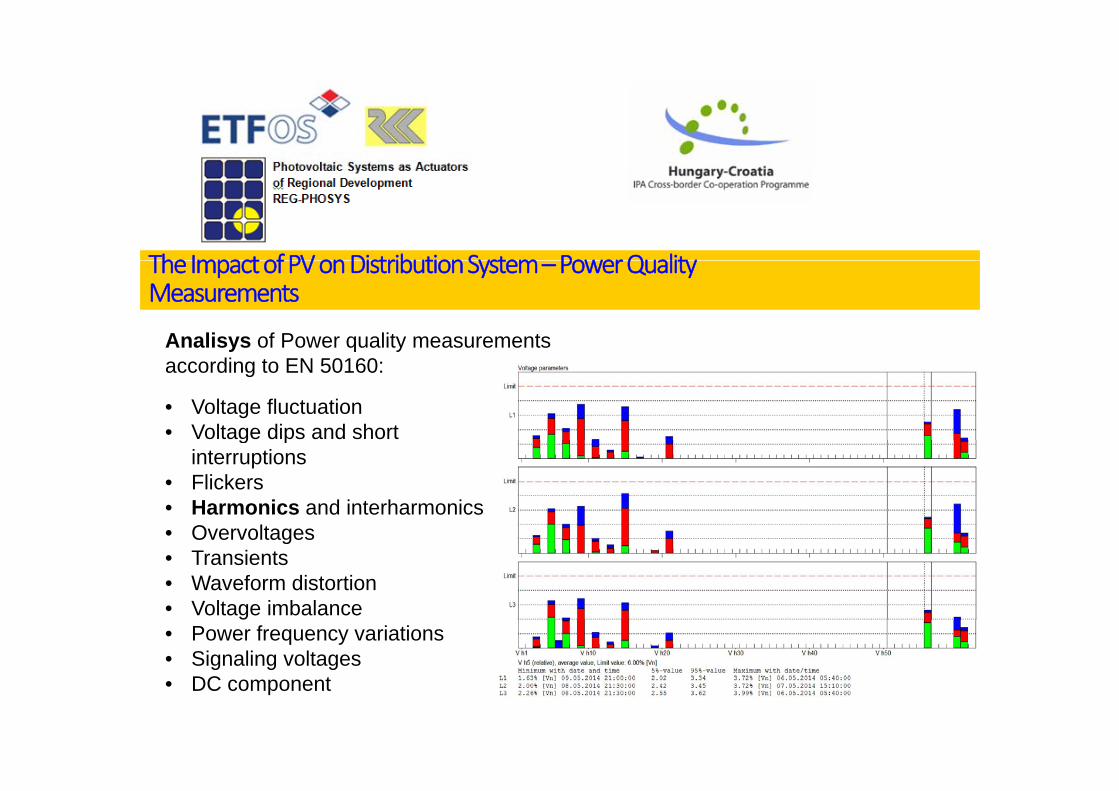
Analisys of Power quality measurements
• Voltage fluctuation• Voltage dips and short
y q yaccording to EN 50160:
g pinterruptions
• Flickers• Harmonics and interharmonics• Overvoltages• Overvoltages• Transients• Waveform distortion• Voltage imbalance• Power frequency variations• Signaling voltages• DC component

The Impact of PV on Distribution System PowerThe Impact of PV on Distribution System – Power Quality Measurements
The real power delivered to distribution grid from PV power plant – during 7 days test operation of PV.

Voltage deviation
Range Limit Mark
230 V ± 10% 95,0 % OK
230 V +10%/‐15 % 100,0 % OK
Frequency deviation
Range Limit Mark
50 H ± 1% 99 5 % OK50 Hz ± 1% 99,5 % OK
50 Hz +4%/‐6% 100,0 % OK
THD
Range (contribution) Limit Mark
<2,5 % 95 % OK,
Imbalance
Range (contribution) Limit Mark
<1,3 % 95 % OK
Flickers
Range (contribution) Limit Mark
Pst (shortterm) < 0,7 95,0% OK
Plt (longterm) < 0,5 95,0 % OK
Power factor
Range Limit Mark
Definiran u EES 100% OK
Influence on signalMark
OK

The Impact of PV on Distribution System PowerThe Impact of PV on Distribution System – Power Quality Measurements
In laboratory, measurements are continuing...y g

University Project: Load Management in the Distribution System withUniversity Project: Load Management in the Distribution System withPhotovoltaic Power Plant Using Smart Metering
Paper: Load Management Scheme Using Air Conditioning Electric Power Consumption and Photovoltaic PowerElectric Power Consumption and Photovoltaic Power System Generation
Zvonimir Klaić, Damir Šljivac , Krešimir Fekete and Zorislav KrausUniversity of Osijek, Faculty of Electrical Engineering, Power System Department, Osijek 31000, Croatia;
Journal of Energy and Power Engineering, ISSN 1934‐8975, USA

Rapid development of renewable energy sources and distributed generation in general
Power consumption is continuously increasing, and consumers are becoming more complex
Concept of Smart Grids is generally accepted as a possible solutionConcept of Smart Grids is generally accepted as a possible solution
The aim of this paper was creating algorithm for real‐time load management using power measurementsmeasurements
Algorithm for real‐time load management at the ETFOS was created based onAlgorithm for real‐time load management at the ETFOS was created based on
• measurements of photovoltaic power plant production, h f d d• the power consumption of air conditioning system and
• the faculty building total electricity consumption
PV POWER PLANT
AIR CONDITIONINGSYSTEM
ENERGY STORAGE DEVICE
FACULTY – MAINELECTRICAL
SWITCHBOARDPV POWER PLANT
ELECTRICAL SWITCHBOARD
PUBLIC DISTRIBUTION GRID
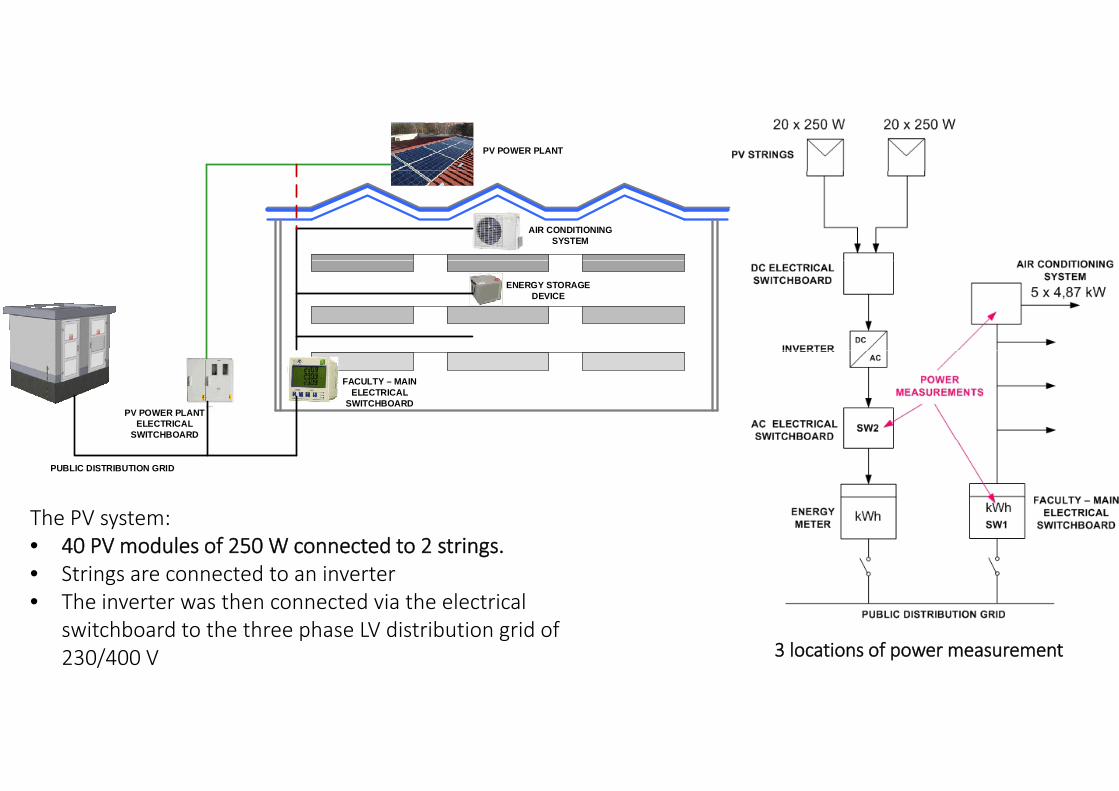
The PV system: • 40 PV modules of 250 W connected to 2 strings.• Strings are connected to an inverter • The inverter was then connected via the electrical
switchboard to the three phase LV distribution grid of 230/400 V 3 locations of power measurement

Air conditioning system ‐ consists of 5 Toshiba RAV‐SM1401AT‐E air conditioning units, each with rated power of 4.87 kW. The air conditioning system is installed in the main lecture hall which is the largest and most widely inThe air conditioning system is installed in the main lecture hall which is the largest and most widely in use.Significant portion of the ETFOS peak demand in summer period is caused by air conditioning system.
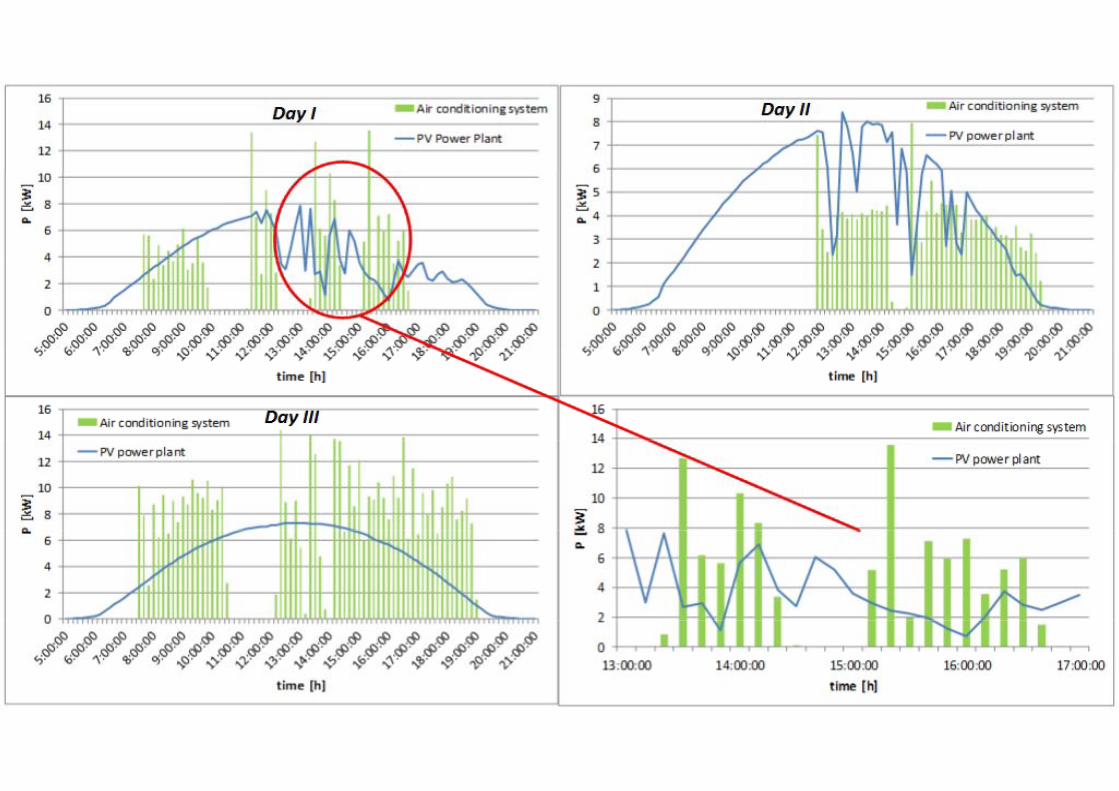
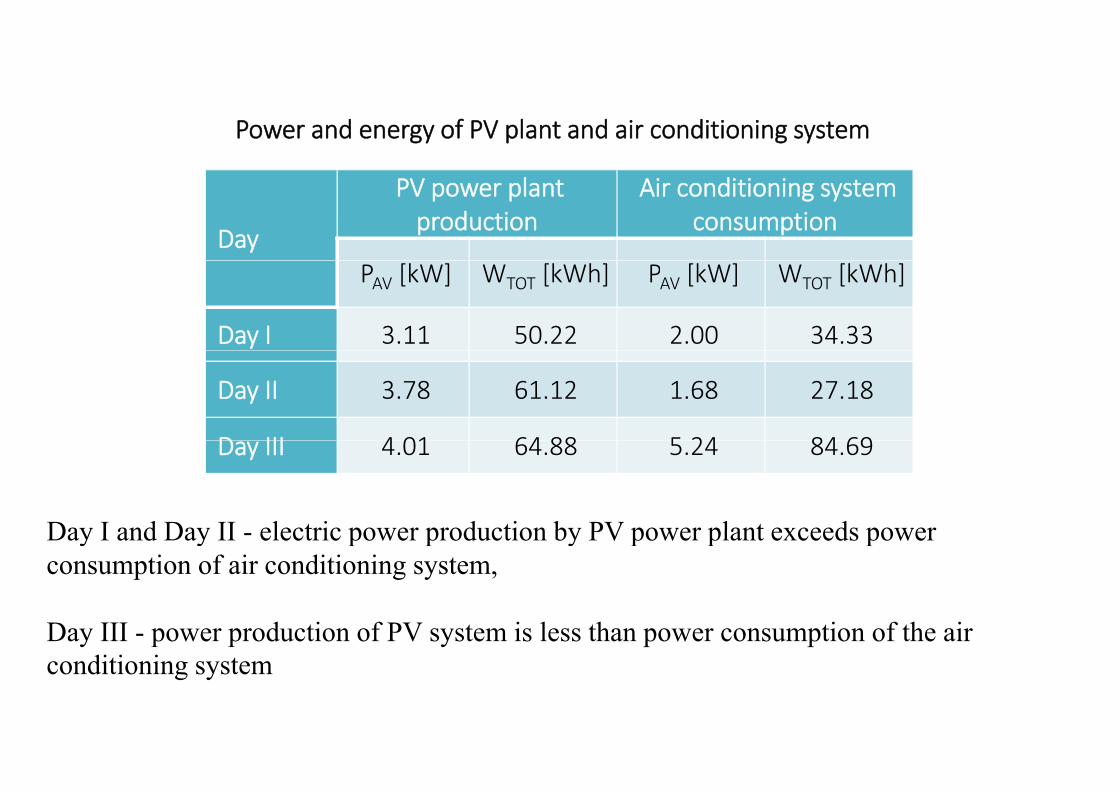
Power and energy of PV plant and air conditioning system
Day
PV power plant production
Air conditioning system consumption
PAV [kW] WTOT [kWh] PAV [kW] WTOT [kWh]
Day I 3.11 50.22 2.00 34.33
Day II 3.78 61.12 1.68 27.18
D III 4 01 64 88 5 24 84 69Day III 4.01 64.88 5.24 84.69
Day I and Day II electric power production by PV power plant exceeds powerDay I and Day II - electric power production by PV power plant exceeds power consumption of air conditioning system,
Day III - power production of PV system is less than power consumption of the air conditioning system
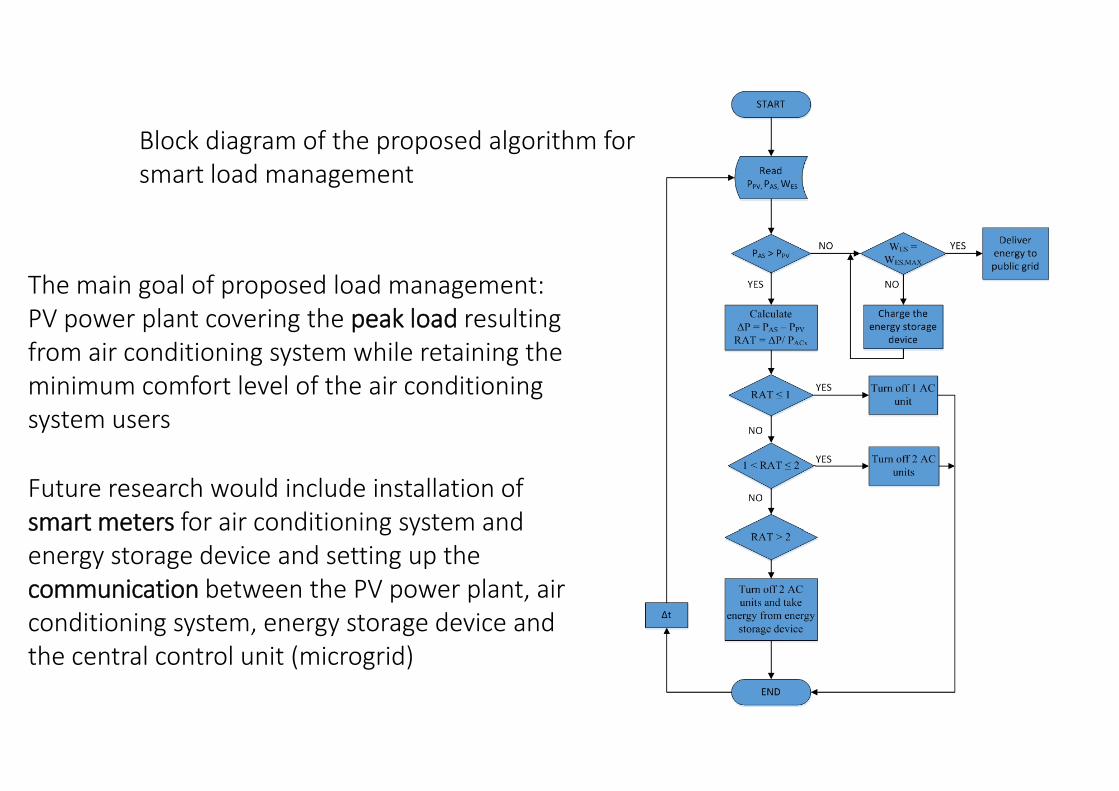
Block diagram of the proposed algorithm for smart load managementsmart load management
The main goal of proposed load management: PV power plant covering the peak load resulting from air conditioning system while retaining thefrom air conditioning system while retaining the minimum comfort level of the air conditioning system users
Future research would include installation of smart meters for air conditioning system and smart meters for air conditioning system andenergy storage device and setting up the communication between the PV power plant, air conditioning system energy storage device andconditioning system, energy storage device and the central control unit (microgrid)
DEMAND SIDE LOAD MANAGEMENT IN THE DISTRIBUTION SYSTEM WITH PHOTOVOLTAIC GENERATION
h d l f h f d b k f h f k
SYSTEM WITH PHOTOVOLTAIC GENERATIONZvonimir Klaić, Krešimir Fekete, Damir Šljivac
The model of the part of power distribution network of the city of Osijek has been created based on • results of the power measurements of total electricity consumption in p y p
a family house in Osijek, • air conditioning system consumption and • PV power plant production• PV power plant production.
Also, algorithm for real‐time load management is proposed.
It assumes coordinated control of air conditioning system units depending on the production of PV power plants and electricity consumption of distribution network, in order to reduce peak demand in the distribution network.

Measurements at three locations:• total electricity consumption of family house and• consumption of air conditioner were measured at house main electrical switchboard,• PV plant electricity production was measured at the PV plant AC electrical switchboard.
Measurements lasted for two weeks (started from 1 September 2014 and ended 15 September 2014).
Total consumption of the family house for a typical day

Part of the distribution network modelled in PowerWorldPart of the distribution network modelled in PowerWorld
PowerWorld software package is used to create a computer model of the PVPowerWorld software package is used to create a computer model of the PV power plant and local distribution network.
In the simulation model, three radial feeders (with 20 family houses connected , ( yto each radial feeder) are connected to the 0.4 kV side of the transformer station as shown in Fig.

In order to investigate the impact of PV power plant production on distribution network, four simulation scenarios are simulated and analysed:
Scenario 1: without installed PV power plants Scenario 2: 1 installed PV power plant at every radial feeder
Scenario 3: 3 installed PV power plants at every radial feeder Scenario 4: 5 installed PV power plants at every radial feeder

Simulation of the Demand Side Load Management
I i d h d d id l d i d d i i
START
Read PTS, PLIM, PIt is assumed that demand side load management is conducted using air
conditioners installed in family houses.
When active power supplied from the distribution network is higher than
PTS > PLIM
YES
NO
PAC1, PAC2,PAC3...PACn
PTS < 0YES charge the
energy storage unit
NOWhen active power supplied from the distribution network is higher than the specified threshold, demand side load management is activated and air conditioners in specific family houses are turned off.
Calculate ΔP = PTS – PLIM PG1, PG2, PG3,
PG4
PG1 > ΔP turn off AC YESPG1 > ΔP units from PG1
NO
PG2 > ΔP YES turn off AC
units from PG2
NO
Load management algorithm:
f NO
PG3 > ΔP turn off AC units from PG3
YES
NO
• coordinated control of air conditioning units depending on the electricpower demand on transformer station and
• thus reducing peak demand in a part of distribution system.
turn off AC units from PG4 and take energy
Δt PG4 > ΔP turn off AC
units from PG4YES
NODistribution system operator (DSO) can set up the limit value of demandpower and all other values are obtained by smart measuring.
gyfrom energy storage unit
END
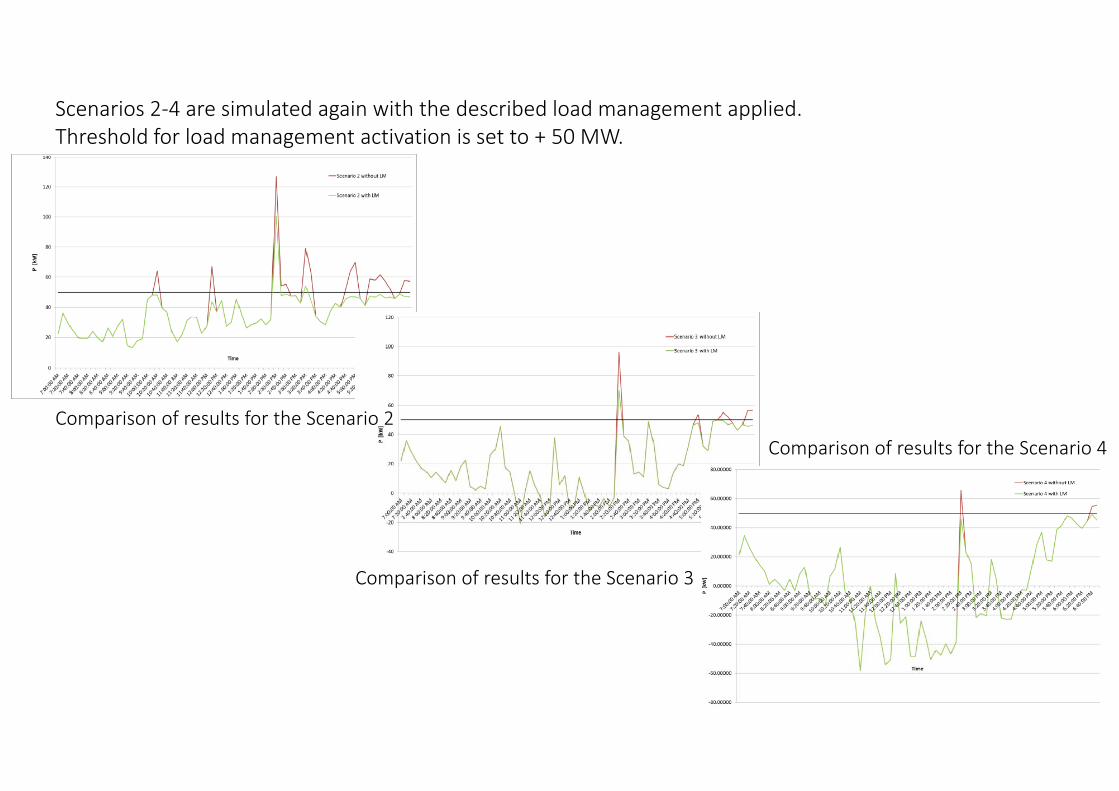
Scenarios 2‐4 are simulated again with the described load management applied. Threshold for load management activation is set to + 50 MW.
Comparison of results for the Scenario 2f l f hComparison of results for the Scenario 4
Comparison of results for the Scenario 3

Computer simulations show that PV power plant has beneficial effect on distribution network in termsof decreasing demand levelof decreasing demand level.
As this kind of power plants strongly rely on weather conditions, simulations also showed increasedimbalance in distribution network.
By adding load management scheme (by air conditioning units), and also with the included electricenergy storage, results of simulation showed that successful elimination the peak load in distributionsystem could be done.

Trenutni projekt:
Voditelj Krešimir Fekete
Web stranica http://www etfos unios hr/fakultet/imenik djelatnika/kfekete#ancWeb stranica predlagatelja
http://www.etfos.unios.hr/fakultet/imenik‐djelatnika/kfekete#anc
Naslov projekta Primjena optimizacijskih metoda upravljanja potrošnjom u elektrodistribucijskim mrežama sa fotonaponskim elektranama
Suradnici na projektu (ako postoje)
Zvonimir Klaić, docent, Elektrotehnički fakultet OsijekMario Primorac, stručni suradnik (student poslijediplomskog studija na ( p j ) ( p j p g jElektrotehničkom fakultetu u Osijeku), Elektrotehnički fakultet OsijekMario Šipoš, student poslijediplomskog studija na Elektrotehničkom fakultetu u Osijeku, zaposlen u MORH‐uj p
Glavni cilj projekta je pronaći model za optimalan plan upravljanja trošilima (kli đ j ) i ti l j št j ik h ij ilj(klima uređaja) i optimalan razmještaj spremnika za pohranu energije sa ciljem učinkovitijeg vođenja elektrodistribucijske mreže.

Hvala na pažnji!