Upper limb disability and exposure to hand-arm vibration … · Executive Health and Safety Upper...
50
Executive Health and Safety Upper limb disability and exposure to hand-arm vibration in selected industries Prepared by the Health and Safety Laboratory for the Health and Safety Executive 2008 RR667 Research Report
Transcript of Upper limb disability and exposure to hand-arm vibration … · Executive Health and Safety Upper...
Executive Health and Safety
Upper limb disability and exposure to hand-arm vibration in selected industries
Prepared by the Health and Safety Laboratory for the Health and Safety Executive 2008
RR667 Research Report
Executive Health and Safety
Upper limb disability and exposure to hand-arm vibration in selected industries
Kerry Poole & Howard Mason Health and Safety Laboratory Health Improvement Group Harpur Hill Buxton Derbyshire SK17 9JN
There is a need for evidence-based intelligence related to ill-health caused by exposure to vibration that could be used to benchmark the extent of disease and allow assessment of changes over time. This ideally requires simple, validated and cheap tools that can be administered easily across all industries. The Disability of the Arm, Shoulder and Hand (DASH) questionnaire is one instrument that may be useful.
The emphasis of HSE’s Noise and Vibration Programme has been on the health outcome of hand-arm vibration syndrome (HAVS), which is by definition causally associated with cumulative hand-transmitted vibration exposure. However, individuals with HAVS may also have other musculoskeletal disorders, which may or may not be a consequence of vibration exposure, but that will contribute to their overall disability.
The study reported here involved the application of the DASH questionnaire to a population working with hand-held vibrating tools, whilst collecting simple information related to industry, trade, tools used, vibration exposure, known health problems and symptoms in the upper limbs. Following discussion with appropriate HSE colleagues four industries were selected for study: Gardening; Manufacture of Basic Metals, Construction and Motor Vehicle Repair.
This report and the work it describes were funded by the Health and Safety Executive (HSE). Its contents, including any opinions and/or conclusions expressed, are those of the authors alone and do not necessarily reflect HSE policy.
HSE Books
© Crown copyright 2008
First published 2008
All rights reserved. No part of this publication may be reproduced, stored in a retrieval system, or transmitted in any form or by any means (electronic, mechanical, photocopying, recording or otherwise) without the prior written permission of the copyright owner.
Applications for reproduction should be made in writing to:Licensing Division, Her Majesty’s Stationery Office,St Clements House, 2-16 Colegate, Norwich NR3 1BQor by e-mail to [email protected]
ii
CONTENTS
1 INTRODUCTION..........................................................................................4
2 METHODS...................................................................................................62.1 Study design.............................................................................................62.2 Recruitment of population.........................................................................62.3 Questionnaire design and distribution ......................................................62.4 Data management....................................................................................72.5 Data analysis............................................................................................72.6 Statistical analysis ....................................................................................8
3 RESULTS ..................................................................................................103.1 Questionnaires returned and response rate ...........................................103.2 Overview of the data available ...............................................................103.3 Relationship between age and disability score.......................................103.4 Relationship between duration of vibration exposure and disability score12 3.5 Disability scores in the four different industries ......................................143.6 Disability scores in different trades.........................................................163.7 Disability score and use of vibration producing tools..............................183.8 Disability score and health problems or symptoms.................................22
4 DISCUSSION AND CONCLUSION ...........................................................30
5 REFERENCES ..........................................................................................33
6 APPENDICES............................................................................................356.1 Appendix one - questionnaire................................................................35
1
EXECUTIVE SUMMARY
There is a need for evidence-based intelligence related to ill-health caused by exposure to vibration that could be used to benchmark the extent of disease and allow assessment of changes over time. This ideally requires simple, validated and cheap tools that can be administered easily across all industries. The Disability of the Arm, Shoulder and Hand (DASH) questionnaire is one instrument that may be useful.
The emphasis of HSE’s Noise and Vibration programme has been on the health outcome of hand-arm vibration syndrome (HAVS), which is by definition causally associated with cumulative hand-transmitted vibration exposure. However, individuals with HAVS may also have other musculoskeletal disorders, which may or may not be a consequence of vibration exposure, but that will contribute to their overall disability.
In the present study we applied the DASH questionnaire to a population working with hand-held vibrating tools, whilst collecting simple information related to industry, trade, tools used, vibration exposure, known health problems and symptoms in the upper limbs. Following discussion with appropriate HSE colleagues four industries were selected for study: Gardening (SIC 1.41-Agricultural service activities); Manufacture of Basic Metals (SIC 27), Construction (SIC 45) and Motor Vehicle Repair (SIC 50.2).
Some care must be taken about extrapolating the findings of this report given the low response rate (287 responses, 14% response rate).
Objectives
1. Use simple self-administered disability questionnaires to assess disability in the upper limbs of individuals who have worked with vibrating tools in Gardening, Manufacture of Basic Metals, Construction and Motor Vehicle Repair.
2. Establish whether there are any differences in disability score between industries.
3. Establish whether the disability score is related to the trade of the individual.
4. Establish whether the use of any particular tools is related to elevated disability scores.
5. Investigate whether the disability score is elevated in those individuals reporting health problems or presenting with symptoms.
Main Findings
1. There was no significant difference in median age adjusted DASH scores between the industries, despite differences in duration of vibration exposure (total hours or years) between the industries. However, there was a suggestion of a greater proportion of those with the greatest DASH values coming from the Manufacture of Basic Metals industry.
2. Of the trades investigated, those classified as SOC 9129 (Labourers in other construction trades) had the highest median DASH scores. However, the comparison across trades is restricted because of very small numbers in some trades.
3. There was no evidence in the study population that the use of any particular hand-held vibrating tool led to increased disability scores.
2
4. In this vibration exposed study population 7.4% reported being diagnosed with HAVS, 5.3% had an upper limb problem, 11.1% had a back or lower limb problem and 2.9% had some other problem not affecting the upper limbs. The outcome on the DASH questionnaire was responsive to both the upper limb problems and the HAVS diagnosis.
5. A large proportion of the individuals working with vibrating tools in this study reported symptoms including pain or problems in the hands/wrists (32.2%), arms (26.6%), shoulder (28.4%) or neck (27.7%). These proportions were similar to those reported in the MRC general population study from the United Kingdom. The proportion of the study group reporting blanching in cold conditions (20.2%) and waking at night with pain or tingling/numbness in the hands (24.1%) were higher than those reported in the MRC study. These upper limb symptoms were related to the disability score obtained from the DASH questionnaire, with the most important determinants being self-reported pain or problems with the hands/wrist or arms. The DASH outcomes in the working groups studied suggest that increases in the DASH score are particularly reflecting pain in the hand/wrists, and to a lesser extent the arms, rather that the classical neurosensory and vascular HAVS symptoms of tingling, numbness and blanching.
Recommendations
Simple questions related to pain in the various locations of the upper limb may be useful in health surveillance questionnaires, as this was found to be the main determinant of disability in this study population. From this study we would recommend that further work would be needed to ascertain the main determinants in other populations (e.g. those with a confirmed diagnosis of HAVS), and also to identify questions that may be useful in health surveillance.
Disability, as measured by the DASH questionnaire in this population, may be a consequence of vibration-induced HAVS, or other upper limb disorders also found in vibration-exposed workers. The relative proportion of non-HAVS related upper limb symptoms and disorders in this workforce using vibrating tools suggests that health surveillance should not ignore such non-HAVS related problems, especially those causing pain in such workforces.
The DASH questionnaire may be a useful tool for integrating, on a quantitative basis, the health problems caused by HAVS and upper limb co-morbidities that are found in significant levels in workforces using vibrating tools.
3
1 INTRODUCTION
Validated quantitative health outcome questionnaires may be a cheap, effective means of identifying and prioritising workplace hazards and identifying specific groups of workers who may require more detailed investigation. They could also be used as a measure for obtaining levels of disability associated with hand-arm vibration exposure in defined trades and, as such, may be used to target HSE’s limited resources to those trades that may be more likely to benefit from intervention strategies. Furthermore, these questionnaires could be useful in monitoring the success of targeted interventions over time and be used to demonstrate HSE’s success in delivering their reduction in ill-health targets.
The Disability of the Arm, Shoulder and Hand (DASH) questionnaire was introduced in 1996 and specifically focuses on disability in the upper limbs and its effect on everyday activities [1]. It was developed by the American Academy of Orthopedic Surgeons, the Council of Musculoskeletal Speciality Societies and the Institute of Work and Health in Toronto. The original goal of this collaboration was to produce a brief, self-administered measure of symptoms and functional status, with a focus on physical function, to be used by clinicians in daily practice and as a research tool [1]. This questionnaire has now been adapted and validated in a variety of languages including Dutch [2], German [3], Canadian French [4], Japanese [5] and Chinese [6]. It consists of 30 questions related to function of the upper extremity and two further optional modules related to work and social activity. A well described scoring procedure accompanies the questionnaire and normal values related to the general population of the United States have been published in the literature [7]. The questionnaire has been shown to have good construct validity, is responsive to changes in the upper limbs and is the only questionnaire available that looks at the whole of the upper limb, rather than its individual components [8]. It has been used widely to look at changes in the upper limb following surgery or treatment for a variety of conditions including Carpal Tunnel Syndrome [9] , lateral epicondylitis [10], Dupuytrens contracture [11], peripheral nerve repair [12] and osteoarthritis in the hand [13]. Furthermore, the questions on the DASH questionnaire can be mapped to the World Health Organization’s International Classification of Functioning, Disability and Health [3].
Excessive exposure to hand-arm vibration leads to well described symptoms of blanching in cold conditions, tingling/numbness in the hands and effects on manual dexterity and grip strength. However, little is known about the effect of this upper limb disorder (hand-arm vibration syndrome) on functionality or disability of the upper limbs. Furthermore, it was not known how disability was related to the current way in which the severity of HAVS is defined (Stockholm Workshop Scale). In a previous study we used the DASH questionnaire to assess upper limb disability in individuals diagnosed by a physician as having HAVS, and relate this to severity of disease. The quantitative outcome from this questionnaire was found to be related to the Sensory Stockholm Workshop Staging of individuals and also allowed exploration of comparative disability between HAVS cases, CTS cases and those cases with a diagnosis that indicated both HAVS and CTS combined [14, 15]. Interestingly, the DASH score was most related to the sensory component of HAVS, as opposed to the vascular component [14]. In addition, we have also shown that the best predictors of outcome on the DASH questionnaire are measures of manual dexterity (Purdue pegboard) and grip strength [16].
4
This work has shown that the outcome from this questionnaire provides useful health outcome information in those diagnosed with HAVS. However, it is currently unclear how this compares to a population working with hand-held vibrating tools, which do not have HAVS. Furthermore, the extent of upper limb disability arriving from any cause (e.g. HAVS, Carpal Tunnel Syndrome) in a population working with hand-held vibrating tools is unknown.
The present study aimed to collect information on disability in the upper limb using the DASH questionnaire in a population working with hand-held vibrating tools in four industries. The industries of interest were Gardening (SIC 1.41-Agricultural service activities); Manufacture of Basic Metals (SIC 27), Construction (SIC 45) and Motor Vehicle Repair (SIC 50.2).
The main objectives were to:
1. Use simple self-administered disability questionnaires to assess disability in the upper limbs in Gardening, Manufacture of Basic Metals, Construction and Motor Vehicle Repair.
2. Establish whether there are any differences in disability score between industries.
3. Establish whether the disability score is related to the trade of the individual.
4. Establish whether the use of any particular tools is related to elevated disability scores.
5. Investigate whether the disability score is elevated in those individuals reporting health problems or presenting with symptoms.
5
2 METHODS
2.1 STUDY DESIGN
In this study we assessed the functional ability (disability) in the upper limbs and vibration exposure characteristics of a working population of individuals who had been exposed to hand-arm vibration in their jobs. The individuals were from four selected industries: Gardening (SIC 1.41-Agricultural service activities); Manufacture of Basic Metals (SIC 27), Construction (SIC 45) and Motor Vehicle Repair (SIC 50.2). These were classified according to the UK Standard Industrial Classification (SIC 2003 [17]). Every individual was sent a questionnaire to collect information regarding vibration exposure history, functionality/disability of the upper limbs and simple HAVS symptoms (Appendix one).
2.2 RECRUITMENT OF POPULATION
In order to recruit appropriate working populations we contacted Occupational Health Physicians and Nurses who had attended the Faculty of Occupational Medicine HAVS course and other personal contacts via letter and telephone to see if they would be willing to help in this research. We also presented the study to the Motor Vehicle Repair Forum and Northern Construction Group to raise awareness of the research and gain contacts. In addition, we also attended one of the Motor Vehicle Repair Safety and Health Awareness Days (SHAD), and a similar event in Noise and Vibration. In total we made 67 contacts and these consisted of 22 local authorities, 13 private Occupational Health Providers, 5 Construction firms, 3 Unions, 4 Trade Associations, 7 Foundries and 13 in the others category (e.g. vehicle manufacture).
This study received approval from the HSE Research Ethics Committee (ETHCOM/REG/05/04).
2.3 QUESTIONNAIRE DESIGN AND DISTRIBUTION
The questionnaire was designed in a software package available for these purposes (Sphinx Survey v4.5). The full questionnaire can be found at Appendix one but briefly it consisted of ten pages of questions, most of which were of the CROSS in the box design. The questions asked for information regarding age, gender, employment status, job history and industry, whether the individual had received a diagnosis of HAVS, signs and symptoms related to HAVS and/or Carpal Tunnel Syndrome, difficulties in performing everyday activities (DASH) and history of vibrating tool use. Information that could be used to identify individuals, such as the name and address of the person completing the questionnaire and the employers name, were not collected to protect anonymity and encourage individuals to complete the questionnaire. A cover letter was appended to the front of the questionnaire detailing what the study was for, how long it would take to complete the questionnaire and how to return the completed questionnaire. Each questionnaire was distributed with a FREEPOST envelope with the name and address of a member of the study team, so that individuals could return the questionnaire directly to HSL rather than through their management or Occupational Health system. The questionnaires were distributed to individuals through their management, health and safety representatives, or occupational health provider.
6
2.4 DATA MANAGEMENT
The completed questionnaires were scanned into the Sphinx survey software. This software is able to machine read the responses on the questionnaire and place the data into a database. Each entry was checked by the operator for accuracy and, if necessary, amendments were made.
2.5 DATA ANALYSIS
Calculation of Disability for the Arm, Shoulder and Hand (DASH) Score
The answers to questions 19 through to 48 (Appendix one) were used to calculate the DASH score. The DASH score has a range of values between 0 and 100, with 0 depicting no lack of function or disability and 100 depicting maximal disability. This was calculated according to the documentation that accompanies the DASH questionnaire; missing answers were handled as recommended. A normalized score (mean=50, standard deviation =10) compared to the reference values for US males was also calculated according to the scheme of the American Academy of Orthopaedic Surgeons [7].
Age adjustment of DASH score
The DASH score is related to age in the published reference data for US males. To account for this the normalised DASH score was adjusted to an age of 45years as published previously [16]:
DASH(adj45) = Measured DASH – [46.84-(0.03976*age)+(0.001802*age2)]+48.7
It is the age-adjusted normalised score that has been used throughout the majority of the report and included in the statistical analysis.
Calculation of total duration of vibration exposure over the working lifetime
Individuals were asked to complete a questionnaire regarding the extent of use of vibrating tools during their working lives (Appendix one). They were asked to estimate the trigger time per day and the total number of years a tool had been used. The reported number of hours per day and total number of years a tool had been used were then used to calculate the total number of hours a tool had been used over the working life. The total number of working days a year was estimated as 221. The total number of hours a tool was used was estimated according to the following:
Total hours of use = (Hours per day*221) * number of years used
This was calculated for each type of tool used. The total values for each type of tool were then summed to give the total lifetime hours of tool use.
Standard coding of industry and trade
Using the information collected regarding job history and industry (questions 8 and 9 respectively of Appendix one) the industry and trade in which each individual worked was coded according to the UK Standard Industrial Classification of Economic Activities 2003 (SIC 2003) [17] and the Standard Occupational Classification 2000 (SOC 2000) [18].
7
2.6
Definition of subgroups within the working population with reported health problems or symptoms
The influence of specific symptoms and reported health problems on the DASH score was investigated by grouping individuals according to the answers given on the questionnaire.
Those individuals who reported a health problem in question 53 (‘Do you have any other health problems that you think are important?’) or answered ‘Yes’ to question 10 (‘Have you ever been diagnosed as having hand-arm vibration syndrome (HAVS) or vibration white finger (VWF)?’) were defined as the group with self-reported health problems. These problems were then subdivided into those related to the upper limbs, back/lower limbs, HAVS or Other.
We also looked at whether individuals experienced any symptoms or pain that may affect their functionality. If an individual answered ‘Yes’ to any one of the following questions they were defined as the group with self-reported symptoms:
Question 11 Have your fingers gone white on exposure to cold?
Question 14 Do your fingers tingle for more than 20 mintues after using vibrating equipment?
Question 16 Do your fingers go numb for more than 20 minutes after using vibrating equipment?
Question 18 Do you ever wake from sleep with any pain, tingling, or numbness in your hands/wrists or arms?
Question 49 In general, have you pain or problems with your neck?
Question 50 In general, have you pain or problems with your shoulders?
Question 51 In general, have you pain or problems with your arms?
Question 52 In general, have you pain or problems with your hands/wrists?
STATISTICAL ANALYSIS
The data were exported from Sphinx survey into SPSS for the purposes of statistical analysis. Distribution of all variables was checked before conducting statistical analysis. The DASH score and measurements of total lifetime hours of tool use were not normally distributed. The measurements of total lifetime hours of tool use were successfully transformed to approach normality by calculating the following: log10 (total lifetime hours of tool use/100). It was this transformed data that was used in the analysis. However, standard transformations were unable to transform the DASH data satisfactorily, therefore these data have been treated non-parametrically.
Non-parametric grouped data are presented in the report as Box and Whisker plots and medians were compared using the Mann-U-Whitney test. Multiple comparisons of medians were unadjusted unless otherwise stated.
8
Where the relationship between two continuous variables was examined correlation analysis was performed and Pearsons correlation coefficient presented with corresponding p-value.
The proportion of individuals with symptoms in different industries, or with different self-reported health problems, was compared using chi-squared analysis.
Predictive models were created to establish which of the questions regarding symptoms or pain were most predictive of the DASH score. Univariate general linear regression in SPSS was used for this purpose. Firstly all of the questions were put in the model and then on a systematic basis each one that was not statistically significant was removed from the model. The final model contained only those variables having a significant contribution, and the significance level and partial Eta Squared (proportion of total variability attributable to a factor) for each variable was reported. The overall adjusted R squared value for the final model was also reported. The residuals for the model were also examined to ensure that this analysis was appropriate.
9
3 RESULTS
3.1 QUESTIONNAIRES RETURNED AND RESPONSE RATE
Of the 67 companies/professionals we contacted to see if they would help with this study, 13 agreed to help (19%). These constituted 5 councils, 3 construction firms, 2 unions, 1 foundry, 1 private occupational health provider and 1 other.
A total of 1,987 questionnaires were sent out to these contacts and we received 287 responses, which was equivalent to a 14% response rate.
3.2 OVERVIEW OF THE DATA AVAILABLE
Of the 287 questionnaire responses we received from the study population 18 of these were from individuals who had never used vibrating tools occupationally and these were therefore excluded from further analysis. A further 23 were excluded because they did not work in the industries selected, or information regarding the industry they worked in was not available. Of these 3 individuals did not complete the DASH questionnaire appropriately and this gave a total of 243 DASH questionnaires that were available for analysis. These responses came from the following industries: Gardening (n=35); Manufacture of Basic Metals (n=11); Construction (n=106) (67 of these in road construction) and Motor Vehicle Repair (n=91).
Of the 243 individuals included in this study 227 currently used vibrating tools and 16 used them in previous jobs.
3.3 RELATIONSHIP BETWEEN AGE AND DISABILITY SCORE
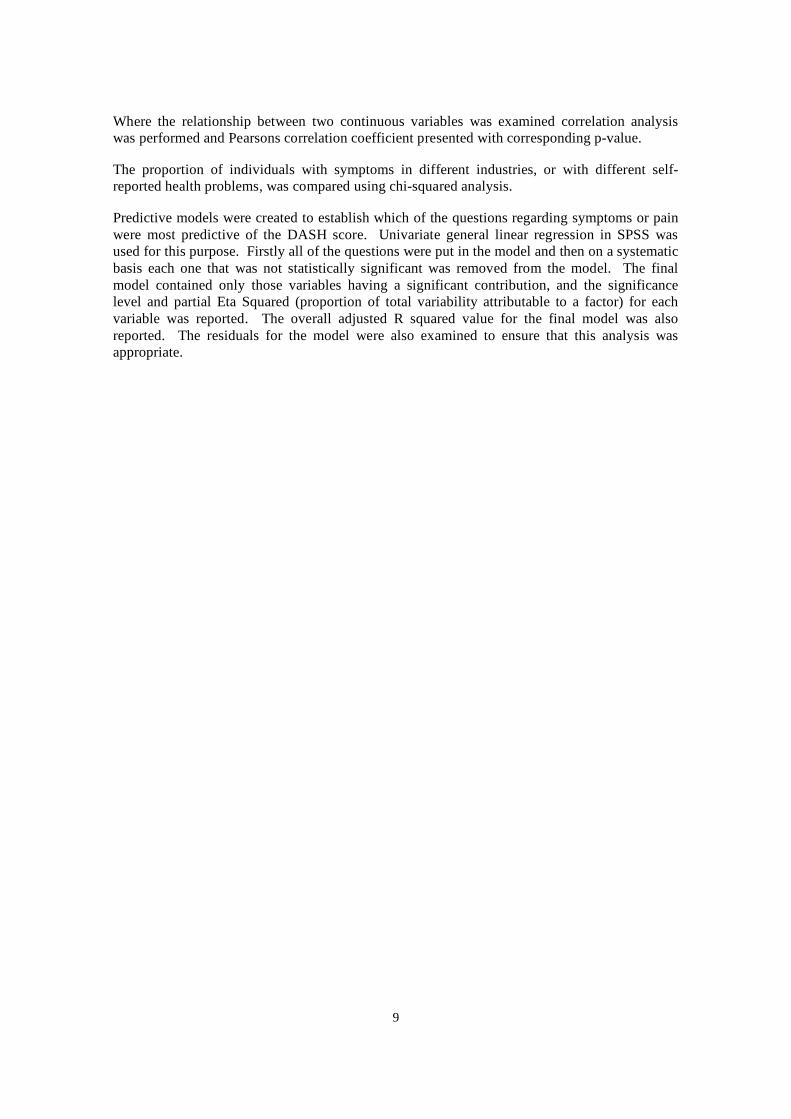
The average age of those reporting their age (n=241) was 41.4 years (SD 11.6 years) and ages ranged between 16 and 64 years. It was not possible to investigate the relationship between gender and disability because there were only 5 females in the population, however we were able to look at the effect of age. Figure 3.1 shows the relationship between disability score and age in the working population. Although there was considerable scatter there was a statistically significant correlation between the two variables (p<0.0001, r=0.296).
10
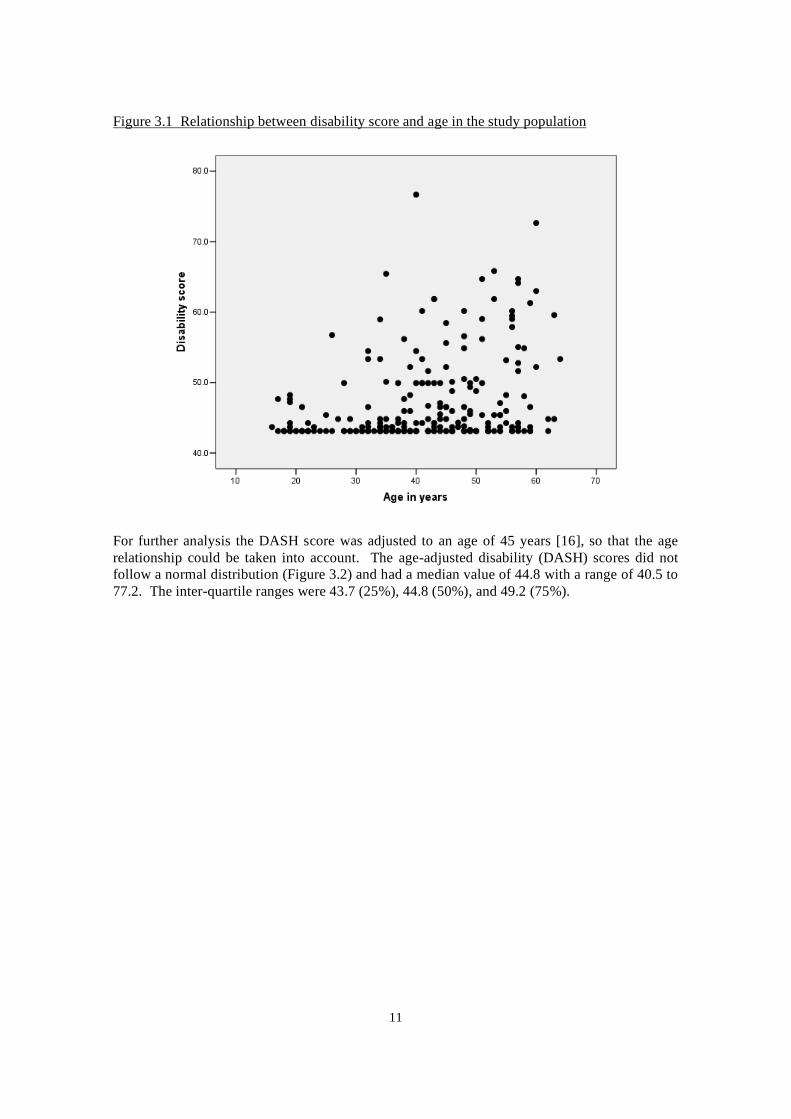
Figure 3.1 Relationship between disability score and age in the study population
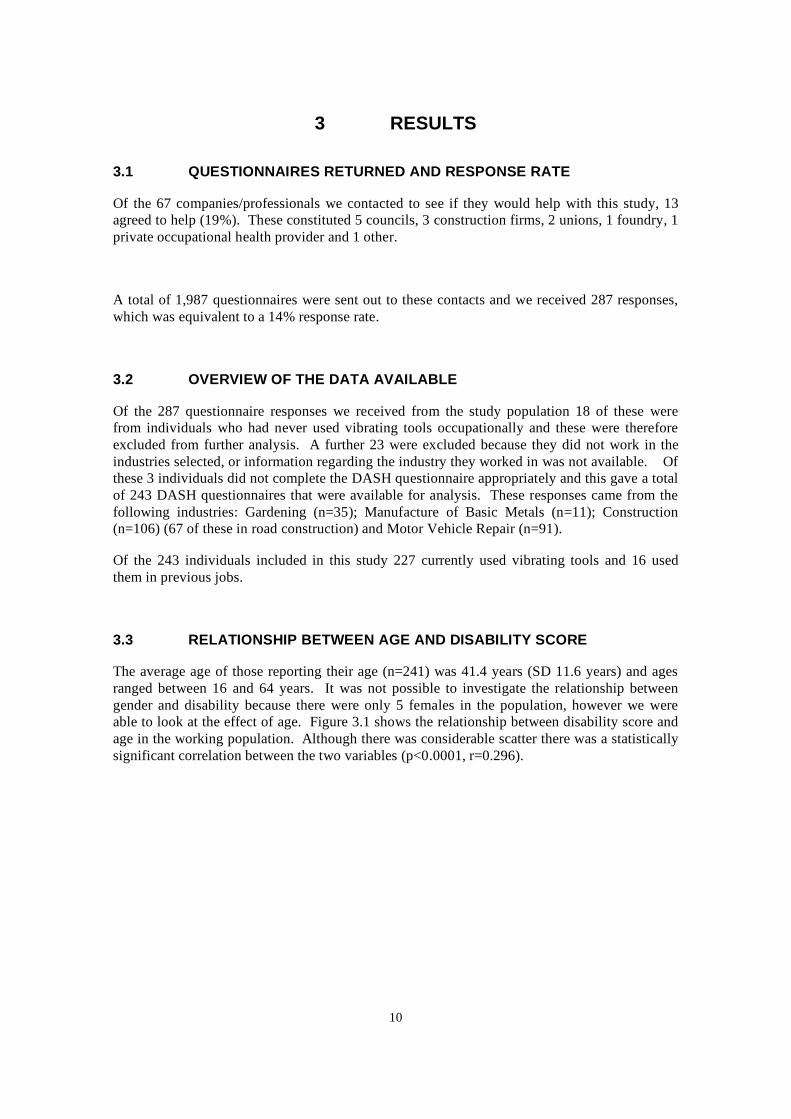
For further analysis the DASH score was adjusted to an age of 45 years [16], so that the age relationship could be taken into account. The age-adjusted disability (DASH) scores did not follow a normal distribution (Figure 3.2) and had a median value of 44.8 with a range of 40.5 to 77.2. The inter-quartile ranges were 43.7 (25%), 44.8 (50%), and 49.2 (75%).
11
3.4
Figure 3.2 Distribution of age-adjusted DASH score in the study population
RELATIONSHIP BETWEEN DURATION OF VIBRATION EXPOSURE AND DISABILITY SCORE
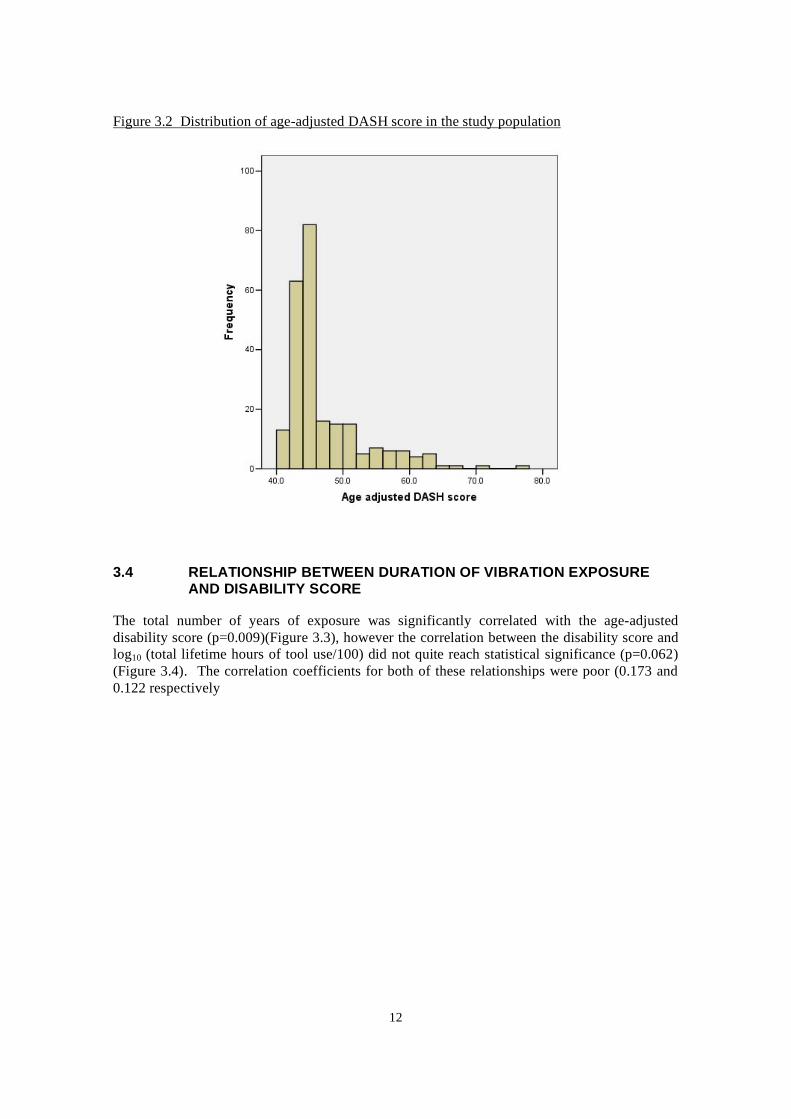
The total number of years of exposure was significantly correlated with the age-adjusted disability score (p=0.009)(Figure 3.3), however the correlation between the disability score and log10 (total lifetime hours of tool use/100) did not quite reach statistical significance (p=0.062) (Figure 3.4). The correlation coefficients for both of these relationships were poor (0.173 and 0.122 respectively
12
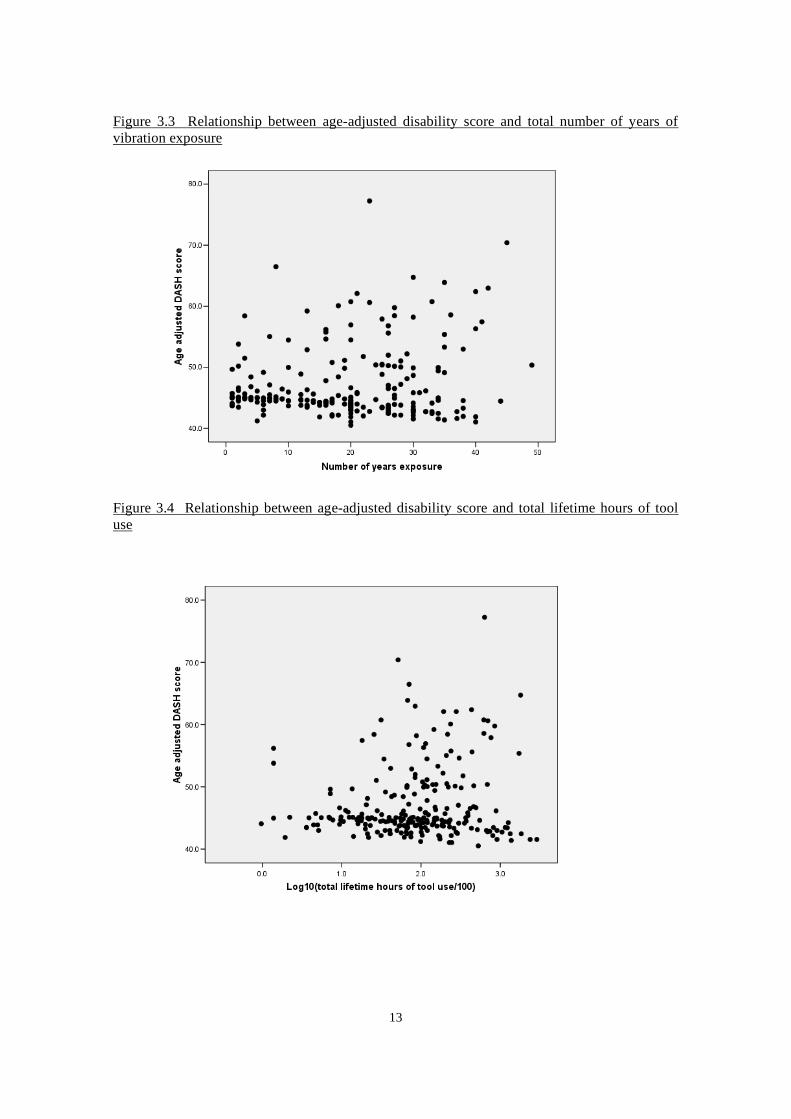
Figure 3.3 Relationship between age-adjusted disability score and total number of years of vibration exposure
Figure 3.4 Relationship between age-adjusted disability score and total lifetime hours of tool use
13

3.5 DISABILITY SCORES IN THE FOUR DIFFERENT INDUSTRIES
Box and whisker plots of the age-adjusted disability scores in the four selected industries are shown in Figure 3.5. Unfortunately the number of responses in two of the groups was quite small (gardening n=35 and manufacture of basic metals n=11). When the median age-adjusted disability scores in the four industries were compared there were no statistically significant differences between industries (p=0.412).
Figure 3.5 Age-adjusted disability score for those working in each industry
Box represents the values between which 75% and 25% of the data lie. Thick, dark horizontal line represents the median value. Whiskers represent the largest and smallest values that are not outliers. Open circles show the outliers that are defined as between 1.5 and 3 box lengths from the upper edge of the box. Asterisk represents extreme values.
However, there were some differences in duration of vibration exposure between the four industries. In terms of the total lifetime hours of tool use (Figure 3.6) the median level in those from the Motor vehicle repair industry was significantly higher than both the Manufacture of basic metals industry (p=0.003) and the construction industry (p=0.029). The only other statistically significant difference was that the Gardening industry had a higher median number of hours when compared to the Manufacture of basic metals (p=0.017).
14
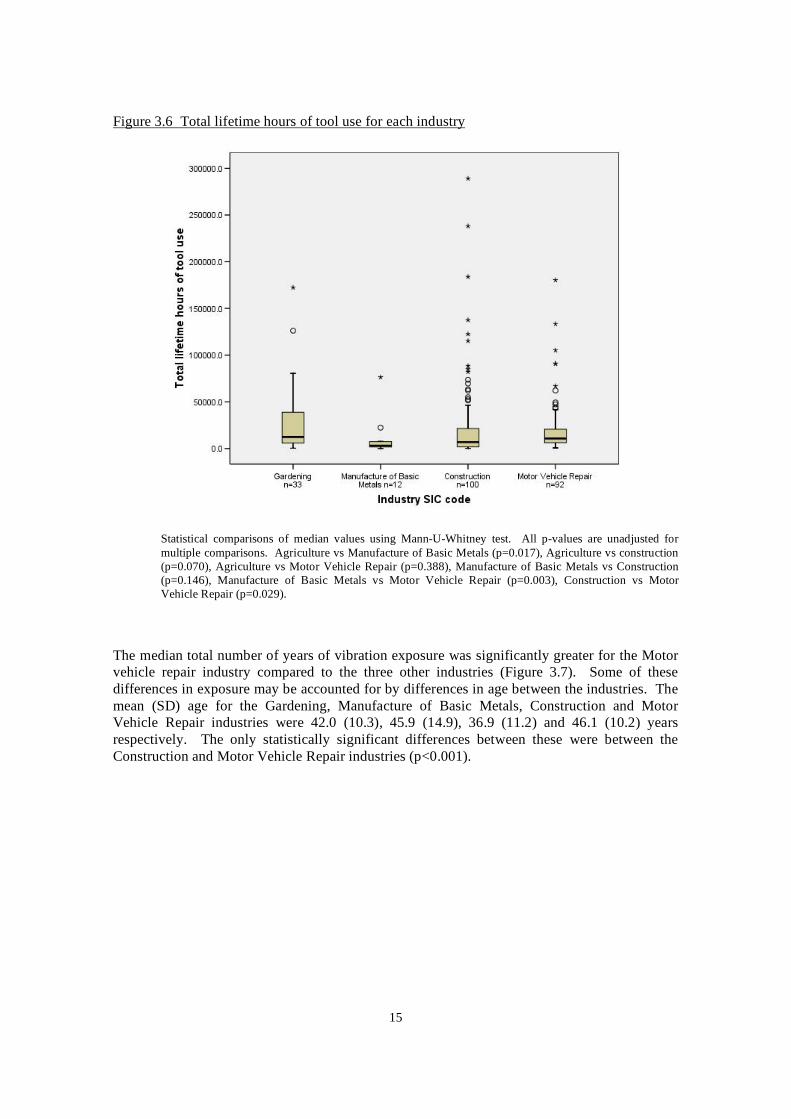
Figure 3.6 Total lifetime hours of tool use for each industry
Statistical comparisons of median values using Mann-U-Whitney test. All p-values are unadjusted for multiple comparisons. Agriculture vs Manufacture of Basic Metals (p=0.017), Agriculture vs construction (p=0.070), Agriculture vs Motor Vehicle Repair (p=0.388), Manufacture of Basic Metals vs Construction (p=0.146), Manufacture of Basic Metals vs Motor Vehicle Repair (p=0.003), Construction vs Motor Vehicle Repair (p=0.029).
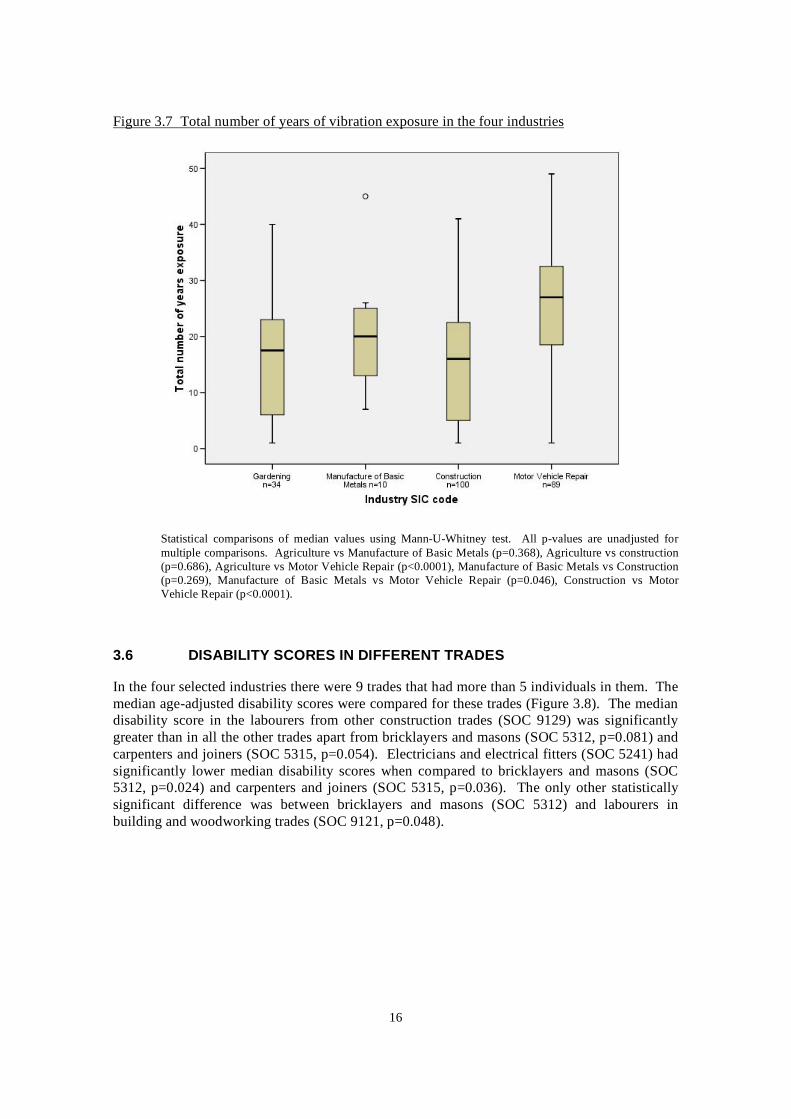
The median total number of years of vibration exposure was significantly greater for the Motor vehicle repair industry compared to the three other industries (Figure 3.7). Some of these differences in exposure may be accounted for by differences in age between the industries. The mean (SD) age for the Gardening, Manufacture of Basic Metals, Construction and Motor Vehicle Repair industries were 42.0 (10.3), 45.9 (14.9), 36.9 (11.2) and 46.1 (10.2) years respectively. The only statistically significant differences between these were between the Construction and Motor Vehicle Repair industries (p<0.001).
15
3.6
Figure 3.7 Total number of years of vibration exposure in the four industries
Statistical comparisons of median values using Mann-U-Whitney test. All p-values are unadjusted for multiple comparisons. Agriculture vs Manufacture of Basic Metals (p=0.368), Agriculture vs construction (p=0.686), Agriculture vs Motor Vehicle Repair (p<0.0001), Manufacture of Basic Metals vs Construction (p=0.269), Manufacture of Basic Metals vs Motor Vehicle Repair (p=0.046), Construction vs Motor Vehicle Repair (p<0.0001).
DISABILITY SCORES IN DIFFERENT TRADES
In the four selected industries there were 9 trades that had more than 5 individuals in them. The median age-adjusted disability scores were compared for these trades (Figure 3.8). The median disability score in the labourers from other construction trades (SOC 9129) was significantly greater than in all the other trades apart from bricklayers and masons (SOC 5312, p=0.081) and carpenters and joiners (SOC 5315, p=0.054). Electricians and electrical fitters (SOC 5241) had significantly lower median disability scores when compared to bricklayers and masons (SOC 5312, p=0.024) and carpenters and joiners (SOC 5315, p=0.036). The only other statistically significant difference was between bricklayers and masons (SOC 5312) and labourers in building and woodworking trades (SOC 9121, p=0.048).
16
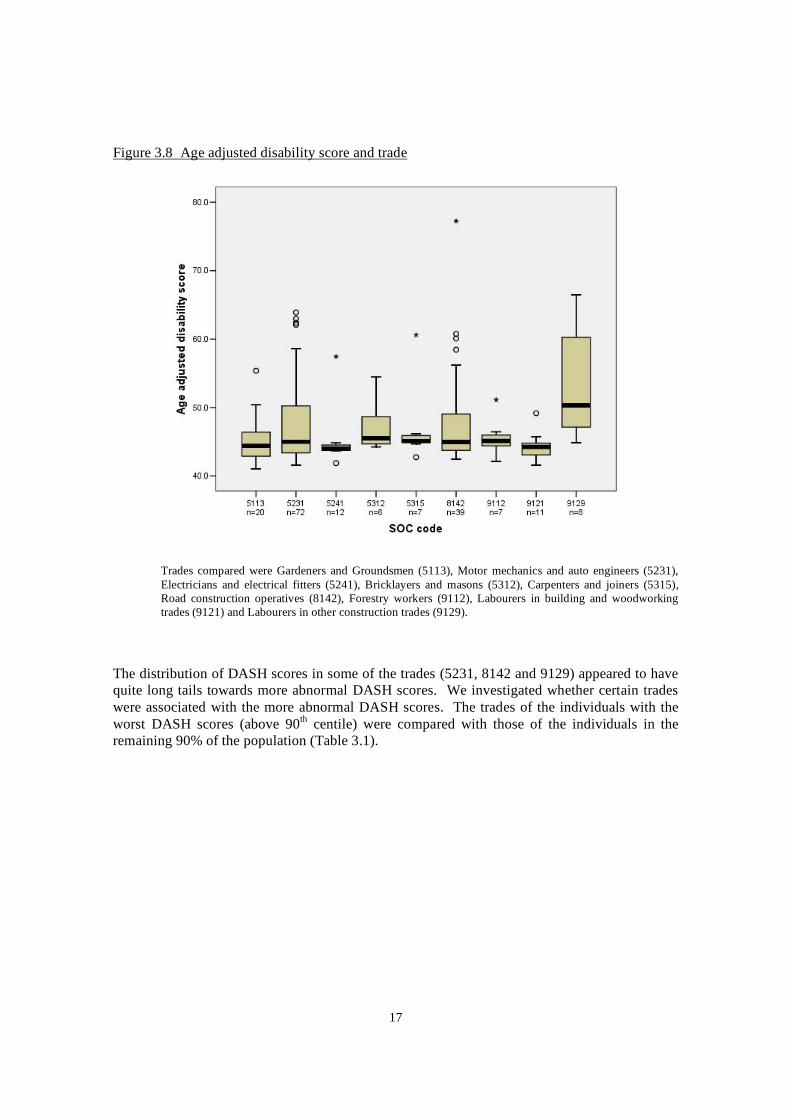
Figure 3.8 Age adjusted disability score and trade
Trades compared were Gardeners and Groundsmen (5113), Motor mechanics and auto engineers (5231), Electricians and electrical fitters (5241), Bricklayers and masons (5312), Carpenters and joiners (5315), Road construction operatives (8142), Forestry workers (9112), Labourers in building and woodworking trades (9121) and Labourers in other construction trades (9129).
The distribution of DASH scores in some of the trades (5231, 8142 and 9129) appeared to have quite long tails towards more abnormal DASH scores. We investigated whether certain trades were associated with the more abnormal DASH scores. The trades of the individuals with the worst DASH scores (above 90th centile) were compared with those of the individuals in the remaining 90% of the population (Table 3.1).
17

3.7
90Table 3.1 Proportion (%) of individuals from each trade in those with DASH scores over the
th centile of the population and those below the 90th centile
Trade Below 90th centile
(n=192)
Above 90th centile (cut-off 56.29)
(n=20)
Moulders, core makers, die casters (5212) 1.6 (3) 5.0 (1)
Motor mechanics and auto engineers (5231) 33.9 (65) 35.0 (7)
Electricians and electrical fitters (5241) 5.7 (11) 5.0 (1)
Carpenters and joiners (5315) 3.1 (6) 5.0 (1)
Plastic process operatives (8116) 0 (0) 5.0 (1)
Metal making and treating process operatives (8117) 0.5 (1) 10.0 (2)
Road construction operatives (8142) 18.2 (35) 20.0 (4)
Labourers in other construction trades (9129) 2.6 (5) 15.0 (3)
Values in table represent the % (n).
When the proportions of individuals in each trade were compared in the two groups (above and below 90th centile) there was no significant difference (p=0.061). There was a suggestion that certain trades (8116, 8117 and 9129) were more prevalent in the worst 10% of the population. However, the numbers in some of the groups are very small, making conclusions difficult.
The industries from which the worst 10% of the population came from were also investigated. There was a statistically significant (p=0.025) difference between the proportion of individuals from different industries in the two groups. The main difference was that there was a greater proportion of individuals from the Manufacture of Basic Metals industry in those above the 90th
centile when compared to those below (16.7% compared to 3.2%)
DISABILITY SCORE AND USE OF VIBRATION PRODUCING TOOLS
The relationship between tool use and the disability score was investigated in two ways (i) by comparing the age-adjusted disability score in those that had or had not used a particular tool in their working life and (ii) by investigating the correlation between the age-adjusted disability score and the total lifetime hours of tool use. Both analyses are limited by the fact that they only take into account single tool use, not combinations of tool use. In order to take into account multiple tool use more sophisticated statistical techniques would need to be employed.
When the median age-adjusted disability scores for those that had or had not used a tool were compared there were no statistically significant differences, when adjusted for multiple comparisons (Table 3.2).
18
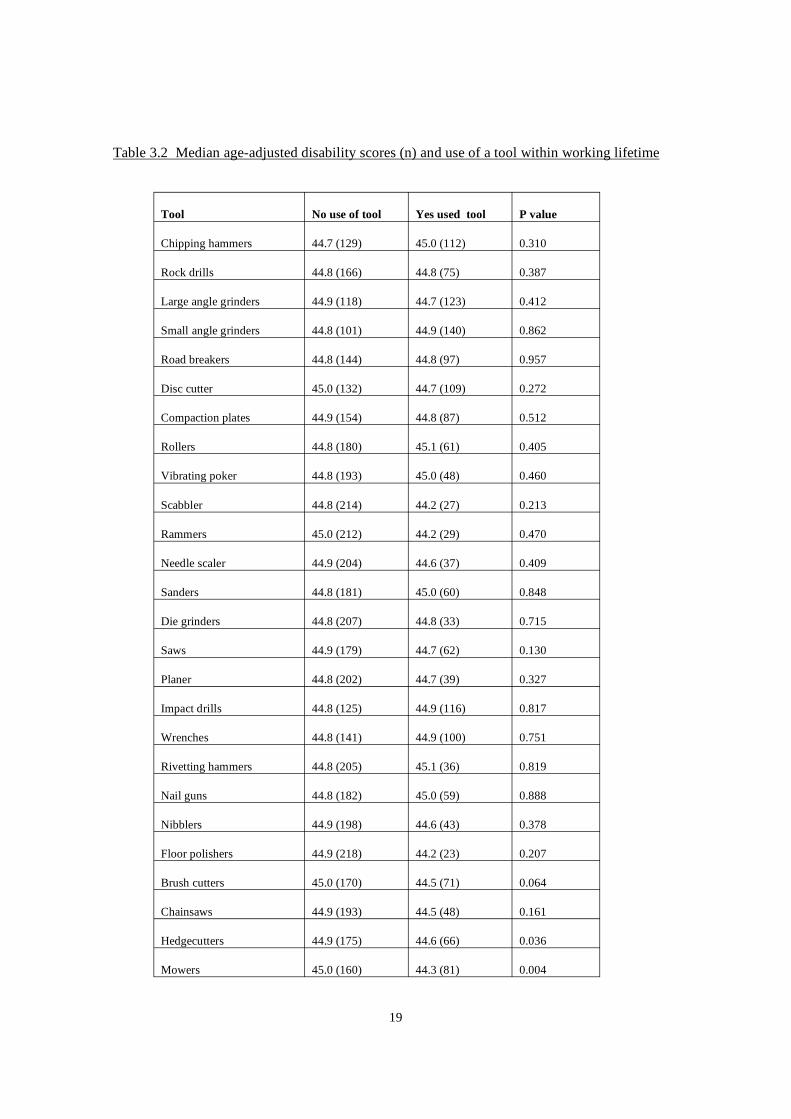
Table 3.2 Median age-adjusted disability scores (n) and use of a tool within working lifetime
Tool No use of tool Yes used tool P value
Chipping hammers 44.7 (129) 45.0 (112) 0.310
Rock drills 44.8 (166) 44.8 (75) 0.387
Large angle grinders 44.9 (118) 44.7 (123) 0.412
Small angle grinders 44.8 (101) 44.9 (140) 0.862
Road breakers 44.8 (144) 44.8 (97) 0.957
Disc cutter 45.0 (132) 44.7 (109) 0.272
Compaction plates 44.9 (154) 44.8 (87) 0.512
Rollers 44.8 (180) 45.1 (61) 0.405
Vibrating poker 44.8 (193) 45.0 (48) 0.460
Scabbler 44.8 (214) 44.2 (27) 0.213
Rammers 45.0 (212) 44.2 (29) 0.470
Needle scaler 44.9 (204) 44.6 (37) 0.409
Sanders 44.8 (181) 45.0 (60) 0.848
Die grinders 44.8 (207) 44.8 (33) 0.715
Saws 44.9 (179) 44.7 (62) 0.130
Planer 44.8 (202) 44.7 (39) 0.327
Impact drills 44.8 (125) 44.9 (116) 0.817
Wrenches 44.8 (141) 44.9 (100) 0.751
Rivetting hammers 44.8 (205) 45.1 (36) 0.819
Nail guns 44.8 (182) 45.0 (59) 0.888
Nibblers 44.9 (198) 44.6 (43) 0.378
Floor polishers 44.9 (218) 44.2 (23) 0.207
Brush cutters 45.0 (170) 44.5 (71) 0.064
Chainsaws 44.9 (193) 44.5 (48) 0.161
Hedgecutters 44.9 (175) 44.6 (66) 0.036
Mowers 45.0 (160) 44.3 (81) 0.004
19

Scarifiers 44.8 (207) 44.7 (34) 0.377
Rotavators 44.9 (209) 44.4 (32) 0.034
Blowers 44.8 (203) 44.6 (38) 0.187
High pressure hoses 44.9 (158) 44.6 (83) 0.214
Pedestal grinders 44.9 (167) 44.8 (74) 0.703
Bench saws 44.9 (212) 44.6 (29) 0.168
Linishers 44.8 (221) 44.4 (20) 0.132
Floor nibblers 44.9 (229) 43.6 (12) 0.023
p-value needed for statistical significance at 5% level was 0.001, as this was adjusted for the number of multiple comparisons.
In addition to simply investigating whether a tool had been used or not we also investigated whether there was a correlation between the total lifetime hours of tool use and disability score (Table 3.3). There were no statistically significant correlations when adjusted for multiple comparisons.
Table 3.3 Correlation between the age-adjusted disability score and the total lifetime hours of tool use
Tool Pearson correlation P-value
Chipping hammers 0.084 0.200
Rock drills -0.068 0.299
Large angle grinders 0.029 0.661
Small angle grinders 0.062 0.344
Road breakers 0.066 0.317
Disc cutter 0.018 0.779
Compaction plates -0.035 0.591
Rollers 0.076 0.244
Vibrating poker -0.052 0.423
Scabbler -0.146 0.025
Rammers 0.021 0.751
Needle scaler -0.090 0.163
20
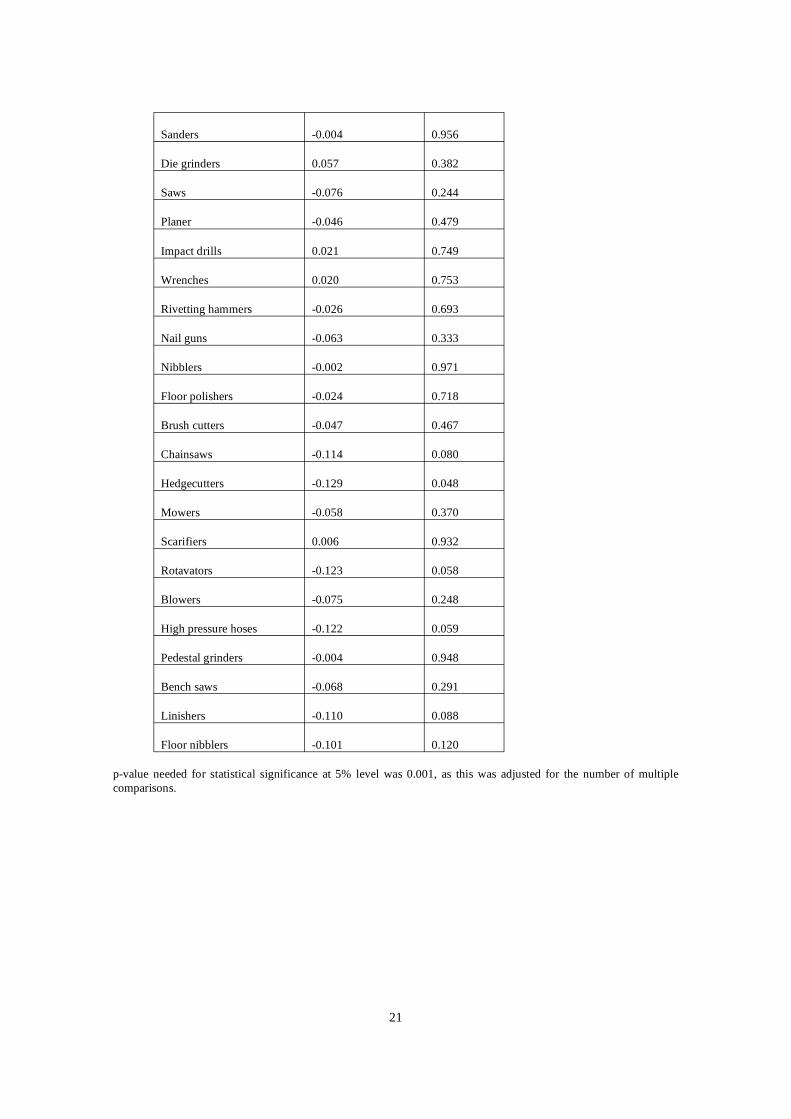
Sanders -0.004 0.956
Die grinders 0.057 0.382
Saws -0.076 0.244
Planer -0.046 0.479
Impact drills 0.021 0.749
Wrenches 0.020 0.753
Rivetting hammers -0.026 0.693
Nail guns -0.063 0.333
Nibblers -0.002 0.971
Floor polishers -0.024 0.718
Brush cutters -0.047 0.467
Chainsaws -0.114 0.080
Hedgecutters -0.129 0.048
Mowers -0.058 0.370
Scarifiers 0.006 0.932
Rotavators -0.123 0.058
Blowers -0.075 0.248
High pressure hoses -0.122 0.059
Pedestal grinders -0.004 0.948
Bench saws -0.068 0.291
Linishers -0.110 0.088
Floor nibblers -0.101 0.120
p-value needed for statistical significance at 5% level was 0.001, as this was adjusted for the number of multiple comparisons.
21
3.8 DISABILITY SCORE AND HEALTH PROBLEMS OR SYMPTOMS
3.8.1 Self-reported health problems and symptoms
Overall, 7.4% (n=18) of the group reported that they had been diagnosed with VWF or HAVS (question 10 on questionnaire) and a further 19.3% (n=47) of the group reported that they did have another health problem that they thought was important (question 53 on questionnaire). These other self-reported health problems were categorised as upper limb, back/lower limb or other (Table 3.4). In general, 12.7% reported some upper limb problem (i.e. upper limb or HAVS) and 11.1% reported a back/lower limb problem.
We also investigated the prevalence of self-reported symptoms in the population. Around a third of the group (32.2%) reported that they had pain or problems with their hands/wrists (question 52), and this seemed to be related to the industry the individuals worked in (p=0.001). In fact, whilst the gardening, manufacture of basic metals and motor vehicle repair industries seem to have a similar proportion of individuals reporting symptoms (42.2-45.5%), the construction industry demonstrated a much lower percentage with pain or problems (18.9%). This pattern was also seen for reported pain in the neck, shoulder and arms (questions 49, 50 and 51).
Around a quarter of the group (24.1%) reported that they woke at night with pain, tingling/numbness in the hands (question 18) and this was greatest in the Motor Vehicle Repair industry (33.3%) and lowest in the construction industry (16.2%) (p=0.048). The proportion of individuals reporting that their fingers went white in the cold was 20.2% and this was highest in the gardening industry (31.4%), although not statistically significant (p=0.409). There was a significant effect of industry on the proportion of individuals reporting tingling after using tools (p=0.038), with the greatest proportion being in the manufacture of basic metals industry (27.3%) and the lowest in the construction industry (12.5%).
22
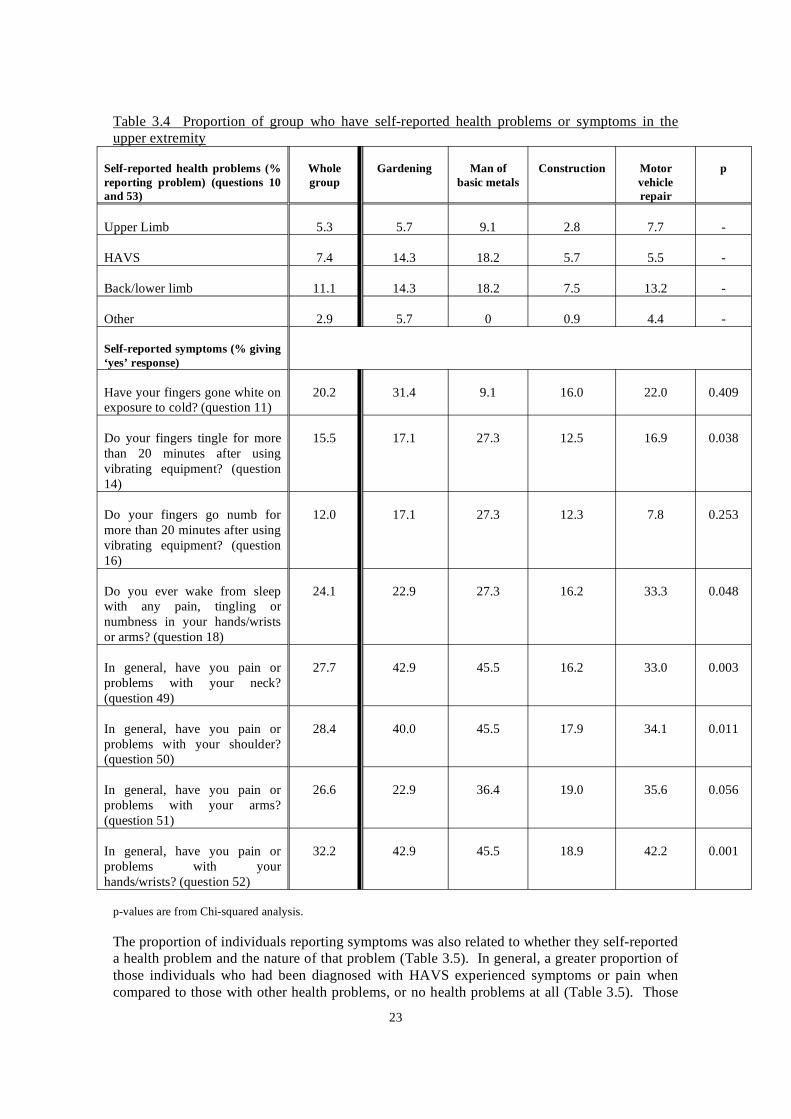
Table 3.4 Proportion of group who have self-reported health problems or symptoms in the upper extremity
Self-reported health problems (% reporting problem) (questions 10 and 53)
Whole group
Gardening Man of basic metals
Construction Motor vehicle repair
p
Upper Limb 5.3 5.7 9.1 2.8 7.7 -
HAVS 7.4 14.3 18.2 5.7 5.5 -
Back/lower limb 11.1 14.3 18.2 7.5 13.2 -
Other 2.9 5.7 0 0.9 4.4 -
Self-reported symptoms (% giving ‘yes’ response)
Have your fingers gone white on exposure to cold? (question 11)
20.2 31.4 9.1 16.0 22.0 0.409
Do your fingers tingle for more than 20 minutes after using vibrating equipment? (question 14)
15.5 17.1 27.3 12.5 16.9 0.038
Do your fingers go numb for more than 20 minutes after using vibrating equipment? (question 16)
12.0 17.1 27.3 12.3 7.8 0.253
Do you ever wake from sleep with any pain, tingling or numbness in your hands/wrists or arms? (question 18)
24.1 22.9 27.3 16.2 33.3 0.048
In general, have you pain or problems with your neck? (question 49)
27.7 42.9 45.5 16.2 33.0 0.003
In general, have you pain or problems with your shoulder? (question 50)
28.4 40.0 45.5 17.9 34.1 0.011
In general, have you pain or problems with your arms? (question 51)
26.6 22.9 36.4 19.0 35.6 0.056
In general, have you pain or problems with your hands/wrists? (question 52)
32.2 42.9 45.5 18.9 42.2 0.001
p-values are from Chi-squared analysis.
The proportion of individuals reporting symptoms was also related to whether they self-reported a health problem and the nature of that problem (Table 3.5). In general, a greater proportion of those individuals who had been diagnosed with HAVS experienced symptoms or pain when compared to those with other health problems, or no health problems at all (Table 3.5). Those
23
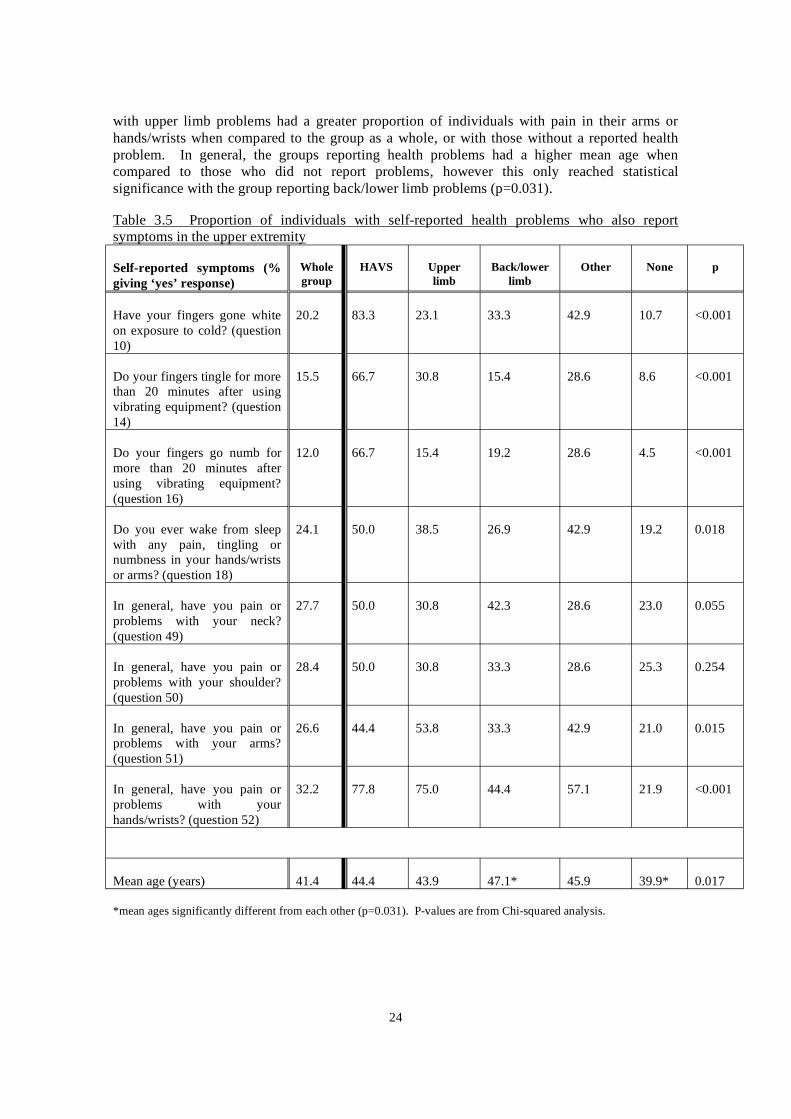
with upper limb problems had a greater proportion of individuals with pain in their arms or hands/wrists when compared to the group as a whole, or with those without a reported health problem. In general, the groups reporting health problems had a higher mean age when compared to those who did not report problems, however this only reached statistical significance with the group reporting back/lower limb problems (p=0.031).
Table 3.5 Proportion of individuals with self-reported health problems who also report symptoms in the upper extremity
Self-reported symptoms (% giving ‘yes’ response)
Whole group
HAVS Upper limb
Back/lower limb
Other None p
Have your fingers gone white on exposure to cold? (question 10)
20.2 83.3 23.1 33.3 42.9 10.7 <0.001
Do your fingers tingle for more than 20 minutes after using vibrating equipment? (question 14)
15.5 66.7 30.8 15.4 28.6 8.6 <0.001
Do your fingers go numb for more than 20 minutes after using vibrating equipment? (question 16)
12.0 66.7 15.4 19.2 28.6 4.5 <0.001
Do you ever wake from sleep with any pain, tingling or numbness in your hands/wrists or arms? (question 18)
24.1 50.0 38.5 26.9 42.9 19.2 0.018
In general, have you pain or problems with your neck? (question 49)
27.7 50.0 30.8 42.3 28.6 23.0 0.055
In general, have you pain or problems with your shoulder? (question 50)
28.4 50.0 30.8 33.3 28.6 25.3 0.254
In general, have you pain or problems with your arms? (question 51)
26.6 44.4 53.8 33.3 42.9 21.0 0.015
In general, have you pain or problems with your hands/wrists? (question 52)
32.2 77.8 75.0 44.4 57.1 21.9 <0.001
Mean age (years) 41.4 44.4 43.9 47.1* 45.9 39.9* 0.017
*mean ages significantly different from each other (p=0.031). P-values are from Chi-squared analysis.
24
3.8.2 Relationship between self-reported health problems or symptoms and disability score
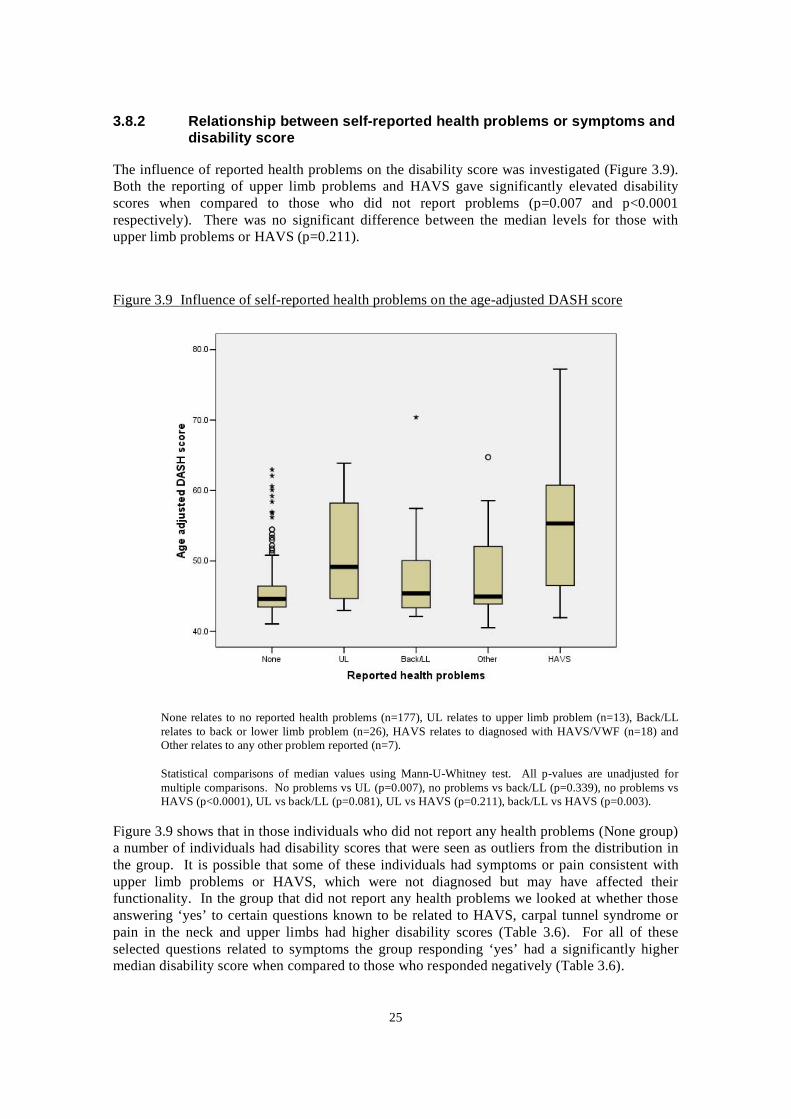
The influence of reported health problems on the disability score was investigated (Figure 3.9). Both the reporting of upper limb problems and HAVS gave significantly elevated disability scores when compared to those who did not report problems (p=0.007 and p<0.0001 respectively). There was no significant difference between the median levels for those with upper limb problems or HAVS (p=0.211).
Figure 3.9 Influence of self-reported health problems on the age-adjusted DASH score
None relates to no reported health problems (n=177), UL relates to upper limb problem (n=13), Back/LL relates to back or lower limb problem (n=26), HAVS relates to diagnosed with HAVS/VWF (n=18) and Other relates to any other problem reported (n=7).
Statistical comparisons of median values using Mann-U-Whitney test. All p-values are unadjusted for multiple comparisons. No problems vs UL (p=0.007), no problems vs back/LL (p=0.339), no problems vs HAVS (p<0.0001), UL vs back/LL (p=0.081), UL vs HAVS (p=0.211), back/LL vs HAVS (p=0.003).
Figure 3.9 shows that in those individuals who did not report any health problems (None group) a number of individuals had disability scores that were seen as outliers from the distribution in the group. It is possible that some of these individuals had symptoms or pain consistent with upper limb problems or HAVS, which were not diagnosed but may have affected their functionality. In the group that did not report any health problems we looked at whether those answering ‘yes’ to certain questions known to be related to HAVS, carpal tunnel syndrome or pain in the neck and upper limbs had higher disability scores (Table 3.6). For all of these selected questions related to symptoms the group responding ‘yes’ had a significantly higher median disability score when compared to those who responded negatively (Table 3.6).
25
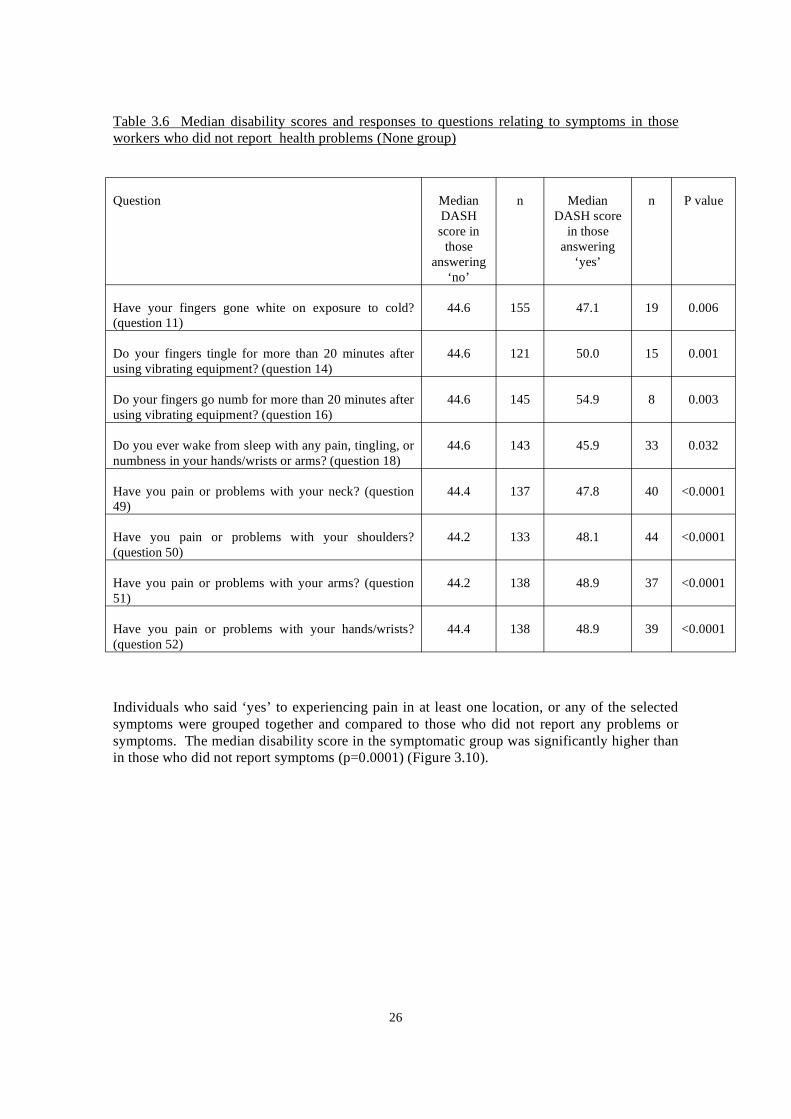
Table 3.6 Median disability scores and responses to questions relating to symptoms in those workers who did not report health problems (None group)
Question Median DASH score in
those answering
‘no’
n Median DASH score
in those answering
‘yes’
n P value
Have your fingers gone white on exposure to cold? (question 11)
44.6 155 47.1 19 0.006
Do your fingers tingle for more than 20 minutes after using vibrating equipment? (question 14)
44.6 121 50.0 15 0.001
Do your fingers go numb for more than 20 minutes after using vibrating equipment? (question 16)
44.6 145 54.9 8 0.003
Do you ever wake from sleep with any pain, tingling, or numbness in your hands/wrists or arms? (question 18)
44.6 143 45.9 33 0.032
Have you pain or problems with your neck? (question 49)
44.4 137 47.8 40 <0.0001
Have you pain or problems with your shoulders? (question 50)
44.2 133 48.1 44 <0.0001
Have you pain or problems with your arms? (question 51)
44.2 138 48.9 37 <0.0001
Have you pain or problems with your hands/wrists? (question 52)
44.4 138 48.9 39 <0.0001
Individuals who said ‘yes’ to experiencing pain in at least one location, or any of the selected symptoms were grouped together and compared to those who did not report any problems or symptoms. The median disability score in the symptomatic group was significantly higher than in those who did not report symptoms (p=0.0001) (Figure 3.10).
26
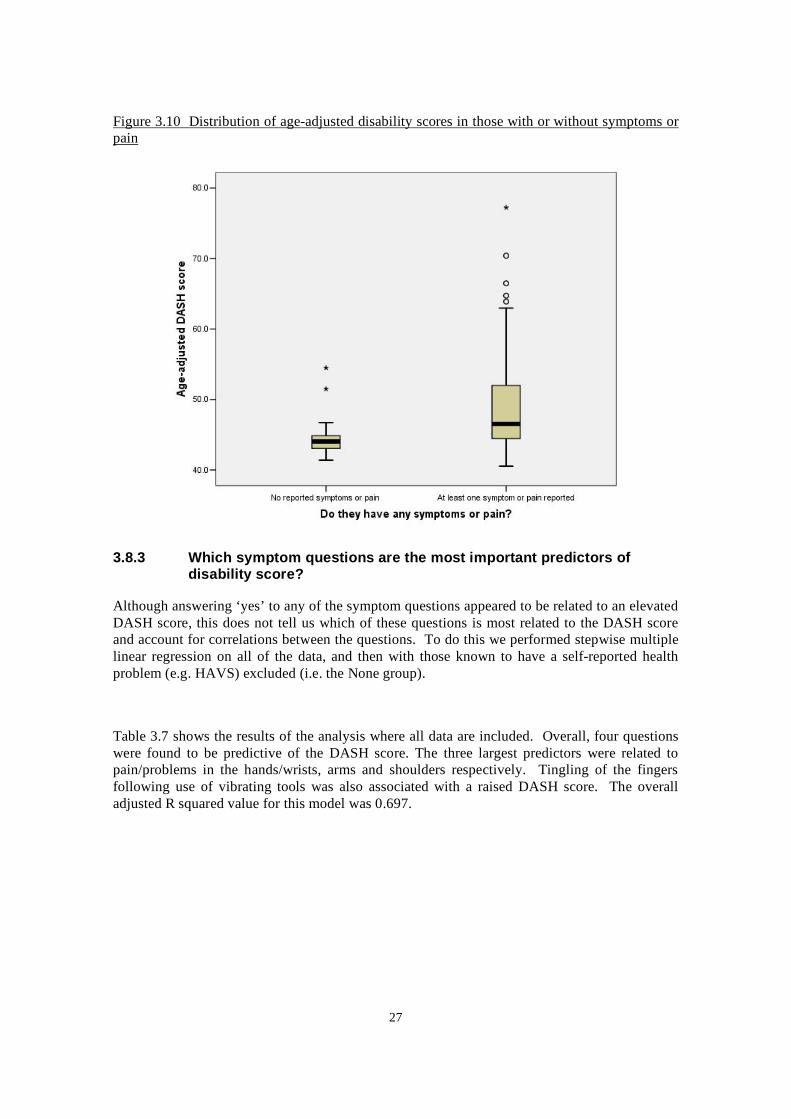
Figure 3.10 Distribution of age-adjusted disability scores in those with or without symptoms or pain
3.8.3 Which symptom questions are the most important predictors of disability score?
Although answering ‘yes’ to any of the symptom questions appeared to be related to an elevated DASH score, this does not tell us which of these questions is most related to the DASH score and account for correlations between the questions. To do this we performed stepwise multiple linear regression on all of the data, and then with those known to have a self-reported health problem (e.g. HAVS) excluded (i.e. the None group).
Table 3.7 shows the results of the analysis where all data are included. Overall, four questions were found to be predictive of the DASH score. The three largest predictors were related to pain/problems in the hands/wrists, arms and shoulders respectively. Tingling of the fingers following use of vibrating tools was also associated with a raised DASH score. The overall adjusted R squared value for this model was 0.697.
27
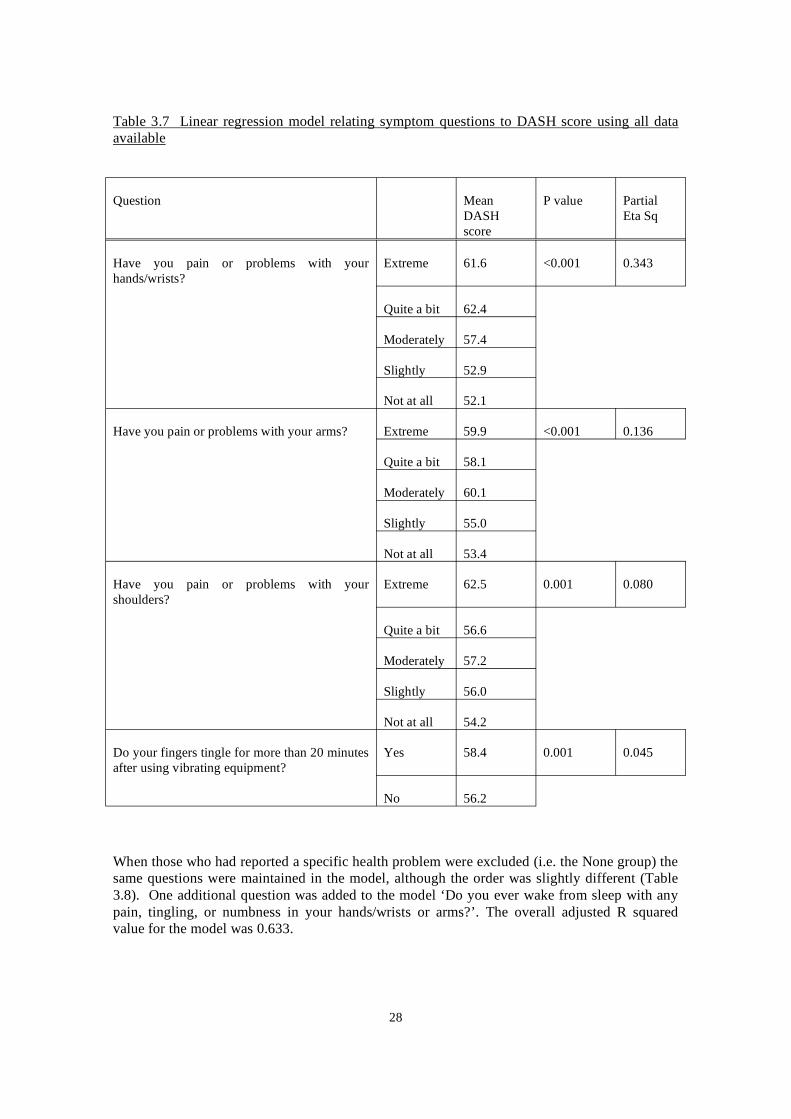
Table 3.7 Linear regression model relating symptom questions to DASH score using all data available
Question Mean DASH score
P value Partial Eta Sq
Have you pain or problems with your hands/wrists?
Extreme
Quite a bit
61.6 <0.001 0.343
62.4
Moderately
Slightly
Not at all
57.4
52.9
52.1
Have you pain or problems with your arms? Extreme
Quite a bit
59.9 <0.001 0.136
58.1
Moderately
Slightly
Not at all
60.1
55.0
53.4
Have you pain or problems with your shoulders?
Extreme 62.5 0.001 0.080
Quite a bit 56.6
Moderately
Slightly
Not at all
57.2
56.0
54.2
Do your fingers tingle for more than 20 minutes after using vibrating equipment?
Yes
No
58.4 0.001 0.045
56.2
When those who had reported a specific health problem were excluded (i.e. the None group) the same questions were maintained in the model, although the order was slightly different (Table 3.8). One additional question was added to the model ‘Do you ever wake from sleep with any pain, tingling, or numbness in your hands/wrists or arms?’. The overall adjusted R squared value for the model was 0.633.
28
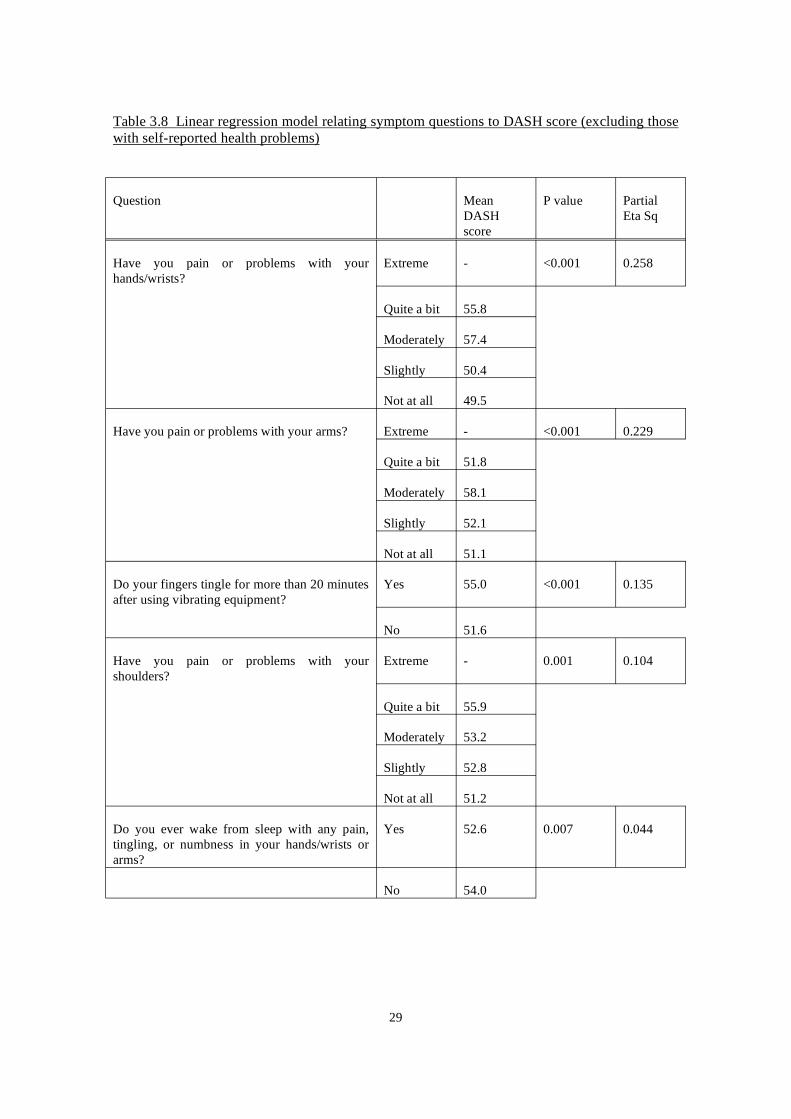
Table 3.8 Linear regression model relating symptom questions to DASH score (excluding those with self-reported health problems)
Question Mean DASH score
P value Partial Eta Sq
Have you pain or problems with your hands/wrists?
Extreme
Quite a bit
Moderately
Slightly
Not at all
- <0.001 0.258
55.8
57.4
50.4
49.5
Have you pain or problems with your arms? Extreme
Quite a bit
Moderately
Slightly
Not at all
- <0.001 0.229
51.8
58.1
52.1
51.1
Do your fingers tingle for more than 20 minutes after using vibrating equipment?
Yes
No
55.0 <0.001 0.135
51.6
Have you pain or problems with your shoulders?
Extreme - 0.001 0.104
Quite a bit
Moderately
Slightly
Not at all
55.9
53.2
52.8
51.2
Do you ever wake from sleep with any pain, tingling, or numbness in your hands/wrists or arms?
Yes
No
52.6 0.007 0.044
54.0
29
4 DISCUSSION AND CONCLUSION
This study has collected information regarding self-reported disability and symptoms in working cohorts exposed to hand-arm vibration and known to be associated with a high risk of HAVS. The information was collected, in part, using the DASH questionnaire with a single quantitative outcome score. This internationally used questionnaire is generic for both functional problems and symptoms in the upper limbs [3, 19], and should reflect such problems whether caused by hand-transmitted vibration (HAVS) or upper limb musculo-skeletal disorders associated with industries where vibrating tools are used. This score can be used comparatively across populations or prospectively within populations to look at the effects of various interventions. It also has general population normative data available for comparison. We have already shown in HAVS referral subjects that the DASH score is associated with the Stockholm workshop scale, particularly the neurosensory score [14]. However, it has not been applied in a workplace setting with hand transmitted vibration exposure. In this workplace study, where vibration-induced damage (HAVS), and both upper limb and other musculoskeletal problems may occur, we investigated both of these influences on the DASH outcome score.
We aimed to obtain a population of individuals currently working with vibrating tools, and consequently used intermediaries (health and safety managers, occupational health professionals, union representatives) to distribute questionnaires within the target companies and industries. Volunteers were not given any form of inducement for completing the questionnaire. This method of recruitment led to a low response rate (14%) and we were not able to obtain any information on the individuals who did not respond. Therefore, we are not able to say whether the individuals who did not respond were more likely to have problems leading to a ‘healthy-worker’ effect. This low response rate is a significant limitation of this study and means that the results should be used with caution, especially in making inferences regarding the working population as a whole. It is also important to realise that we focussed on four specific industries: Gardening, Manufacture of Basic Metals, Construction and Motor Vehicle Repair in this study. The industries selected for involvement in this study were determined following discussions with key parties in HSE. The Manufacture of Basic Metals industry was chosen because it is well established that this industry has a high prevalence of HAVS and consequently given our previous work on the relationship between HAVS and disability [14, 15], would be likely to have significant disability. The Gardening industry was chosen because this industry appears to experience significant levels of HAVS according to our own data from the HSL referral centre (unpublished). The Motor Vehicle Repair industry was chosen because there had been reports of HAVS following short daily exposure to hand-arm vibration in car mechanics [20, 21]. However, we feel that even with these accepted limitations and potential biases this study has revealed some interesting findings that have not been reported elsewhere.
Overall there was a large range of disability scores within the study population, with a limited number showing relatively large (extreme) values, which would be seen as outliers from their distribution. As would be expected, age was an important determinant of the DASH score, with older individuals having greater disability. Therefore, to take age into account in any analyses we adjusted all of our DASH scores to that we would expect of a 45 year-old man [16]. When the median DASH scores were compared across the four selected industries we did not find any significant differences between them, even though the duration of vibration exposure (in terms of total lifetime hours of tool use and total number of years of exposure) appeared to be significantly greater in the Motor Vehicle Repair industry. Overall, there was some relationship between the DASH score and extent of duration of vibration exposure, particularly the total years of exposure, but this was weak. There was no evidence that the use of any particular hand-held vibrating tool was associated with elevated disability scores. However, this lack of
30

association between the DASH score and duration of vibration exposure in the study population maybe explained by (i) only 7.4% of the study population reported being diagnosed with HAVS and (ii) we were unable to take account of multiple tool use in the statistical analysis. This apparent lack of relationship between disability and vibration exposure may not be the case if a study population with a greater prevalence of HAVS were studied.
There was some evidence of some differences in median DASH scores between trades, with labourers in other construction trades (SOC 9129) having the greatest value, but full comparison between trades is restricted because of small numbers in some trades. In addition, to looking at the central tendency we also investigated if any particular trades or industries had a tendency to more extreme values and more disability. To do this we looked at the individuals in the worst 10% of the study population to see if they came from particular industries or trades. When we compared the trades the numbers in each group were a little too small to draw any conclusions from, but as may be expected there was a greater proportion from the Manufacture of Basic Metals Industry.
The DASH questionnaire is an instrument that assesses disability in the whole of the upper limb and therefore its output may be affected by a whole range of upper limb problems (e.g. HAVS, Carpal Tunnel Syndrome, arthritis, Dupuytrens contracture etc.). Upper limb problems have been noted in populations using vibrating tools, but there has been little investigation of the influence of such co-morbidities on the disability in those with HAVS. We wished to investigate whether the range of DASH values measured within this study population was related to any pre-existing health problem the individuals were experiencing. These pre-existing self-reported health problems were divided into upper limb problems (e.g. Carpal Tunnel Syndrome, arthritis in upper limb, tennis elbow etc.), back or lower limb problems, HAVS and other. Overall, in this working population 7.4% reported being diagnosed with HAVS, 5.3% had an upper limb problem, 11.1% had a back or lower limb problem and 2.9% had some other problem not affecting the upper limbs. The outcome on the DASH questionnaire was responsive to both upper limb disorders and HAVS, with both of these reported health problems having median DASH values significantly different to those who did not report any health problems. These data support the fact that the DASH questionnaire is specifically responsive to disorders of the upper limbs and supports its usefulness in these disorders.
When we looked at the distribution of DASH values in individuals who did not report any health problems it was variable, with a number of individuals having outlying values from the distribution. It was reasoned that perhaps these outlying values were related to some other symptom in the upper limb leading to increased disability, which was pre-diagnostic. We found that a large proportion of individuals within the study population reported experiencing symptoms of pain in some component of the upper limbs (27.7% neck, 28.4% shoulder, 26.6% arms and 32.2% hands/wrists) and that these proportions were still high even in those not reporting any health problems (23.0%, 25.3%, 21.0% and 21.9% respectively). These proportions are similar to those reported in a general population study where Palmer et al found that in those exposed to hand-arm vibration 22.7% reported pain in the neck, 26.3% had pain in the shoulders and 21.9% had pain in the hands/wrists [22]. Therefore, both the present study and that of Palmer et al show that significant levels of upper limb musculo-skeletal disorders are present in workers using vibrating tools. In addition, the study of Palmer et al also reported significant proportions that reported these symptoms and were not exposed to vibration (16%, 16.7% and 9.7% respectively).
The prevalence of blanching in cold conditions in the group as a whole was 20.2%, and reduced to 10.7% when those with self-reported health problems were excluded. Interestingly, only 7.4% of the group had been diagnosed as having HAVS and this is not surprising considering it
31
has been reported that around one fifth of individuals with blanching in the general population consult a doctor about these symptoms [23]. The proportions of individuals experiencing these symptoms in the current study are a little higher than those reported from the MRC general population study where 5.5% of men who were exposed to vibration at work reported blanching, compared to 2.4% who were not exposed to vibration [24]. We have also found that the overall proportion of individuals reporting waking from sleep with pain in hands/wrists in the present study (24.1%) is higher than that reported in the MRC general population study (9.3% in those vibration exposed) [25]. The reason why the proportions reporting blanching or waking from sleep are greater in the current study are unclear but may be related to differences in terminology of the questions, or perhaps related to the fact that we focussed on particular industries that we thought were likely to have health problems related to vibration exposure. It should also be borne in mind that health surveillance is now a legal requirement for vibration-exposed workers [26] and this was not the case when the MRC general population study was conducted. It is possible that the differences in reported symptoms between our study population and the MRC general population may be a consequence of raised awareness through health surveillance, particularly in high risk industries.
Experiencing any of the symptoms related to pain, tingling/numbness or blanching (even if they did not have a self-reported health problem) was associated with an increased disability score. However, when we investigated which of the questions had the greatest impact the questions related to blanching or numbness did not seem to be important. The questions related to pain or problems in specific areas of the upper limb had the most impact on the DASH score. The most important predictor in all of the study population was pain/problems in the hands/wrists followed by pain/problems with the arms, pain/problems with the shoulders and tingling after using vibrating tools. If individuals with self-reported health problems were excluded one additional question appeared in the model (Do you ever wake from sleep with any pain, tingling or numbness in your hands/wrists or arms?), however this appeared to be associated with a reduction in DASH score and is likely to be a statistical anomaly. These questions related to pain may be a useful adjunct to normal HAVS screening questions to help identify workers with upper limb disorders, where a full DASH questionnaire is not going to be used.
The findings related to symptoms are interesting and would suggest that the DASH questionnaire is responsive to problems in the upper limbs, even in individuals who do not report having any health problems. It is possible that individuals have failed to report problems that might explain these symptoms, or it maybe that these symptoms represent changes in the upper limbs that have not yet been troublesome enough for individuals to report to health professionals and seek diagnosis. It is conceivable that the DASH questionnaire is a sensitive method of detecting changes in the upper limb that may eventually be diagnosed as an upper limb problem.
In conclusion, this study has shown that when the DASH questionnaire is applied to a population working with hand-held vibrating tools that useful information regarding disability in the upper limbs can be obtained. In the study population the disability outcome measure is related to reported health problems in the upper limbs and self-reported symptoms, particularly pain. This study suggests that the DASH questionnaire may be a useful tool for integrating, on a quantitative basis, the health problems caused by HAVS and upper limb co-morbidities that are found in significant levels in workforces using vibrating tools.
32

5 REFERENCES
1. Hudak, P., P. Amadio, and C. Bombardier, Development of an Upper Extremity Outcome Measure: The DASH (Disabilities of the Arm, Shoulder and Hand). American Journal Industrial Medicine, 1996. 26: p. 602-608.
2. De Smet, L., et al., Responsiveness of the Dutch version of the DASH as an outcome measure for carpal tunnel syndrome. J Hand Surg [Br], 2007. 32(1): p. 74-6.
3. Jester, A., A. Harth, and G. Germann, Measuring levels of Upper-Extremity Disability in Employed Adults Using the DASH Questionnaire. Journal of Hand Surgery, 2005. 30A: p. 1074.e1-1074.e10.
4. Durand, M.J., et al., The cross-cultural adaptation of the DASH questionnaire in Canadian French. J Hand Ther, 2005. 18(1): p. 34-9.
5. Imaeda, T., et al., Validation of the Japanese Society for Surgery of the Hand version of the Disability of the Arm, Shoulder, and Hand questionnaire. J Orthop Sci, 2005. 10(4): p. 353-9.
6. Lee, E.W., et al., Construct validity of the Chinese version of the disabilities of the arm, shoulder and hand questionnaire (DASH-HKPWH). J Hand Surg [Br], 2005. 30(1): p. 29-34.
7. Hunsaker, F., The American Academy of Orthopaedic Surgeons Outcomes Instruments. Normative values from the general population. Journal of Bone and Joint Surgery,, 2002. 84-A(2): p. 208-215.
8. Changulani, M., et al., Outcome evaluation measures for wrist and hand - which one to choose? Int Orthop, 2007.
9. Uchiyama, S., et al., Comparison of responsiveness of the Japanese Society for Surgery of the Hand version of the carpal tunnel syndrome instrument to surgical treatment with DASH, SF-36, and physical findings. J Orthop Sci, 2007. 12(3): p. 249-53.
10. Lam, L.K. and G.L. Cheing, Effects of 904-nm Low-Level Laser Therapy in the Management of Lateral Epicondylitis: A Randomized Controlled Trial. Photomed Laser Surg, 2007. 25(2): p. 65-71.
11. Zyluk, A. and W. Jagielski, The effect of the severity of the dupuytren's contracture on the function of the hand before and after surgery. J Hand Surg [Br], 2007.
12. Aberg, M., et al., Considerations in evaluating new treatment alternatives following peripheral nerve injuries: a prospective clinical study of methods used to investigate sensory, motor and functional recovery. J Plast Reconstr Aesthet Surg, 2007. 60(2): p. 103-13.
13. MacDermid, J.C., et al., Validity of self-report measures of pain and disability for persons who have undergone arthroplasty for osteoarthritis of the carpometacarpal joint of the hand. Osteoarthritis Cartilage, 2007. 15(5): p. 524-30.
14. Poole, K. and H. Mason, Disability in the upper extremity and quality of life in hand-arm vibration syndrome. Disability and Rehabilitation, 2005. 27(22): p. 1373-1380.
33
15. Mason, H., K. Poole, and J. Elms, Upper limb disability in HAVS cases-how does it relate to the neurosensory or vascular element of HAVS. Occupational Medicine, 2005. 55: p. 389-392.
16. Poole, K. and H. Mason, Relationship between self-reported upper limb disability and quantitative tests in hand-arm vibration syndrome. Disabil Rehabil, 2007. 29(5): p. 359-66.
17. Statistics, O.o.N., UK Standard Industrial Classification of Economic Activities. 2003, London: The Stationery Office.
18. Statistics, O.f.N., Standard Occupational Classification. 2000, London: The Stationery Office.
19. Jester, A., et al., Disabilities of the arm, shoulder and hand (DASH) questionnaire: Determining functional activity profiles in patients with upper extremity disorders. Journal of Hand Surgery, 2005. 30B(1): p. 23-28.
20. Barregard, L., L. Ehrenstrom, and K. Marcus, Hand-arm vibration syndrome in Swedish car mechanics. Occup Environ Med, 2003. 60(4): p. 287-94.
21. Barregard, L., Short daily exposure to hand-arm vibrations in Swedish car mechanics. Appl Occup Environ Hyg, 2003. 18(1): p. 35-40.
22. Palmer, K., et al., Exposure to hand-transmitted vibration and pain in the neck and upper limbs. Occupational Medicine, 2001. 51(7): p. 464-467.
23. Palmer, K. and M. Griffin, Prevalence of Reynaud's Phenomenon in Great Britain and Its Relation to Hand Transmitted Vibration : A National Postal Survey. Occupational and Environmental Medicine., 2000. 57(7): p. 448-452.
24. Palmer, K., et al., Hand-transmitted vibration: Occupational exposures and their health effects in Great Britain. Report 232/1999, in HSE Books. 1999: Suffolk. p. 1-155.
25. Palmer, K., M. Griffin, and H. Bendall, The prevalence of sensorineural symptoms attributable to hand transmitted vibration in Great Britain: a national postal survey. American Journal Industrial Medicine, 2000. 38: p. 99-107.
26. Health and Safety Executive, Guidance on regulations: Hand -arm vibration. The control of vibration at work regulations. L140. L140. 2005, Sudbury, Suffolk: HSE Books. 1-144.
34
6.1
6 APPENDICES
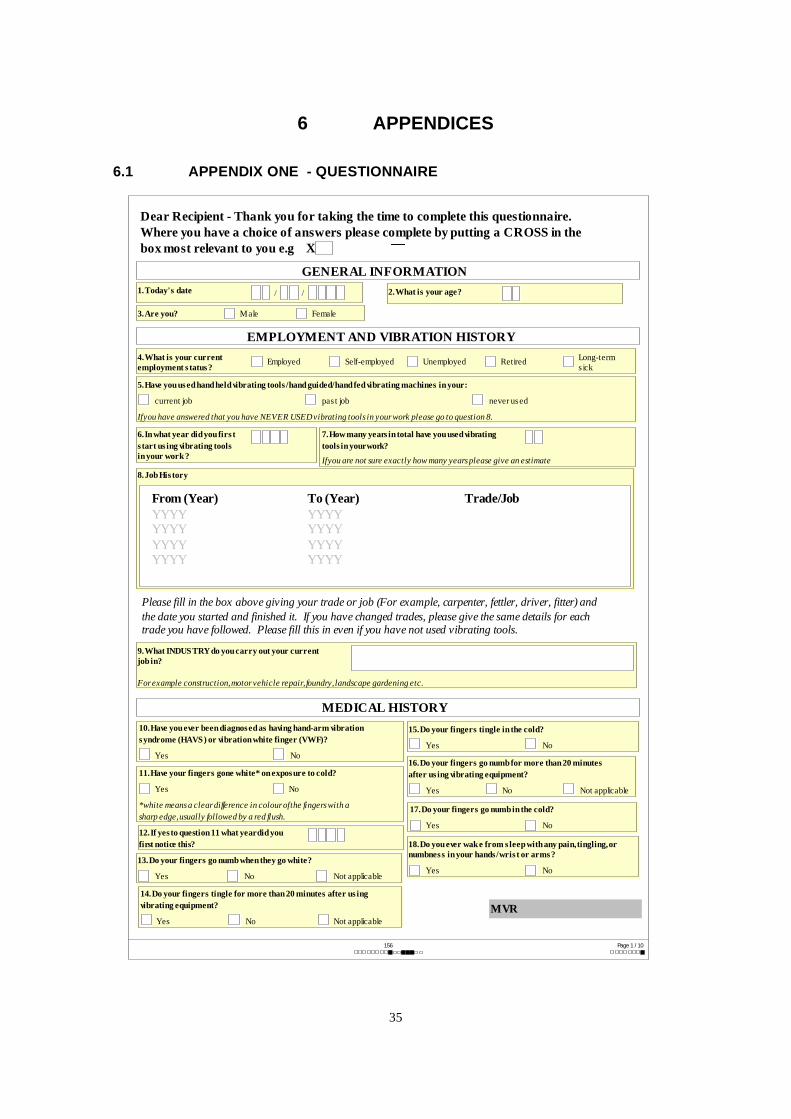
APPENDIX ONE - QUESTIONNAIRE
/
/ /
job job
)
/
X
j ) and
/ /
156 Page 1 10
3. Are you? M ale Female
EMPLOYMENT AND VIBRATION HISTORY
5. Have you us ed hand held vibrating tools hand guided hand fed vibrating machines in your:
current pas t never us ed
Ifyou have answered that you have NEVER USED vibrating tools in your work please go to question 8.
8. Job His tory
MEDICAL HISTORY 10. Have you ever been diagnos ed as having hand-arm vibration s yndrome (HAVS or vibration white finger (VWF)?
Yes No
11. Have your fingers gone white* on expos ure to cold?
Yes No
*white means a clear difference in colour ofthe fingers with a sharp edge,usually followed by a red flush.
12. If yes to question 11 what yeardid you first notice this?
13. Do your fingers go numb when they go white?
Yes No Not applicable
14. Do your fingers tingle for more than 20 minutes after us ing vibrating equipment?
Yes No Not applicable
15.Do your fingers tingle in the cold?
Yes No
16.Do your fingers go numb for more than 20 minutes after us ing vibrating equipment?
Yes No Not applicable
17.Do your fingers go numb in the cold?
Yes No
18.Do you ever wak e from s leep with any pain,tingling,or numbnes s in your hands wris t or arms ?
Yes No
7.How many years in total have you used vibrating tools in yourwork?
Ifyou are not sure exactly how many years please give an estimate
Dear Recipient - Thank you for taking the time to complete this questionnaire. Where you have a choice of answers please complete by putting a CROSS in the box most relevant to you e.g
Please fill in the box above giving your trade or ob (For example, carpenter, fettler, driver, fitterthe date you started and finished it. If you have changed trades, please give the same details for each trade you have followed. Please fill this in even if you have not used vibrating tools.
GENERAL INFORMATION 1. Today's date 2. What is your age?
4. What is your current employment s tatus ?
Employed Self-employed Unemployed Retired Long-term s ick
6. In what year did you firs t s tart us ing vibrating tools in your work ?
9. What INDUS TRY do you carry out your current job in?
For example construction,motor vehicle repair, foundry,landscape gardening etc.
From (Year) To (Year) Trade/Job YYYY YYYY YYYY YYYY YYYY YYYY YYYY YYYY
MVR
35
156 Page 2 / 10
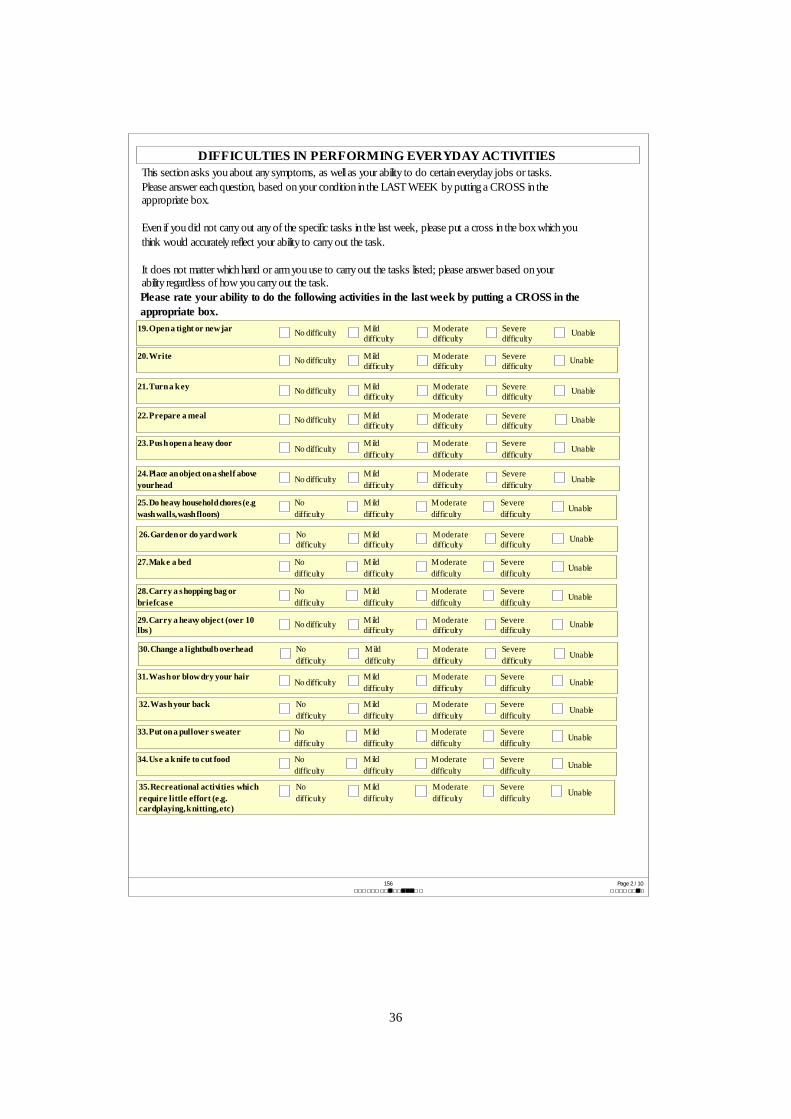
DIFFICULTIES IN PERFORMING EVERYDAY ACTIVITIES
Please rate your ability to do the following activities in the last week by putting a CROSS in the appropriate box.
19. Open a tight or new jar No difficulty M ild difficulty
M oderate difficulty
Severe difficulty
Unable
20. Write No difficulty M ild difficulty
M oderate difficulty
Severe difficulty
Unable
21. Turn a k ey No difficulty M ild difficulty
M oderate difficulty
Severe difficulty
Unable
22. Prepare a meal No difficulty M ild difficulty
M oderate difficulty
Severe difficulty
Unable
23. Pus h open a heavy door No difficulty
M ild difficulty
M oderate difficulty
Severe difficulty
Unable
24. Place an object on a shelf above yourhead No difficulty
M ild difficulty
M oderate difficulty
Severe difficulty
Unable
25. Do heavy household chores (e.g wash walls,wash floors)
No difficulty
M ild difficulty
M oderate difficulty
Severe difficulty
Unable
26. Garden or do yard work No difficulty
M ild difficulty
M oderate difficulty
Severe difficulty
Unable
27. Mak e a bed No difficulty
M ild difficulty
M oderate difficulty
Severe difficulty
Unable
28. Carry a s hopping bag or briefcas e
No difficulty
M ild difficulty
M oderate difficulty
Severe difficulty
Unable
29. Carry a heavy object (over 10 lbs )
No difficulty M ild difficulty
M oderate difficulty
Severe difficulty
Unable
30. Change a lightbulb overhead No difficulty
M ild difficulty
M oderate difficulty
Severe difficulty
Unable
31. Was h or blow dry your hair No difficulty
M ild difficulty
M oderate difficulty
Severe difficulty
Unable
32. Was h your back No difficulty
M ild difficulty
M oderate difficulty
Severe difficulty
Unable
33. Put on a pullover s weater No difficulty
M ild difficulty
M oderate difficulty
Severe difficulty
Unable
34. Us e a k nife to cut food No difficulty
M ild difficulty
M oderate difficulty
Severe difficulty
Unable
35. Recreational activities which require little effort (e.g. cardplaying, k nitting,etc)
No difficulty
M ild difficulty
M oderate difficulty
Severe difficulty
Unable
This section asks you about any symptoms, as well as your ability to do certain everyday jobs or tasks. Please answer each question, based on your condition in the LAST WEEK by putting a CROSS in the appropriate box.
Even if you did not carry out any of the specific tasks in the last week, please put a cross in the box which you think would accurately reflect your ability to carry out the task.
It does not matter which hand or arm you use to carry out the tasks listed; please answer based on your ability regardless of how you carry out the task.
36

/
)
)
)
)
/
156 Page 3 10
36. Recreational activities in which you tak e s ome force or impact through your arm, s houlder or hand (e.g golf, hammering, tennis ,etc
No difficulty
M ild difficulty
M oderate difficulty
Severe difficulty
Unable
37. Recreational activities in which you move your arm freely (e.g. playing fris bee,badminton, etc.
No difficulty M ild difficulty
M oderate difficulty
Severe difficulty
Unable
38. Manage trans portation needs (getting from one place to another
No difficulty M ild difficulty
M oderate difficulty
Severe difficulty
Unable
39. S exual activities No difficulty
M ild difficulty
M oderate difficulty
Severe difficulty
Unable
40. During the pas t week ,to what extent has your arm,s houlder or hand problem interfered with your normal s ocial activities with family,friends , neighbours or groups ?
Not at all Slightly M oderately Quite a bit Extremely
41. During the pas t week ,were you limited in your work or other regular daily activities as a res ult of your arm, s houlder or hand problem?
Not limited at all
Slightly limited
M oderately Limited
Very Limited
Unable
42. Arm,s houlder or hand pain None M ild M oderate Severe Extreme
43. Arm,s houlder or hand pain when you performed any s pecific activity
None M ild M oderate Severe Extreme
44. Tingling (pins and needles in your arm,s houlder or hand
None M ild M oderate Severe Extreme
45. Weak nes s in your arm, s houlder or hand
None M ild M oderate Severe Extreme
46. S tiffnes s in your arm, s houlder or hand
None M ild M oderate Severe Extreme
47. During the pas t week ,how much difficulty have you had s leeping becaus e of the pain in your arm,s houlder or hand?
No difficulty
M ild difficulty
M oderate difficulty
Severe difficulty
So much difficulty that I can't s leep
48. I feel les s capable,les s confident or les s us eful becaus e of my arm,s houlder or hand problem
Strongly dis agree Dis agree
Neither agree nor dis agree
A gree Strongly agree
Please rate the severity of the following symptoms in the last week
49. In general, have you pain or problems with your neck ?
Not at all Slightly M oderately Quite a bit Extreme
50. In general, have you pain or problems with your s houlders ?
Not at all Slightly M oderately Quite a bit Extreme
51. In general, have you pain or problems with your arms ?
Not at all Slightly M oderately Quite a bit Extreme
52. In general, have you pain or problems with your hands wris ts ?
Not at all Slightly M oderately Quite a bit Extreme
53. Do you have any other health problems that you think are important?
37
/
( )
j
j ( ).
(
156 Page 4 10
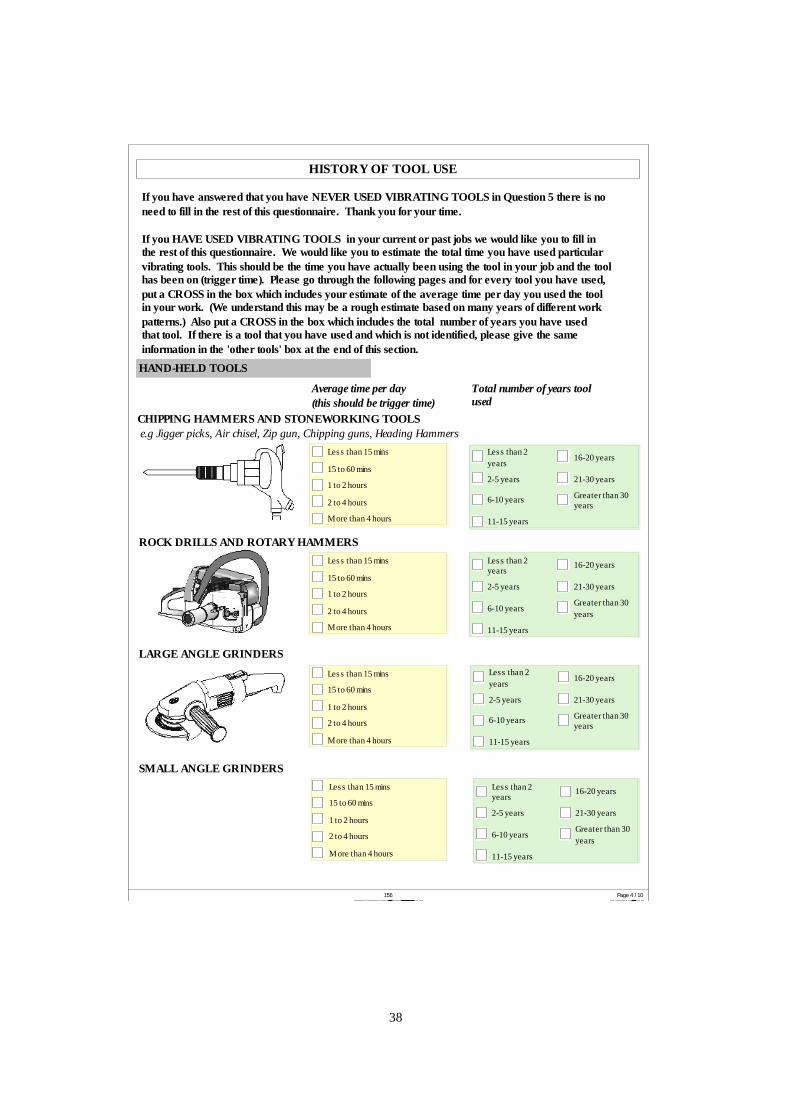
CHIPPING HAMMERS AND STONEWORKING TOOLS
ROCK DRILLS AND ROTARY HAMMERS
HAND-HELD TOOLS
e.g Jigger picks, Air chisel, Zip gun, Chipping guns, Heading Hammers
Average time per day this should be trigger time
Total number of years tool used
Les s than 15 mins
15 to 60 mins
1 to 2 hours
2 to 4 hours
M ore than 4 hours
Les s than 2 years
2-5 years
6-10 years
11-15 years
16-20 years
21-30 years
Greater than 30 years
Les s than 15 mins
15 to 60 mins
1 to 2 hours
2 to 4 hours
M ore than 4 hours
Les s than 2 years
2-5 years
6-10 years
11-15 years
16-20 years
21-30 years
Greater than 30 years
HISTORY OF TOOL USE
If you have answered that you have NEVER USED VIBRATING TOOLS in Question 5 there is no need to fill in the rest of this questionnaire. Thank you for your time.
If you HAVE USED VIBRATING TOOLS in your current or past obs we would like you to fill in the rest of this questionnaire. We would like you to estimate the total time you have used particular vibrating tools. This should be the time you have actually been using the tool in your ob and the tool has been on trigger time Please go through the following pages and for every tool you have used, put a CROSS in the box which includes your estimate of the average time per day you used the tool in your work. We understand this may be a rough estimate based on many years of different work patterns.) Also put a CROSS in the box which includes the total number of years you have used that tool. If there is a tool that you have used and which is not identified, please give the same information in the 'other tools' box at the end of this section.
Les s than 15 mins
15 to 60 mins
1 to 2 hours
2 to 4 hours
M ore than 4 hours
Les s than 2 years
2-5 years
6-10 years
11-15 years
16-20 years
21-30 years
Greater than 30 years
LARGE ANGLE GRINDERS
Les s than 15 mins
15 to 60 mins
1 to 2 hours
2 to 4 hours
M ore than 4 hours
Les s than 2 years
2-5 years
6-10 years
11-15 years
16-20 years
21-30 years
Greater than 30 years
SMALL ANGLE GRINDERS
38
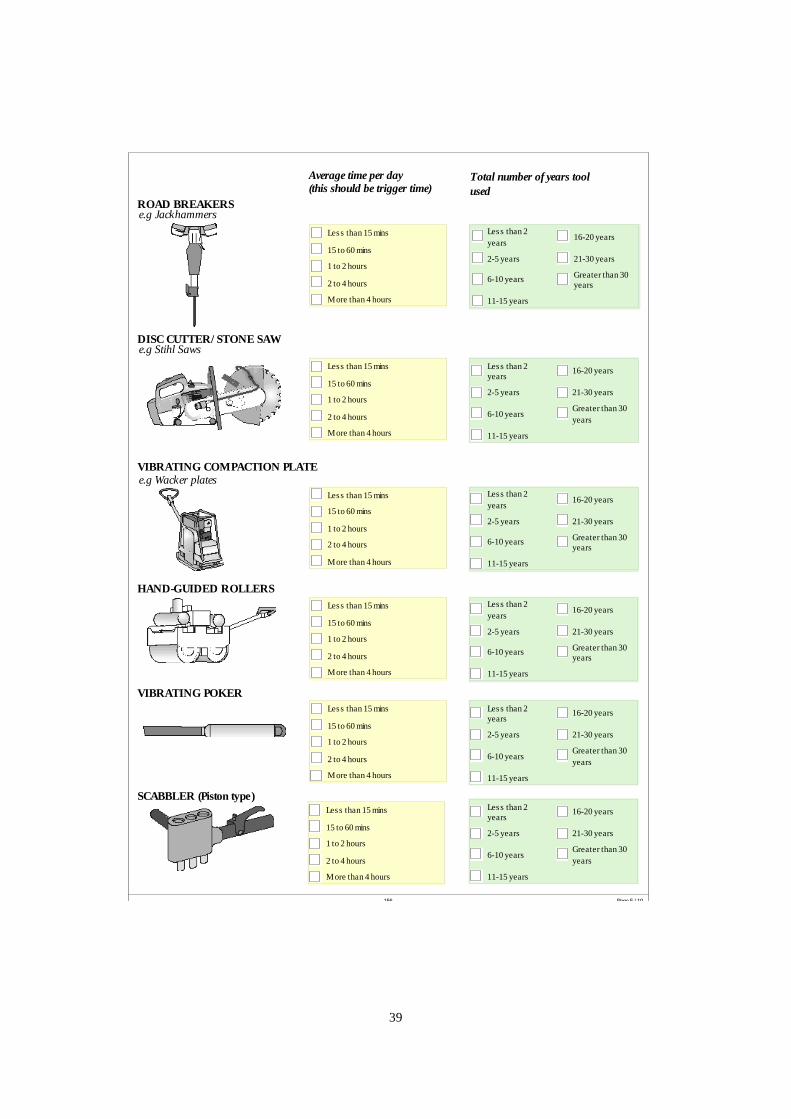
/
( )
( )
156 Page 5 / 10
ROAD BREAKERS
DISC CUTTER STONE SAW
VIBRATING COMPACTION PLATE
VIBRATING POKER
SCABBLER Piston type
HAND-GUIDED ROLLERS
e.g Jackhammers
e.g Stihl Saws
e.g Wacker plates
Les s than 15 mins
15 to 60 mins
1 to 2 hours
2 to 4 hours
M ore than 4 hours
Les s than 2 years
2-5 years
6-10 years
11-15 years
16-20 years
21-30 years
Greater than 30 years
Les s than 15 mins
15 to 60 mins
1 to 2 hours
2 to 4 hours
M ore than 4 hours
Les s than 2 years
2-5 years
6-10 years
11-15 years
16-20 years
21-30 years
Greater than 30 years
Les s than 15 mins
15 to 60 mins
1 to 2 hours
2 to 4 hours
M ore than 4 hours
Les s than 2 years
2-5 years
6-10 years
11-15 years
16-20 years
21-30 years
Greater than 30 years
Les s than 15 mins
15 to 60 mins
1 to 2 hours
2 to 4 hours
M ore than 4 hours
Les s than 2 years
2-5 years
6-10 years
11-15 years
16-20 years
21-30 years
Greater than 30 years
Les s than 15 mins
15 to 60 mins
1 to 2 hours
2 to 4 hours
M ore than 4 hours
Les s than 2 years
2-5 years
6-10 years
11-15 years
16-20 years
21-30 years
Greater than 30 years
Les s than 15 mins
15 to 60 mins
1 to 2 hours
2 to 4 hours
M ore than 4 hours
Les s than 2 years
2-5 years
6-10 years
11-15 years
16-20 years
21-30 years
Greater than 30 years
Average time per day this should be trigger time
Total number of years tool used
39
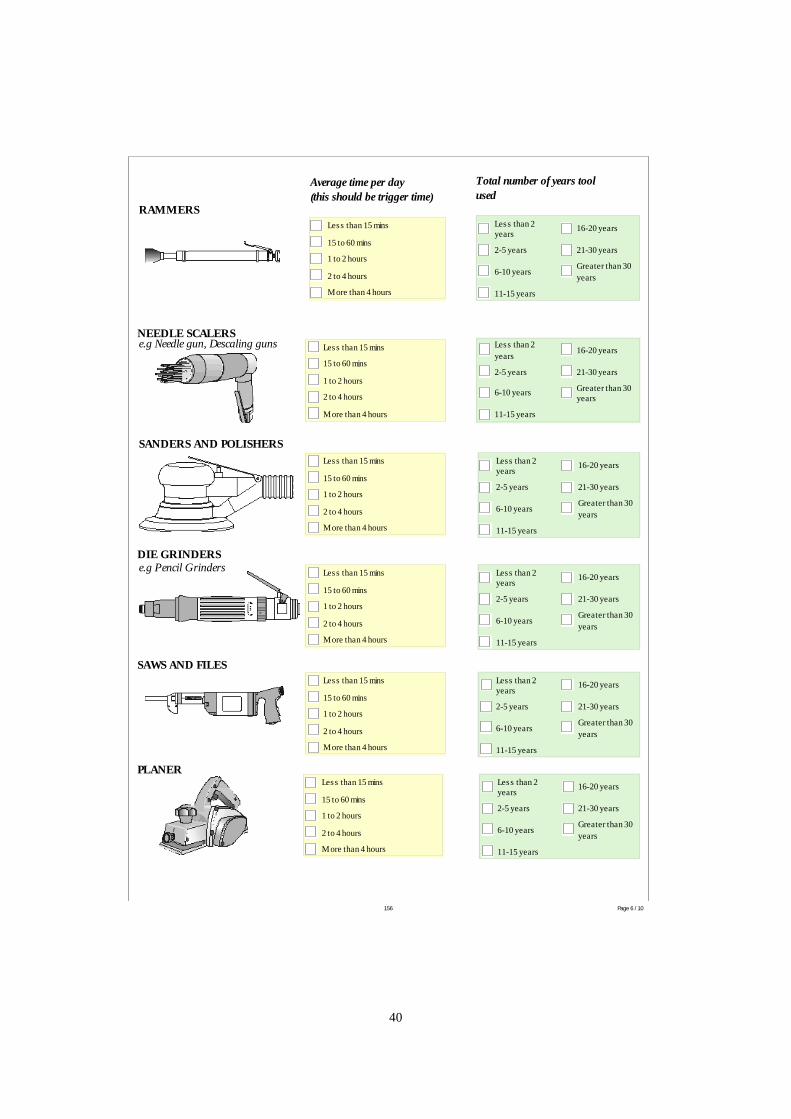
156 Page 6 / 10
( )
SANDERS AND POLISHERS
DIE GRINDERS
SAWS AND FILES
NEEDLE SCALERS
RAMMERS
PLANER
Average time per day this should be trigger time
Total number of years tool used
e.g Pencil Grinders
e.g Needle gun, Descaling guns Les s than 15 mins
15 to 60 mins
1 to 2 hours
2 to 4 hours
M ore than 4 hours
Les s than 2 years
2-5 years
6-10 years
11-15 years
16-20 years
21-30 years
Greater than 30 years
Les s than 15 mins
15 to 60 mins
1 to 2 hours
2 to 4 hours
M ore than 4 hours
Les s than 2 years
2-5 years
6-10 years
11-15 years
16-20 years
21-30 years
Greater than 30 years
Les s than 15 mins
15 to 60 mins
1 to 2 hours
2 to 4 hours
M ore than 4 hours
Les s than 2 years
2-5 years
6-10 years
11-15 years
16-20 years
21-30 years
Greater than 30 years
Les s than 15 mins
15 to 60 mins
1 to 2 hours
2 to 4 hours
M ore than 4 hours
Les s than 2 years
2-5 years
6-10 years
11-15 years
16-20 years
21-30 years
Greater than 30 years
Les s than 15 mins
15 to 60 mins
1 to 2 hours
2 to 4 hours
M ore than 4 hours
Les s than 2 years
2-5 years
6-10 years
11-15 years
16-20 years
21-30 years
Greater than 30 years
Les s than 15 mins
15 to 60 mins
1 to 2 hours
2 to 4 hours
M ore than 4 hours
Les s than 2 years
2-5 years
6-10 years
11-15 years
16-20 years
21-30 years
Greater than 30 years
40
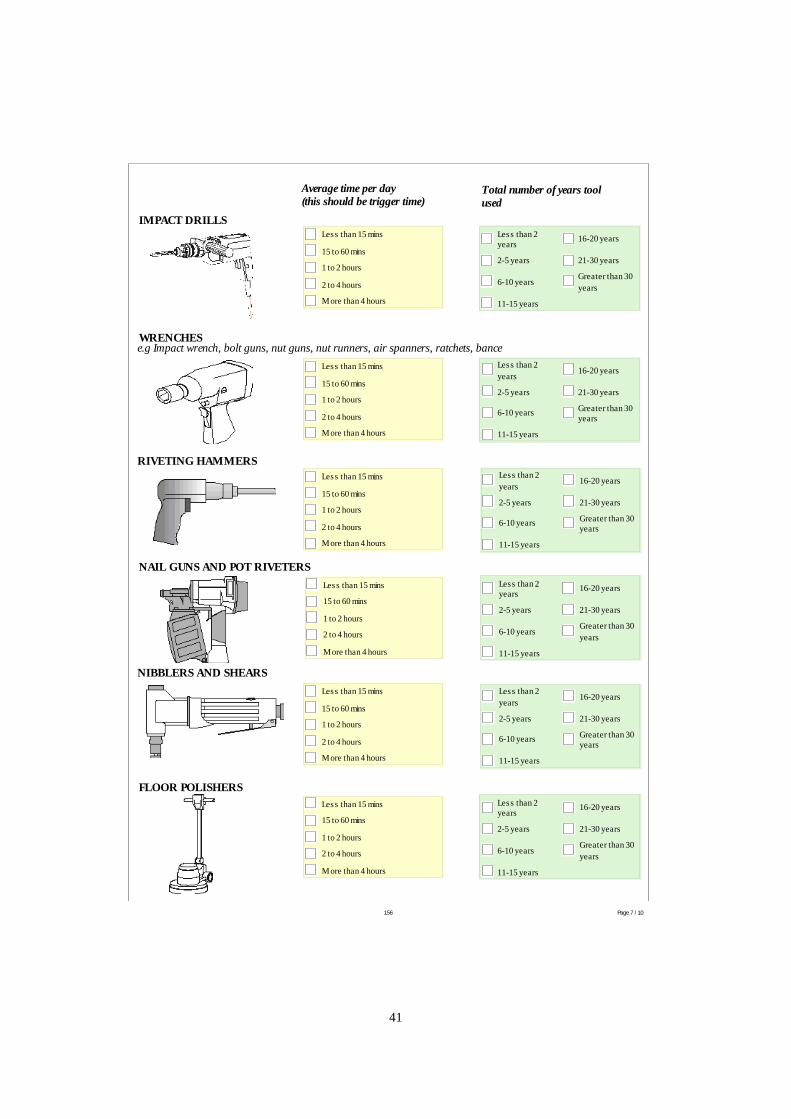
156 Page 7 / 10
( ) Average time per day this should be trigger time
Total number of years tool used
FLOOR POLISHERS
IMPACT DRILLS
WRENCHES
NIBBLERS AND SHEARS
e.g Impact wrench, bolt guns, nut guns, nut runners, air spanners, ratchets, bance
Les s than 15 mins
15 to 60 mins
1 to 2 hours
2 to 4 hours
M ore than 4 hours
Les s than 2 years
2-5 years
6-10 years
11-15 years
16-20 years
21-30 years
Greater than 30 years
Les s than 15 mins
15 to 60 mins
1 to 2 hours
2 to 4 hours
M ore than 4 hours
Les s than 2 years
2-5 years
6-10 years
11-15 years
16-20 years
21-30 years
Greater than 30 years
Les s than 15 mins
15 to 60 mins
1 to 2 hours
2 to 4 hours
M ore than 4 hours
Les s than 2 years
2-5 years
6-10 years
11-15 years
16-20 years
21-30 years
Greater than 30 years
Les s than 15 mins
15 to 60 mins
1 to 2 hours
2 to 4 hours
M ore than 4 hours
Les s than 2 years
2-5 years
6-10 years
11-15 years
16-20 years
21-30 years
Greater than 30 years
Les s than 15 mins
15 to 60 mins
1 to 2 hours
2 to 4 hours
M ore than 4 hours
Les s than 2 years
2-5 years
6-10 years
11-15 years
16-20 years
21-30 years
Greater than 30 years
RIVETING HAMMERS
Les s than 15 mins
15 to 60 mins
1 to 2 hours
2 to 4 hours
M ore than 4 hours
Les s than 2 years
2-5 years
6-10 years
11-15 years
16-20 years
21-30 years
Greater than 30 years
NAIL GUNS AND POT RIVETERS
41
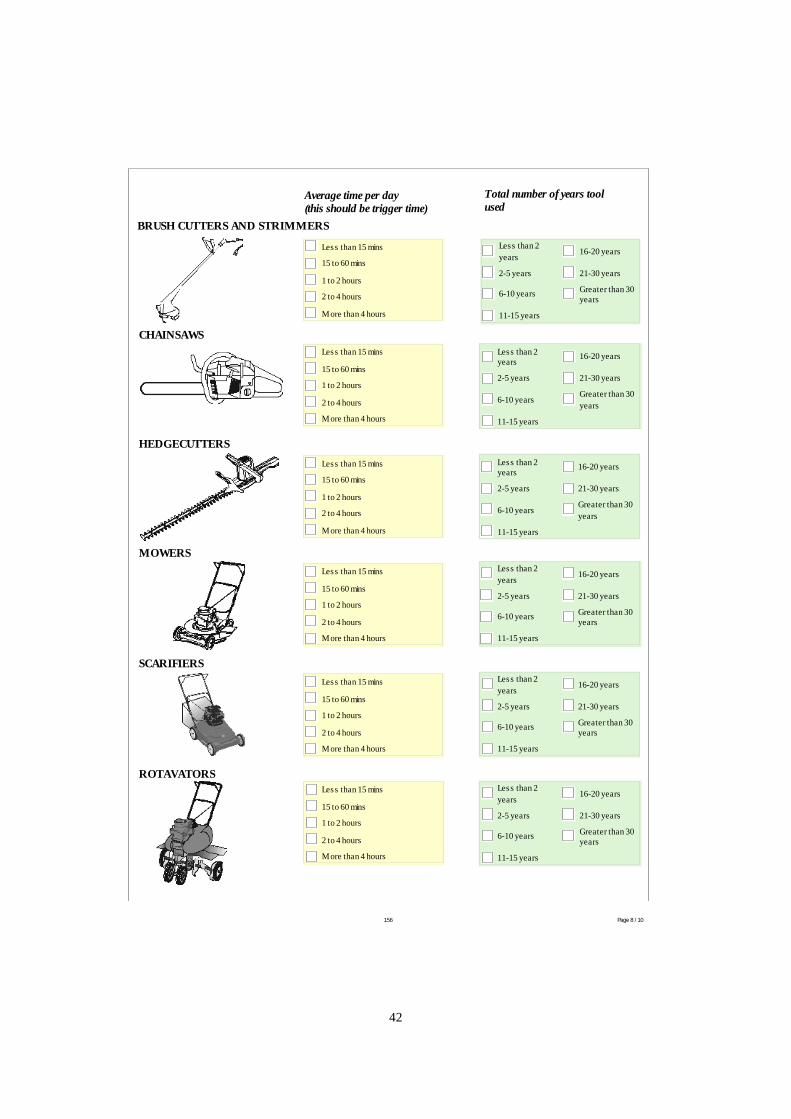
156 Page 8 / 10
( ) BRUSH CUTTERS AND STRIMMERS
CHAINSAWS
HEDGECUTTERS
MOWERS
SCARIFIERS
ROTAVATORS
Average time per day this should be trigger time
Total number of years tool used
Les s than 15 mins
15 to 60 mins
1 to 2 hours
2 to 4 hours
M ore than 4 hours
Les s than 2 years
2-5 years
6-10 years
11-15 years
16-20 years
21-30 years
Greater than 30 years
Les s than 15 mins
15 to 60 mins
1 to 2 hours
2 to 4 hours
M ore than 4 hours
Les s than 2 years
2-5 years
6-10 years
11-15 years
16-20 years
21-30 years
Greater than 30 years
Les s than 15 mins
15 to 60 mins
1 to 2 hours
2 to 4 hours
M ore than 4 hours
Les s than 2 years
2-5 years
6-10 years
11-15 years
16-20 years
21-30 years
Greater than 30 years
Les s than 15 mins
15 to 60 mins
1 to 2 hours
2 to 4 hours
M ore than 4 hours
Les s than 2 years
2-5 years
6-10 years
11-15 years
16-20 years
21-30 years
Greater than 30 years
Les s than 15 mins
15 to 60 mins
1 to 2 hours
2 to 4 hours
M ore than 4 hours
Les s than 2 years
2-5 years
6-10 years
11-15 years
16-20 years
21-30 years
Greater than 30 years
Les s than 15 mins
15 to 60 mins
1 to 2 hours
2 to 4 hours
M ore than 4 hours
Les s than 2 years
2-5 years
6-10 years
11-15 years
16-20 years
21-30 years
Greater than 30 years
42
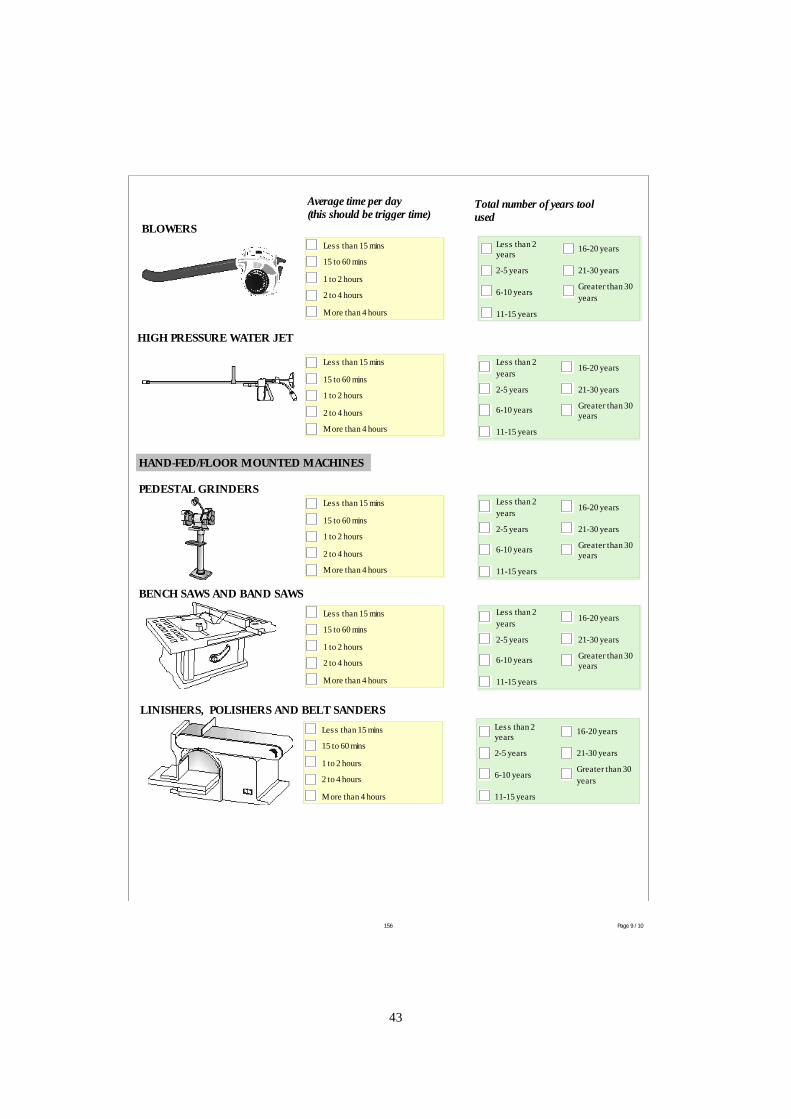
156 Page 9 / 10
/
( )
HIGH PRESSURE WATER JET
BLOWERS
HAND-FED FLOOR MOUNTED MACHINES
PEDESTAL GRINDERS
BENCH SAWS AND BAND SAWS
LINISHERS, POLISHERS AND BELT SANDERS
Average time per day this should be trigger time
Total number of years tool used
Les s than 15 mins
15 to 60 mins
1 to 2 hours
2 to 4 hours
M ore than 4 hours
Les s than 2 years
2-5 years
6-10 years
11-15 years
16-20 years
21-30 years
Greater than 30 years
Les s than 15 mins
15 to 60 mins
1 to 2 hours
2 to 4 hours
M ore than 4 hours
Les s than 2 years
2-5 years
6-10 years
11-15 years
16-20 years
21-30 years
Greater than 30 years
Les s than 15 mins
15 to 60 mins
1 to 2 hours
2 to 4 hours
M ore than 4 hours
Les s than 2 years
2-5 years
6-10 years
11-15 years
16-20 years
21-30 years
Greater than 30 years
Les s than 15 mins
15 to 60 mins
1 to 2 hours
2 to 4 hours
M ore than 4 hours
Les s than 2 years
2-5 years
6-10 years
11-15 years
16-20 years
21-30 years
Greater than 30 years
Les s than 15 mins
15 to 60 mins
1 to 2 hours
2 to 4 hours
M ore than 4 hours
Les s than 2 years
2-5 years
6-10 years
11-15 years
16-20 years
21-30 years
Greater than 30 years
43
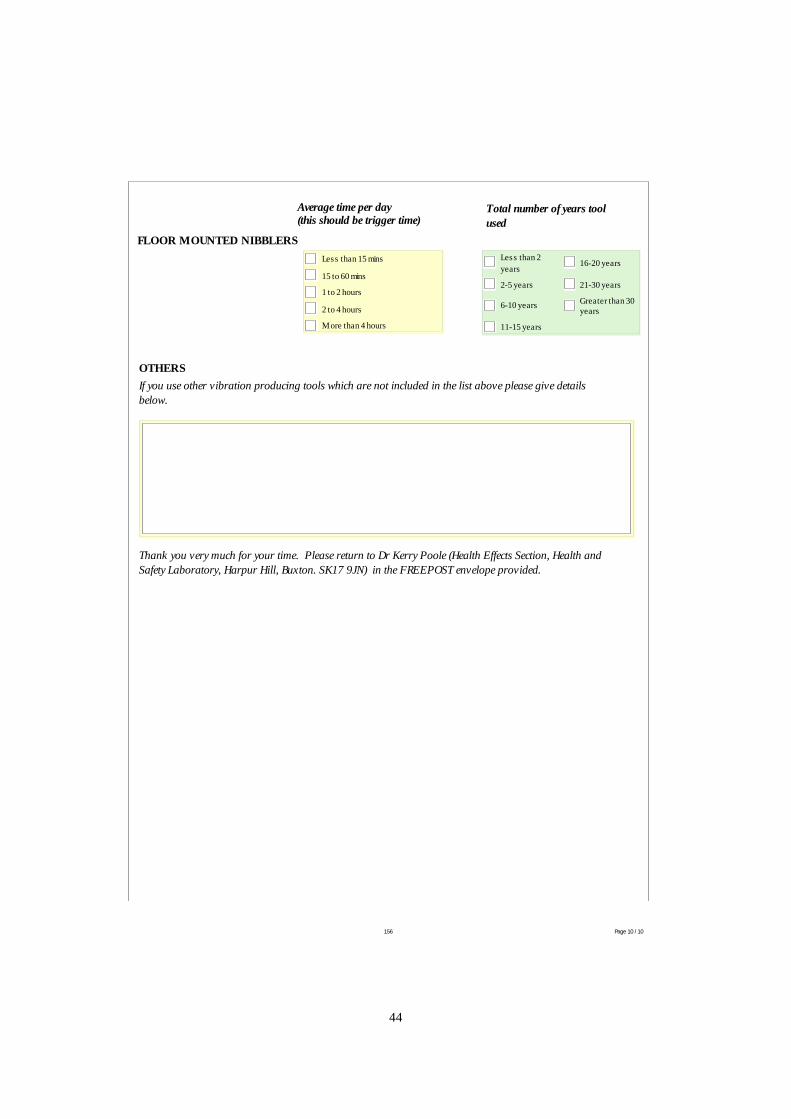
156 Page 10 / 10
()
( )
FLOOR MOUNTED NIBBLERS
OTHERS If you use other vibration producing tools which are not included in the list above please give details below.
Les s than 15 mins
15 to 60 mins
1 to 2 hours
2 to 4 hours
M ore than 4 hours
Les s than 2 years
2-5 years
6-10 years
11-15 years
16-20 years
21-30 years
Greater than 30 years
Thank you very much for your time. Please return to Dr Kerry Poole Health Effects Section, Health and Safety Laboratory, Harpur Hill, Buxton. SK17 9JN in the FREEPOST envelope provided.
Average time per day this should be trigger time
Total number of years tool used
44

45

Published by the Health and Safety Executive 12/08
Executive Health and Safety
Upper limb disability and exposure to hand-arm vibration in selected industries
There is a need for evidence-based intelligence related to ill-health caused by exposure to vibration that could be used to benchmark the extent of disease and allow assessment of changes over time. This ideally requires simple, validated and cheap tools that can be administered easily across all industries. The Disability of the Arm, Shoulder and Hand (DASH) questionnaire is one instrument that may be useful.
The emphasis of HSE’s Noise and Vibration Programme has been on the health outcome of hand-arm vibration syndrome (HAVS), which is by definition causally associated with cumulative hand-transmitted vibration exposure. However, individuals with HAVS may also have other musculoskeletal disorders, which may or may not be a consequence of vibration exposure, but that will contribute to their overall disability.
The study reported here involved the application of the DASH questionnaire to a population working with hand-held vibrating tools, whilst collecting simple information related to industry, trade, tools used, vibration exposure, known health problems and symptoms in the upper limbs. Following discussion with appropriate HSE colleagues four industries were selected for study: Gardening; Manufacture of Basic Metals, Construction and Motor Vehicle Repair.
This report and the work it describes were funded by the Health and Safety Executive (HSE). Its contents, including any opinions and/or conclusions expressed, are those of the authors alone and do not necessarily reflect HSE policy.
RR667
www.hse.gov.uk