UPM – the biofore companyassets.upm.com/Investors/2017/Reports and Presentations 2017/12 1… ·...
56
Investor presentation December 2017 UPM – THE BIOFORE COMPANY
Transcript of UPM – the biofore companyassets.upm.com/Investors/2017/Reports and Presentations 2017/12 1… ·...

Investor presentation
December 2017
UPM – THE BIOFORE COMPANY

| © UPM2
UPM today
UPM
BIOREFINING
Pulp
Biofuels
Timber
UPM
ENERGY
Electricity
generation and
trading
UPM
RAFLATAC
Label
materials for
product and
information
labelling
UPM
SPECIALTY
PAPERS
Label papers,
release liners,
office papers
and flexible
packaging
UPM
PAPER ENA
Magazine
papers,
newsprint and
fine papers
UPM
PLYWOOD
Plywood and
veneer
products
UPM
BIOCOMPOSITES
UPM
BIOCHEMICALS
WOOD SOURCING
AND FORESTRY

| © UPM3
Global businesses – local presence
54production plants
in 12 countries
19,300employees
in 45 countries
12,000customers
in 120 countries
85,000shareholders
in 40 countries
55,000suppliers
in 70 countries
UPM’s sales by market 2016
EUR 9,812 million
13%North America
63%Europe
6%Rest of the world
18%Asia
| © UPM
0 %
20 %
40 %
60 %
80 %
100 %
Paper
Plywood
Raflatac
Sawmilling
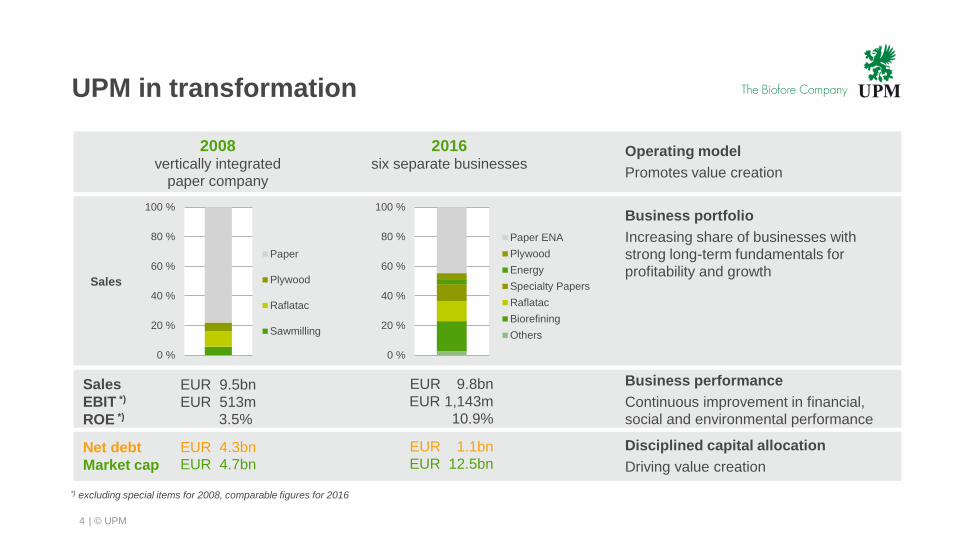
UPM in transformation
4
*) excluding special items for 2008, comparable figures for 2016
Sales
EBIT *)
ROE *)
Net debt
Market cap
EUR 9.5bn
EUR 513m
3.5%
EUR 4.3bn
EUR 4.7bn
2008vertically integrated
paper company
2016six separate businesses
Business portfolio
Increasing share of businesses with
strong long-term fundamentals for
profitability and growthSales
Business performance
Continuous improvement in financial,
social and environmental performance
0 %
20 %
40 %
60 %
80 %
100 %
Paper ENA
Plywood
Energy
Specialty Papers
Raflatac
Biorefining
Others
Operating model
Promotes value creation
EUR 9.8bn
EUR 1,143m
10.9%
EUR 1.1bn
EUR 12.5bn
Disciplined capital allocation
Driving value creation
| © UPM5
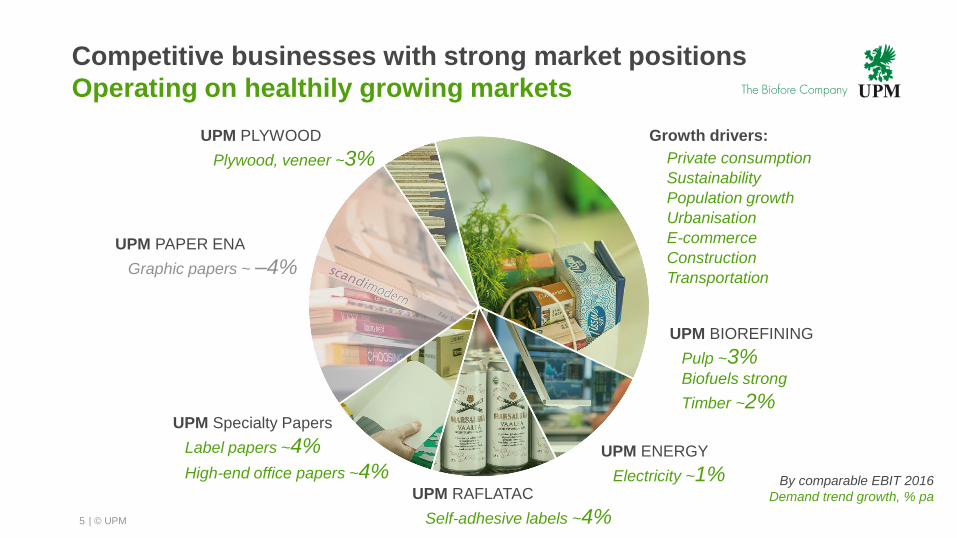
Competitive businesses with strong market positions
Operating on healthily growing markets
UPM PLYWOOD
Plywood, veneer ~3%
UPM PAPER ENA
Graphic papers ~ –4%
UPM Specialty Papers
Label papers ~4%
High-end office papers ~4%UPM RAFLATAC
Self-adhesive labels ~4%
UPM ENERGY
Electricity ~1%
UPM BIOREFINING
Pulp ~3%Biofuels strong
Timber ~2%
Growth drivers:
Private consumption
Sustainability
Population growth
Urbanisation
E-commerce
Construction
Transportation
By comparable EBIT 2016
Demand trend growth, % pa

| © UPM6
Increasing share of businesses with strong long-
term fundamentals for profitability and growth
Sustainable growth
Maintaining
strong cash flow
Sales 2016
0%
25%
50%
75%
100%
UPM Biorefining
UPM Raflatac
UPM Specialty Papers
UPM Plywood
UPM Energy
UPM Paper ENA
Pulp
+70,000 t
Pulp
+100,000 t
Pulp +170,000 t
Label stock
expansions
Renewable
diesel
+120m litres
Specialty
papers
+360,000 t
Plywood
+40,000 m3
Pulp mill
efficiency
improvement
Pulp
+170,000 t
420,000 t magazine
160,000 t fine
460,000 t
magazine
280,000 t
news
345,000 t news 195,000 t magazine
CA
PA
CIT
Y C
LO
SU
RE
S
AN
D D
IVE
ST
ME
NT
S
FO
CU
SE
D
INV
ES
TM
EN
TS
13 14 15 16 17 18
Pulp
+30,000 t
Specialty
labels
expansion
19
Plywood
+45,000 m3
Label stock
expansion
128,000 t
magazine
305,000 t
magazine
Hydropower

| © UPM
Value creation through sustainable growth
and cash generation
7
UPM Biorefining
UPM Raflatac
UPM Specialty Papers
UPM Plywood
Sales 2016
UPM Paper ENA
UPM Energy 8
12
16
20
400
600
800
1 000
2013 2014 2015 2016 LTM
Maintain strong cash flow
• Commercial success
• Cost efficiency
• Efficient use of assets,
including restructuring
Sustainable growth
• Commercial success
• Cost efficiency
• Focused growth investments
• Product mix development
0
200
400
600
2013 2014 2015 2016 LTM
EURm Operating cash flow,UPM Paper ENA
0%
25%
50%
75%
100%
% of salesEURm Comparable EBIT,
growing businesses combined

| © UPM
Growth initiatives – focused growth projects have
contributed well to UPM’s profits and returns
Current ongoing focused growth projects
• Kymi pulp mill expansion 2
• Raflatac expansions in Poland and Finland
• Kaukas pulp mill expansion 2
• Chudovo plywood mill expansion
Long term growth opportunity in pulp
• Agreement with the Government of Uruguay to
establish a competitive operating platform in Uruguay
New biomolecule businesses
• Evaluation of building a biochemicals refinery
• Lappeenranta Biorefinery reached designed
capacity and generates a good financial return
| © UPM8

| © UPM
Focused investments are delivering growth
9
Pulp CAGR +3%
Biofuels New business
Standard products CAGR +4%
Films and specials CAGR +8%
Label materials CAGR +4%
Cut-size CAGR +6%
Plywood CAGR +3%
Average delivery
growth 2011 –2016
UPM Biorefining
UPM Raflatac
UPM Specialty Papers
UPM Plywood
0%
25%
50%
75%
100%
Sales 2016

| © UPM
0
2
4
6
8
10
12
14
16
18
20
22
24
26
28
30ROCE %
10
Business area long-term targets compared
with realised returns
0
2
4
6
8
10
12
14
16
18
20
22
24
26
28
30ROCE % *)
0
2
4
6
8
10
12
14
16
18
20
22
24
26
28
30ROCE %)
0
2
4
6
8
10
12
14
16
18
20
22
24
26
28
30
0
2
4
6
8
10
12
14
16
18
20
22
24
26
28
30ROCE %
0
2
4
6
8
10
12
14
16
18
20
22
24
26
28
30ROCE %
*) UPM Energy shareholdings
valued at fair valueLong-term return target
UPM
Specialty Papers
UPM
Paper ENA
UPM
PlywoodUPM
Raflatac
UPM
Energy
UPM
Biorefining
FCF/CE %

| © UPM
0,0
0,5
1,0
1,5
2,0
2,5
3,0
0
750
1 500
2 250
3 000
3 750
4 500
2011 2012 2013 2014 2015 2016 LTM
Net debtEURm
Net debt/EBITDA
(x)
Net debt and leverage
Policy: ≤ 2x
11
Group financial performance
0
200
400
600
800
1 000
1 200
1 400
2011 2012 2013 2014 2015 2016 LTM
EURm
Target: EBIT growth
Comparable figures for 2014 – 2017,
excluding special items for earlier years
Comparable EBIT
0
2
4
6
8
10
12
2011 2012 2013 2014 2015 2016 LTM
% Comparable ROE
Target: 10%

| © UPM12
5-year cumulative cash flow
– disciplined capital allocation in action
Industry-leading
balance sheet
Net debt /EBITDA
0.41x
EUR 5.9bn
Deleveraging
Strong operating cash flow
Attractive dividend
Focused investments
EUR 1.9bn
EUR 2.1bn
EUR 1.9bn

| © UPM13
Capital allocation
– maintaining capability for future opportunities
Attractive dividend
30-40% of operating cash flow per share
Capex in attractive focused growth projects
IRR exceeds ROCE targets
Capex in attractive larger growth opportunities
IRR exceeds ROCE targets
M&A, if the opportunity and timing are right
IRR exceeds ROCE targets
2.
3.
Maintain strong
balance sheet,
investment grade
metrics
Net debt/EBITDA
2x or less
1.
Additional shareholder distribution selectively
balance long term free cash flow cycles4.

| © UPM14
Strong cash flow and balance sheet
0,0
0,5
1,0
1,5
2,0
2,5
3,0
3,5
4,0
0
500
1 000
1 500
2 000
2 500
3 000
3 500
4 000
2011 2012 2013 2014 2015 2016 Q3/17
Net debt / EBITDA(trailing12 months)
Net debt
Net debt / EBITDA
0.41x
0
200
400
600
800
1 000
1 200
1 400
1 600
1 800
2011 2012 2013 2014 2015 2016 Q3/17
Operating cash flow Net debt
623
1,556
Net debtEURm
Free cash flow
Operating cash flow
EURm
Q3/17
operating
cash flow
EUR 486m
Working
capital
decreased by
EUR 54m
LTM LTM

| © UPM
0
20
40
60
80
100
0,00
0,20
0,40
0,60
0,80
1,00
2011 2012 2013 2014 2015 2016
15
Dividend
EUR
per share
Dividend policy
• UPM aims to pay an attractive dividend,
30–40% of operating cash flow per share
Dividend for 2016
• EUR 0.95 (0.75) per share, totalling
EUR 507m
• 30% of 2016 operating cash flow
% of operating
cash flow per share
| © UPM
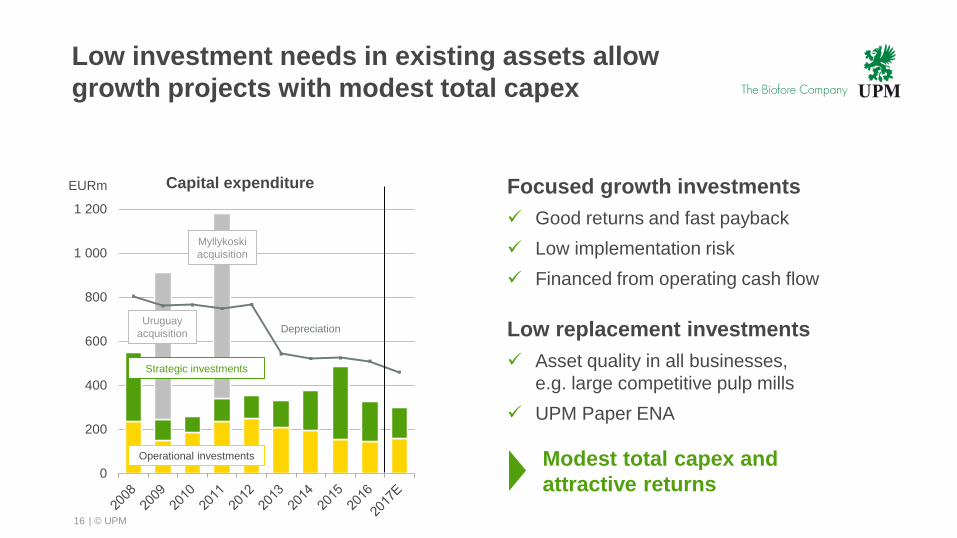
Low investment needs in existing assets allow
growth projects with modest total capex
16
486
Focused growth investments
Good returns and fast payback
Low implementation risk
Financed from operating cash flow
Modest total capex and
attractive returns
Low replacement investments
Asset quality in all businesses,
e.g. large competitive pulp mills
UPM Paper ENA
0
200
400
600
800
1 000
1 200
Operational investments
Strategic investments
Uruguay
acquisition Depreciation
Capital expenditure
Myllykoski
acquisition
EURm
| © UPM17
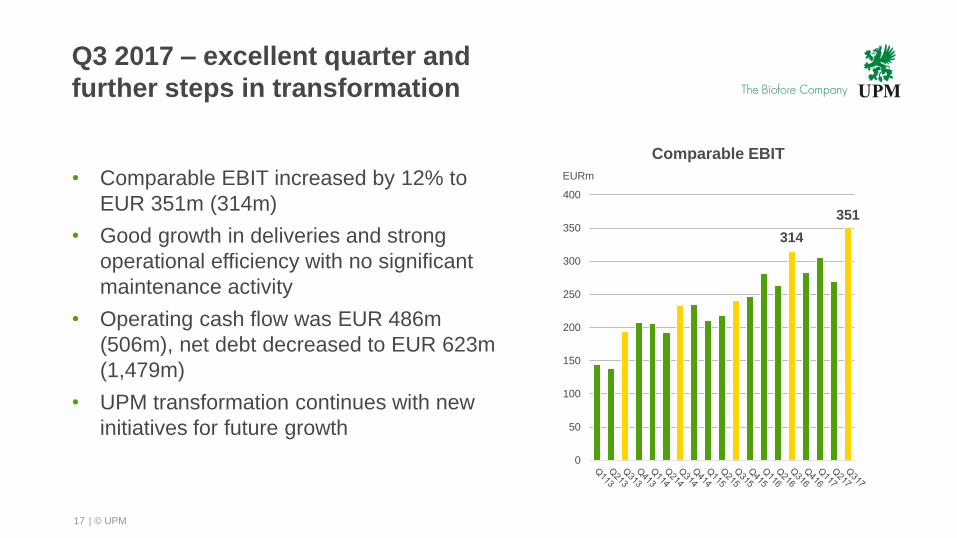
Q3 2017 – excellent quarter and
further steps in transformation
• Comparable EBIT increased by 12% to
EUR 351m (314m)
• Good growth in deliveries and strong
operational efficiency with no significant
maintenance activity
• Operating cash flow was EUR 486m
(506m), net debt decreased to EUR 623m
(1,479m)
• UPM transformation continues with new
initiatives for future growth
0
50
100
150
200
250
300
350
400
EURm
Comparable EBIT
351
314

| © UPM18
Q3 2017 – Good market demand
UPM PLYWOOD
• Good demand, deliveries +4%
• Modest input cost inflation in sales margins
UPM PAPER ENA
• Graphic paper deliveries –1%
• Seasonally low fixed costs, including
maintenance
• Fibre costs higher
UPM RAFLATAC
• Good demand globally, deliveries +9%
driven in particular by developing markets
• Input cost inflation in sales margins
UPM ENERGY
• Electricity deliveries –7%
• Hydropower generation recovered to
normal level, below last year’s
high level
UPM BIOREFINING
• Good demand, pulp deliveries +5%,
strong growth in biofuels
• Pulp prices higher
• No significant maintenance
UPM SPECIALTY PAPERS
• Good demand, deliveries +3%
• Significant progress in product mix,
higher release liner deliveries
• Input cost inflation mitigated

| © UPM
Comparable EBIT by business area
19
0
2,5
5
7,5
10
12,5
0
10
20
30
40
50
0
5
10
15
20
25
30
0
30
60
90
120
150
180
0
10
20
30
40
50
60
0
20
40
60
80
100
120
0
2,5
5
7,5
10
12,5
0
10
20
30
40
50
-2
0
2
4
6
8
10
12
-20
0
20
40
60
80
100
120
0
4
8
12
16
20
0
5
10
15
20
25
EURm % of salesUPM Specialty Papers EURm % of sales
UPM Paper ENA
EURm % of salesUPM Plywood
EURm % of sales
UPM Raflatac
EURm % of salesUPM EnergyEURm % of salesUPM Biorefining

| © UPM
Growth in deliveries in Biorefining,
Raflatac, Specialty Papers and Plywood.
Pulp prices increased.
Prices increased more than variable costs.
Growth in deliveries continued.
Currencies had a negative impact.
0
50
100
150
200
250
300
350
400
450
Q3/16 Q3/17
Comparable EBIT in Q3 2017 vs. Q3 2016
Raflatac
Specialty
Papers
Other
operations
and
eliminations
Energy
Biorefining
Paper
ENA
Plywood
0
50
100
150
200
250
300
350
400
450
Q3/16 Q3/17
EURm
Prices
Variable
costs
Fixed
costs
Deliveries
EURm
31412.8%
35114.1%
Currency,
net
impact
Depr.,
forests,plantations
20
31412.8%
35114.1%

| © UPM
Outlook for 2017
• UPM’s profitability improved significantly in 2016 and is
expected to continue on a good level in 2017. Comparable
EBIT is expected to increase in 2017 compared with 2016.
• Demand growth is expected to continue for most of UPM’s
businesses, while demand decline is expected to continue
for UPM Paper ENA. The focused growth projects continue
to contribute to UPM’s performance.
• Following a deflationary environment in recent years, 2017
is expected to show modest input cost inflation. UPM will
continue measures to reduce fixed and variable costs to
mitigate this.
• Q4 2017 is expected to include more maintenance activity
than Q3 2017 in UPM Biorefining and UPM Paper ENA.
| © UPM21

| © UPM
Responsibility is good business
22
"We believe that
customers, investors
and other stakeholders
value responsible
operations that keep
risks under control and
add to our business
opportunities,
thereby increasing
the company value.“
Risk mitigation by responsible
value chain and production
Creating value through
products and innovation
Creating competitive advantage
and long-term value by efficiency

| © UPM23
Creating competitive advantage
and long-term value by engagement
0
5
10
15
20
25
Safety EUR million
0,20
0,25
0,30
0,35
0,40
0,45
0,50
0,55
0,60
Productivity
Lost-time
accident
frequency
Sales per
employee
Per million hours
5-year CAGR:
+4% pa5-year change:
−76%
30
40
50
60
70
80
90
Employee engagement
Employee
engagement
Manager
effectiveness
5-year change:
+9
Index

| © UPM
Creating competitive advantage
and long-term value by efficiencyCase: UPM Changshu mill in China
24
Source: UPM
Water
−60%Per tonne of paper
Energy
−30%Per tonne of paper
Waste to landfill
−60%Per tonne of paper
Certified fibre
85%In 2015
2015 compared to 2005
water
intake
water
discharge
COD in effluent
−75%Per tonne of paper
SO2 emission
−90%Per tonne of paper

| © UPM25
Consistent long-term work
receives external recognition
UPM in sustainability indices Sustainable and Responsible (SRI) investors form a significant part of UPM’s shareholders
0
5
10
15
20
25
UPM Industrials &Materials
Europe
SRI, % of total institutional shareholders
Source: Nasdaq, September 2016
CDP’s Climate Change Program: A- score

| © UPM
UPM Biorefining
Market pulp consumed in growing end-uses –
supply of alternative white fibres declines
26
Market pulp consumption
in growing end-uses
Stressed supply
of white recycled fibre
Specialty Tissue
Cartonboard
Graphic papers
Containerboard Mixed collection crowding
out white recycled fibre
Global paper and board production

| © UPM
UPM Biorefining
Case: Market pulp consumption in growing
end-uses
27
Source: Pöyry, Hawkins Wright, UPM
85
30
10White integrated pulp
White market pulp
Other fibres
(RCP, mechanical
pulps…)
5% demand increase
in tissue, cartonboard
and specialty
end-uses
Increase in market
pulp consumption
Fibre consumption in
tissue, cartonboard and
specialty end-uses
+1.5
Million tonnes
| © UPM28
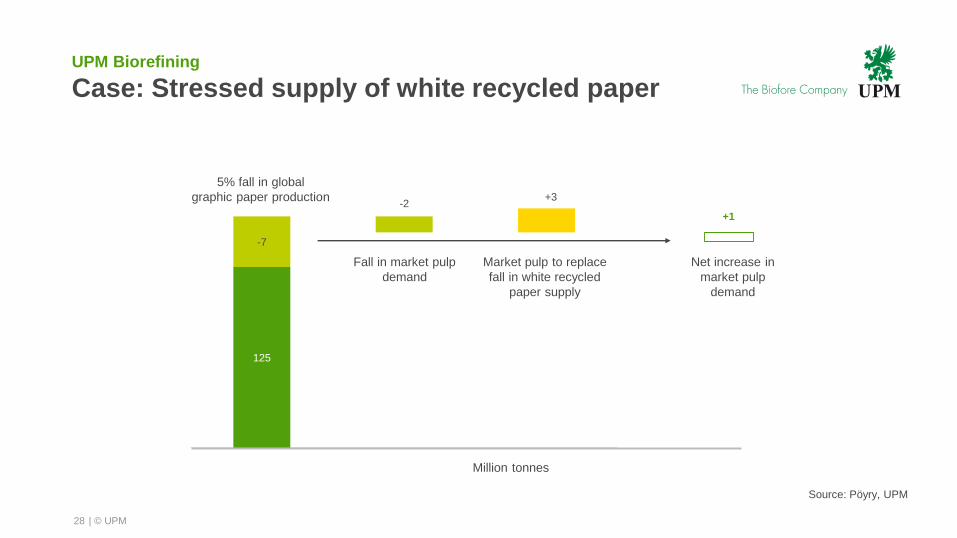
125
-7
-2+3
5% fall in global
graphic paper production
Market pulp to replace
fall in white recycled
paper supply
Fall in market pulp
demand
Net increase in
market pulp
demand
+1
UPM Biorefining
Case: Stressed supply of white recycled paper
Million tonnes
Source: Pöyry, UPM

| © UPM
UPM Biorefining
Case: Mixed collection crowding out white
recycled fibre
29
Source: Pöyry, UPM
135
49 62
+4
75
5%-point
increase in
mixed collection
shareWhite RCP grades
Mixed RCP
Old corrugated boxes
Market pulp to replace fall
in white recycled paper
Million tonnes

| © UPM
UPM Biorefining
Summary of pulp demand outlook
30
Source: UPM, Pöyry, RISI
Increase in end use …
Mt
… will drive fibre demand in coming decades
Estimated growth of White
RCP + Integrated Pulp +
Market Pulp is still
conservative (~1 Mt/a)
Mt
WF: Wood-free graphical papers
WC: Wood-containing graphical
papers (magazine grades)
0
100
200
300
400
500
600
2010 2020 2030
Newsprint WC
WF Tissue & fluff
Spec. & other Carton-boards
Container-boards
0
100
200
300
400
500
600
2010 2020 2030
Market pulp Integrated pulp
RCP White Mechanical pulp
Non-wood Unbleached pulp
RCP Brown
Healthy growth in other
White Papers & Boards
Strong growth
in Containerboards
(brown fibre)
Decline in Graphic papers Growth in Market pulp vs.
decline in Integrated pulp
Demand of Brown fibre
may overwhelm the supply
Declining White RCP
| © UPM31
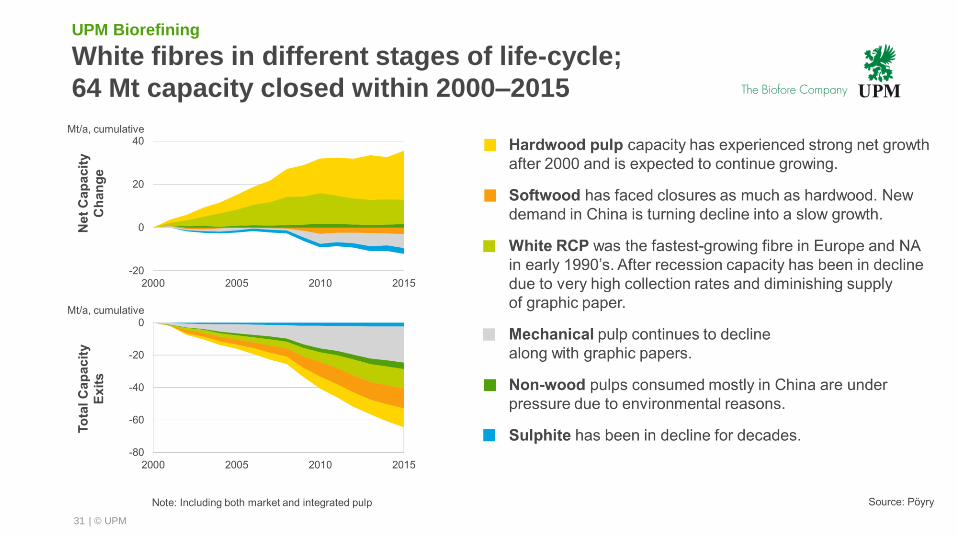
UPM Biorefining
White fibres in different stages of life-cycle;
64 Mt capacity closed within 2000–2015

| © UPM32
UPM Biorefining
Demand-supply drivers of pulp market
Short term Long term
Demand
Supply
Re- and
destocking of
inventories
New mill
starts
Debottleneck
investments
Maintenance
stoppages
Production
issues
Population growth
Urbanisation
Middle class expansion
Aging demography
E-commerce
Availability of
competitive
mill locations
Plantations, sustainable
wood raw material
Water availability
Infrastructure
Decline of
graphic paper
production and
scarcity
of recycled fibre
Capacity
closures
Conversions
End use
demand
Sustainable,
renewable and
recyclable
Food product safety
Replacing plastics

| © UPM
UPM Biorefining
Chemical pulp market prices
33
300
400
500
600
700
800
900
EUR/tonne
BHKP, Europe, EUR NBSK, Europe, EUR
BHKP, China, EUR NBSK, China, EUR
Source: FOEX Indexes Ltd, ECB
Pulp market prices, USDPulp market prices, EUR
300
400
500
600
700
800
900
1000
1100
USD/tonne
BHKP, Europe NBSK, Europe
BHKP, China NBSK, China

| © UPM34
UPM Biorefining
Potential pulp mill in Uruguay could be a competitive
alternative – time schedule is several years
Phase III
Phase II
Phase I
Potential UPM
Investment Decision
Investment Agreement
signed
| © UPM35
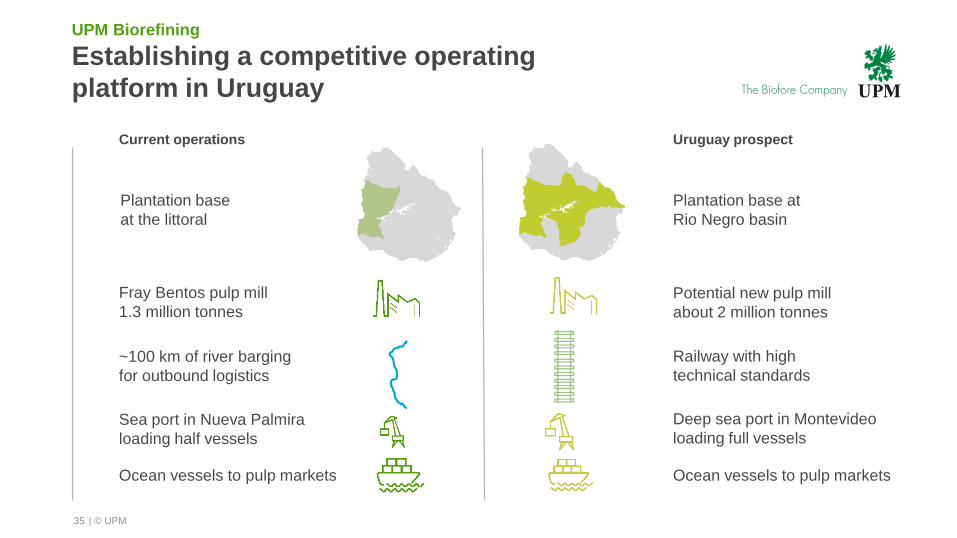
UPM Biorefining
Establishing a competitive operating
platform in Uruguay
Uruguay prospectCurrent operations
Plantation base
at the littoral
Plantation base at
Rio Negro basin
Potential new pulp mill
about 2 million tonnes
~100 km of river barging
for outbound logistics
Sea port in Nueva Palmira
loading half vessels
Railway with high
technical standards
Deep sea port in Montevideo
loading full vessels
Ocean vessels to pulp markets Ocean vessels to pulp markets
Fray Bentos pulp mill
1.3 million tonnes
| © UPM
UPM Biorefining
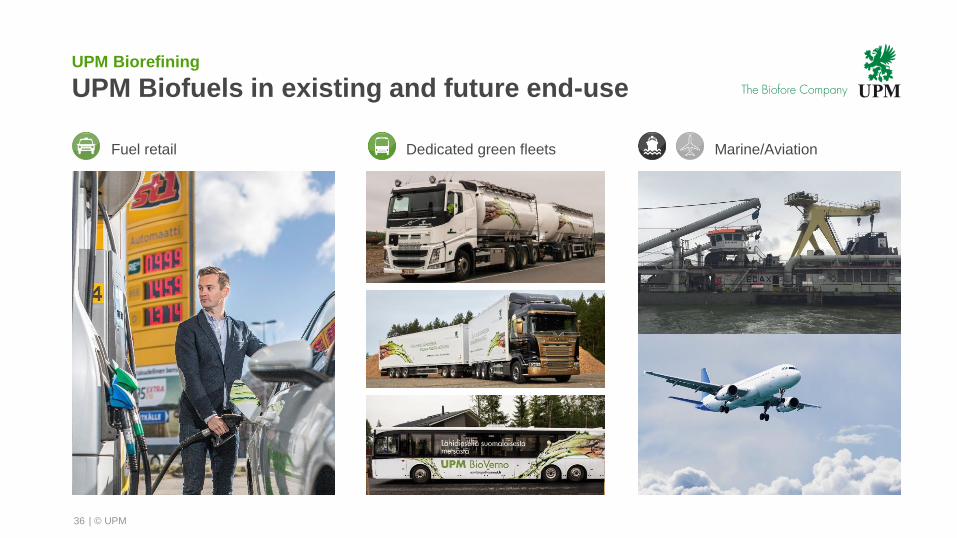
UPM Biofuels in existing and future end-use
36
Fuel retail Dedicated green fleets Marine/Aviation

| © UPM
UPM Biorefining
UPM Biofuels business evolving
37
2010 2020
Establish
Bioverno as a
benchmark
product and
brand in biofuels
Build
Lappeenranta
Biorefinery
and Biofuels
organization
UPM enters
Biofuels
Commercial start
2015
Investment decision
2012
Evaluate
technologies, define
business case
Start evaluation
of future growth
opportunities
Technology and
Business case proven
Biocrude
concept shaping

| © UPM38
UPM Biorefining
Significant emission cuts needed
in transportation sector
EU’s greenhouse gas reduction targets cannot be met without
significant emission cuts in transport – actions needed in all sectors
EU’s overall
GHG reduction
targets
– 40%
by 2030
– 60%
by 2040
– 80%
by 2050
Drop-in biofuels are
a solution for GHG
reduction in all transport
sectors
Electric vehicles can
be applied in light-duty
road transport
25% of total emissions
in Europe from
transportRoad
transport, light-duty
55%
Road transport,
heavy-duty18%
Aviation13%
Marine14%
Transport emissions by sector

| © UPM
UPM Energy
Cost competitive and flexible asset base
39
Nuclear as reliable base
load with world-class
availability performance
Flexible hydro production with
optimisation opportunities
Condensing power
Power generation breakdown
| © UPM40
UPM Energy
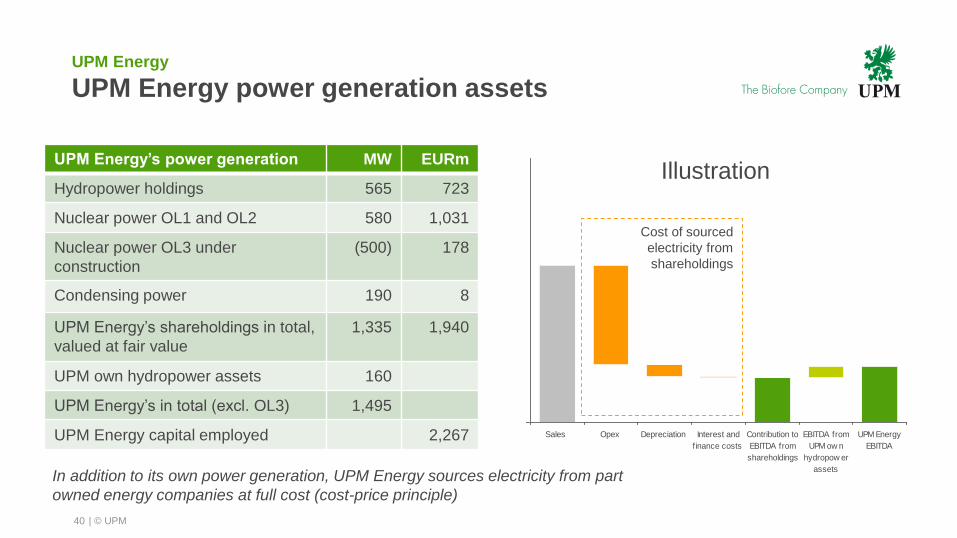
UPM Energy power generation assets
Sales Opex Depreciation Interest and
finance costs
Contribution to
EBITDA from
shareholdings
EBITDA from
UPM ow n
hydropow er
assets
UPM Energy
EBITDA
UPM Energy’s power generation MW EURm
Hydropower holdings 565 723
Nuclear power OL1 and OL2 580 1,031
Nuclear power OL3 under
construction
(500) 178
Condensing power 190 8
UPM Energy’s shareholdings in total,
valued at fair value
1,335 1,940
UPM own hydropower assets 160
UPM Energy’s in total (excl. OL3) 1,495
UPM Energy capital employed 2,267
In addition to its own power generation, UPM Energy sources electricity from part
owned energy companies at full cost (cost-price principle)
Cost of sourced
electricity from
shareholdings
Illustration

| © UPM41
UPM Energy profitability 2012 2013 2014 2015 2016 Q117 Q217 Q317
Comparable EBIT, EURm 217 186 202 181 116 22 12 26
% of sales 45.0 39.9 43.5 43.6 32.7 27.5 18.3 30.5
0
10
20
30
40
50
2012 2013 2014 2015 2016 2017
MWh Market electricity prices vs UPM sales price
Helsinki Front Year System Front Year UPM average sales price
UPM Energy
Cost efficient generation enables robust profitability
also in challenging market environment
| © UPM
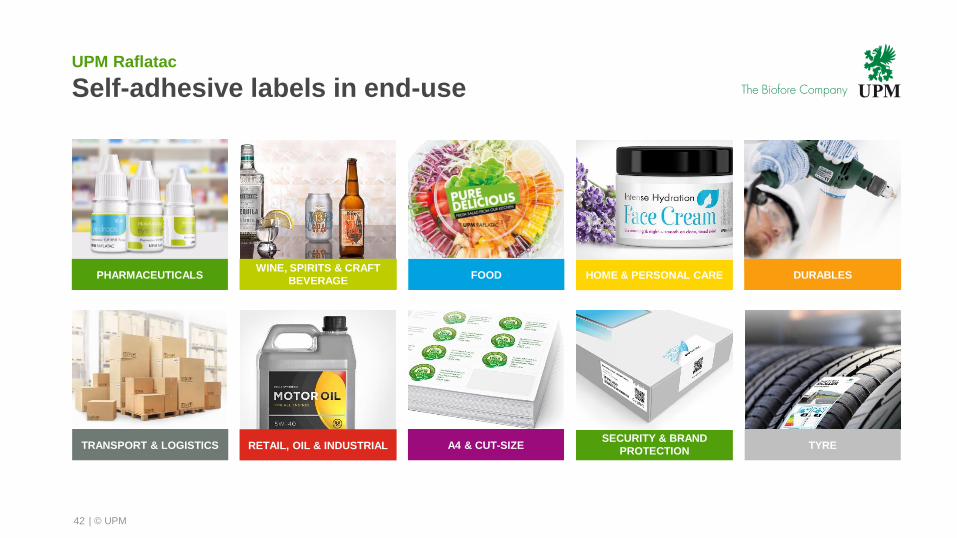
UPM Raflatac
Self-adhesive labels in end-use
42
PHARMACEUTICALSWINE, SPIRITS & CRAFT
BEVERAGE FOOD
A4 & CUT-SIZERETAIL, OIL & INDUSTRIALSECURITY & BRAND
PROTECTIONTYRE
HOME & PERSONAL CARE DURABLES
TRANSPORT & LOGISTICS
| © UPM
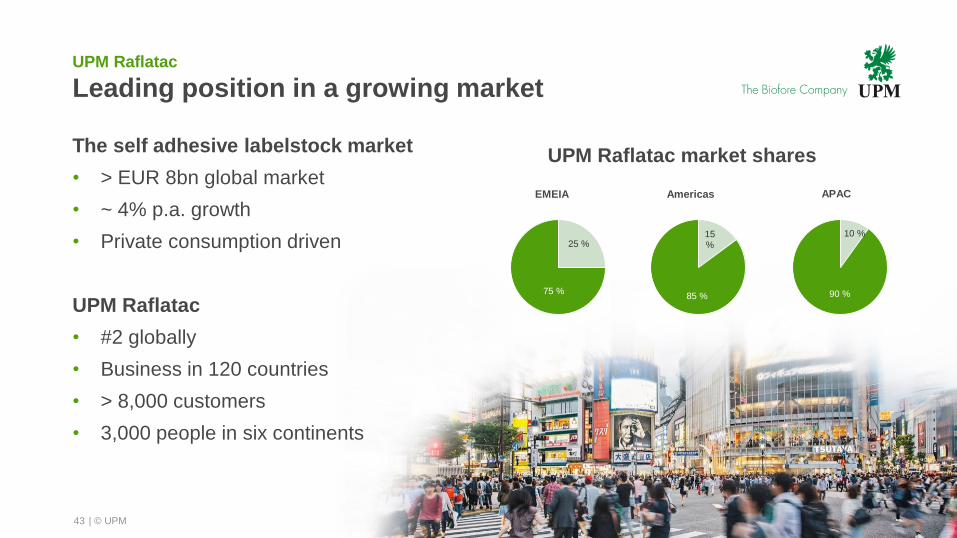
UPM Raflatac
Leading position in a growing market
The self adhesive labelstock market
• > EUR 8bn global market
• ~ 4% p.a. growth
• Private consumption driven
UPM Raflatac
• #2 globally
• Business in 120 countries
• > 8,000 customers
• 3,000 people in six continents
UPM Raflatac market shares
43
25 %
75 %
EMEIA
15 %
85 %
Americas
10 %
90 %
APAC
| © UPM
UPM Raflatac
Continuing growth
1. Capturing the market growth in the current
markets and product areas
2. Increased distribution coverage and
customer reach
3. Wider product portfolio
4. M&A when opportunities emerge
Enabled by scalable operating platform
& efficient investments
44
Tailored marketing
Population growth
ConsumerismProductivity
Single householdsReliability
Ease of usePackaged food
Private consumption
Label demandUrbanisation E-commerce
Retailing changes
Sustainability
Higher standard of living
Product safety
Regulation
Shelf-appeal
Differentiation

| © UPM45
UPM Specialty Papers
Focus on global Labelling materials,
Packaging in Europe and Office paper in APAC
OFFICE PAPER APACLABELLING MATERIAL PACKAGING

| © UPM
UPM Specialty Papers
Our end use markets are growing
46
OFFICE PAPER ASIALABELING MATERIAL PACKAGING
~$4 Bn~$58 Bn Mkt value~$12 Bn
Paper flexpack,
k tonnes
CASE: Siliconized release
liner market, 44 Bn m2
Asian cut size market,
million tonnesCAGR
5%
CAGR
2%
CAGR
2.5
%
South AmericaEurope MEANorth AmericaAsia
44
2014
60
2020E
9%
3%
2.5%
4%4%
2 370
2015
2 702
2020E
5%
0%
-
0,5%
3%
2%
2020E2015
3%
1%
0.6%
5%
-2%
CHN
JPN
KOR
SEA
AUS
OTH
6%4 6
5.2

| © UPM
Label49 %
Tapes13 %
Industrial11 %
Hygiene9 %
Food & bakery5 %
Graphic film5 %
Medical3 %
Envelope2 %
Others3 %
UPM Specialty Papers
Global release liner market: Applications
47
Product functions:
Release liner carries the adhesive
and face material
• Prevents the adhesive from sticking
permanently
• Important and often critical feature
of a layered construction
48.6 Bn m2
Source: AWA

| © UPM
UPM Paper ENA
Paper demand by end use – different trends
• Historically Home & Office end-use has been
the most resilient to structural changes
• Despite the digital alternatives personal preferences
(way of working and learning), regulation (archiving) and
lack of common standards have mitigated the change
• A moderate decline has taken place in Direct marketing end-use
• Paper based marketing is still recognized to be
the most effective medium for retailers and cataloguers
• Steady decline in Magazine Publishing circulation
and pagination, however number of titles increasing
• Publishers still rely heavily on the revenues from print
• Newspaper publishing being historically the most vulnerable
to structural changes but remarkable differences between countries
• Monetizing digital circulation for Magazines and Newspapers
continue to be challenging
48
Source: Euro-Graph
Newspaper publishing
Magazine publishing
Home & Office
Direct marketing
Book & Directories
10 Mt
7 Mt
6 Mt
6 Mt
2 Mt
Million tonnes

| © UPM49
UPM Paper ENA
Paper price vs. cash cost of marginal cost producer
2004 2005 2006 2007 2008 2009 2010 2011 2012 2013 2014 2015 2016 2017
EUR/t
Sources: PPI, RISI, Pöyry
Cash cost of a marginal producer
Price
| © UPM
400
500
600
700
800
900
1000
News SC LWC
WFC WFU
50
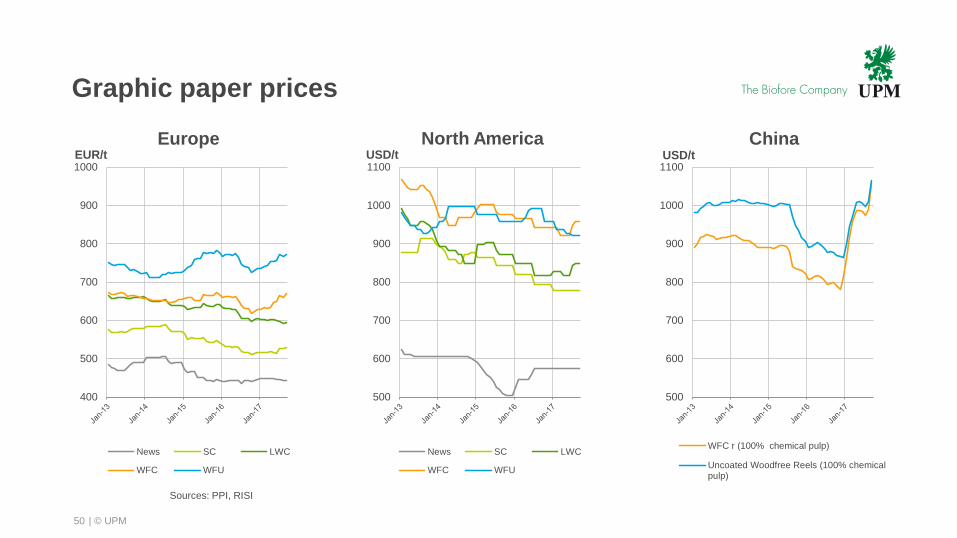
Graphic paper prices
EUR/t
EuropeUSD/t USD/t
ChinaNorth America
Sources: PPI, RISI
500
600
700
800
900
1000
1100
WFC r (100% chemical pulp)
Uncoated Woodfree Reels (100% chemicalpulp)
500
600
700
800
900
1000
1100
News SC LWC
WFC WFU

| © UPM
UPM Plywood
UPM Plywood in end-use
51
Construction Vehicle flooring LNG shipbuilding
| © UPM
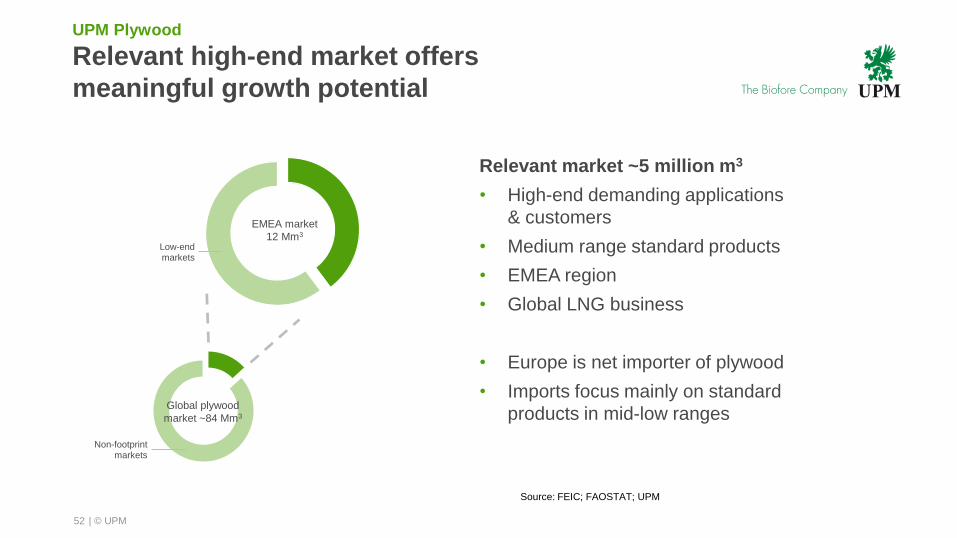
UPM Plywood
Relevant high-end market offers
meaningful growth potential
Low-end markets
EMEA market
12 Mm3
Relevant market ~5 million m3
• High-end demanding applications
& customers
• Medium range standard products
• EMEA region
• Global LNG business
• Europe is net importer of plywood
• Imports focus mainly on standard
products in mid-low ranges
52
Non-footprint markets
Global plywood
market ~84 Mm3
Source: FEIC; FAOSTAT; UPM

| © UPM
Biofuels and biochemicals are natural evolutionary
steps in wood based value creation
Sawn goods Plywood
Pulp, Paper
and Packaging
Label
Biofuels Biochemicals
Biocomposite
PUU
BIOMOLECULE
FIBER
TREE
LOG
Energy
EV
OL
UT
ION
O
F W
OO
D U
SA
GE
| © UPM53

| © UPM
2
%
BIOREFINERY PROCESS
Biochemicals biorefinery targeting to produce bio-
MEG, bio-MPG and lignin from hardwood
STEP 1: SUGAR PULPINGDisintegrating wood into sugars,
lignin and green energy
STEP 2: CHEMICAL CONVERSIONConversion of sugars into targeted
biochemicalsBio-Monoethylene
glycol (MEG)
Bio-Monopropylene
glycol (MPG)
GREEN
ENERGY
SUGARS
Lignin
40% Cellulose
30%Hemi-
cellulose
25%Lignin
BIOMASS
| © UPM54

| © UPM
Monopropylene glycol
LigninMono Ethylene Glycol
Biochemicals products are sustainable and competitive
drop-in alternatives for brand owners
Textiles
Bottles & Packaging
Deicing fluids
Mono Propylene Glycol
Composites
Pharma & Cosmetics
Detergents
Monopropylene glycol
Plastics
Wood resins
Existing fossil-based market
Market demand > 26 mio tons
CAGR >3%
Application examples:
Existing fossil-based market
Market demand >2 mio tons
CAGR >5%
Application examples:
Performance chemical
Application driven
Strong IP position
Application examples:
Foams & Coatings
bMEG bMPG
| © UPM55