Updates on our understanding of the impacts of land use and farming practices on biophysical...
50
the impacts of land use and farming practices on biophysical outcomes in the tropical uplands of Mindanao, the Philippines. D.J. Midmore 1 , A. Dano 2 , T.M. Nissen 3 , D.D. Poudel 4 and G. Zhu 1 .
-
Upload
estella-young -
Category
Documents
-
view
221 -
download
1
Transcript of Updates on our understanding of the impacts of land use and farming practices on biophysical...

Updates on our understanding of the impacts of land use and farming practices
on biophysical outcomes in the tropical uplands of Mindanao, the Philippines.
D.J. Midmore1, A. Dano2, T.M. Nissen3, D.D. Poudel4 and G. Zhu1.

Objectives: to link plot and water-shed level data on erosion, land management,
C sequestration and water quality.
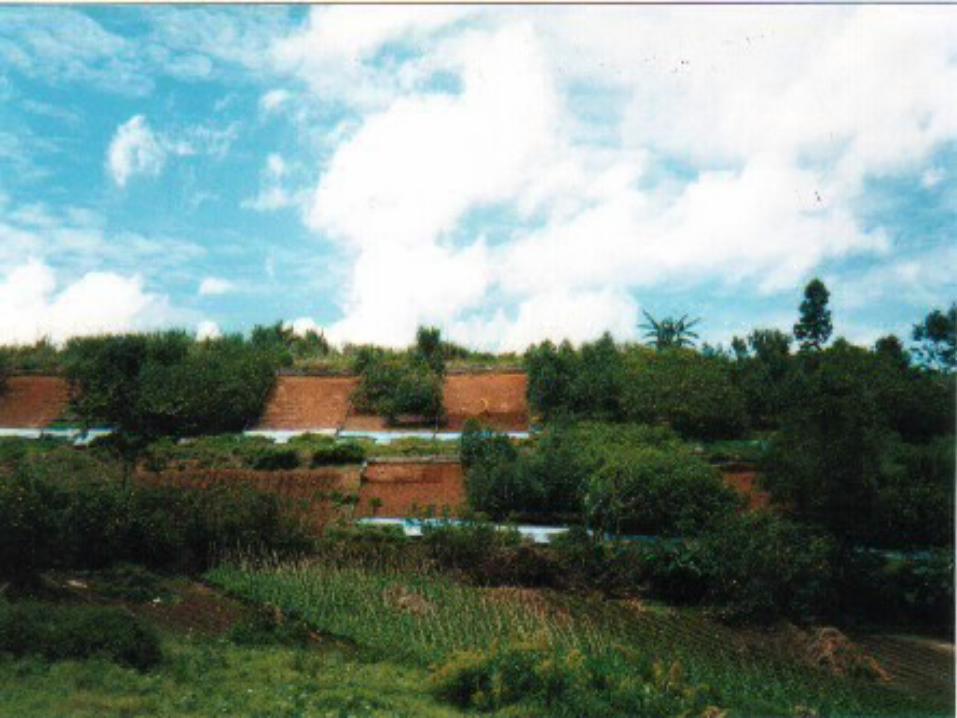
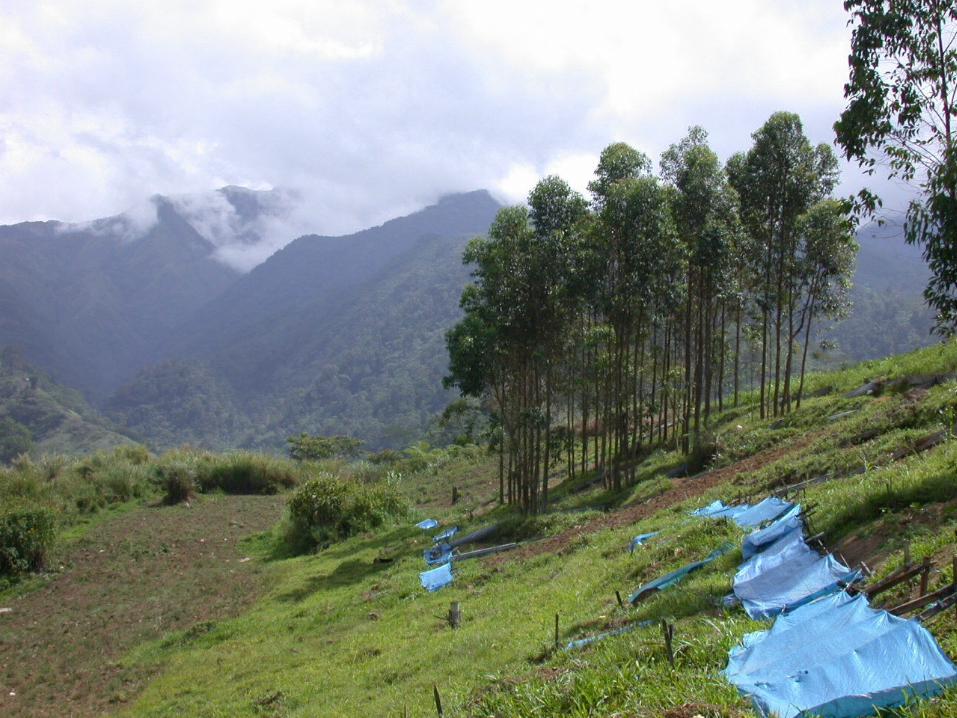
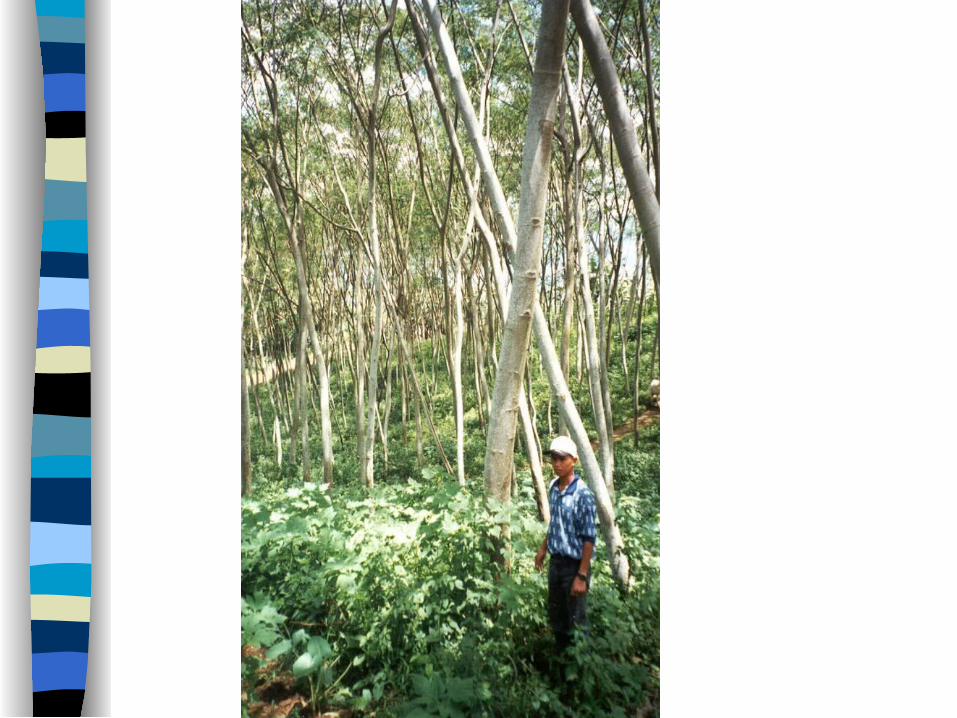
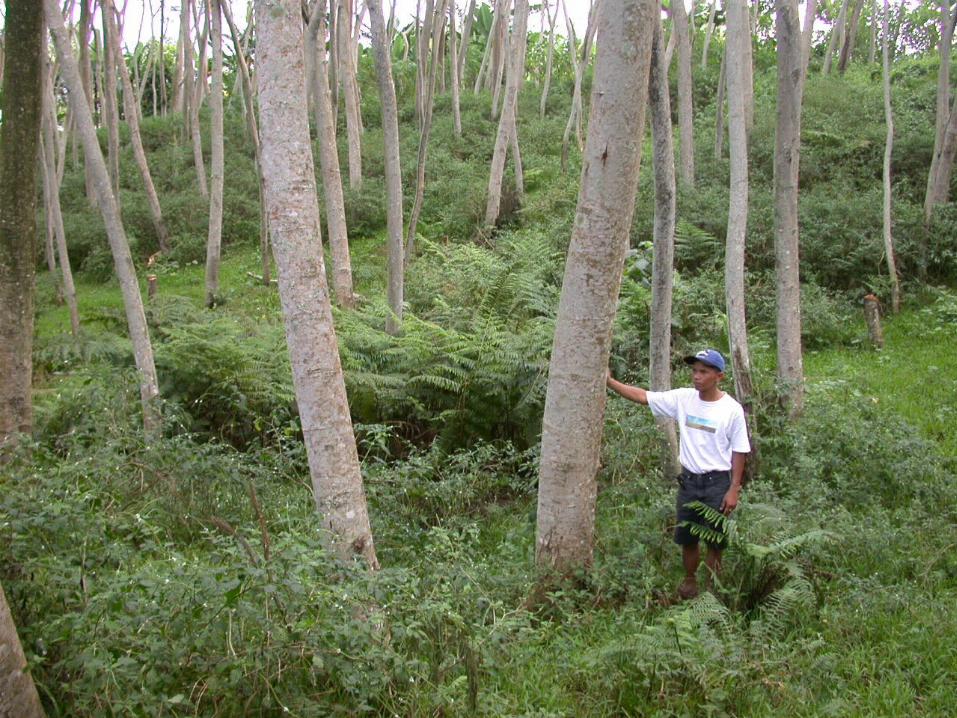
Major drawbacks: erosion data from 1 research location at 1 slope (c. 42%) and 12 farmer sites 20-62%, tree data from 3 locations all >1000 m asl
TSS measured monthly and few one-off pesticide data sets at plot and stream level.
No account for non-agricultural sources of erosion.


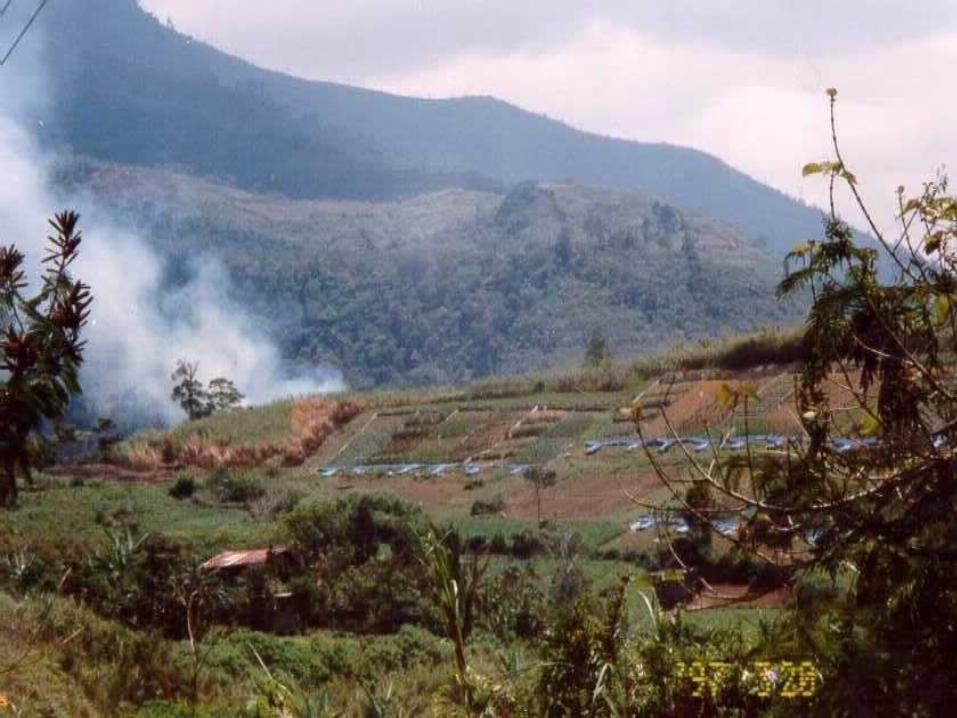
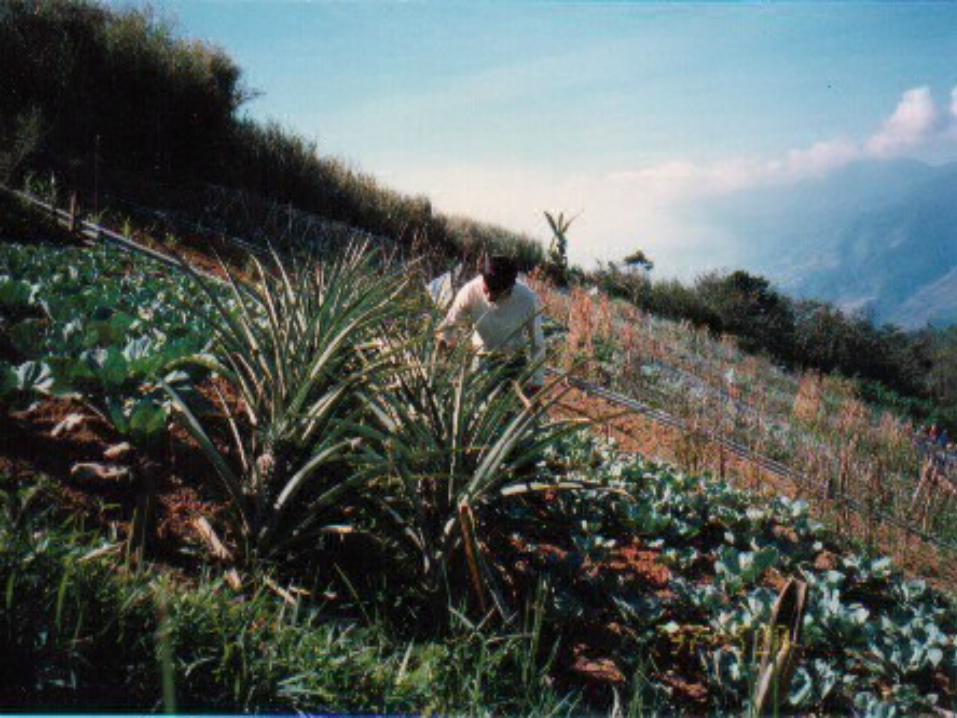
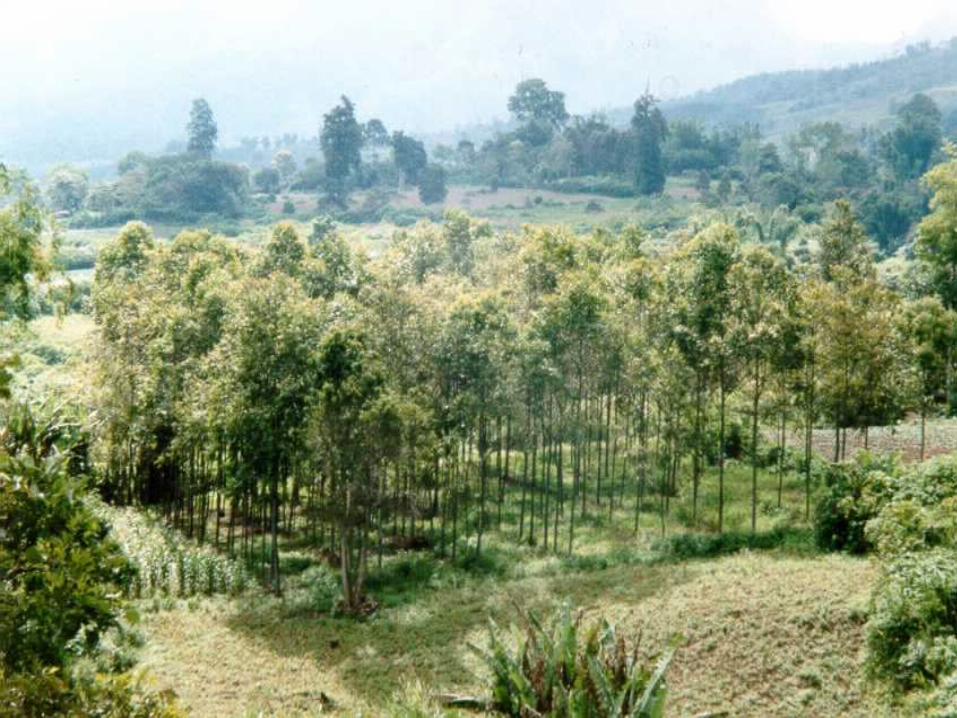
Approach (1) using Present data on land use at catchment
scale (1994, 2002) Erosion mitigation at plot level Tree biomass Potential and actual farm incomes Adjacent stream water quality Quantify adoption of new practices Try to link together through models

Approach (2)
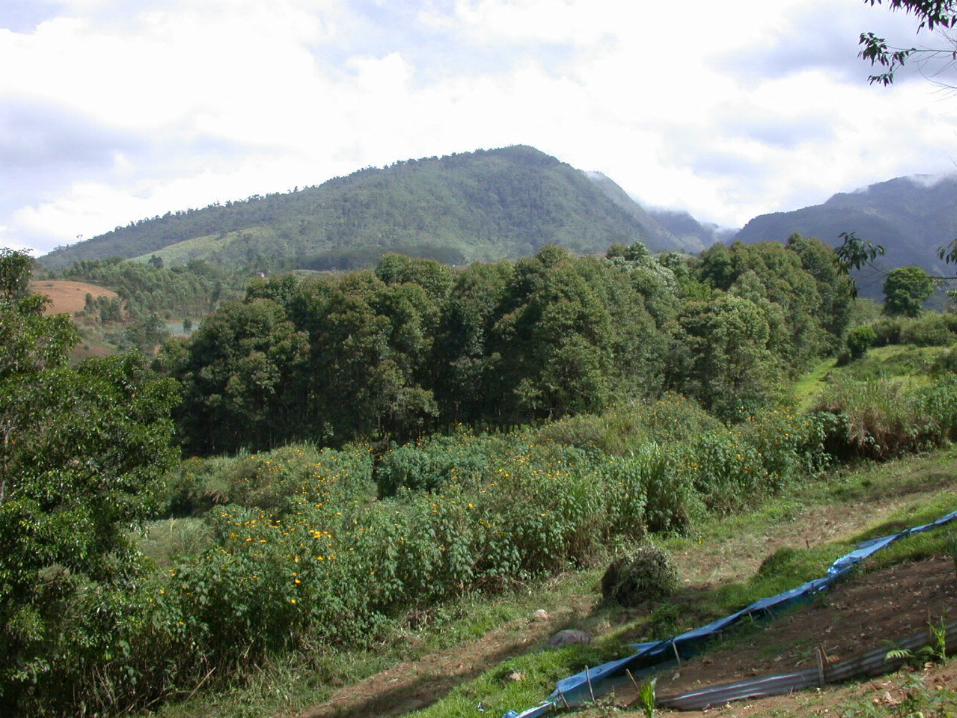
Compare adjacent similar micro-watersheds with quantified land use and data-rich in water quality/quantity.
Show obvious relationships between parameters.
Scale up erosion, rainfall, flow, {evaporation/drainage?} pesticide, tree biomass.
Watershed values for different land use scenarios
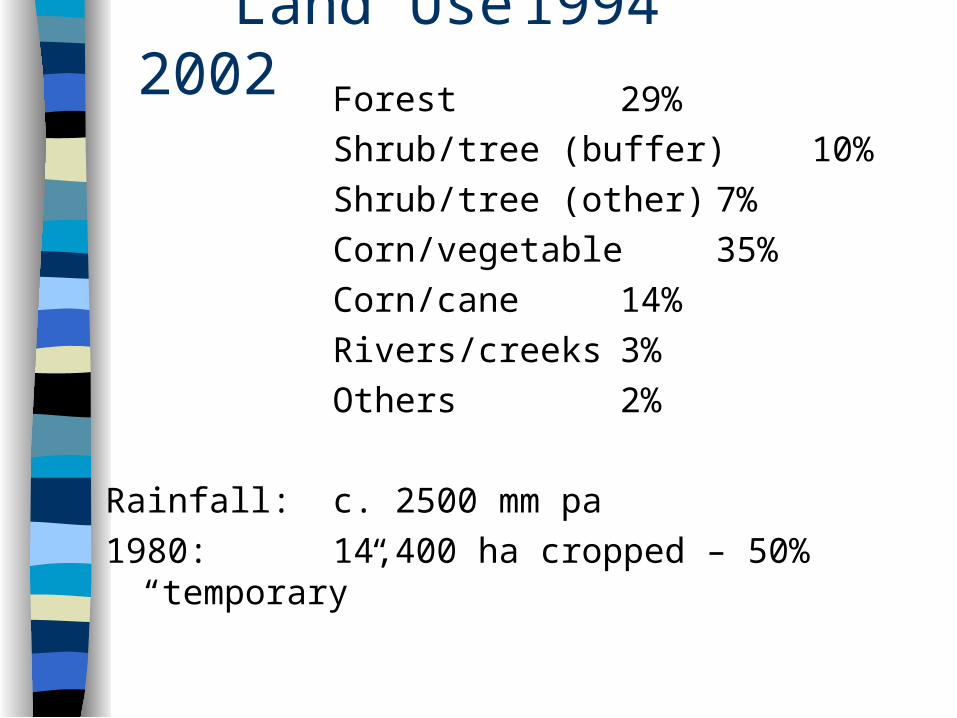
Land Use 1994 2002Forest 29%
Shrub/tree (buffer)10%
Shrub/tree (other) 7%
Corn/vegetable 35%
Corn/cane 14%
Rivers/creeks 3%
Others 2%
Rainfall: c. 2500 mm pa
1980: 14,400 ha cropped – 50% “temporary”
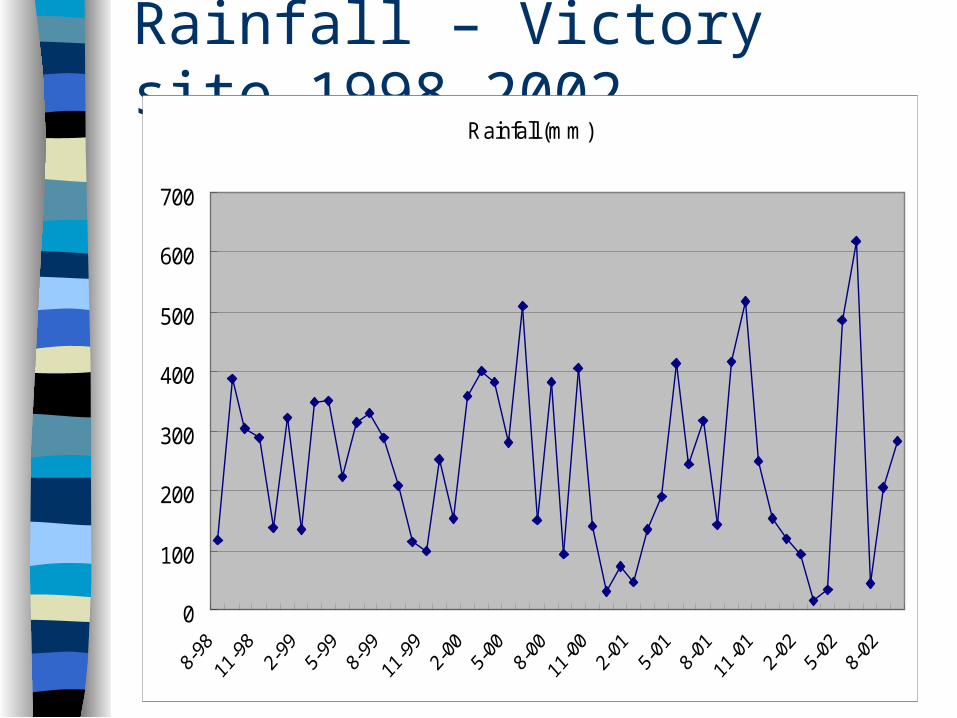
Rainfall – Victory site 1998-2002Rainfall (mm)
0
100
200
300
400
500
600
700

No relationship between TSS and monthly rainfall
Monthly rainfall (mm)
0 100 200 300 400 500 600 700
Mea
n T
SS
at t
he s
ame
perio
d
0
10
20
30
40
Montly rainfall (mm)
0 100 200 300 400 500 600 700
Mea
n T
SS
one
mon
th la
ter
0
10
20
30
40
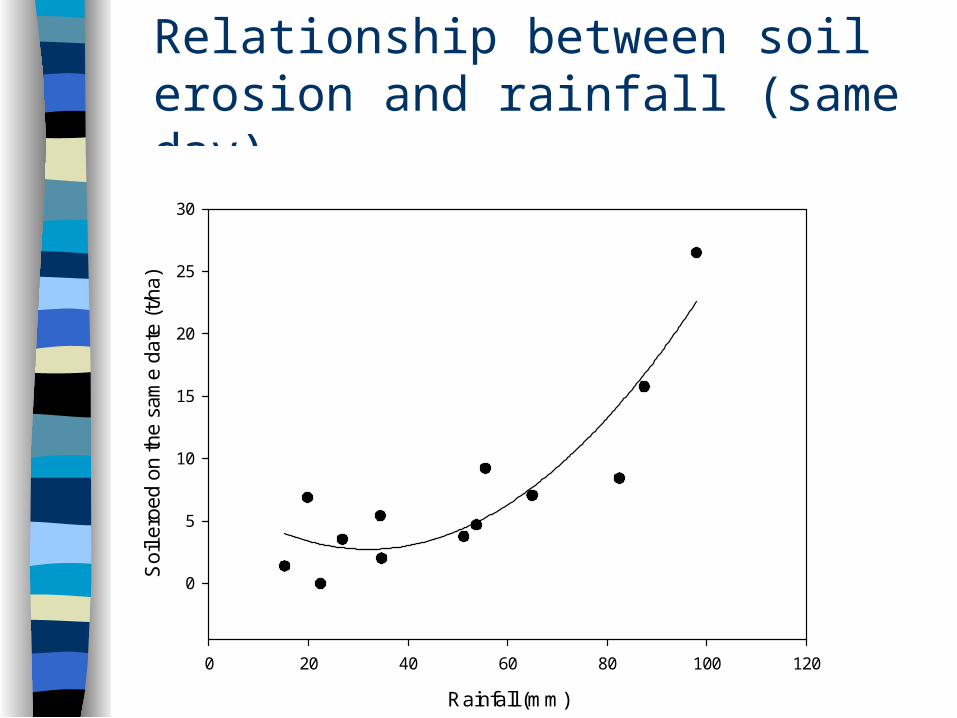
Relationship between soil erosion and rainfall (same day)
Rainfall (mm)
0 20 40 60 80 100 120
Soi
l ero
ed o
n th
e sa
me
date
(t/h
a)
0
5
10
15
20
25
30
Pic 23


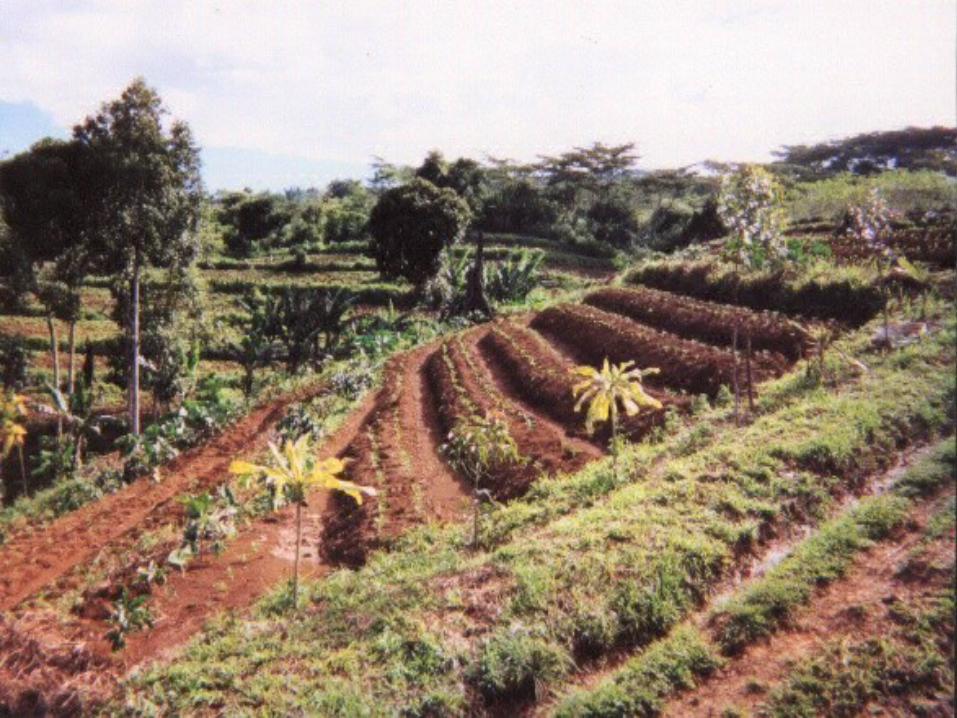
Production technologies, crops and erosion over seven seasons (1995/8)
t/ha/year Yield t/ha/ Yield t/ha/erosion season season
Up-down 65.3 a 9.8 Tomato 21.3 aContouring 37.8 b 11.8 Corn 15.1 bStrip-cropping 43.7 b 13.2 Cabbage 15.0 bhedgerows 45.4 b 8.9
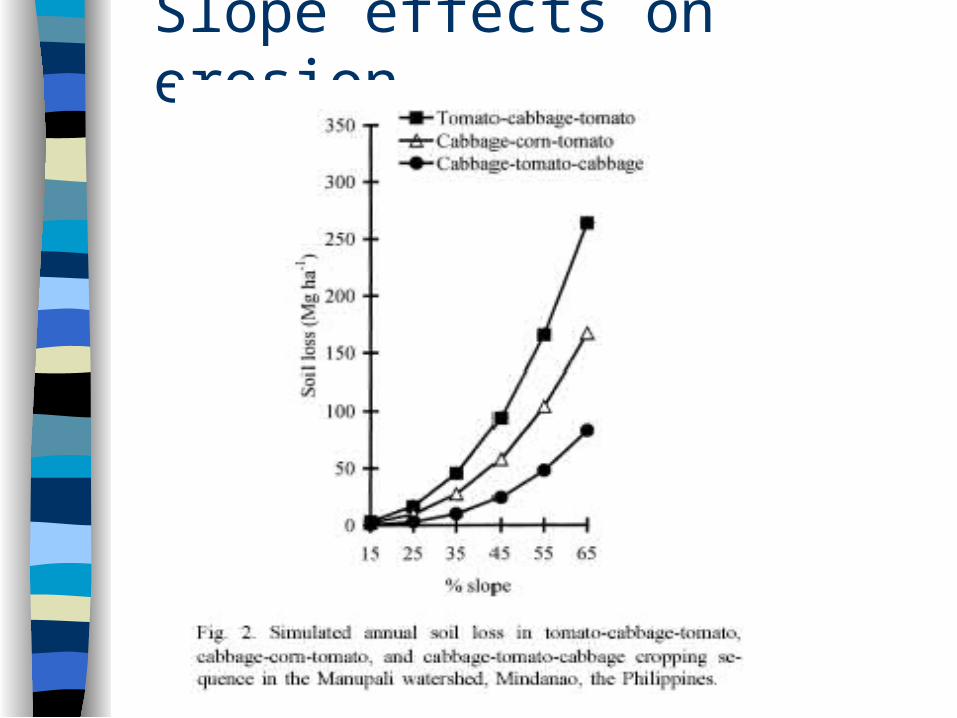
Slope effects on erosion


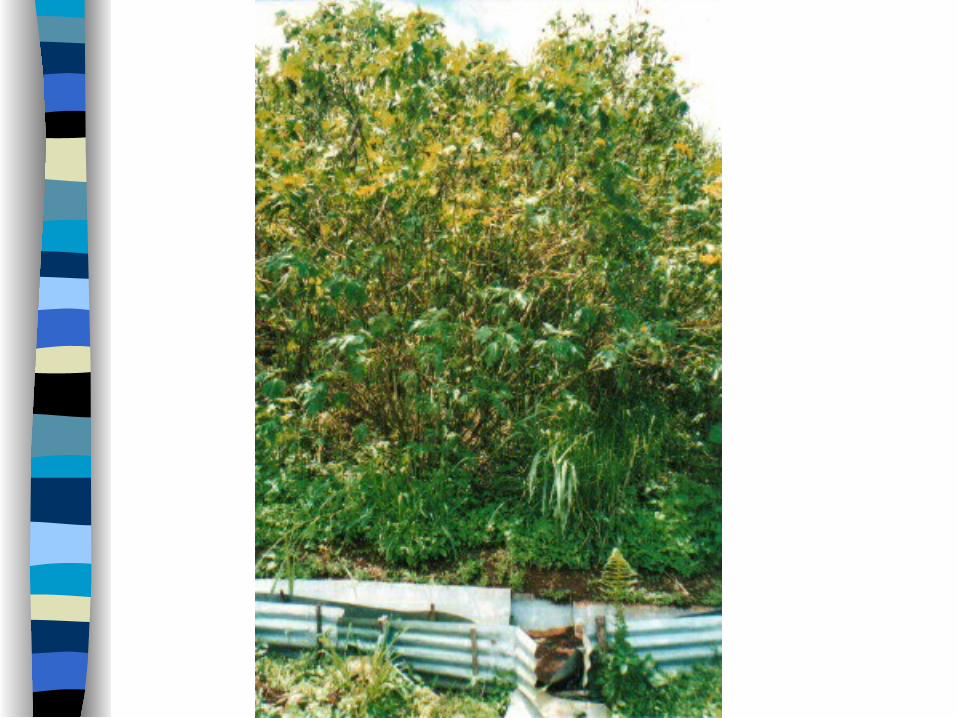

Agroforestry, liming and sunflower rotation – effects on erosion
Growing seasons
1 2 3 4 5 6 7 8 9 10
To
tal so
il e
rod
ed
(t/h
a)
0
5
10
15
20
25
30
35
Sunflower Tree only Veg lime Veg no lime Tree, veg & lime
a
b
c
a
a
b
a
a
b
b
a
a
b
a
a
b
a
a
b
a
a
a
b


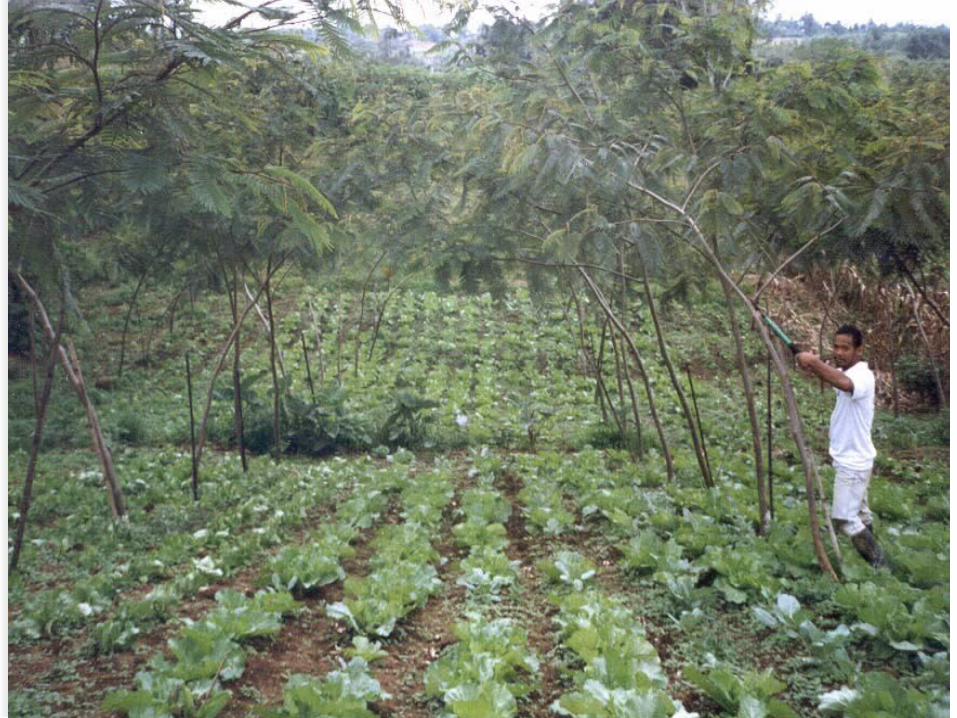
Comparisons of crop yield (t/ha) with different tillage systems and lime treatments across project period (1998-2002)
TreatmentsSeason Crop No lime With lime Trees and lime Following Sunflower1 Corn 3.22b 6.81a 5.42a --2 Fresh bean/cabbage 5.01a 10.60a 10.21a --3 Dry beans 2.49a 2.83a 2.07a --4 Fresh bean/cabbage 0 0.35 0 --5 Dry beans 0 0.34 0 --6 Corn 0.14a 0.36a -- --7 Cabbage 0 0 -- --8 Tomato 8.00a 6.40b -- 7.61a
Beans -- 1.77b -- 4.54a9 Corn 0.77b 2.87a -- 3.14a10 Cabbage --11 Tomato --

Reduction in annual crop yield by tree intercrop
Stand basal area (m2 ha-1)
0.0 0.2 0.4 0.6 0.8 1.0 1.2 1.4
Pre
ce
nt o
f re
fere
nce
yie
ld (
%)
0
20
40
60
80
100

Comparison of competitiveness between tree species and annual crops
%yield reduction/m2ha-1SBA
E. deglupta 1 18.2
E. torrelliana 1 12.5
P. falcataria 1 7.8
E. grandis 2 70.7
1Nissen and Midmore, 2002
2Current study, non-pruned, steeply sloping land.

Tree DBH, intercropped for five seasons
Measuring season
1-99 5- 8- 10- 12- 2- 4-00 6- 4- 6-01 11- 1- 6-02
Tre
e D
BH
(cm
)
0
5
10
15
20
Tree only Tree with veg. & lime a
b
a
b

Comparisons of crop yield (t/ha) with different tillage systems and lime treatments across project period (1998-2002)
TreatmentsSeason Crop No lime With lime Trees and lime Following Sunflower
1 Corn 3.22a 6.81a 5.42b --
2 Fresh bean/cabbage 5.01a 10.60a 10.21a --
3 Dry beans 2.49a 2.83a 2.07a --4 Fresh bean/cabbage 0 0.35 0 --5 Dry beans 0 0.34 0 --
6 Corn 0.14a 0.36a -- --7 Cabbage 0 0 -- --
8 Tomato 8.00a 6.40b -- 7.61a
Beans -- 1.77a -- 4.54b
9 Corn 0.77b 2.87a -- 3.14a
10 Cabbage --11 Tomato --

Comparison of soil chemical properties (0-15 cm) with different cropping systems (May 2001)
Treatments pH N (%) K C (%) Ca Mg(ppm) (Meq/100g) (Meq/100g)
Sunflower 5.02a 0.60a 207.38 5.32a 2.34 1.19aVegetables with lime 4.68b 0.52b 284.75 4.06b 2.17 0.55bVegetables no lime 4.71b 0.53a 309 3.57b 2.05 0.37bTrees, vegetable and lime 4.60b 0.47b 206.25 4.30ab 1.43 0.50bp 0.005 0.041 0.159 0.005 0.508 0.026
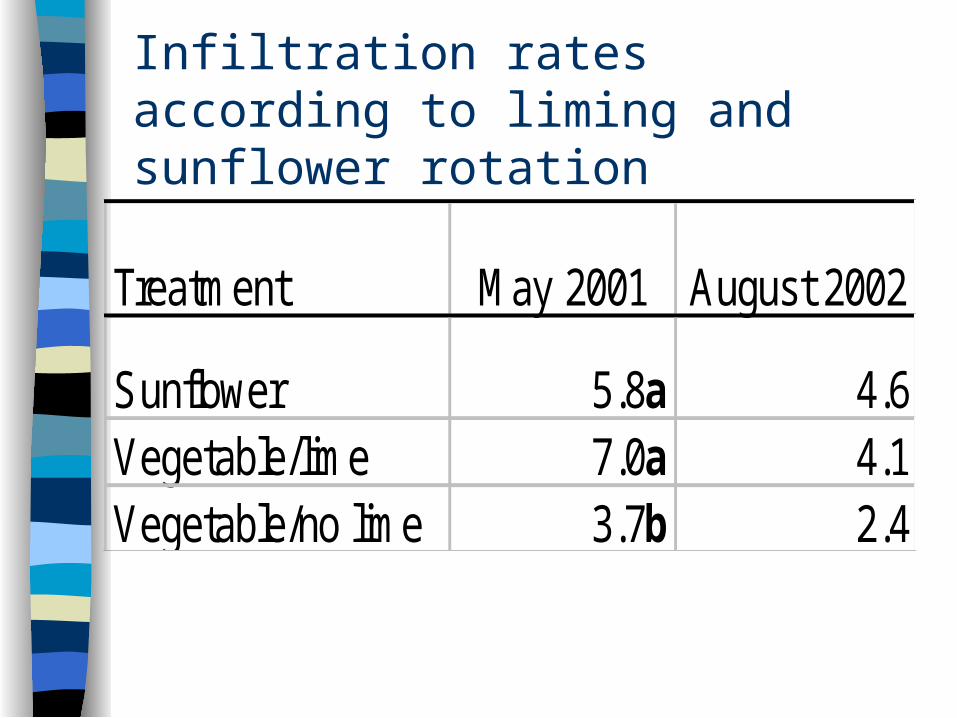
Infiltration rates according to liming and sunflower rotation
Treatment May 2001 August 2002
Sunflower 5.8a 4.6Vegetable/lime 7.0a 4.1Vegetable/no lime 3.7b 2.4


Stand basal area as affected by planting population and thinning
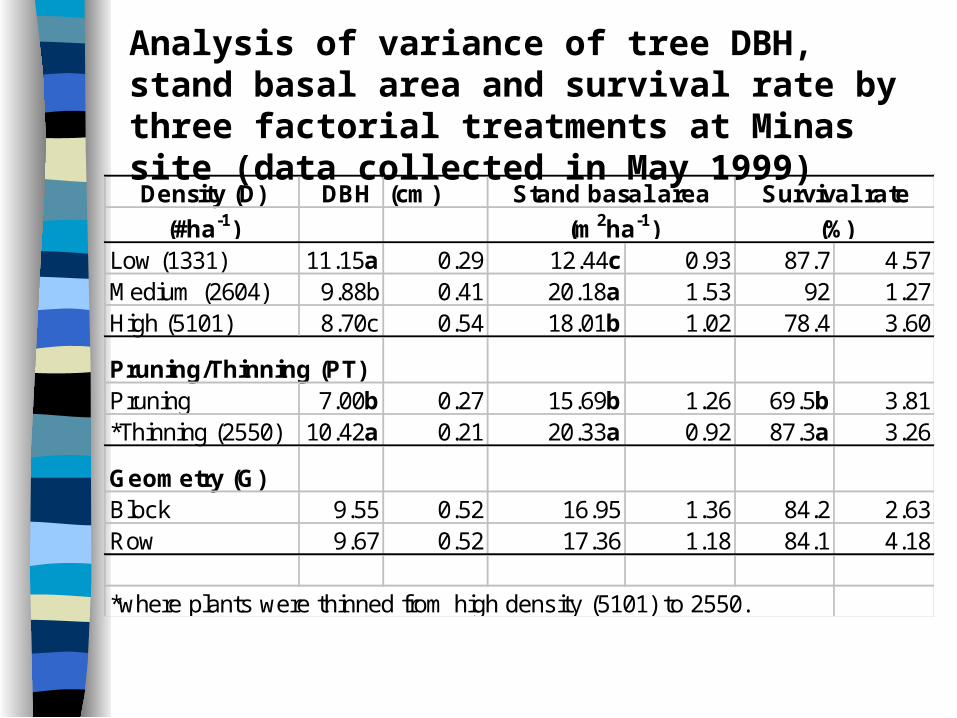
Analysis of variance of tree DBH, stand basal area and survival rate by three factorial treatments at Minas site (data collected in May 1999) Density (D) DBH (cm) Stand basal area Survival rate
(#ha-1) (m2ha-1) (%)Low (1331) 11.15a 0.29 12.44c 0.93 87.7 4.57Medium (2604) 9.88b 0.41 20.18a 1.53 92 1.27High (5101) 8.70c 0.54 18.01b 1.02 78.4 3.60
Pruning/Thinning (PT)Pruning 7.00b 0.27 15.69b 1.26 69.5b 3.81*Thinning (2550) 10.42a 0.21 20.33a 0.92 87.3a 3.26
Geometry (G)Block 9.55 0.52 16.95 1.36 84.2 2.63Row 9.67 0.52 17.36 1.18 84.1 4.18
*where plants were thinned from high density (5101) to 2550.

Analysis of variance of tree DBH, stand basal area and survival rate by three factorial treatments at Minas site (data collected December 2000)
Density (D) DBH (cm) Stand basal area Survival rate
(#ha-1) (m2ha-1) (%)Low (1331) 16.56a 0.5 24.08c 1.76 79.5 4.20Medium (2604) 13.86b 0.48 30.97a 2.31 72.8 4.42High (5101) 11.62c 0.64 28.17b 2.11 66.8 5.78Pruning/Thinning (PT)Pruning 9.84b 0.58 23.49b 2.43 51.0b 5.25*Thinning (2550) 13.4a 0.43 32.85a 2.24 82.5a 4.51Geometry (G)Block 13.19 0.75 28.07 1.88 73.8 4.19Row 13.64 0.83 27.62 1.98 69.2 5.33
*where plants were thinned from high density (5101) to 2550.

Analysis of variance of tree DBH, stand basal area and survival rate by three factorial treatments at Minas site (data collected June 2002)
Density (D) DBH (cm) Stand basal area Survival rate
(#ha-1) (m2ha-1) (%)Low (1331) 20.69a 0.54 37.16 3.12 77.3b 3.87Medium (2604) 17.87c 0.24 41.1 3.2 59.5c 4.20High (5101) 18.35b 0.5 35.69 3.2 65.2a 3.26Pruning/Thinning (PT)Pruning 14.64b 0.89 29.26b 4.01 30.5b 3.53*Thinning (2550) 16.90a 0.54 44.58a 3.37 69.8a 6.40Geometry (G)Block 18.68 0.48 41.07 3.68 68.5 3.82Row 18.39 0.58 38.18 3.88 66.1 3.51
*where plants were thinned from high density (5101) to 2550.

Analysis of variance of harvested board-foot by three factorial treatments at Minas site (data collected July 2003)
Density (D) Board-foot
(#ha-1) Mean seLow (1331) 31.4 6.2Medium (2604) 36.3 5.8High (5101) 36 4.3
Pruning/Thinning (PT)Prunning 36.4 4.3*Thinning (2550) 35.6 4.6
Geometry (G)Block 32.7 6.2Row 37.6 2.4
*where plants were thinned from high density (5101) to 2550.

Relationship between harvest board foot and tree volume (per tree basis)
Tree volume (m3*10-2)
5 10 15 20
Bdf
t
0
10
20
30
40
50
60

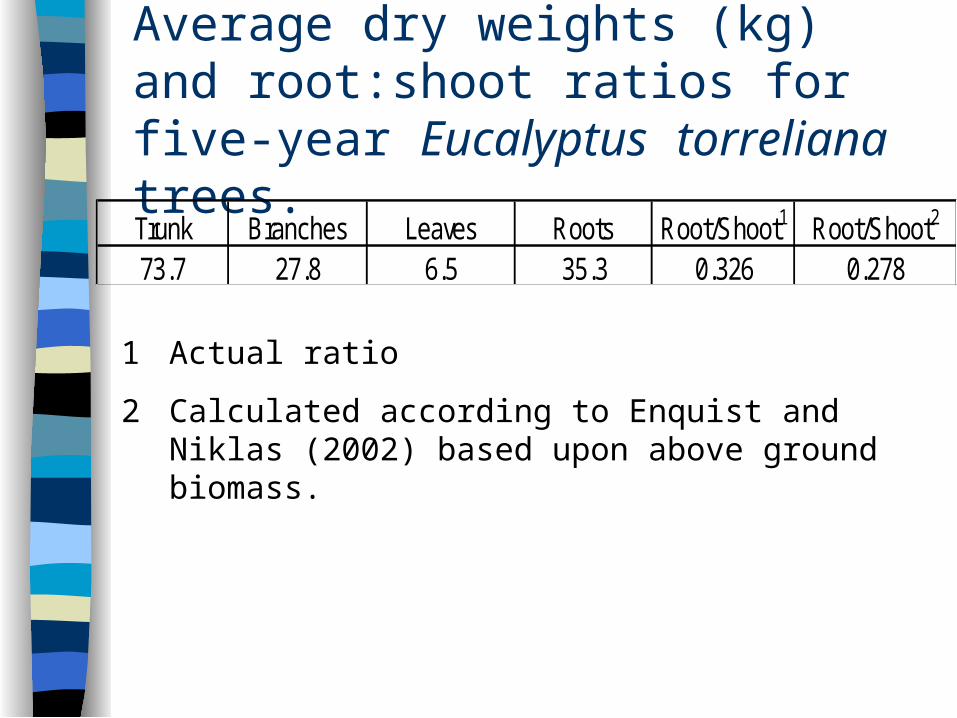
Average dry weights (kg) and root:shoot ratios for five-year Eucalyptus torreliana trees.Trunk Branches Leaves Roots Root/Shoot1 Root/Shoot2
73.7 27.8 6.5 35.3 0.326 0.278
1 Actual ratio
2 Calculated according to Enquist and Niklas (2002) based upon above ground biomass.
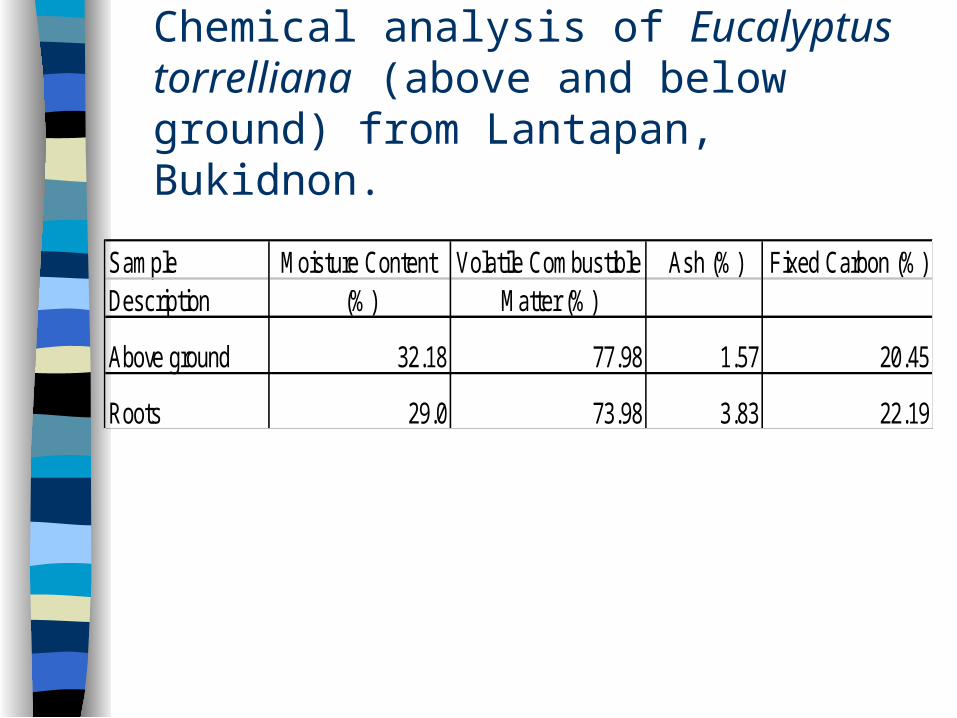
Chemical analysis of Eucalyptus torrelliana (above and below ground) from Lantapan, Bukidnon.
Sample Moisture Content Volatile Combustible Ash (%) Fixed Carbon (%)Description (%) Matter (%)
Above ground 32.18 77.98 1.57 20.45
Roots 29.0 73.98 3.83 22.19


Some conclusions: Quite marked differences for erosion rates
due to crop management practices Need to incorporate into model scenarios Tree canopy cover not so good at erosion
control, needs ground contact of understorey vegetation
Early differences in tree population do not result in different harvestable timber, choosing best trees improves SBA at harvest
Actual C sequestration above and below ground in line with model predictions
Much data still to collate, share, incorporate, utilise for rounding off research activity.
Thanks to all for past and future cooperation