
Updated Oracle OBIEE Tuning Guide v1 Dec2012
56
1 Disclaimer: All tuning information stated in this guide is only for orientation, every modification has to be tested and its impact should be monitored and analyzed. Before implementing any of the tuning settings, it is recommended to carry out end to end performance testing that will also include to obtain baseline performance data for the default configurations, make incremental changes to the tuning settings and then collect performance data. Otherwise it may worse the system performance. Best Practices Guide for Infrastructure Tuning Oracle® Business Intelligence Enterprise Edition 11g Release 1 (11.1.1.5, 11.1.1.6) An Oracle® White Paper December 2012 Change Record Date Primary Author Version Change Reference 12/2012 Ahmed Awan (Product Assurance Engineering) 3.0 Revised edition
-
Upload
siva-valmiki -
Category
Documents
-
view
292 -
download
0
Transcript of Updated Oracle OBIEE Tuning Guide v1 Dec2012

1
Disclaimer:
All tuning information stated in this guide is only for orientation, every modification has
to be tested and its impact should be monitored and analyzed.
Before implementing any of the tuning settings, it is recommended to carry out end to
end performance testing that will also include to obtain baseline performance data for
the default configurations, make incremental changes to the tuning settings and then
collect performance data. Otherwise it may worse the system performance.
Best Practices Guide for Infrastructure Tuning
Oracle® Business Intelligence Enterprise Edition 11g Release 1 (11.1.1.5, 11.1.1.6)
An Oracle® White Paper
December 2012
Change Record
Date Primary Author Version Change Reference
12/2012 Ahmed Awan (Product Assurance Engineering)
3.0 Revised edition

2
TABLE OF CONTENTS
INTRODUCTION ................................................................................................................................ 3
1.0 PERFORMANCE OVERVIEW ................................................................................................ 3
1.1 INTRODUCTION TO ORACLE® BUSINESS INTELLIGENCE EE PERFORMANCE....................... 3 1.2 PERFORMANCE TERMINOLOGY ............................................................................................ 3 1.3 UNDERSTANDING KEY PERFORMANCE DRIVERS ................................................................. 4
2.0 TOP TUNING RECOMMENDATIONS FOR OBIEE ........................................................... 5
2.1 TUNE OPERATING SYSTEMS PARAMETERS ............................................................................... 6 2.1.1 Linux Tuning Parameters ................................................................................................ 6 2.1.2 Windows 2008 Tuning Parameters ................................................................................. 7 2.1.3 Windows 2003 Tuning Parameters ................................................................................. 8 2.1.4 AIX Tuning Parameters .................................................................................................. 9 2.1.5 Oracle® Sun Solaris Tuning Parameters ...................................................................... 11
2.2 TUNE ORACLE® WEBLOGIC SERVER (WLS) PARAMETERS ................................................... 13 2.3 TUNE 64BIT JAVA VIRTUAL MACHINES (JVM) ...................................................................... 18
2.3.1 Tuning 64bit JRockit JVM ............................................................................................. 18 2.3.2 Tuning 64bit Sun JVM .................................................................................................. 20 2.3.3 Tuning 64bit IBM JVM ................................................................................................. 21
2.4 TUNE 32BIT JAVA VIRTUAL MACHINES (JVM) ...................................................................... 22 2.4.1 Tuning 32bit JRockit JVM ............................................................................................. 22 2.4.2 Tuning 32bit Sun JVM .................................................................................................. 22
2.5 TUNE HTTP SERVER PARAMETERS ........................................................................................ 23 2.5.1 IIS 7.0+ HTTP Server Tuning ....................................................................................... 23 2.5.2 Oracle® HTTP Server (OHS) Tuning .......................................................................... 25
2.6 TUNE HTTP SERVER COMPRESSION / CACHING ..................................................................... 26 2.6.1 Oracle® HTTP Server (OHS) ....................................................................................... 27 2.6.2 IIS 7.0+ HTTP Server .................................................................................................... 29 2.6.3 IIS 6.0 HTTP Server ...................................................................................................... 31 2.6.4 Apache 2.2.x HTTP Server ............................................................................................ 33 2.6.5 Oracle® iPlanet HTTP Server ....................................................................................... 34
2.7 TUNE ORACLE® DATABASE PARAMETERS ............................................................................ 35
3.0 PERFORMANCE MONITORING OBIEE ........................................................................... 35
3.1 BUILT-IN BI METRICS FOR PERFORMANCE MONITORING ...................................................... 35 3.2 PERFORMANCE MONITORING IN WINDOWS ENVIRONMENT ................................................... 39 3.3 PERFORMANCE MONITORING IN UNIX ENVIRONMENT .......................................................... 41
4.0 TUNING OBIEE COMPONENTS .......................................................................................... 43
4.1 ORACLE® BI PRESENTATION SERVICES COMPONENT ........................................................... 43 4.2 ORACLE® BI SERVER COMPONENT ........................................................................................ 47
5.0 TUNING ORACLE® ESSBASE ............................................................................................. 52
5.1 ESSBASE ASO TUNING............................................................................................................ 52

3
INTRODUCTION
This document is written for people who monitor performance and tune the
components in a BI environment. It is assumed that readers know server
administration, Oracle® Fusion Middleware (FMW), hardware performance tuning
fundamentals, web servers, java application servers and database.
1.0 PERFORMANCE OVERVIEW This chapter discusses performance and tuning concepts for Oracle® Business
Intelligence Enterprise Edition. This chapter contains the following sections:
1.1 Introduction to Oracle® Business Intelligence EE System Performance
1.2 Performance Terminology
1.3 Understanding Key Performance Drivers
1.1 Introduction to Oracle® Business Intelligence EE Performance To maximize Oracle® Business Intelligence Enterprise Edition performance, you
need to monitor, analyze, and tune all the Fusion Middleware / BI components. This
guide describes the tools that you can use to monitor performance and the
techniques for optimizing the performance of Oracle® Business Intelligence
Enterprise Edition components.
1.2 Performance Terminology This guide uses the following performance terminologies:
Scalability
o System's ability to perform within specification under increasing
user load, data load and hardware expansion.
Latency
o Time between the issuing of a request and the time when the work
actually begins on the request.
Think time
o The time a real user pauses to think between actions.
Resource utilization
o A consumption metric, for example, the percent of CPU usage.
Response time
o A time metric, for example round-trip time it takes the server to
deliver a Web page.

4
Throughput
o A rate metric (requests per unit of time), for example, requests per
second, bits per second. For example, if an application can handle
20 customer requests simultaneously and each request takes one
second to process, this site has a potential throughput of 20
requests per second.
1.3 Understanding Key Performance Drivers To optimize your deployment, you must understand the elements that influence
performance and scalability. A factor that dictates performance is called a key
performance driver. Knowing how the drivers behave in combination further
enhances your ability to deploy Oracle® Business Intelligence Enterprise Edition
optimally, based on the unique requirements of each deployment.
- Hardware Capacity - Factors such as number of servers, quantity and speed
of processors, available RAM, network speed etc.
- Technical Platforms Tuning – Fine tuning other third party software
required for installing and running Oracle® Business Intelligence Enterprise
Edition product; for example: relational databases, Java application servers,
Web servers, Server / Client Operating System and browsers.
- Business Application Design - Application design is an important factor in
OBIEE system performance i.e. structure, size, and use of product / custom
features in designing reports and dashboards etc.
- Business process usage - Activities carried out by users in the normal flow of
your business cycle.
o Business process usage has three components:
User activity—Activities available to users for reporting and
analysis.
Rate of user activity – A number of transactions executed by one
user per one hour.
User concurrency—Number of users for each activity being carried
out simultaneously.

5
2.0 TOP TUNING RECOMMENDATIONS FOR OBIEE Performance tuning Oracle® Business Intelligence Enterprise Edition is a complex
iterative process, care needs to be taken to have appropriate backups, proceed
incrementally and thoroughly test with each incremental change.
To get you started, we have created a list of recommendations to help you optimize
your Oracle® Business Intelligence Enterprise Edition performance.
This chapter includes the following sections that provide a quick start for
performance tuning Oracle® Business Intelligence Enterprise Edition infrastructure.
2.1 Tune Operating Systems parameters.
2.2 Tune Oracle® WebLogic Server (WLS) parameters.
2.3 Tune 64bit Java Virtual Machines (JVM).
2.4 Tune 32bit Java Virtual Machines (JVM).
2.5 Tune HTTP Server parameters.
2.6 Tune HTTP Server Compression / Caching.
2.7 Tune Oracle® Database Parameters.
Note: While the list in each of the above stated section is a useful tool in starting
your performance tuning, it is not meant to be comprehensive list of areas to tune.
You must monitor and track specific performance issues within your Business
Intelligence Enterprise Edition dashboards / reports design to understand where
tuning can improve performance.

6
2.1 Tune Operating Systems parameters Proper OS tuning might improves system performance by preventing the occurrence
of error conditions. Operating system error conditions always degrade performance.
The following sections describe issues related to operating system performance:
2.1.1 Linux Tuning Parameters
This topic describes how to tune the Linux operating system to optimize the
performance of your Oracle® Business Intelligence Enterprise Edition.
Linux Parameter Default Value Suggested Value
tcp_fin_timeout
By reducing the value of this entry, TCP/IP can release
closed connections faster, providing more resources for new
connections. Consult your Linux (OEL / RHEL / SLES)
documentation for more information on how to
permanently change the value for this parameter.
60 30
File descriptors (open files)
If WebLogic Server Administration Server reports a Too
Many Open Files error message on the Enterprise Manager
(EM) console when the maximum number of file descriptors
configured for the Administration Server is less than 8192 on
32bit OS and 65535 on 64bit OS.
Important Note: When you increase the soft limit, make
sure to increase the hard limit as well. The hard limit is the
maximum value which can be reached before the user gets
the error messages Out of file handles.
Consult your Linux (OEL / RHEL / SLES) documentation for
more information on how to permanently change the value
for this parameter.
1024 8192 (x86 32bit)
65535 (x86 64bit)
Backlog connections queue (tcp_max_syn_backlog)
When the server is heavily loaded or has many clients with
bad connections with high latency, it can result in an
increase in half-open connections.
Consult your Linux (OEL / RHEL / SLES) documentation for
more information on how to permanently change the value
for this parameter.
1024 4096
For more information about Linux tuning, you should consult your Linux
documentation. Note the above TCP/kernel tunable parameters and their
corresponding values are provided as examples and rough guidelines only. You can
re-adjust these and other parameters based on actual system load, usage patterns
such as the number of concurrent users and sessions and so on.
7
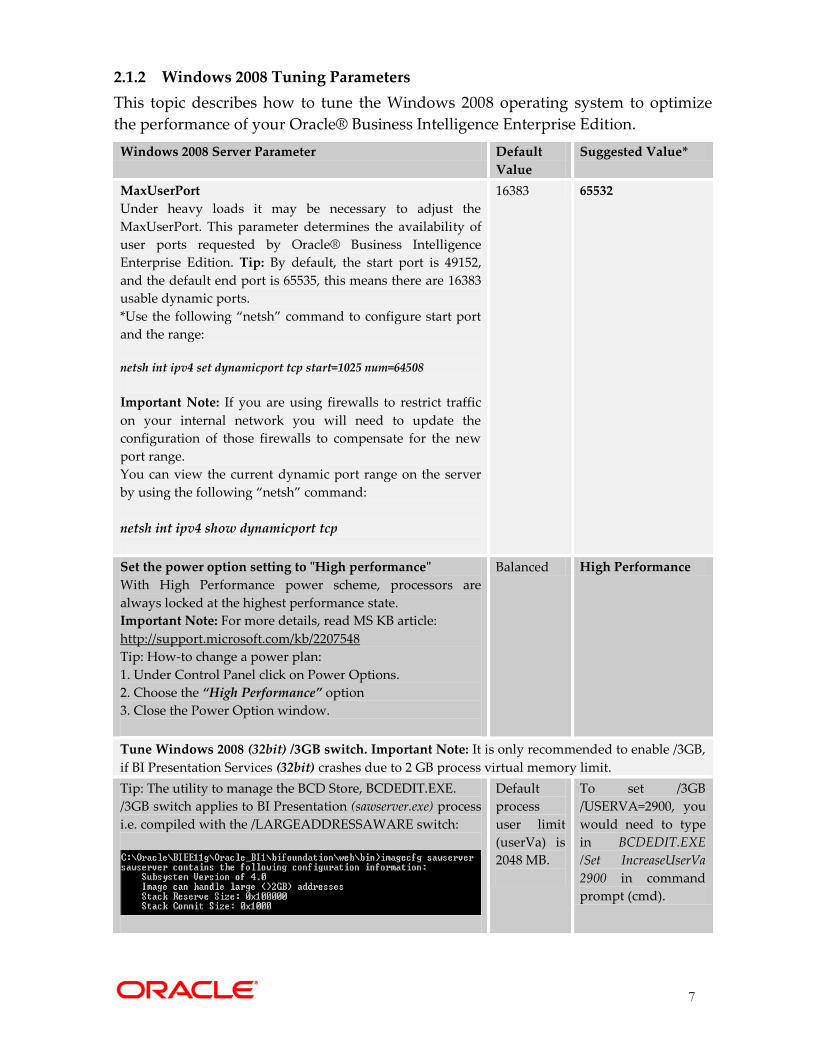
2.1.2 Windows 2008 Tuning Parameters
This topic describes how to tune the Windows 2008 operating system to optimize
the performance of your Oracle® Business Intelligence Enterprise Edition.
Windows 2008 Server Parameter Default
Value
Suggested Value*
MaxUserPort
Under heavy loads it may be necessary to adjust the
MaxUserPort. This parameter determines the availability of
user ports requested by Oracle® Business Intelligence
Enterprise Edition. Tip: By default, the start port is 49152,
and the default end port is 65535, this means there are 16383
usable dynamic ports.
*Use the following “netsh” command to configure start port
and the range:
netsh int ipv4 set dynamicport tcp start=1025 num=64508
Important Note: If you are using firewalls to restrict traffic
on your internal network you will need to update the
configuration of those firewalls to compensate for the new
port range.
You can view the current dynamic port range on the server
by using the following “netsh” command:
netsh int ipv4 show dynamicport tcp
16383 65532
Set the power option setting to "High performance"
With High Performance power scheme, processors are
always locked at the highest performance state.
Important Note: For more details, read MS KB article:
http://support.microsoft.com/kb/2207548
Tip: How-to change a power plan:
1. Under Control Panel click on Power Options.
2. Choose the “High Performance” option
3. Close the Power Option window.
Balanced High Performance
Tune Windows 2008 (32bit) /3GB switch. Important Note: It is only recommended to enable /3GB,
if BI Presentation Services (32bit) crashes due to 2 GB process virtual memory limit.
Tip: The utility to manage the BCD Store, BCDEDIT.EXE.
/3GB switch applies to BI Presentation (sawserver.exe) process
i.e. compiled with the /LARGEADDRESSAWARE switch:
Default
process
user limit
(userVa) is
2048 MB.
To set /3GB
/USERVA=2900, you
would need to type
in BCDEDIT.EXE
/Set IncreaseUserVa
2900 in command
prompt (cmd).

8
2.1.3 Windows 2003 Tuning Parameters
This topic describes how to tune the Windows 2003 operating system to optimize
the performance of your Oracle® Business Intelligence Enterprise Edition.
Parameter Default Value Suggested Value
TcpTimedWaitDelay
This parameter controls the amount of time the OS waits to
reclaim a port after an application closes a TCP connection,
has a default value of 4 minutes. During a heavy users load,
these limits may be exceeded resulting in an address in use:
connect exception.
Tip: In registry set this parameter using following:
HKLM\System\CurrentControlSet\Services\Tcpip\Parameters
Value: TcpTimedWaitDelay
Value Type: dword
Data: 30 (decimal)
240 30
MaxUserPort
The number of user-accessible ephemeral ports that can be
used to source outbound connections is configurable using
this parameter.
Tip: In registry set this parameter using following:
HKLM\System\CurrentControlSet\Services\Tcpip\Parameters
Value: MaxUserPort
Value Type: dword
Data: 65534 (decimal)
5000 65534
Tune Windows 2003 (32 bit) /3GB switch
Important Note: It is only recommended to enable /3GB, if BI Presentation Services (32bit)
crashes due to 2 GB process virtual memory limit. Using the /3GB switch allocates 1 GB to the
kernel and 3 GB to the User-mode space. Therefore it is strongly recommended to implement
following settings when /3GB switch is applied, in order to make sure OBIEE and Windows
stability:
1. Using a range of memory for the /userva=xxxx switch that is within the range of 2900 to 3030 .
The following sample boot.ini file demonstrates how to use the new switch to tune a server to
allocate 2,900 MB of User-mode virtual memory and 1,196 MB of Kernel-mode virtual memory.
This increases the available kernel space by 172 MB:
[boot loader]
timeout=30
default=multi(0)disk(0)rdisk(0)partition(1)\WINDOWS
[operating systems]
multi(0)disk(0)rdisk(0)partition(1)\WINDOWS="Windows Server 2003, Enterprise" /fastdetect
/NoExecute=OptOut /3GB /Userva=2900
2. Increase the SystemPages in registry: The setting being updated controls the allocable memory
for the operational system caches, file caches among others, and the value being set will tell
Windows to calculate the value itself on the side of the maximum allocable resources. HKEY_LOCAL_MACHINE\SYSTEM\CurrentControlSet\Control\Session Manager\Memory Management
Open the Data: SystemPages
Enter its new value (hex): FFFFFFFF
3. After applying above settings, reboot the server.

9
2.1.4 AIX Tuning Parameters
This topic describes how to tune the AIX (6.1 / 7.1) operating system to optimize the
performance of your Oracle® Business Intelligence Enterprise Edition. AIX Parameter Default Value Suggested Value
tcp_timewait
By reducing the value of this entry, TCP/IP can
release closed connections faster, providing more
resources for new connections. Tip: Set using command no -r -o tcp_timewait=1
1 1
tcp_keepidle
KeepAlive packet ensures that a connection stays in
an active/ESTABLISHED state. Tip: Set using command no -r -o tcp_keepidle=600
14400
(2 hours)
600
(5 minutes)
tcp_keepintvl
Specifies the interval between packets that are sent to
validate the connection. Tip: Set using command no -r -o tcp_keepintvl=10
150 10
tcp_keepinit
Specifies the initial timeout value for TCP
connection. Tip: Set using command no -r -o tcp_keepinit=40
150 40
Listen Backlog
Increase this to handle peak incoming connection
rates under heavy load. Tip: Set using command no -r -o somaxconn=8192
1024 8192
Socket send buffer size Tip: Set using command no -r -o tcp_sendspace=16384
16384 For optimal value for your
Ethernet adapter, consult
IBM support.
Socket receive buffer size Tip: Set using command no -r -o tcp_recvspace=16384
16384
For optimal value for your
Ethernet adapter, consult
IBM support.
User Limit Parameter: Tip: ulimit -a command displays all the ulimit limits.
time (seconds) Default unlimited
file (blocks) Default unlimited
data (kbytes) Default unlimited
stack (kbytes) Default 4194304
memory (kbytes) Default unlimited
coredump (blocks) Default unlimited
nofiles (descriptors) Default 10240
OBIEE libraries are shared among processes running on the same box. AIX will share common
memory for these libraries, if the "read-other" bit is turned on. It is recommended to change the
permissions for all OBIEE libraries and client libraries (database, ldap, etc).
Tip: How-to Detect: "/bin/genld -l" AIX command produces a list of the libraries used by each
process and the AIX memory address where they are loaded.
64-bit public segment is 9 (“9xxxxxxxxxxxxxxx"); private segment is 8.
genld -l | grep -v ' d| 9' | sort +2 > (provides a list of privately loaded libraries)
Tip: How-to Repair: chmod o+r <libname>

10
AIX shared libraries will have a suffix of ".so" or ".a". Another technique is to change all libraries in
a selected directory to repair those that might not be currently loaded. The usual directories that
need repair are obiee code, httpd code and plugins, database client libraries and java.
chmod o+r /shr/dir/*.a /shr/dir/*.so
Set the following environmental variables in opmn.xml file for running
OracleBIPresentationServicesComponent process:
AIXTHREAD_SCOPE=S
Tip: For OBIEE, you should set this value to S, which signifies system-wide contention scope (1:1).
AIXTHREAD_MNRATIO=1:1
AIXTHREAD_MUTEX_DEBUG=OFF
Tip: Maintains a list of active mutexes for use by the debugger.
AIXTHREAD_RWLOCK_DEBUG=OFF
Tip: For optimal performance, you should set the value of this thread-debug option to OFF.
AIXTHREAD_COND_DEBUG=OFF
Tip: Maintains a list of condition variables for use by the debugger
SPINLOOPTIME=1000
Tip: SPINLOOPTIME controls the number of times the system will retry a busy lock before
yielding to another process. The default value is 40. This should be increased to 1000 or higher
because a busy lock retry is inexpensive compared to the alternative. Use the tprof command to
determine if the check_lock routine has high CPU usage. If it does, you can increase the value even
more.
YIELDLOOPTIME=4
Tip: This variable has been shown to be effective in OBIEE, where multiple locks are in use. The
number of times to yield the processor before blocking on a busy lock is n. The default is 0
MALLOCMULTIHEAP=considersize,heaps:4
Multiple heaps are required so that a threaded application can have more than one thread issuing
malloc(), free(), and realloc() subroutine calls. With a single heap, all threads trying to do a
malloc(), free(), or realloc() call would be serialized (that is, only one call at a time). The result is a
serious impact on multi-processor machines.
MALLOCTYPE=buckets
MAXDATA
The BI System Components executable requires a lot of heap space for execution.
If the servers crash for insufficient storage, the size can be adjusted with this AIX environment
variable.
LDR_CNTRL=IGNOREUNLOAD@LOADPUBLIC@PREREAD_SHLIB@MAXDATA=0x200000000
Important Note: 8GB or 16GB would be a good starting point for 64-bit. Based on your system
resources availability you can set MAXDATA to higher value i.e. 32GB.
Tip: How to review the bmaxdata value
$ dump -X32_64 -o sawserver to check bmaxdata
DB2_SKIP_TRACE=1
For more information about AIX tuning, you should consult your AIX vendor’s
documentation. Note the above TCP/kernel tunable parameters and their
corresponding values are provided as examples and rough guidelines only. You can
adjust these and other parameters based on actual system load, usage patterns such
as the number of concurrent users and sessions and so on.

11
2.1.5 Oracle® Sun Solaris Tuning Parameters
This topic describes how to tune the Solaris operating system to optimize the
performance of your Oracle® Business Intelligence Enterprise Edition. Note: Solaris
default network tuning parameters should be sufficient in most cases. For heavy,
network centric workloads, it’s always best practice to increase the size of key TCP-
related parameters to improve system performance and reduce dropped
connections.
Sun Solaris Parameter Default Value Suggested Value
File descriptors (nofiles)
Important Note: On any box that hosts an Oracle®
HTTP Server / WebLogic Server / OBIEE
(Presentation/BI) server / Essbase server it is
recommended to increase nofiles (descriptors) to
optimal value. On Solaris this means setting the
“rlim_fd_cur” in the /etc/system file and rebooting the
box.
Please make sure to check your operating system
documentation and release notes; there are some
negative performance implications on some older
versions of Solaris if you set these numbers too high.
Tip: The syntax for adjusting this parameter in the
/etc/system file is shown below:
set rlim_fd_cur=65535
256 65535
tcp_time_wait_interval
It is recommended to reduce this setting to 60,000
milliseconds, or 1 minute; this is the default value starting
in Solaris 10. By reducing the value of this entry,
TCP/IP can release closed connections faster, providing
more resources for new connections.
Tip: The command “netstat -a | grep TIME_WAIT | wc -l”
will count all of the TCP connections that are in the
TIME_WAIT state. As this number approaches the
maximum number of file descriptors per process, your
application’s throughput will suffer dramatic
degradations because new connection requests may
have to wait for a free space in the application’s file
descriptor table. Tip: Set using command:
ndd -set /dev/tcp tcp_time_wait_interval 30000
60000
30000
tcp_xmit_hiwat
The tcp_xmit_hiwat and tcp_recv_hiwat parameters
control the default size of the send window and receive
window for each TCP connection. On very fast
49152 This parameter is calculated
based on the network
bandwidth and latency. You
could follow this rule to
calculate:

12
networks, you should make sure that the values are set
to at least 32K.
<numbers of bits per
second> * <roundtrip
latency> * 8 [bits/byte]
tcp_recv_hiwat
The tcp_xmit_hiwat and tcp_recv_hiwat parameters
control the default size of the send window and receive
window for each TCP connection, respectively. On
very fast networks, you should make sure that the
values are set to at least 32K.
49152 This parameter is calculated
based on the network
bandwidth and latency. You
could follow this rule to
calculate:
<numbers of bits per
second> * <roundtrip
latency> * 8 [bits/byte]
ipcl_conn_hash_size
This parameter controls the size of a hash table that
helps quickly locate the TCP socket’s data structure in
the kernel. If the size is too small, it will result in long
hash chains in each bucket that force the operating
system into a linear search for the socket entry of
interest, and performance will suffer accordingly.
0
(in Solaris 10)
In Solaris 10, the
default value of 0
means that the system
automatically sizes an
appropriate value for
this parameter at boot
time, depending on the
available memory.
Connection backlog
This parameter controls the maximum allowable
number of completed connections waiting to return
from an accept call (that have completed the three-way
TCP connection handshake). You should increase this
parameter only if you notice that your system is
dropping connections.
Increase these values if you do see non-zero values for
tcpListenDrop in the output for the following
command:
netstat –s | fgrep –i listendrop
Increase the values in steps of 256 starting from the
default value
Tip: Set using commands:
ndd -set /dev/tcp tcp_conn_req_max_q 1024
ndd -set /dev/tcp tcp_conn_req_max_q0 4096
128 (max_q)
1024 (max_q0)
1024 (max_q)
4096 (max_q0)
Important Note: It is important to keep systems up to date with Solaris patches
because the patches provide fixes for security vulnerabilities, performance, and
other improvements of the OS. Certain patches specifically target the Java platform, which
benefits WebLogic Server in regards to performance and functionalities.

13
2.2 Tune Oracle® WebLogic Server (WLS) parameters This topic describes how to tune the WebLogic Server to optimize the performance
of your Oracle® Business Intelligence Enterprise Edition.
2.2.1 Tuning JDBC Data Sources
You can improve Oracle Business Intelligence Enterprise Edition performance and
stability by properly configuring the attributes in JDBC data sources in your
bifoundation_domain domain.
2.2.1.1 Increase the Number of Connection Pool
If JDBC (BI) data sources are running out of connections to the relational database
then you need to set the maximum number of connections to high value for the
following Business Intelligence Enterprise Edition data sources:
Important Note: Reason why the default value maximum capacity size is set to
lower value is because it is important to protect database resources. So make sure you
have enough resources on the database server (available memory is a constraint). If you
increase initial / maximum capacity to very high value, you may exceed the limit of
PROCESSES / OPEN_CURSORS on Oracle® database server.
Data Source Name Default Value Suggested Value
bip_datasource Initial Capacity: 0
Maximum Capacity: 50
Initial Capacity: 0
Maximum Capacity: 150
mds-owsm Initial Capacity: 0
Maximum Capacity: 50
Initial Capacity: 0
Maximum Capacity: 150
EPMSystemRegistry Initial Capacity: 0
Maximum Capacity: 50
Initial Capacity: 0
Maximum Capacity: 150
Important Note: You need to determine the optimal value for the Maximum Capacity as
part of your pre-production performance testing. Once optimal values are determined
then set the value of Initial Capacity equal to the value for Maximum Capacity in
order to boost performance of JDBC in WebLogic Server web applications.
Tip: Here is the example on how to size open cursors value on Oracle® database, if
you have a data source with 150 connections deployed on 1 server and if you use
default Statement Cache Size 10, you may open 1500 (150 x 1 x 10) cursors on your
database server for the cached statements.
Tip: To increase this value:
1. Log in to the WebLogic Server administration console.
2. Select your data source (for example “mds-owsm”), and then click on
Connection Pool tab, and then Maximum Capacity.

14
2.2.1.2 Tune the Statement Cache size
Reusing prepared and callable statements reduces the round trip to the database
resulting in lower CPU usage on the database server hence improving performance
for the current statement and leaving CPU cycles for other tasks.
If you are using Oracle® database i.e. “Oracle® JDBC driver” then it is recommended
to set the following data sources statement cache size to 0 in order to disable the
WebLogic Server cache. Oracle® JDBC driver does use a lot of memory in its
Prepared/Callable statements, so if the WebLogic Server pool is configured to cache
too many statements, this takes lots of heap memory space. If the heap memory
utilization is too high then you can configure the pool to not cache statements (set
the cache size to zero for following data sources).
Data Source Name Default Value Suggested Value*
bip_datasource 10 0
mds-owsm 10 0
EPMSystemRegistry 10 0
*The above setting to 0 is Oracle®-specific. If need be statement caching can be set at driver level. The
latest Oracle® JDBC 11.2 driver versions allow this, and will permit significant memory savings by
sharing/reclaiming memory if set at the driver level.

15
2.2.2 Tune Connection Backlog Buffering
Tune the number of connection requests that a WebLogic Server instance will accept
before refusing additional requests. The Accept Backlog parameter specifies how
many Transmission Control Protocol (TCP) connections can be buffered in a wait
queue.
Important Note: In WebLogic Server 10.3.x, it is not required to increase Accept
Backlog as default listen thread Accept Backlog value is increased to 300 which is a
better default value.
2.2.3 Stuck thread detection behavior Tuning
WebLogic Server automatically detects when a thread in an execute queue becomes
“stuck.” Because a stuck thread cannot complete its current work or accept new
work, the server logs a message each time it diagnoses a stuck thread.
Some operations (for example, long running large reports, complex large
dashboards, Database / Essbase call, computation loop inside an application) can
get into an infinite loop. This can cause the thread to be stuck with that operation
for whatever time it takes to complete that operation.
Performance of the server can degrade significantly if many such threads get
stuck.
Tip: Changing the stuck threads values will only change the detection of stuck
threads. This does not mean that there are no stuck threads any more. Only the stuck
threads reporting by WebLogic Server changes. Meaning how long usually a specific
operation should take in OBIEE. If such an operation takes longer than 600 seconds
(default) then you should increase the stuck thread value to a higher one to prevent
the reporting of stuck threads. The performance is not impacted or controlled
through the stuck thread detection. WebLogic Server will not "delete" or "kill" a
thread in case it becomes stuck.
Use the below Stuck Threads suggested settings as a starting point, and then, after
careful testing of your long running transactions, adjust as needed.
Managed Servers Default Value Suggested Value
bi_server1 Stuck Thread Max Time=600
Stuck Thread Timer Interval=60
Max Stuck Thread Time=600
Stuck Thread Max Time=1200
Stuck Thread Timer Interval=1200
Max Stuck Thread Time=1200
AdminServer Stuck Thread Max Time=600
Stuck Thread Timer Interval=60
Max Stuck Thread Time=600
Stuck Thread Max Time=1200
Stuck Thread Timer Interval=1200
Max Stuck Thread Time=1200
Tip: To configure above stuck thread detection behavior settings, you need to:
Click on BI Managed Server (bi_serverN) and then click on Tuning tab.
Then click on Overload tab for each BI Managed Server (bi_serverN).

16
2.2.4 To improve the performance of WebLogic and LDAP Authentication
providers: To optimize the group membership caches for WebLogic and LDAP
Authentication providers, set the following attributes (found in the Administration
Console on the LDAP Authentication provider’s Configuration → Provider Specific
and Performance pages):
Group Membership Searching—Controls whether group searches are limited or
unlimited in depth. This option controls how deeply to search into nested
groups. For configurations that use only the first level of nested group hierarchy,
this option allows improved performance during user searches by limiting the
search to the first level of the group.
o If a limited search is defined, Max Group Membership Search Level must
be defined.
o If an unlimited search is defined, Max Group Membership Search Level is
ignored.
Max Group Membership Search Level—Controls the depth of a group
membership search if Group Membership Searching is defined. Possible values
are:
o 0—Indicates only direct groups will be found. That is, when searching for
membership in Group A, only direct members of Group A will be found.
If Group B is a member of Group A, the members will not be found by this
search.
o Any positive number—indicates the number of levels to search. For
example, if this option is set to 1, a search for membership in Group A will
return direct members of Group A. If Group B is a member of Group A,
the members of Group B will also be found by this search. However, if
Group C is a member of Group B, the members of Group C will not be
found by this search.
Tip: If you see BI Managed Server JVM seg faults and then it restarts / hangs when a user
logs in, check the user group memberships in Active Directory. If the user belongs to groups
in a circular reference (group A belongs to group B that belongs to group A), without
additional configuration parameters, the JVM may segfaults. To workaround that set in
WebLogic Server administration console the "Max Group Membership Search Level" for the
AD provider. For more information, refer to “Improving the Performance of WebLogic and
LDAP Authentication Providers” section at http://download.oracle.com/docs/cd/E12840_01/wls/docs103/secmanage/atn.html .

17
2.2.5 Disable Wrap Data Types
By default, JDBC data type’s objects are wrapped with a WebLogic wrapper. This
allows for features like debugging output and track connection usage to be done by
the server.
The wrapping can be turned off by setting this value to false. This improves
performance, in some cases significantly, and allows for the application to use the
native driver objects directly.
Tip: How to Disable Wrapping in WLS Administration Console
You can use the Administration Console to disable data type wrapping for following
JDBC data sources in bifoundation_domain domain:
Data Source Name
bip_datasource
mds-owsm
EPMSystemRegistry
Tip: To disable wrapping for each JDBC data source (as stated in above table):
1. If you have not already done so, in the Change Center of the Administration
Console, click Lock & Edit.
2. In the Domain Structure tree, expand Services, then select Data Sources.
3. On the Summary of Data Sources page, click the data source name for
example “mds-owsm”.
4. Select the Configuration: Connection Pool tab.
5. Scroll down and click Advanced to show the advanced connection pool
options.
6. In Wrap Data Types, deselect the checkbox to disable wrapping.
7. Click Save.
8. To activate these changes, in the Change Center of the Administration
Console, click Activate Changes.
Important Note: This change does not take effect immediately—it requires
the server be restarted.

18
2.3 Tune 64bit Java Virtual Machines (JVM) Newly deployed web application server instances use default memory heap
settings, which are often too small to accommodate Oracle Business Intelligence
Enterprise Edition 64 bit requirements. Optimal JVM settings can be determined
only by close monitoring of application server performance under peak realistic
load.
2.3.1 Tuning 64bit JRockit JVM
In JRockit JVM (R28), the heap grows faster than before. The JVM also ensures that
the heap size grows up to the maximum Java heap size (-Xmx) before an
OutOfMemory error is thrown. In addition, the default value of the -Xmx option is
changed from 1 GB to 3 GB on 64-bit OS. Note the JRockit JVM auto shrinks the heap if it
is unused or if other applications require more physical memory.
Below table lists the memory settings that applies to all managed servers in BI
domain i.e. Admin Server, bi_serverN. Note the suggested value (depending on
available physical memory on each server), and the Oracle® JRockit Java argument:
Setting Suggested
Value
Java Argument*
Minimum heap
1024 MB -Xms1024m
Maximum heap
2048 MB -Xmx2048m
Increase the size of Compressed
References only to resolve native
OutOfMemory (OOM) error despite
physical memory being available.
32 GB -XXcompressedRefs:size=32GB
Thread-local areas (TLA) is used for
object allocation. This option
(-XXtlaSize) can be used to tune the
size of the thread-local areas. Important Note: Only apply this setting if
you see “java.lang.OutOfMemoryError:
getNewTla” error in bi_serverN web app
logs. You may also need to consider
increasing the physical memory on server to
permanently resolve the “getNewTla” error
occurrences.
min=8k
preferred=128k
-XXtlasize:min=8k,preferred=128k
Note: It is recommended to use the default garbage collection mode i.e. -Xgc:throughput. Also
large heap reduces the garbage collection frequency and fragmentation, improving the throughput
of the application; however, a large heap increases the memory footprint of the Java process.

19
*Warning: Make sure you have enough physical memory allocated / available on 64bit
servers and then use the above settings as a starting point, and after load testing, adjust as
needed. For a stable / an even performance over time, you should set the initial heap size (-
Xms) to the same value as the maximum heap size (-Xmx).
2.3.1.1 Common JRockit JVM issues seen with BI (i.e. bi_server1) managed
servers:
Startup Times Take Longer When Using JRockit JVM Versus Sun JVM: The
Oracle® JRockit JVM is by default optimized for server use, which means that
the startup times can be longer in favor of high performance as soon as the
application is up and running. Moreover, as the application runs, the JRockit
JVM optimizes frequently called methods, improving the performance further.
When you run the JRockit JVM on a 64-bit system with a heap size less than 4
GB, if native OutOfMemory errors occurs despite memory being available only
then add the parameter -XXcompressedRefs:size=32GB in JVM startup options to
enable heap to grow up to 32 GB heap (practical limit of 25 GB). This will fix the
issue native OutOfMemory errors. Moreover heap size still be restricted till the
limits defined using -Xmx only benefit would be your heap will get the
capability to grow beyond 4 GB up to 25 GB due to increase in size of pointer to
32 bit address.
On Oracle Solaris SPARC, due to the way classblock memory is reserved,
Oracle® JRockit (R28) might occasionally run out of memory when a large
number of classes are loaded (in the order of 100000).
Workaround: The default value of -XX:MaxClassBlockMemory=50 MB, and a
reasonable value is around 75 MB.
It is important to keep Oracle® JRockit R28.1.x up to date with latest fix release
because the latest release provide fixes for security vulnerabilities, performance,
and other improvements of the Oracle® JRockit R28.1.x.

20
2.3.2 Tuning 64bit Sun JVM
Below table lists the memory settings that applies to all managed servers in BI
domain i.e. Admin Server, bi_serverN. Note the suggested value (depending on
available physical memory on each server), and the Oracle® Sun Java argument.
Setting Suggested Value Java Argument*
Minimum heap
1024 MB -Xms1024m
Maximum heap
2048 MB -Xmx2048m
Minimum permanent generation heap
256 MB -XX:PermSize=256m
Maximum permanent generation heap
512 MB -XX:MaxPermSize=512m
Minimum young generation size
512 MB -XX:NewSize=512m
Maximum young generation size
512 MB -XX:MaxNewSize=512m
*Warning: Make sure you have enough physical memory allocated / available on
servers and then use the above settings as a starting point, and after load testing,
adjust as needed. For a stable / an even performance over time, you should set the
initial heap size (-Xms) to the same value as the maximum heap size (-Xmx).

21
2.3.3 Tuning 64bit IBM JVM
Below table lists the memory settings that applies to all managed servers in BI
domain i.e. Admin Server, bi_serverN. Note the suggested value (depending on
available physical memory on each server), and the IBM® Java argument.
Setting Suggested Value Java Argument*
Minimum heap
1024 MB -Xms1024m
Maximum heap
2048 MB -Xmx2048m
Java thread stack size (-Xss)
2m -Xss2m
Initial size of the new (nursery) heap to the
specified value when using when using
-Xgcpolicy:gencon
512m -Xmns512m
The maximum size of the new (nursery) heap to
the specified value when using -Xgcpolicy:gencon
512m -Xmnx512m
Reduce the use of OS signals by Java/VM
- -Xrs
-Xgcpolicy:gencon is a generational garbage collector for the IBM JVM. The generational
scheme attempts to achieve high throughput along with reduced garbage collection pause
times.
-Xverify:none With no parameters, enables the verifier. Note that this is the default; used
on its own, this option has no effect
*Warning: Make sure you have enough physical memory allocated / available on
servers and then use the above settings as a starting point, and after load testing,
adjust as needed. For a stable / an even performance over time, you should set the
initial heap size (-Xms) to the same value as the maximum heap size (-Xmx).

22
2.4 Tune 32bit Java Virtual Machines (JVM) Newly created application server instances use default memory settings, which are
often too small to accommodate Oracle Business Intelligence Enterprise Edition
requirements. For 32bit JVM in order to allocate a heap of more than 1024 MB, you
need to use a 64bit JVM in order to allocate more than 1024 MB of maximum heap.
See section “Tune 64bit Java Virtual Machines (JVM)” in this guide.
2.4.1 Tuning 32bit JRockit JVM
This table lists the memory settings, the suggested value, and the Oracle® JRockit
Java argument:
Setting Suggested Value Java Argument
Minimum heap 1024 MB -Xms1024m
Maximum heap 1024 MB -Xmx1024m
Important Note: By setting minimum heap size = maximum heap size gives you a
controlled environment where you get a good heap size right from the start and also
to minimize minor/major garbage collections.
Important Note: By default, JRockit JVM uses the dynamic garbage collection
strategy to optimize for throughput. For OBIEE JVM component, it is not
recommended to change to other available dynamic strategies.
2.4.2 Tuning 32bit Sun JVM
This table lists the memory settings, the suggested value, and the Sun’s Java
argument:
Setting Suggested Value Java Argument
Minimum heap 1024 MB -Xms1024m
Maximum heap 1024 MB -Xmx1024m
Minimum permanent generation heap 128 MB -XX:PermSize=128m
Maximum permanent generation heap 256 MB -XX:MaxPermSize=256m
Important Note: By setting minimum heap size = maximum heap size gives you a
controlled environment where you get a good heap size right from the start and also
to minimize minor/major garbage collections.
Important Note: Also for application servers that use Sun's Java Virtual Machine
(JVM), make sure that the size of the permanent generation heap must be increased
(as stated in above table). When the permanent area of the heap is too small, the JVM
will do a full garbage collection of the entire heap before resizing the permanent
area.
23
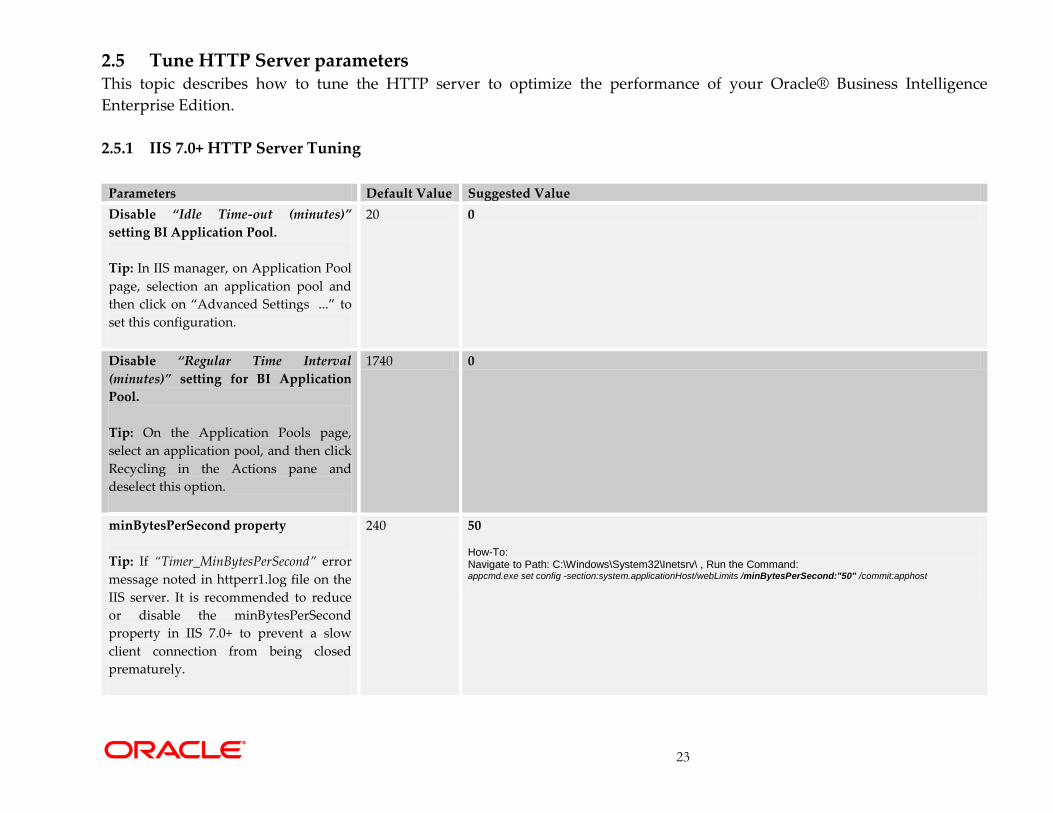
2.5 Tune HTTP Server parameters This topic describes how to tune the HTTP server to optimize the performance of your Oracle® Business Intelligence
Enterprise Edition.
2.5.1 IIS 7.0+ HTTP Server Tuning
Parameters Default Value Suggested Value
Disable “Idle Time-out (minutes)”
setting BI Application Pool.
Tip: In IIS manager, on Application Pool
page, selection an application pool and
then click on “Advanced Settings ...” to
set this configuration.
20 0
Disable “Regular Time Interval
(minutes)” setting for BI Application
Pool.
Tip: On the Application Pools page,
select an application pool, and then click
Recycling in the Actions pane and
deselect this option.
1740 0
minBytesPerSecond property
Tip: If “Timer_MinBytesPerSecond” error
message noted in httperr1.log file on the
IIS server. It is recommended to reduce
or disable the minBytesPerSecond
property in IIS 7.0+ to prevent a slow
client connection from being closed
prematurely.
240 50 How-To: Navigate to Path: C:\Windows\System32\Inetsrv\ , Run the Command: appcmd.exe set config -section:system.applicationHost/webLimits /minBytesPerSecond:"50" /commit:apphost

24
Connection Timeout
Tip: In order to avoid random
disconnections for remote users, it is
recommended to increase this value.
120 7,200
How-To: Navigate to Path: C:\Windows\System32\Inetsrv\, Run the Command: appcmd.exe set config -section:system.applicationHost/sites "/[name='Default Web Site'].limits.connectionTimeout:02:00:00" /commit:apphost
Tune the following memory limits for
all the BI (64bit) Application Pool:
Private Memory Limit (KB)
Virtual Memory Limit (KB)
Tune the following memory limits for
all the BI (32bit) Application Pool:
Private Memory Limit (KB)
Virtual Memory Limit (KB)
Important Note: It is recommended to
set no memory limits (0) only for 64bit
IIS. Only force memory limits for 32bit IIS.
Tip: On the Application Pools page,
select an application pool, and then click
Recycling in the Actions pane and
deselect all the options.
= Default
= Default
= Default
= Default
= 0
= 0
= 1048576
= 1572864
Important Note: Use the above suggested settings as a starting point, and then, after careful testing, adjust as needed. To avoid potential
performance issues, values for IIS 7.0+ parameters should be set only after considering the nature of the workload and the system capacity
(i.e. CPU and memory).

25
2.5.2 Oracle® HTTP Server (OHS) Tuning
Oracle® HTTP Server uses directives in httpd.conf file. The directives for each Multi-
Processing Module (MPM) type are defined in the httpd.conf file. The default MPM
type is Worker MPM.
Parameters Default Value Suggested Value
MaxKeepAliveRequests 100 0
KeepAliveTimeout 5 15
KeepAlive On On
Timeout 300 6000
# WinNT MPM (this MPM is for Windows Only
<IfModule mpm_winnt_module>
ThreadsPerChild
ListenBackLog
MaxRequestsPerChild
</IfModule>
= 150
= Default
= 0
= 1048
= 1000
= 0
#worker MPM (by default OHS use multithreaded mode
in UNIX)
<IfModule mpm_worker_module>
StartServers
MaxClients
ListenBackLog
MinSpareThreads
MaxSpareThreads
ThreadsPerChild
MaxRequestsPerChild
AcceptMutex fcntl
LockFile "${ORACLE®_INSTANCE}/diagnostics/logs/${COMPONENT_TYPE}/${COMPONENT_NAME}/http_lock" </IfModule>
= 2
= 150
= Default
= 25
= 75
= 25
= 0
= 2
= 1024
= 1000
= 25
= 75
= 64
= 0
SendBufferSize
ReceiveBufferSize
Important Note: Only add this settings if your customer
have large volume of data to display e.g. 2000 to 10000
rows of data.
= OS dependent
= OS dependent
= 8123292
= 8123292
Important Note: Use the above suggested settings as a starting point, and then, after
careful testing, adjust as needed. To avoid potential performance issues, values for
OHS parameters should be set only after considering the nature of the workload and
the system capacity (i.e. CPU and memory).

26
2.6 Tune HTTP Server Compression / Caching Why use Web Server Compression / Caching for Oracle® Business Intelligence?
1. Bandwidth Savings: Enabling HTTP compression can have a dramatic
improvement on the latency of responses. By compressing static files and
dynamic application responses, it will significantly reduce the remote (high
latency) user response time.
2. Improves request/response latency: Caching makes it possible to suppress the
payload of the HTTP reply using the 304 status code. Minimizing round trips over
the Web to revalidate cached items can make a huge difference in browser page load times.
Tip: Implement the following recommendations to optimize Internet Explorer 7.0 /
8.0; see below MS KB articles at:
“How to optimize Internet Explorer” > http://support.microsoft.com/kb/936213
“IE to download more than two files at one time” > http://support.microsoft.com/kb/282402
“IE slow performance or frequent freeze” > http://support.microsoft.com/kb/555942
“Tune IE timeout values” > http://support.microsoft.com/kb/813827
In the IE browser navigate to: Tools -> Internet Options -> Advances -> Security and Locate the
“Enable native XMLHTTP support” option and check the check box.
2.6.0.1 Web Server Compression Flow
To better understand compression flow, below screen shot depicts the flow and
where the compression and decompression occurs on Oracle® HTTP Server (OHS).
Compression enabled on Oracle® HTTP server (OHS) level:
HTTPVPN (WAN)HTTP
Oracle (ohs) :7777 WebLogic Server bi_server1:9704Compression Layer
(gzip, deflate)
IE / Firefox
Decompression Layer
(gizp, deflate)
Web Browser Rendering
Sending all compressed HTTP Responses to clients from Oracle port 7777

27
2.6.1 Oracle® HTTP Server (OHS)
This topic describes how to enable caching / compression in Oracle® HTTP Server of
your Oracle® Business Intelligence Enterprise Edition. Important Note: High load of
HTTP replies with 304 status code causes the OBIEE 11g UI to work slow in IE
browser 7 / 8. To resolve this issue, it is highly recommended to implement HTTP
caching and compression that will help to minimize the round trips over the Web to
revalidate cached items, can make a huge difference in browser page load times.
a. How to Enable Compression and Caching:
1. To implement HTTP compression / caching, install and configure Oracle HTTP
Server (OHS) 11.1.1.x for the bi_serverN Managed Servers (refer to "OBIEE Enterprise
Deployment Guide for Oracle Business Intelligence" document for details).
2. On the OHS machine, open the file HTTP Server configuration file (httpd.conf) for
editing. This file is located in the OHS installation directory. For example:
ORACLE_HOME/Oracle_WT1/instances/instance1/config/OHS/ohs1
3. In httpd.conf file, verify that the following directives are included and not
commented out:
LoadModule expires_module "${ORACLE_HOME}/ohs/modules/mod_expires.so
LoadModule deflate_module "${ORACLE_HOME}/ohs/modules/mod_deflate.so
4. Add the following lines in httpd.conf file below the directive LoadModule section to
compression / caching and restart the OHS:
#HTTP Compression
<IfModule mod_deflate.c>
SetOutputFilter DEFLATE
SetEnvIfNoCase Request_URI \.(?:gif|jpe?g|png)$ no-gzip dont-vary
SetEnvIfNoCase Request_URI \.(?:exe|t?gz|zip|bz2|sit|rar)$ no-gzip dont-vary
SetEnvIfNoCase Request_URI \.(?:pdf|doc?x|ppt?x|xls?x)$ no-gzip dont-vary
SetEnvIfNoCase Request_URI \.avi$ no-gzip dont-vary
SetEnvIfNoCase Request_URI \.mov$ no-gzip dont-vary
SetEnvIfNoCase Request_URI \.mp3$ no-gzip dont-vary
SetEnvIfNoCase Request_URI \.mp4$ no-gzip dont-vary
</IfModule>
#Caching of static files
ExpiresActive On
<IfModule mod_expires.c>
ExpiresByType image/gif "access plus 3 months"
ExpiresByType image/jpeg "access plus 3 months"
ExpiresByType application/x-javascript "access plus 3 months"
ExpiresByType text/css "access plus 3 months"
ExpiresByType text/javascript "access plus 3 months"
ExpiresByType image/png "access plus 3 months"
ExpiresByType application/x-shockwave-flash "access plus 3 months"
</IfModule>
#This stops the HTTP 304 replies in IE 7/8 browser
<IfModule mod_headers.c>
<FilesMatch "\.(gif|jpeg|png|x-javascript|javascript|css|swf)$">
Header set Cache-Control "max-age=7889231"
</FilesMatch>
</IfModule>

28
b. Performance Gain Test (Oracle® HTTP Server)
The test with/without HTTP compression enabled was conducted in internal lab to
measure the transactions response time / throughput for Oracle® Business
Intelligence Enterprise Edition.
Below table summarizes the performance improvement for OBIEE transactions over
a 1 Mbps bandwidth link for one remote user.
Transaction Name
Average time
(in sec)
Average time
(in sec) % Improvement
Before (Non-Compressed)
After (Compressed)
Total transactions response
time:
OBIEE Main page > Display
report (with 1000 rows) > Click &
Navigate to next 1000 rows page
up to 5 times.
300 seconds 20 seconds 93%
Total Throughput (bytes)
(Total generated network traffic for
one user)
18,534,557 1,123,646 94%
Average Network Delay (ms)
350 355 -
Packet Loss %
0 0 -
HTTP Response Codes Count
HTTP/200: 483
HTTP/304: 525
HTTP/200: 15 -

29
2.6.2 IIS 7.0+ HTTP Server
This topic describes how to enable compression and caching of your Oracle® Business
Intelligence Enterprise Edition.
Important Note: High load of HTTP replies with 304 status code causes the OBIEE 11g UI
to work slow in IE browser 7 / 8. To resolve this issue, it is highly recommended to
implement HTTP caching and compression that will help to minimize the round trips over
the Web to revalidate cached items, can make a huge difference in browser page load times.
Tip: Refer to WebLogic Server documentation on how to install and configure the Microsoft
Internet Information Server Plug-In for IIS 7.0.
a. How to Enable Compression IIS 7.0+:
1. HTTP Compression should be enabled on the OBIEE site level as performance may
hindered if enabled globally.
Tip: Run the following command line option to apply Dynamic Compression on OBIEE
web site level, note in below command replace the “obiee” website placeholder with
your web site name:
Navigate to Path: C:\Windows\System32\Inetsrv\ Run the command: Appcmd.exe set config "obiee" -section:system.webServer/urlCompression /doDynamicCompression:"True"
2. Only static compression is installed by default. Ensure dynamic compression feature is
installed via Web Server (IIS) > Add Role Services Wizard; for step by step details refer to IIS
7.x documentation. Increase the compression level of static and dynamic files. Note:
dynamic compression level default value is 0 and for static compression level default
value is 7. As stated below change the level of compression (in gzip) for dynamic files to
7 and for static files to 9.
Tip: Run the following command line option to increase GZip Compression Level:
Navigate to Path: C:\Windows\System32\Inetsrv\ Run the command: Appcmd.exe set config -section:httpCompression -[name='gzip'].staticCompressionLevel:9 -[name='gzip'].dynamicCompressionLevel:7
Important Note: Raise the dynamic compression level above seven only if you need
more network bandwidth and have sufficient CPU capacity to handle the extra load.
3. Restart the IIS HTTP Server.

30
b. How to Enable Caching in IIS 7.0+:
Follow these steps to configure static file caching and content expiration if you are
using Microsoft IIS 7.0 Web Server with Oracle Business Intelligence.
Tip: It is important to install an IIS URL Rewrite Module that enables Web
administrators to create powerful outbound rules as stated below.
Following are the steps to set up static file caching for Microsoft IIS 7.0+ Web Server:
1. In “web.config” file for OBIEE static files virtual directory
(ORACLE_HOME/bifoundation/web/app) add the following highlight in bold the
outbound rule for caching:
<?xml version="1.0" encoding="UTF-8"?>
<configuration>
<system.webServer>
<urlCompression doDynamicCompression="true" />
<rewrite>
<outboundRules>
<rule name="header1" preCondition="FilesMatch" patternSyntax="Wildcard">
<match serverVariable="RESPONSE_CACHE_CONTROL" pattern="*" />
<action type="Rewrite" value="max-age=604800" />
</rule>
<preConditions>
<preCondition name="FilesMatch">
<add input="{RESPONSE_CONTENT_TYPE}" pattern="^text/css|^text/x-
javascript|^text/javascript|^image/gif|^image/jpeg|^image/png" />
</preCondition>
</preConditions>
</outboundRules>
</rewrite>
</system.webServer>
</configuration>
2. Restart IIS web server.

31
2.6.3 IIS 6.0 HTTP Server
This topic describes how to enable compression and caching of your Oracle®
Business Intelligence Enterprise Edition.
a. How to Enable Compression IIS 6.0:
1. Specify following additional file types to compress. Edit the HcFileExtensions
metabase property (for static files) and the HcScriptFileExtensions metabase property
(for dynamic files) to apply compression to file types for both deflate and gzip
compressions:
HcScriptFileExtensions set to asp,dll,exe
HcFileExtensions set to htm,html,txt,js,css
Tip: Run the following command line option to extend file extensions for
compression:
Navigate to Path: C:\Inetpub\AdminScripts Run the commands for gzip and deflate: cscript adsutil.vbs set /w3svc/filters/compression/gzip/HcFileExtensions "css" "xml" "htm" "txt" "js" "html" "png" cscript adsutil.vbs set /w3svc/filters/compression/deflate/HcFileExtensions "css" "xml" "htm" "txt" "js" "html" "png"
2. As stated below change the level of compression (in gzip, deflate) for dynamic
files to 7. Important Note: raise the dynamic compression level above seven only if
you need more network bandwidth and have sufficient CPU capacity to handle the
extra load.
Navigate to Path: C:\Inetpub\AdminScripts Run the commands for gzip and deflate: cscript adsutil.vbs set w3svc/filters/compression/gzip/HcDynamicCompressionLevel 7 cscript adsutil.vbs set w3svc/filters/compression/deflate/HcDynamicCompressionLevel 7
3. HTTP Compression should be enabled on the site level as performance may hindered
if enabled globally. Use two new metabase properties that are DoStaticCompression and
DoDynamicCompression, to enable compression at the individual OBIEE site.
Tip: Run the following command line options to enable compression on the OBIEE site
level, note in below commands to replace obiee site level with your web site name: Navigate to Path: C:\Inetpub\AdminScripts
Run the commands: “cscript adsutil.vbs set w3svc/1/root/obiee/DoStaticCompression true”
Navigate to Path: C:\Inetpub\AdminScripts
Run the commands: “cscript adsutil.vbs set w3svc/1/root/obiee/DoDynamicCompression true”
4. Restart the IIS HTTP Server.
Important Note: IIS compression directory should be excluded from the antivirus
software's scan list. If not excluded, antivirus scanning of IIS compression directory
may result in 0-Byte file. Read MS KB article at http://support.microsoft.com/kb/817442

32
b. How to Enable Caching in IIS 6.0:
Follow these steps to configure static file caching and content expiration if you are
using Microsoft IIS 6.0 Web Server with Oracle Business Intelligence.
Important Note: Only apply following caching to OBIEE static files found inside the
/analytics directory (/web/app).
Following are the steps to set up static files caching for Microsoft IIS 6.0 Web Server:
1. Run Internet Service Manager.
2. In Internet Service Manager, right-click the OBIEE static files (/web/app) sub-
directory properties, click on HTTP Headers tab:
i. Specify the content expiration to 7 days.
ii. Add Custom HTTP headers “Cache-Control: max-age=604800”.
3. Restart the IIS HTTP Server.
33
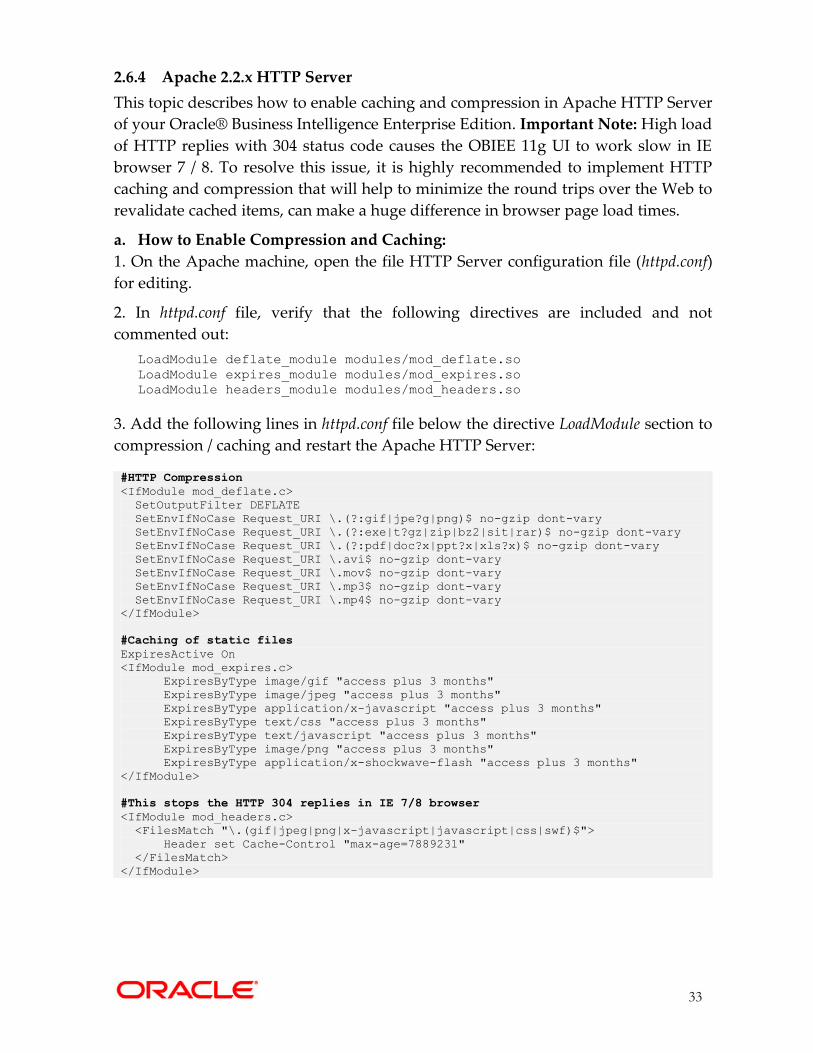
2.6.4 Apache 2.2.x HTTP Server
This topic describes how to enable caching and compression in Apache HTTP Server
of your Oracle® Business Intelligence Enterprise Edition. Important Note: High load
of HTTP replies with 304 status code causes the OBIEE 11g UI to work slow in IE
browser 7 / 8. To resolve this issue, it is highly recommended to implement HTTP
caching and compression that will help to minimize the round trips over the Web to
revalidate cached items, can make a huge difference in browser page load times.
a. How to Enable Compression and Caching:
1. On the Apache machine, open the file HTTP Server configuration file (httpd.conf)
for editing.
2. In httpd.conf file, verify that the following directives are included and not
commented out:
LoadModule deflate_module modules/mod_deflate.so
LoadModule expires_module modules/mod_expires.so
LoadModule headers_module modules/mod_headers.so
3. Add the following lines in httpd.conf file below the directive LoadModule section to
compression / caching and restart the Apache HTTP Server:
#HTTP Compression
<IfModule mod_deflate.c>
SetOutputFilter DEFLATE
SetEnvIfNoCase Request_URI \.(?:gif|jpe?g|png)$ no-gzip dont-vary
SetEnvIfNoCase Request_URI \.(?:exe|t?gz|zip|bz2|sit|rar)$ no-gzip dont-vary
SetEnvIfNoCase Request_URI \.(?:pdf|doc?x|ppt?x|xls?x)$ no-gzip dont-vary
SetEnvIfNoCase Request_URI \.avi$ no-gzip dont-vary
SetEnvIfNoCase Request_URI \.mov$ no-gzip dont-vary
SetEnvIfNoCase Request_URI \.mp3$ no-gzip dont-vary
SetEnvIfNoCase Request_URI \.mp4$ no-gzip dont-vary
</IfModule>
#Caching of static files
ExpiresActive On
<IfModule mod_expires.c>
ExpiresByType image/gif "access plus 3 months"
ExpiresByType image/jpeg "access plus 3 months"
ExpiresByType application/x-javascript "access plus 3 months"
ExpiresByType text/css "access plus 3 months"
ExpiresByType text/javascript "access plus 3 months"
ExpiresByType image/png "access plus 3 months"
ExpiresByType application/x-shockwave-flash "access plus 3 months"
</IfModule>
#This stops the HTTP 304 replies in IE 7/8 browser
<IfModule mod_headers.c>
<FilesMatch "\.(gif|jpeg|png|x-javascript|javascript|css|swf)$">
Header set Cache-Control "max-age=7889231"
</FilesMatch>
</IfModule>

34
2.6.5 Oracle® iPlanet HTTP Server
This topic describes how to enable caching and compression in Oracle® iPlanet
HTTP Server of your Oracle® Business Intelligence Enterprise Edition.
a. How to Enable Compression and Caching:
1. To implement HTTP compression / caching, install and configure Oracle® iPlanet
HTTP Server 7.0.x for the bi_serverN Managed Servers (refer to document
http://docs.oracle.com/cd/E23943_01/web.1111/e16435/iplanet.htm)
2. On the Oracle® iPlanet HTTP Server machine, open the file Administrator's
Configuration (obj.conf) for editing. (Guidelines for modifying the obj.conf file is
available at http://download.oracle.com/docs/cd/E19146-01/821-1827/821-1827.pdf)
3. Add the following lines in obj.conf file inside <Object name="default"> ... </Object>
and restart the Oracle® iPlanet HTTP Server machine:
#HTTP Caching
<If $path =~ '^(.*)\.(jpg|jpeg|gif|png|css|js|swf)$'>
ObjectType fn="set-variable" insert-srvhdrs="Expires:$(httpdate($time + 7889231))"
</If>
<If $path =~ '^(.*)\.(jpg|jpeg|gif|png|css|js|swf)$'>
PathCheck fn="set-cache-control" control="public,max-age=7889231"
</If>
#HTTP Compression
Output fn="insert-filter" filter="http-compression" vary="false" compression-
level="9" fragment_size="8096"

35
2.7 Tune Oracle® Database Parameters Database Administrator (DBA) to perform database monitoring and tuning on a
periodic basis to ensure that you get the best optimal performance from your
Oracle® Business Intelligence system.
Tip: It is recommended that DBA should further tune the Oracle® Database
parameters using Automatic Work Repository (AWR) / Active Session History (ASH)
reports captured during normal / peak users load. For more information on tuning the
Oracle® database, see the Oracle® Database Performance Tuning Guide.
3.0 PERFORMANCE MONITORING OBIEE In addition to the standard system performance objects and counters (Processor,
Memory, Network, System, Paging, Disk), you also have to monitor the resource
utilization at the process level. This topic outlines the processes that have to be
monitored for the Oracle® Business Intelligence using default Operating System
performance utilities.
3.1 Built-in BI Metrics for Performance Monitoring You can use following built-in BI metrics to monitor System Components (BI
processes) and WebLogic Server processes.
Tip:
Use Oracle Enterprise Manager (EM) URL to monitor end to end OBIEE real time
performance: http://<server>:7001/em
In Oracle Business Intelligence 11g, the perfmon URL is still valid to use i.e.
http://<server:port>/analytics/saw.dll?Perfmon
3.1.1 Viewing the Performance Statistics of Oracle BI System Components in EM
If you encounter a problem, such as Presentation Services and BI Server components
are running slowly or are hanging, you can view more detailed performance
information, including performance metrics for a particular target, to diagnose
further about the problem.
Note that Fusion Middleware Control provides real-time data. If you are interested
in viewing historical data, consider using Oracle Enterprise Manager Grid Control.
Tip: To view the performance of an Oracle Presentation Services and BI Server:
1. From the navigation pane, expand the farm, then Business Intelligence, and
then the coreapplication.
36
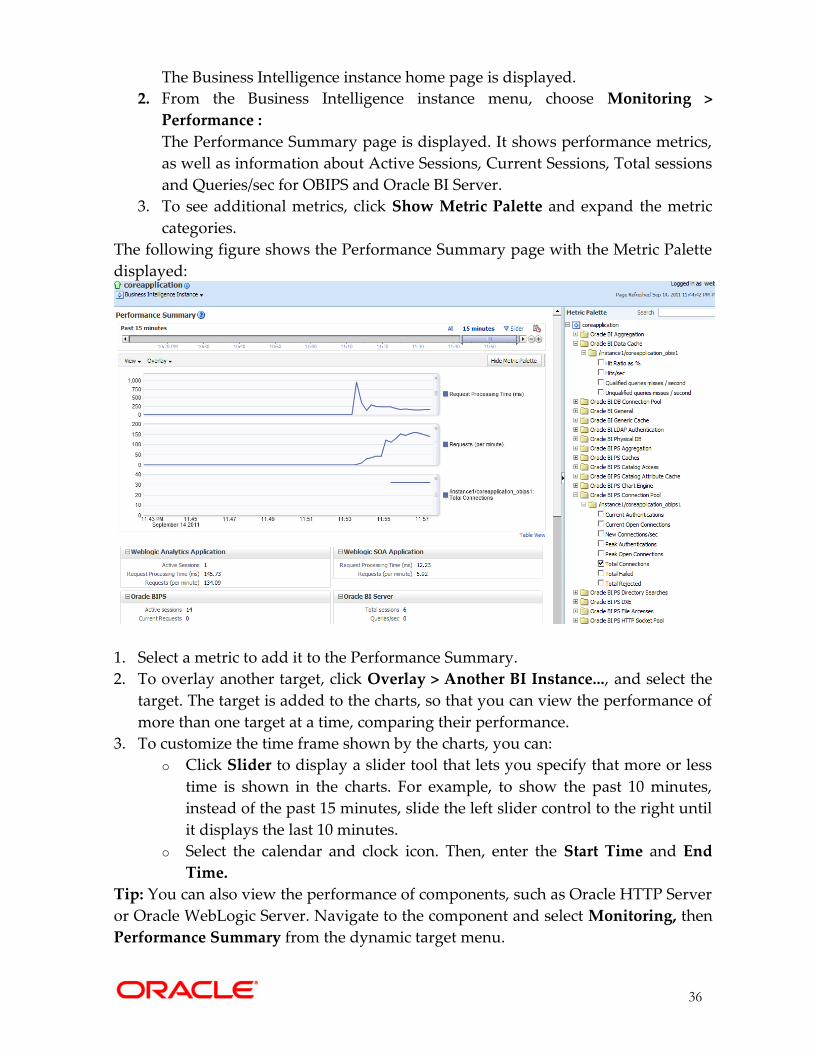
The Business Intelligence instance home page is displayed.
2. From the Business Intelligence instance menu, choose Monitoring >
Performance :
The Performance Summary page is displayed. It shows performance metrics,
as well as information about Active Sessions, Current Sessions, Total sessions
and Queries/sec for OBIPS and Oracle BI Server.
3. To see additional metrics, click Show Metric Palette and expand the metric
categories.
The following figure shows the Performance Summary page with the Metric Palette
displayed:
1. Select a metric to add it to the Performance Summary.
2. To overlay another target, click Overlay > Another BI Instance..., and select the
target. The target is added to the charts, so that you can view the performance of
more than one target at a time, comparing their performance.
3. To customize the time frame shown by the charts, you can:
o Click Slider to display a slider tool that lets you specify that more or less
time is shown in the charts. For example, to show the past 10 minutes,
instead of the past 15 minutes, slide the left slider control to the right until
it displays the last 10 minutes.
o Select the calendar and clock icon. Then, enter the Start Time and End
Time.
Tip: You can also view the performance of components, such as Oracle HTTP Server
or Oracle WebLogic Server. Navigate to the component and select Monitoring, then
Performance Summary from the dynamic target menu.

37
3.1.2 Viewing Oracle Presentation Services perfmon page
In your browser, type in http://<server:port>/analytics/saw.dll?Perfmon . Note: Login
with BI administrator.

38
3.1.3 Viewing Active Sessions via BI Admin Tool
In BI Admin Tool, you can monitor sessions via Manage-Sessions i.e. # of sessions,
current request and session variables.

39
3.2 Performance Monitoring in Windows environment In Windows Operating System use default available performance monitoring tool
called “PerfMon”. File PerfMon.exe is a Windows system file and it’s located in the
folder C:\Windows\System32.
3.2.1 System level Performance Counters using Windows Perfmon Utility:
Subsystem Counter Guidance
Memory Memory: Free System
Page Table Entries
“Warning” when Free System Page Table Entries is
less than 8,000
“Critical” when Free System Page Table Entries is less
than 5,000. On OBIEE server, if you enable /3GB
without proper tuning as per recommendations stated
in section “Tune Windows 32bit /3GB”, you will notice
5000 PTE as initial value after the reboot.
Memory Memory: Available
Mbytes
Should be no lower than 20% to 25% of installed
physical memory. In these cases, carefully monitor
Paging activity.
Memory Memory: Page
Reads/sec
This counter should be below 1,000 at all times.
Processor Processor: % Processor
Time_Total
Total processor utilization should be lower than about
70% to 80%.
Processor Processor: % Processor
Time_(N)
Each processor instance should be lower than about
70% to 80% utilization.
Disk Physical Disk: Avg. Disk
sec/Transfer
Must be lower than about 25 ms.
Rule of thumb: When Avg. Disk Seconds/Transfer (the
disk latency counter) is significantly greater than 25
ms, the disk subsystem is unhealthy and is a
bottleneck. Remember, this counter does not tell us
how to fix the problem, it only indicates there is a
problem.
Disk PhysicalDisk: Average
Disk Queue Length
The average should be less than the number of
spindles of the disk. If a SAN is being used, ignore this
counter and concentrate on the latency counters:
PhysicalDisk\Average Disk sec/Read and
PhysicalDisk\Average Disk sec/Write.
Disk PhysicalDisk: Average
Disk sec/Read
The average value should be below 20 ms.
Spikes (maximum values) should not be higher than
50 ms.

40
Disk PhysicalDisk: Average
Disk sec/Write
The average value should be below 20 ms.
Spikes (maximum values) should not be higher than
50 ms.
Network Network Interface: Bytes
Total/sec
For a 100-Mbps network interface card (NIC), it should
be below 6–7 MB/sec.
For a 1000-Mbps NIC, it should be below 60–70
MB/sec.
Network Network Interface:
Packets Outbound
Errors
It should be zero (0) at all times.
3.2.2 BI Process level Performance Counters using Windows Perfmon Utility
Product process Counters / Guidance
Oracle Business Intelligence EE (OBIEE)
Instance:
1. sawserver.exe (BI Presentation Services)
2. nqsserver.exe (BI Server).
3. java.exe (Managed Server).
4. java.exe (Javahost).
Process: % Processor Time – Process processor
utilization should be lower than 90%.
Process: Private Bytes - reports bytes allocated
exclusively for a specific process; its value tends to
rise for a leaking process.
Process: Working Set - reports the shared and private
bytes allocated to a process; its value tends to rise for
a leaking process.
Process: Page Faults /sec - reports the total number of
faults (hard and soft faults) caused by a process; its
value tends to rise for a leaking process.
Process: Handle Count - reports the number of
handles that an application opened for objects it
creates. Handles are used by programs to identify
resources that they must access. The value of this
counter tends to rise during a memory leak.
Process: Virtual Bytes - The current size, in bytes, of
the virtual address space the process is using. The
virtual byte of the perfmon process grows at a quick
rate and never releases any memory indicating
memory leak in application.
Process: Virtual Bytes Peak - The maximum size, in
bytes, of virtual address space the process has used at
any one time. The virtual byte of the perfmon process
grows at a quick rate and never releases any memory
indicating memory leak in application.

41
3.3 Performance Monitoring in UNIX environment This section outlines the key performance monitoring utilities/commands that can be
employed in the UNIX environment i.e. Linux, Solaris and AIX.
a. Linux
top - This program shows a lot of performance statistics that goes on with your
system. In the program, you can type:
M for memory usage information
P for CPU information
q to quit
It also shows you the memory usage, uptime, load average, CPU states, and
processes.
mpstat - Report processors related statistics
e.g. mpstat -P ALL 2 5
Display five reports of statistics for all processors at two second intervals.
vmstat - vmstat reports virtual memory statistics of process, virtual memory, disk,
trap, and CPU activity.
b. Oracle Solaris
iostat: Reports terminal and disk I/O activity and CPU utilization. The first line of
output is for the time period since boot & each subsequent line is
for the prior interval. Kernel maintains a number of counters to keep track of the
values.iostat's activity class options default to tdc (terminal, disk, and CPU).
vmstat: vmstat reports virtual memory statistics of process, virtual memory, disk,
trap, and CPU activity. Tip: Use nmon to monitor as vmstat only allows 4 disks to
be observed.
sar: Collects, reports, or saves system activity information. Example: sar -A -o <name
of the file> <interval> <count>. This file can be read by using the command “sar –f
<name of the file>”.
prstat - Report statistics on active process stats.

42
c. AIX
vmstat – Statistics about virtual memory and cpu/hard disk usage
Usage: vmstat [ -f ] [ -i ] [ -s ] [ -I ] [ -t ] [ -v ] [ PhysicalVolume ... ] [Interval [ Count ] ]
Example: vmstat hdisk0 hdisk1 5 - Displays the statistics of the disks every 5
seconds.
iostat - Reports Central Processing Unit (CPU) statistics and input/output statistics
for the entire system, adapters, TTY devices, disks and CD-ROMs.
Usage: iostat [ -s ] [ -a ] [ -d | -t ] [ -T ][ -m ][ Physical Volume ... ] [ Interval [Count ] ]
-a specifies adapter throughput report
-s specifies system throughput report
-t specifies tty/cpu report only
-T specifies time stamp
-d specifies drive report only
-m specifies statistics for paths
nmon: Collects, reports, or saves system activity information.
sar: Collects, reports, or saves system activity information.
Usage: /usr/sbin/sar [ { -A | [ -a ] [ -b ] [ -c ] [ -d ][ -k ] [ -m ] [ -q ] [ -r ] [-u ] [ -V ] [ -v ]
[ -w ] [ -y ] } ] [ -P ProcessorIdentifier, ... | ALL ] [-ehh [ :mm [ :ss ] ] ] [ -XFile ] [ -fFile
] [ -iSeconds ] [ -oFile ] [ -shh [:mm [ :ss ] ] ] [ Interval [ Number ] ]
Example: sar -A -o <name of the file> <interval> <count>. This file can be read by
using the command “sar –f <name of the file>”.
lvmstat: Reports input/output statistics for logical partitions, logical volumes and
volume groups.
Usage: lvmstat { -l | -v } Name [ -e | -d ] [ -F ] [ -C ] [ -c Count ] [ -s ] [Interval [
Iterations ] ]
Tip: Your operating system’s network monitoring tools can be used to monitor
utilization, verify that the network is not becoming a bottleneck, or detect packet
loss or other network performance issues. For details on network performance
monitoring, refer to your operating system documentation.

43
4.0 TUNING OBIEE COMPONENTS This chapter includes the following sections that provide a quick start for tuning
Oracle® Business Intelligence system components (OBIPS, BI Server).
4.1 Oracle® BI Presentation Services Component To achieve better performance with Presentation Services (OBIPS) component, the
following parameters can be tuned in instanceconfig.xml, config.xml and opmn.xml files
for better performance and scalability.
Charting threads / memory related tunable parameters Number of charting threads and maximum number of jobs allowed in the queue can be tuned for
performance when the dashboards have several charts:
Important Note: OBIPS has a thread pool for Javahosts. Its size needs to be the total number of
threads allowed in all Javahosts. For example, if there are two Javahost instances. Each has 200
threads defined in its own (Javahost) configuration file (config,.xml), and then the MaxThreads size
for OBIPS chart threadpool size needs to be 400 (200 + 200).
a. In instanceconfig.xml file located at
ORACLE_INSTANCE/config/OracleBIPresentationServicesComponent/coreapplication_obipsn,
add the following inside <ServerInstance>:
<ServerInstance>
<ThreadPoolDefaults>
<ChartThreadPool>
<MinThreads>100</MinThreads>
<MaxThreads>400</MaxThreads>
<MaxQueue>2048</MaxQueue>
</ChartThreadPool>
</ThreadPoolDefaults>
</ServerInstance>
b. In config.xml file located at
ORACLE_INSTANCE/config/OracleBIJavaHostComponent/coreapplication_obijhn/, add the following
inside <JavaHost>:
<JavaHost>
<JobManager> <MinThreads>100</MinThreads>
<MaxThreads>200</MaxThreads>
<MaxPendingJobs>200</MaxPendingJobs>
</JobManager>
</JavaHost>
c. In opmn.xml file located at ORACLE_INSTANCE/config/OPMN/opmn/ , for Javahost (64bit)
set heap size to -server –Xmx2048M and for Javahost (32bit) set heap size to -server –
Xmx1536M . Tip: In following section of opmn.xml file, increase the heap size to 2GB
for 64bit Javahost process:
<process-type id="OracleBIJavaHostComponent" module-id="CUSTOM">
<module-data>
<category id="start-parameters">
<data id="start-executable" value="$ORACLE_HOME/jdk/bin/java" />
<data id="start-args" value="-server –Xmx2048M …
…. >

44
Caching related tunable parameters There are several OBIPS cache related parameters that can be used to increase OBI PS Caching i.e.
number of cache entries, expiry time, and algorithm to clean up the cache etc. In instanceconfig.xml file, add the following inside <ServerInstance>:
<ServerInstance>
<Cache>
<CatalogXml> <!-- Remove from the cache everything older than N minutes -->
<MaxAgeMinutes>240</MaxAgeMinutes>
<MaxLastAccessedSeconds>14400</MaxLastAccessedSeconds>
</CatalogXml>
<Query>
<MaxEntries>5000</MaxEntries> <!-- AbsoluteMaxEntries is the enforced maximum number of entries. When this maximum is reached -->
<!-- subsequent queries will fail until the maximum is no longer exceeded. -->
<AbsoluteMaxEntries>20000</AbsoluteMaxEntries> <!-- CruiseEntries is amount of entries the OracleBI Presentation server tries to maintain in its cache. -->
<CruiseEntries>3000</CruiseEntries> <!-- Forces the cache to attempt to remove an old entry when MaxEntries is exceeded. -->
<ForceLRU>true</ForceLRU>
</Query>
<Accounts> <!-- Cleanup this cache every N minutes. -->
<CleanupFrequencyMinutes>14400</CleanupFrequencyMinutes>
</Accounts>
<AccountIndex> <!-- Cleanup this cache every N minutes. -->
<CleanupFrequencyMinutes>14400</CleanupFrequencyMinutes>
</AccountIndex>
<CatalogAttributes> <!-- Cleanup this cache every N minutes. -->
<CleanupFrequencyMinutes>14400</CleanupFrequencyMinutes>
</CatalogAttributes>
</Cache>
</ServerInstance>
Waiting time for results Controls how long the server waits for results after the initial request before returning the Searching
page to the browser. It may be useful to set this value higher (such as 10 seconds) to avoid page
refreshes if the majority of queries are not returning in 1 second. If running performance tests some
test implementations behave properly only if this setting is set very high (such as 1000 seconds).
In instanceconfig.xml file add the following inside <ServerInstance>:
<ServerInstance>
<Cursors>
<NewCursorWaitSeconds>10</NewCursorWaitSeconds>
</Cursors>
</ServerInstance>

45
OPIS Session Timeout parameter
In Fusion Middleware Control following value (in screenshot) can be decreased from 3.5 hours to free
up resources:
Important Note: By default in Analytics plug-in in WLS, the Session timeout (in seconds) is set to
3600 seconds (60 minutes) to control the timeout of the sessions. By setting OBIPS timeout to 60
minutes, it will be in sync with the session timeout in Analytics plug-in in WLS.
Validating the Catalog
Tip: Web catalog upgrade from 10g to 11.1.1.5 or 11.1.1.6 sometime corrupts some user permissions,
this may cause slow user login time and also slowness in accessing the dashboard. Below are the
steps to perform web catalog validation:
Resolution:
(a) Cleanup Web catalog via instanceconfig.xml using the steps documented in "Validating the
Catalog" section in System Administrator's Guide for Oracle Business Intelligence Enterprise Edition
(http://docs.oracle.com/cd/E23943_01/bi.1111/e10541/prescatadmin.htm#BAJBJEFA ).
(b) Runcat cmd line commands (./runcat.sh –help) to cleanup all permissions that appear to be
invalid (for more details on runcat command, refer to
http://docs.oracle.com/cd/E23943_01/bi.1111/e10541/prescatadmin.htm#i1005671 ).
Note: It is recommended to run all above tasks each & every time content is delivered from a
development environment into production environment (e.g. weekly), as part of the OBIEE
administrator's regular backup & maintenance of the catalog.
Updating Catalog Objects (this only applies / available in 11.1.1.6 release)
Scan the catalog and update any objects that were saved with earlier versions of Oracle Business
Intelligence. These updates might improve the performance of these objects. In a multiple node
cluster, update objects only after all nodes have been upgraded to the appropriate version of Oracle
Business Intelligence.
For details on how to Use Scan and Update Web Catalog feature, refer to document link @
http://docs.oracle.com/cd/E23943_01/bi.1111/e10541/prescatadmin.htm#CDCBEEGF

46
4.1.1 Using Fusion Middleware Control to Vertically Scale Presentation Services /
Javahost Components can help scalability
Before increasing the number of Presentation Services and Javahost per server, make
sure you have enough system resources available on 32 bit / 64 bit servers and
during performance / load testing, adjust as needed. For a stable / an even
performance over time, you should at least set two Presentation Services per server
and two Javahost per server.
You can use the below Scalability tab of the Capacity Management page in Fusion
Middleware Control to scale in the Presentation Services to two per server and
Javahost to two per server:
Important Note: When you have multiple instances of a given Oracle Business
Intelligence component in the deployment, you should first configure shared files and
directories (i.e. Oracle BI Presentation Catalog, Global cache) for the clustered
components to use. Then, use Fusion Middleware Control to increase the number of
Presentation Services and Javahost components that run on the existing Oracle
Business Intelligence host (for more information on vertical scaling refer to
documentation library link @ http://docs.oracle.com/cd/E21764_01/bi.1111/e10541/cluster.htm#BABCABBC ).
Caution: Use the above suggested settings as a starting point, and then, after careful
performance testing, adjust as needed. To avoid potential performance issues, values for
OBIPS parameters should be set only after considering the nature of the workload and the
system capacity (i.e. CPU and memory).

47
4.2 Oracle® BI Server Component Following are the important parameters to tune in NQSConfig.INI file and will
increase the performance of the BI system under high users load:
Initialization blocks Repository init-blocks: Called once during server startup and refreshed after the refresh
interval as needed.
Session init-blocks: called for each new session; slow SQL can slow down login.
o Session init-blocks should be minimized and lazily loaded (deferred)
Previously it was not possible to defer row-wise init-blocks; restriction has
been lifted in 11.1.1.6 release.
Number of Init Blocks
For a given session, Init Block queries are executed serially and represent the per session memory
costs. Be judicious in creating Init Blocks. Verify that the same Init Block query is not already being
used in some other Init Block. Verify that cache is enabled for the Init Block and is being utilized
Init block connection pool and location of data source
As a practice, allocate a separate DB connection pool for Init Blocks [ensure enough connections are
available] in the OBIS repository. Init Block query response time will be high if the connection pool
points to a remote database.
Init Blocks Cache
The number of Init Block result sets that are cached with respect to row-wise initialization, can
be tuned.
NQSConfig.INI parameter:
[ SERVER ]
INIT_BLOCK_CACHE_ENTRIES = 5000
Database connection pool tuning The maximum connection size needs to be set in the repository for each DB connection pool.
Maximum connections parameter in each connection pool of the repository should be set to a very
large value. It controls the number connections which can be made by BI server to the database.
Use OBIS performance counters in EM to determine if more or fewer DB connections are required.
For a simple sizing calculation, let’s assume there are peak N users concurrently downloading dashboard
pages. On average, each dashboard page executes L logical queries. On average, each logical query executes
P physical queries. Then the number of DB connections required for this load would be N * L * P.
Important Note: If fewer connections are specified, then response times will increase.
Data Mart Automation performance tuning in repository The following parameters in the OBIS repository can be tuned to achieve better aggregate creation
time:
MIN_BULK_FETCH_BUFFER_SIZE (default value 32768) and
MAX_BULK_FETCH_BUFFER_SIZE (default value 327680) needs to be set to a higher value
i.e. 5000000.
Tip: Based on your data source used, tune these above values in DBFeatures.INI file.

48
Tuning of OBI Server session and threads
Maximum number of concurrent client connections (sessions) to OBI server can be tuned.
Each client request to OBI Server uses one SERVER_THREAD.
Each SERVER_THREAD uses 0 or more DB_GATEWAY_THREADs depending upon the
number of DB queries executed.
NQSConfig.INI parameters to be tuned:
[ SERVER ]
MAX_SESSION_LIMIT=5000
SERVER_THREAD_RANGE = 40-260;
DB_GATEWAY_THREAD_RANGE = 50-520;
Query plan caching When the Query Plan cache is hit :
o It eliminates query parsing time.
o It increases scalability due to less lock contention.
Never set the query plan cache size to 0. Doing so may cause Result Cache misses.
NQSConfig.INI parameters to be tuned:
[ CACHE ]
MAX_QUERY_PLAN_CACHE_ENTRIES = 1024; // default is 1024
Query Results Caching One of the main advantages of query caching is to improve apparent query performance. It
might be valuable to seed the cache during off hours by running queries and hence causing the
server to cache their results.
The number of cache entries and disk size limit for the cache can be configured.
This configuration parameters can be set through by Oracle Business Intelligence Enterprise
Manager.
NQSConfig.INI parameters to be tuned :
[ CACHE ]
ENABLE = YES;
MAX_ROWS_PER_CACHE_ENTRY = 100000; // Too many rows in cache can slow down performance
# This Configuration setting is managed by Oracle Business Intelligence Enterprise Manager MAX_CACHE_ENTRY_SIZE = 40 MB; # This Configuration setting is managed by Oracle Business Intelligence Enterprise Manager MAX_CACHE_ENTRIES = 5000;
Read-Only Mode Makes the repository read-only so that online updates cannot be made.
Increased scalability due to less lock contention
NQSConfig.INI parameters to be tuned:
[ SERVER ] # This Configuration setting is managed by Oracle Business Intelligence Enterprise Manager READ_ONLY_MODE = YES;

49
Improve sort efficiency by increasing sort buffer It helps to have the sort directory on a fast disk (e.g. a RAM disk)
NQSConfig.INI parameters to be tuned:
[GENERAL]
WORK_DIRECTORY_PATHS = "C:\Temp"; /* /dev/shm on Linux */
SORT_MEMORY_SIZE = 4 MB ;
SORT_BUFFER_INCREMENT_SIZE = 256 KB ;
Cluster aware Cache seeding (using nqcmd or Agent a.k.a ibot) Seeding one node propagates across cluster
Data from shared location is pulled into local cache location during every poll
NQSConfig.INI parameters to be tuned:
[ CACHE ] # This Configuration setting is managed by Oracle Business Intelligence Enterprise Manager GLOBAL_CACHE_STORAGE_PATH = "<shared directory name>" SIZE;
MAX_GLOBAL_CACHE_ENTRIES = 1000;
CACHE_POLL_SECONDS = 300;
Increase VIRTUAL_TABLE_PAGE_SIZE
When VIRTUAL_TABLE_PAGE_SIZE is increased, I/O operations are reduced. Complex queries
may use 20 to 30 virtual tables, while simple queries may not even require virtual tables. The
default size of 128 KB is a reasonable size when one considers that the size for virtual paging in
Windows is 64 KB. This parameter can be tuned depending on the number of concurrent users and
the average query complexity. In general, setting the size higher than 256 KB does not yield a
corresponding increase in throughput due to the 64 KB size limit of Windows system buffers, as
each I/O still goes through the system buffers
NQSConfig.INI parameters to be tuned:
[GENERAL]
VIRTUAL_TABLE_PAGE_SIZE = 256 KB;
Tip: For more details on above parameters in NQSConfig.INI, refer to System Administrators
Guide for Oracle Business Intelligence.pdf
Important Note: You need to determine the optimal value for the parameter stated in above
table as part of your pre-production performance / load testing.
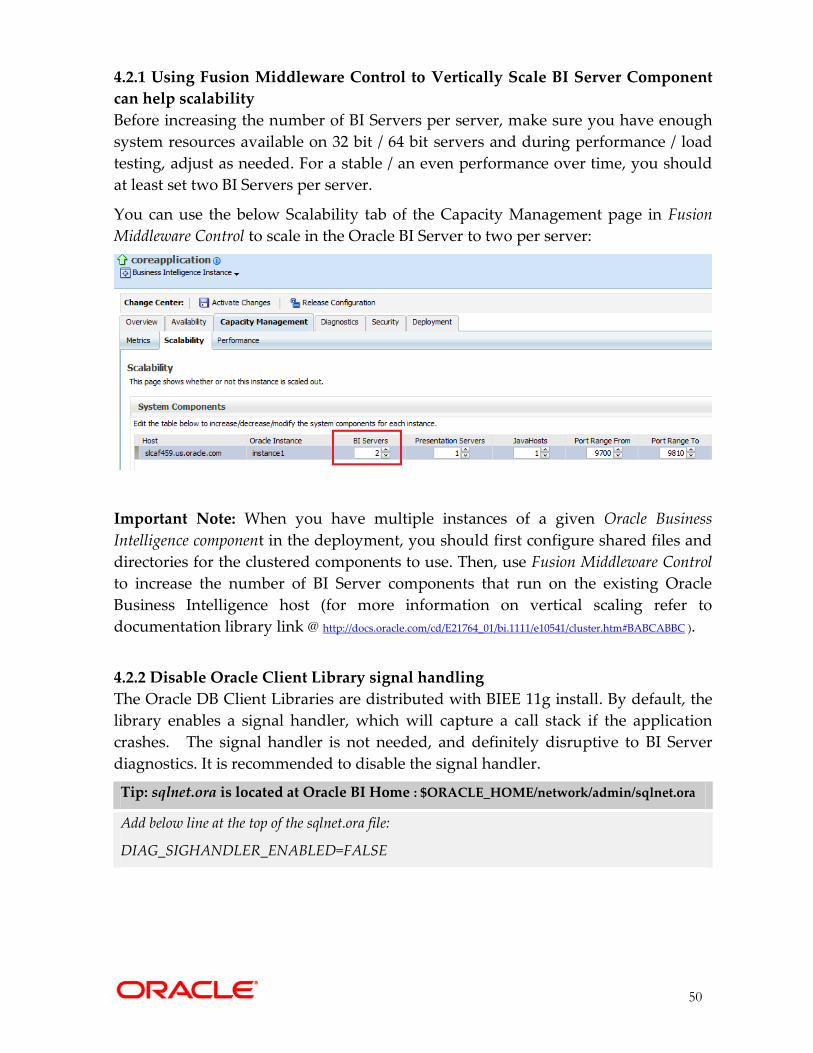
50
4.2.1 Using Fusion Middleware Control to Vertically Scale BI Server Component
can help scalability
Before increasing the number of BI Servers per server, make sure you have enough
system resources available on 32 bit / 64 bit servers and during performance / load
testing, adjust as needed. For a stable / an even performance over time, you should
at least set two BI Servers per server.
You can use the below Scalability tab of the Capacity Management page in Fusion
Middleware Control to scale in the Oracle BI Server to two per server:
Important Note: When you have multiple instances of a given Oracle Business
Intelligence component in the deployment, you should first configure shared files and
directories for the clustered components to use. Then, use Fusion Middleware Control
to increase the number of BI Server components that run on the existing Oracle
Business Intelligence host (for more information on vertical scaling refer to
documentation library link @ http://docs.oracle.com/cd/E21764_01/bi.1111/e10541/cluster.htm#BABCABBC ).
4.2.2 Disable Oracle Client Library signal handling
The Oracle DB Client Libraries are distributed with BIEE 11g install. By default, the
library enables a signal handler, which will capture a call stack if the application
crashes. The signal handler is not needed, and definitely disruptive to BI Server
diagnostics. It is recommended to disable the signal handler.
Tip: sqlnet.ora is located at Oracle BI Home : $ORACLE_HOME/network/admin/sqlnet.ora
Add below line at the top of the sqlnet.ora file:
DIAG_SIGHANDLER_ENABLED=FALSE

51
4.2.3 Avoid Excessive BI Logging
Avoid excessive writing to log files in following BI Server components because this
can quickly create a disk bottleneck under high users load test.
a. OBIS Query Loglevel:
Set Loglevel 2 this will provide the logical query, physical query and the response
times. Note: It has reasonable low overhead in low to moderately busy system and
can be kept at level 2 in production.
b. Set BIEE log level to ‘Error’:
In EM, set default log level for all BI System components to “Error”. See below:

52
5.0 TUNING ORACLE® ESSBASE This chapter includes the following sections that provide a quick start for tuning
OBIEE with the Essbase ASO cube as a data source. For more tunings options, refer
to Essbase DBA guide at http://docs.oracle.com/cd/E17236_01/epm.1112/esb_dbag/frameset.htm?launch.html .
5.1 Essbase ASO Tuning This topic describes how to tune the Essbase ASO to optimize the performance of
your applications. Following are the tuning areas to consider when tuning Essbase
ASO:
Aggregated Views
Essbase CFG Settings
Database level settings
MDX Optimizations
Understanding the Dynamic Calculations Log Messages
5.1.1 Aggregated Views
Perform first time Aggregations.
Important Note: The default selection of aggregate views proposed by Essbase
provides excellent performance.
Tip: The following process is recommended for defining and materializing
aggregations:
o After the outline is created or changed, load data values.
o Perform the default aggregation. Do not select specify a storage stopping
point option.
o Materialize the suggested aggregate views and save the default selection
in an aggregation script.
o Run the types of queries the aggregation is being designed for.
o If query time or aggregation time is too long, consider fine-tuning the
aggregation as stated below.
o Save the aggregation selection as an aggregation script.
Fine-Tuning Aggregate View Selection
Important Note: The default selection of aggregate views proposed by Essbase
provides excellent performance.
Tip: The following process is recommended for fine-tuning aggregations:
o Perform the default aggregations as described above.
o Save the default selection in an aggregation script.
o Turn on query tracking.
o Run the queries against the database, note: Queries from all query tools are
tracked.

53
o After sufficient time to capture data retrieval requirements, perform another
aggregation including tracked data.
o Analyze the proposed list of aggregate views to be stored and select the
aggregate views that you determine provide the best balance of system
resources and retrieval performance.
o Materialize the selected aggregate views and, saved the selection in an
aggregation script.
o Working with aggregation scripts and various selection criteria, repeat the
process until you believe you have the optimum selection of aggregate views
for your situation.
Important Note: To optimize aggregations for different database retrieval situations,
such as for generating reports or user queries, you may need to repeat the tuning
process, creating an aggregation script for each situation, refer to Oracle Essbase
Database Administrator's Guide.
5.1.2 Essbase.cfg Settings
Following are the Essbase parameters to consider in Essbase.cfg file, note for more
information about all of these parameters refer to Oracle Essbase Database
Administrator's Guide:
SERVERTHREADS 100
AGENTTHREADS 25
Important Note: Use the above settings as a starting point, and then, after careful testing,
adjust as needed. AGENTTHREADS default value is 5. It is strongly recommended that you
use this default value if you are running Essbase a 32-bit platform. If your Essbase Server
computer freezes while running multiple reports at the same time, increase the value of
SERVERTHREADS by one for each report you run.
; NETDELAY ;It is recommended to use default value (200)*
; NETRETRYCOUNT ;It is recommended to use default value (600)*
Important Note*: It is recommended to set the timeout to default values, which is 2 minutes.
If need be, the max amount of timeout that is recommended should not be above 5 minutes.
The reason is because there have been a lot of customers complaining about Essbase
“hangs”. However, technically there is no hang until this “hang” exceeds the
NetDelay/NetRetryCount settings.
Tip: How to calculate the timeouts from these settings, i.e. NetDelay (200) is in
milliseconds so divide by 1000 then multiple by NetRetryCount (600) to get timeout
in seconds, for example: (200/1000) * 600 = 120 seconds (120/60 = 2 minutes)

54
5.1.3 Database Level Settings
ASO Pending Cache Size:
o Essbase Pending Cache Size: When millions of members, try higher values
than default, e.g. 256 MB (on Essbase Server 32 bit) or 2048 MB (on Essbase
Server 64 bit) instead of staying with 32 Mb.
Tip: Monitor the cache hit ratios (should be close to 1) in Essbase
Administration Console and adjust cache size accordingly.
Retrieval Buffer Size
o Set Retrieval Buffer Size to 50 KB for 32 bit platform and 100 KB for 64 bit
platform: The default buffer size is 10 KB for 32-bit platforms and 20 KB for
64-bit platforms.
o Set Retrieval Sort Buffer Size to 50 KB for 32 bit platform and 100 KB on 64 bit
platform: Essbase requires a larger retrieval sort buffer size on 64-bit
platforms than on 32-bit platforms.
Important Note: It is recommended to start with default values and a test
incremental setting on largest query tuning is based on. As this setting is per user
report request so it may lead to wastage of memory and only want to set as much as
needed. Also note the retrieval buffer is allocated per thread, so the amount of memory
needed is the number of server threads multiplied by the retrieval buffer size.
5.1.4 MDX Optimizations
The NONEMPTYMEMBER property enables MDX in Essbase to query on large
sets of members while skipping formula execution on non-contributing values
that contain only #MISSING data.
Non empty behavior can be defined by adding the following directives before a
formula
o NONEMPTYMEMBER <memberlist>
o NONEMPTYTUPLE <tuple> Tip: Below link has information about NONEMPTYMEMBER optimization: http://download.oracle.com/docs/cd/E17236_01/epm.1112/esb_tech_ref/mdx_properties_opt.html
Example - Tuning Calculation Using NON EMPTY Behavior
o The measure [Units] is a loaded value
o The measure [Avg. Units/Transaction] is calculated using formula [Avg. Units/Transaction] = [Units]/[Transactions]

55
o The value of [Avg. Units/Transaction] is empty if value of [Units] is empty.
The calculation of [Avg. Units/Transaction] can be skipped if value of [Units] is
empty. We can add non empty behavior for [Avg. Units/Transaction] by
rewriting the formula as o [Avg. Units/Transaction] = NONEMPTYMEMBER [Units] [Units]/[Transactions]
The saving obtained from defining non empty behaviors can be very significant.
Savings increase with the complexity of the formula and sparseness of the data.
5.1.5 Understanding the Dynamic Calculations Log Messages
Essbase application log has some informative messages related to dynamic
calculations that can be helpful in tuning:
o The following message indicates an error in a formula. Fix the error message
or drop these members from outline if they are not required.
Error encountered when loading member [<MemberName>]'s calc string
[<FormulaExpression>], ignored
o The following message indicates invalid solve order assignment. Assign
correct solve orders for members indicated in the message.
Invalid formula for member [<A>] (reason: depends on a member [<B>] with
higher solveorder ) will be ignored during execution
o The following message indicates that a formula is too complex for Essbase to
optimize. Rewrite if possible.
Formula for member [% of Total] will be executed in [CELL] mode
o The following message indicates that a formula is complex and Essbase
couldn’t detect a non empty behavior for it.
The formula for member [MemberName] is Complex. If possible, add a non-
empty directive to optimize for sparse data
56
Comments welcome
Your comments are important to us!
We want our Best Practices Guide for Infrastructure Tuning Oracle® Business
Intelligence Enterprise Edition to be as helpful as possible. Send us your comments
about this at in an email to Product Assurance team @ https://blogs.oracle.com/pa/entry/test
Best Practices Guide for Tuning Oracle® Business Intelligence Enterprise Edition
Revised edition: December 2012
Author: Ahmed Shahzad Awan
Oracle® EPM/BI Product Development – Product Assurance (PA) @ http://blogs.oracle.com/pa
Oracle® Corporation
World Headquarters
500 Oracle® Parkway
Redwood Shores, CA 94065
U.S.A.
Worldwide Inquiries:
Phone: +1.650.506.7000
Fax: +1.650.506.7200
www.Oracle®.com
Oracle® is a registered trademark of Oracle® Corporation. Various
product and service names referenced herein may be trademarks
of Oracle® Corporation. All other product and service names
mentioned may be trademarks of their respective owners.
Copyright © 2012 Oracle® Corporation
All rights reserved.