Updated Health and Air Pollution in New Zealand Study Update_Vol 1 Summary Report.pdf ·...
89
Updated Health and Air Pollution in New Zealand Study Volume 1: Summary Report Prepared for Health Research Council of New Zealand, Ministry of Transport, Ministry for the Environment and New Zealand Transport Agency March 2012
Transcript of Updated Health and Air Pollution in New Zealand Study Update_Vol 1 Summary Report.pdf ·...

Updated Health and Air Pollution in New Zealand Study
Volume 1: Summary Report
Prepared for Health Research Council of New Zealand, Ministry of Transport, Ministry for the Environment
and New Zealand Transport Agency March 2012

Disclaimer
This research was funded by the Health Research Council of New Zealand, the Ministry for the Environment, the Ministry of Transport and the New Zealand
Transport Agency through the HRC’s Partnership Programme.
The views expressed in research reports are the outcomes of the independent research, and should not be regarded as being the opinion or responsibility of the funding partners. The material contained in the reports should not be construed in any way as policy adopted by the funding partners or indeed any agency of the New Zealand Government. The reports may, however, be used by New Zealand
Government agencies as a reference in the development of policy.
While research reports are believed to be correct at the time of their preparation, the funding partners and agents involved in their preparation and publication do not accept any liability for use of the research. People using the research, whether directly or indirectly, should apply and rely on their own skill and judgement. They should not rely on the contents of the research reports in isolation from other sources of advice and information. If necessary, they should seek appropriate legal or other
expert advice.

Updated Health and Air Pollution in New Zealand Study
Volume 1: Summary Report
Prepared by
Gerda Kuschel and Jayne Metcalfe (Emission Impossible Ltd)
Emily Wilton (Environet Ltd)
Jagadish Guria (Independent Consultant)
Simon Hales (University of Otago)
Kevin Rolfe (Independent Consultant)
Alistair Woodward (University of Auckland)
March 2012
Lead author: Gerda Kuschel, Emission Impossible Ltd Suite 1-6, D72 Building, 72 Dominion Road, Mt Eden, Auckland 1024, +64 9 629 1435
[email protected], mob +64 21 2700 639

i Updated HAPINZ Volume 1: Summary Report
March 2012
Acknowledgements
This project was originally funded by:
o Health Research Council of New Zealand
o Ministry of Transport
o Ministry for the Environment
o NZ Transport Agency
With in-kind support from:
o Ministry of Health
o Auckland Council
During the course of the project, the following three councils supplemented the funding to enable the Health Effects Model to automatically output results by all 71 airsheds across New Zealand:
o Auckland Council
o Waikato Regional Council
o Environment Canterbury
In addition to the funding, the authors would also like to acknowledge the invaluable assistance provided by various staff members from:
o Northland Regional Council
o Auckland Council
o Waikato Regional Council
o Bay of Plenty Regional Council
o Gisborne District Council
o Hawke’s Bay Regional Council
o Taranaki Regional Council
o Horizons (Manawatu-Wanganui) Regional Council
o Greater Wellington Regional Council
o Tasman District Council
o Nelson City Council
o Marlborough District Council
o Environment Canterbury
o West Coast Regional Council

ii Updated HAPINZ Volume 1: Summary Report
March 2012
o Otago Regional Council
o Southland Regional Council
And the inimitable guidance provided by the Environmental Health Joint Research Steering Committee members comprising:
o Iain McGlinchy, Chair (Ministry of Transport)
o Gary Hook (Health Research Council)
o Louise Wickham (Ministry for the Environment)
o Rob Hannaby (New Zealand Transport Agency)
o Frances Graham (Ministry of Health)
o Janet Petersen (Auckland Council)

iii Updated HAPINZ Volume 1: Summary Report
March 2012
Executive Summary
This report estimates the health impacts and social costs1 associated with air pollution in New Zealand for 20062.
Although air pollution is a complex mixture of contaminants and particles, this report is based on particulate matter less than 10 micrometres in size – commonly known as PM10 - because the majority of health effects in New Zealand are associated with this pollutant and it is a good indicator of the sources and effects of other air pollutants.
Air pollution health effects in New Zealand were first comprehensively assessed in the Health and Air Pollution in New Zealand (HAPINZ) study undertaken by Fisher et al. (2007). In this original study, health effects were evaluated for 67 urban areas based on the 2001 population and ambient monitoring data. The resulting social costs were presented in NZ$ as at June 2004. The authors estimated that air pollution from all sources in New Zealand was responsible for approximately 1,400 premature deaths per year, of which 1,100 premature deaths were attributed to anthropogenic (human-caused) sources.
Since the release of the original HAPINZ study, both the data availability and the understanding of air pollution health effects have improved. In particular, air quality monitoring is now undertaken in most urban locations in New Zealand – largely in response to the introduction of a national environmental standard for ambient PM10 concentrations in September 2005.
This report was commissioned to update the original study and is based on existing published work (detailed below), as new research was not conducted for this update:
o population data taken from the 2006 census
o recent monitoring, inventory and source apportionment data collected across New Zealand covering (or representing) ambient PM10 concentrations experienced in 2006 (averaged over 2006-2008)
o recent epidemiological results for the main health impacts of air pollution exposure for key population sub-groups, e.g. Māori and children, as well as for the whole population and
o updated social costs (in NZ$ as at June 2010), particularly the use of a transport risk (road safety) based value of a statistical life (VOSL), but not including any loss of life quality due to prolonged pain and suffering.
1 Costs here are referred at as social costs rather than health costs because they denote the total costs to society of the health effects which are more than just the costs incurred by the health system. 2 2006 was chosen as it is the year of the most recent census.

iv Updated HAPINZ Volume 1: Summary Report
March 2012
The update estimates annual average PM10 concentrations for each census area unit (CAU) across New Zealand and determines health effects and social costs associated with a range of air pollution sources, including:
o domestic fires used for home heating
o motor vehicles3
o industry
o open burning
o natural sources, e.g. sea spray and windblown dust.
We have developed a Health Effects Model, based on an Excel spreadsheet, which allows end-users to output results nationally, regionally, by Territorial Local Authority (TLA4), by Statistics NZ urban areas, or by airshed. End-users are also able to run scenarios for comparison with the base case, by selecting from a range of plausible input values of population, exposure and epidemiological exposure-response functions. The scenario option can be used to undertake sensitivity testing to test the effects of different assumptions, evaluate the effects of population and emissions trends, or review the effectiveness of different air quality management options.
Key Findings from the Update
The primary health impact resulting from air pollution (in terms of social costs) is premature mortality in adults. More than 2,300 New Zealanders are estimated to die prematurely each year due to exposure to PM10 pollution from all sources, with just over half associated with anthropogenic sources.
The total health impacts associated with anthropogenic air pollution in New Zealand each year are:
o 1,175 premature deaths in adults and babies
o 607 extra hospital admissions for respiratory and cardiac illnesses
o 1.49 million restricted activity days (days on which people cannot do the things they might otherwise have done if air pollution was not present).
3 This source includes on road vehicles only – off road vehicles, aviation, marine and rail are not included. 4 Note the number of TLAs is based on those that were in existence for the 2006 census. In 2010, there was an amalgamation of the eight Auckland councils so the number of TLAs is now 67 (excluding the Chatham Islands).

v Updated HAPINZ Volume 1: Summary Report
March 2012
The total social costs associated with anthropogenic air pollution in New Zealand are estimated to be $4.28 billion per year or $1,061 per person, with the following overall contributions attributed to each source:
o 56 per cent due to domestic fires
o 22 per cent due to motor vehicles
o 12 per cent due to open burning
o 10 per cent due to industry.
Domestic fires dominate the health impacts associated with anthropogenic air pollution in every location across New Zealand, except the Auckland region (most particularly in the TLA of Auckland City where motor vehicle health impacts are nearly twice those of domestic fires). However, not being able to robustly assess NO2 exposure means that the results of this update most likely under-estimate the health impacts of motor vehicle-related air pollution.
The remaining TLAs in the Auckland region show more or less equal proportions of effects attributed to domestic fires and motor vehicles. Other TLAs which are also more heavily impacted by motor vehicle emissions than the average include Hamilton City, Lower Hutt City, New Plymouth District, Tauranga City, and Wellington City.
Open burning is an appreciable air pollution source in all locations, rivalling motor vehicles and industry in its effects in many areas.
The effects associated with industry impacts vary significantly across New Zealand because the siting of many industries depends on access to particular resources which are often location-specific.
Māori are disproportionately represented in the adult premature mortality figures (18.3 per cent of deaths, but are only 8.7 per cent of adult population). This is not unexpected because the exposure-response function for Māori is nearly three times that of the whole adult population. However, the confidence intervals for the Māori adult and all adult response functions overlap so this finding may not be statistically significant. Regardless, it is of concern as this subgroup already experiences poorer health outcomes.
For the respiratory hospital admissions, one third of the cases occur in children aged 1 to 4 years – again a disproportionate effect given the population in that sub-group.
The overall health impacts in the update are comparable to those found in the original study (allowing for increases in population and changes in the exposure-response functions) but with a much greater proportion of health impacts found to be attributed to natural sources (taken from a number of source apportionment studies) and the emergence of a new but significant anthropogenic source – open burning. However, it should be noted that open burning has been banned in many airsheds since 2006 and is unlikely to feature as prominently as a source requiring intervention in future updates. The other major difference is in the social costs. The update estimates a higher cost from air pollution than previously because we have adopted a VOSL based on transport (road safety) risk to be consistent with the approach taken by overseas jurisdictions.

vi Updated HAPINZ Volume 1: Summary Report
March 2012
The information will be useful in cost-benefit analyses for a range of applications, such as:
o weighing benefits of health improvements against the costs of (various) air pollution reduction initiatives
o evaluating the effectiveness of existing policy initiatives (back-casting)
o assessing the likely effects of current population and business as usual trends (forecasting)
o developing targeted strategies for reducing the air pollution exposure of particularly vulnerable groups in the population.
Link to the other material as follows:
This report summarises the main findings of the updated Health and Air Pollution in New Zealand (HAPINZ) study and describes the workings of the Health Effects Model. It is intended for a general audience.
All of the technical reports (in their entirety) that were prepared as part of the updated HAPINZ study are presented in the Updated Health and Air Pollution in New Zealand Study Volume 2 – Technical Reports for those readers who would like more detailed information on the methodology. This report is supported by a detailed Exposure Model which contains all data, calculations and assumptions used to derive PM10 exposure for each CAU by source.
vii Updated HAPINZ Volume 1: Summary Report
March 2012
Contents
Acknowledgements ........................................................................................................................ i
Executive Summary ....................................................................................................................... iii
Contents ....................................................................................................................................... vii
1. Introduction ......................................................................................................................... 1
1.1 Background ................................................................................................................ 1
1.2 Reasons for this Update ............................................................................................. 2
1.3 Project Funding and Steering Committee .................................................................. 3
1.4 Updated versus Original HAPINZ Study ..................................................................... 3
1.5 Report Layout ............................................................................................................. 4
2. Assessing Air Pollution Health Impacts ................................................................................ 5
2.1 What are the Health Effects of PM10? ........................................................................ 5
2.2 How are the Health Effects of PM10 Assessed? .......................................................... 9
3. Assessing PM10 Exposure ................................................................................................... 11
3.1 Features of the PM10 Exposure Assessment ............................................................ 11
3.2 How was PM10 Exposure Assessed in this Update? ................................................. 12
3.3 Why Only PM10 and not Other Pollutants? .............................................................. 14
3.4 What about Other Sources? .................................................................................... 15
3.5 How does the Update compare with the Original HAPINZ? .................................... 16
4. Selecting Health Outcomes ............................................................................................... 17
4.1 Features of the Health Outcome Selection .............................................................. 17
4.2 How were the Health Outcomes Selected? ............................................................. 18
4.3 What are the Exposure-Response Functions? ......................................................... 20
4.4 What about Other Health Outcomes such as Asthma? ........................................... 22
4.5 How does the Update compare with the Original HAPINZ? .................................... 23

viii Updated HAPINZ Volume 1: Summary Report
March 2012
5. Estimating Social Costs ...................................................................................................... 24
5.1 Features of the Social Costs Estimation ................................................................... 24
5.2 How were the Social Costs Estimated? .................................................................... 24
5.3 Why value Statistical Lives and not Life Years Lost? ................................................ 26
5.4 How does our VOSL Compare with Overseas VOSLs? ............................................. 26
5.5 How does the Update compare with the Original HAPINZ? .................................... 28
6. Results and Discussion ....................................................................................................... 29
6.1 National Impacts ...................................................................................................... 29
6.2 Regional and Local Impacts ...................................................................................... 31
6.3 Sensitivity Testing .................................................................................................... 33
7. Conclusions and Recommendations .................................................................................. 37
7.1 Key Findings ............................................................................................................. 37
7.2 Policy Implications ................................................................................................... 38
7.3 Recommendations for Future Work ........................................................................ 39
References ................................................................................................................................... 41
Glossary ........................................................................................................................................ 43
Appendix 1: Tables of Results ................................................................................................. A1-1
A1.1 Premature Mortality (Adults) by Region by Source ............................................. A1-1
A1.2 Premature Mortality (Babies) by Region by Source ............................................. A1-3
A1.3 Cardiac Hospital Admissions by Region by Source ............................................... A1-4
A1.4 Respiratory Hospital Admissions by Region by Source ........................................ A1-5
A1.5 Restricted Activity Days by Region by Source ...................................................... A1-8
A1.6 Total Social Costs by Source ................................................................................. A1-9
Appendix 2: Sensitivity Analyses ............................................................................................. A2-1
A2.1 Effect of HiVol Corrections ................................................................................... A2-1
A2.2 Effect of Exposure-Response Values .................................................................... A2-2

ix Updated HAPINZ Volume 1: Summary Report
March 2012
A2.3 Cross-check of Mortality Effects using PM2.5 ........................................................ A2-3
A2.4 Effect of Cost Estimates ........................................................................................ A2-4
A2.5 Estimate of 2001 Air Pollution Health Impacts .................................................... A2-5
Appendix 3: Users’ Guide to the Health Effects Model ... ...................................................... A3-1

March 2012
1 Updated HAPINZ Volume 1: Summary Report
1. Introduction
1.1 Background
In 2003, the Ministry for the Environment, the Ministry of Transport and the Health Research Council of New Zealand (with in-kind support from the Ministry of Health and regional councils) commissioned the Health and Air Pollution in New Zealand (HAPINZ) study. In 2007, the HAPINZ study was published (Fisher et al. 2007). This represented New Zealand’s first study on the national health impacts of air pollution.
HAPINZ examined 67 urban areas and included 73 per cent of New Zealand’s population. The HAPINZ study linked anthropogenic (human-caused) air pollution with approximately 1,100 premature deaths each year. HAPINZ further estimated other illnesses caused by anthropogenic air pollution in New Zealand to include (annually):
o 700 extra hospital admissions for respiratory and cardiac illnesses
o 1.9 million restricted activity days5
The bulk of effects were associated with particulate pollution (PM10), but there were also effects associated with other pollutants, such as nitrogen dioxide, carbon monoxide and benzene. The total economic cost of anthropogenic air pollution in New Zealand (from both premature death and adverse health impacts) was estimated at $1.1 billion per year or $421 per person (in NZ$ as at June 2004).
HAPINZ further attributed health effects to major emission sources (domestic, transport, industry and background). The primary sources were home heating nationally, followed by vehicles in central Auckland, and industry.
In order to judge the extent of health impacts in a given population likely to be caused by an exposure in the environment, scientists use the results of epidemiological studies that have been carried out separately, perhaps in other countries, along with estimates of the degree of exposure (see page 8 for further details). The most severe category of health impacts estimated in the HAPINZ study was premature mortality resulting from chronic (long-term) exposure to PM10. The number of premature deaths was estimated by multiplying an exposure-response relationship by the estimated exposure. In the HAPINZ study, the exposure-response relationship assumed a 4.3 per cent increase in premature mortality for every 10 µg/m3 increase in annual PM10 concentrations. This was based on American studies of effects of air pollution exposure (Künzli et al. 2000). The HAPINZ study noted that, based on more recent studies, the true figure could be in the range of 4 to 8 per cent but it concentrated on providing a basis for comparison with a previous pilot study for the Ministry of Transport (Fisher et al. 2002).
5 A restricted activity day is a day on which people cannot do the things they might otherwise have done if air pollution was not present.

March 2012
2 Updated HAPINZ Volume 1: Summary Report
1.2 Reasons for this Update
Since HAPINZ was published in 2007, a number of issues have been raised with the original methodology6 and the study has also dated quickly. The authors themselves noted that by the time the original study was published, the population within their study areas had increased by 17 per cent from the base census year of 2001, which would similarly increase health impacts associated with air pollution.
Accordingly in 2010, the Ministry for the Environment, the Ministry of Transport, the New Zealand Transport Agency and the Health Research Council of New Zealand (with in-kind support from the Ministry of Health and Auckland Council) commissioned this update to HAPINZ7. The purpose of the update was to:
o update the base data for New Zealand to the 2006 census year
o assess the suitability, and update if appropriate, of exposure relationship(s) for PM10 with mortality and morbidity
o assess the suitability, and update if appropriate, of exposure relationship(s) for other key pollutants with mortality and morbidity
o review the use of a transport risk (road safety) based value of a statistical life (VOSL) and other jurisdictional approaches and, if appropriate, update this method and/or value
o update average medical costs
o review ambient air quality monitoring data since 2001 and, if appropriate, update HAPINZ calculations
o review published source apportionment studies since 2001 and, if appropriate, update HAPINZ calculations
o review published emissions inventories since 2001 and, if appropriate, update HAPINZ calculations and
o undertake sensitivity analyses for key parameters to query the robustness of results.
Another important feature of the update was the development of user-friendly spreadsheets and/or databases to show all underpinning calculations, data and
6 Many air quality practitioners noted inconsistencies and errors in the spreadsheets developed for the original HAPINZ study, in particular the over-estimation of benzene cancer cases, the use of arithmetic rather than population weighted averages, and the under-estimation of natural source contributions. Whilst unfortunate, these errors were found on investigation to largely counter each other resulting in the social costs remaining essentially the same. However, greater attention to quality assurance was highlighted as a critical requirement for future HAPINZ updates (Kuschel & Mahon 2010). 7 New research was not commissioned for this update and data are from existing published work.

March 2012
3 Updated HAPINZ Volume 1: Summary Report
assumptions. The intent of these spreadsheets was to provide transparent, robust and defensible estimates of:
o exposure to PM10 air pollution by census area unit, attributed by source
o mortality impacts of PM10 exposure in adults for non-external causes for all ethnicities and separately for Māori
o morbidity impacts of PM10 and other air pollutants (if available data support robust estimates)
o annual social costs due to exposure to PM10 and other pollutants (if available data support robust estimates) and
o sensitivity of predicted outcomes to key assumptions.
1.3 Project Funding and Steering Committee
The updated study has been overseen by an Environmental Health Joint Research Partnership Steering Committee (Steering Committee) comprising representatives from:
o Health Research Council (both staff and independent representatives)
o Ministry for the Environment (initially staff; post April 2011 a seconded technical expert from Environment Canterbury)
o Ministry of Health
o Ministry of Transport
o National Air Quality Working Group (Auckland Council)
o New Zealand Transport Agency.
A number of representatives on the Steering Committee have air quality expertise and were involved with the original HAPINZ study.
1.4 Updated versus Original HAPINZ Study
The Health and Air Pollution in New Zealand (HAPINZ) study (Fisher et al. 2007) was published in 2007 with a base year of 2001 (for census data and air quality monitoring data) with costs estimated as at June 2004. The original study will be referred to in this report as the original HAPINZ study.
The present study has a base year of 2006 to align with the most recent census data and reflects trends in the national demographics since 2001, in particular:
o New Zealand’s overall population has increased by 7.8 per cent.
o The urban population has grown by 8.1 per cent since 2001 while the rural population has grown by 6.0 per cent.
o The Māori population has increased by 7.4 per cent since 2001.

March 2012
4 Updated HAPINZ Volume 1: Summary Report
o The proportion of the population aged 65 years and over has increased from 12.1 per cent in 2001 to 12.3 per cent in 2006.
The update also uses monitoring data for 2006 to 2008 with costs as at June 2010 (to reflect the more recent publication date of 2011). This will henceforth, be referred to as the updated HAPINZ study.
Note: When this study commenced, the intention was to use the updated methodology to recalculate the health impacts later in 2012 when the March 2011 census results became available but, due to the Christchurch earthquakes, the census has now been delayed to March 2013 so this recalculation will not be able to be done until late 2014.
1.5 Report Layout
The report is structured as follows:
o Section 2 introduces the key steps involved in assessing air pollution health impacts
o Section 3 outlines the approach taken in this study to assess the exposure of New Zealanders to air pollution (PM10 exposure)
o Section 4 reviews the range of health outcomes chosen for this assessment
o Section 5 describes the estimates used to establish the resulting social costs
o Section 6 presents the results of this update together with an analysis of the sensitivity of the final figures to the assumptions made
o Section 7 reviews the overall conclusions of the updated HAPINZ study.

March 2012
5 Updated HAPINZ Volume 1: Summary Report
2. Assessing Air Pollution Health Impacts
Clean healthy air contributes to New Zealand’s quality of life - not only people’s health, but also the natural functioning of and the “beauty of the natural and physical environment” (MfE 2007). Air and air quality are both a taonga8 and a part of the kaitiakitanga9 for Māori.
Air pollution contains a complex mixture of gases and particles. The precise health impacts of exposure depend, in part, upon a range of subtle factors related to:
o the composition of the pollutant mixture
o the level and duration of exposure (effective dose) and
o the factors related to the exposed population, such as age, sex, ethnicity, pre-existing illnesses and access to health services (population sensitivity).
Health impacts assessments combine information on the profile of exposure in the population concerned (often based on air pollution monitoring) with external information on the health impacts that are expected given the level of exposure (based on evidence from separate epidemiological studies). In practice, because air pollution exposures are complex, it is necessary to simplify the assessment of air pollution effects by using summary indicators of exposure. The uncertainties involved in extrapolating health effects from one population to another are minimised when the exposures are estimated, and summarised, using comparable methods.
Particulate matter less than 10 micrometres in size10 (PM10) is the best available indicator of air pollution exposure currently in New Zealand. More extensive local observations are now available for PM10 than for other pollutants. In addition, relevant exposure-response functions outlining subsequent health effects of PM10 are available from New Zealand and international epidemiological studies. Although PM2.5 rather than PM10 is increasingly used in overseas assessments, there is insufficient information currently available in New Zealand to undertake a robust assessment of PM2.5 effects.
2.1 What are the Health Effects of PM10?
PM10 comes from anthropogenic (human-caused) sources such as burning coal, oil, wood, petrol and diesel in domestic fires, motor vehicles and industrial processes. Natural sources of particles include sea spray, dust, pollens, volcanic activity and more recently earthquakes (liquefaction dust). In most places in New Zealand, levels of PM10 in the air
8 A taonga in Māori culture is a treasured thing, whether tangible or intangible. 9A kaitiaki is a guardian, and the process and practices of protecting and looking after the environment are referred to as kaitiakitanga. 10 A micrometre is a millionth of a metre and is represented by the symbol µm.
March 2012
6 Updated HAPINZ Volume 1: Summary Report
are at their highest during winter months, due to the higher frequency of calm conditions and increased solid fuel (wood and coal) burning for home heating.
There is a substantial body of evidence that inhaling particulate matter (PM) is harmful to human health, particularly smaller fractions such as PM10, PM2.5 and finer. PM10 is a more inclusive, but less specific measure of exposure than PM2.5. PM10 includes PM2.5 plus the coarser PM2.5 to PM10 fraction. Generally larger particulate matter (between 2.5 and 10µm) deposits in the upper airways whereas smaller particulate matter (less than 2.5µm) lodges in the very small airways deep in the lung. Inhaled ultrafine particulate matter may even enter the bloodstream.
Particles of different sizes typically have different sources and different chemical and biological composition. The mechanisms of particle toxicity are complex and still not fully understood. For example, it is not yet certain which of the several classes of toxic effects observed in laboratory experiments are responsible for specific human health effects (Brook et al. 2010).
In laboratory experiments, human or animal cells exposed to particles from various sources show a range of inflammatory responses, which vary according to the source and composition of the particles. Particle characteristics including size, concentration, metal content, potential to cause oxidation and/or immunological responses have been shown to be important (Steenhof et al. 2011, Degobbi et al. 2010).
Air pollution exposure can have two classes of epidemiological effects: short-term and long-term effects. Short-term exposure to urban air pollution can cause respiratory irritation even in healthy people. In clinical exposure studies, a range of acute (short-term) cardiovascular and respiratory effects have been shown in volunteers with or without pre-existing diseases. Some short-term effects (such as heart rhythm disturbances) are completely reversible, but others can cause chronic inflammation of the lungs and blood vessels, and eventually, following repeated exposure, lead to chronic diseases such as lung cancer and atherosclerosis (hardening of the arteries). Short-term effects can include premature death in susceptible individuals, but the major impact of air pollution exposure on life expectancy is through the gradual, cumulative effects on chronic disease.
In epidemiological studies, effects of air pollution exposures can be assessed in real world conditions. Such studies include irreversible effects of air pollution on health outcomes, including long and short-term effects on death and disease. However, epidemiological studies cannot study the precise pathological mechanisms leading to development of chronic cardiovascular and respiratory diseases that are the most important health outcomes of air pollution exposures.
Assessment of air pollution effects should ideally include an appraisal of the sum of scientific evidence from laboratory, clinical and epidemiological studies. However, that is a major task requiring years of work by large scientific teams, and is beyond the scope of this report.
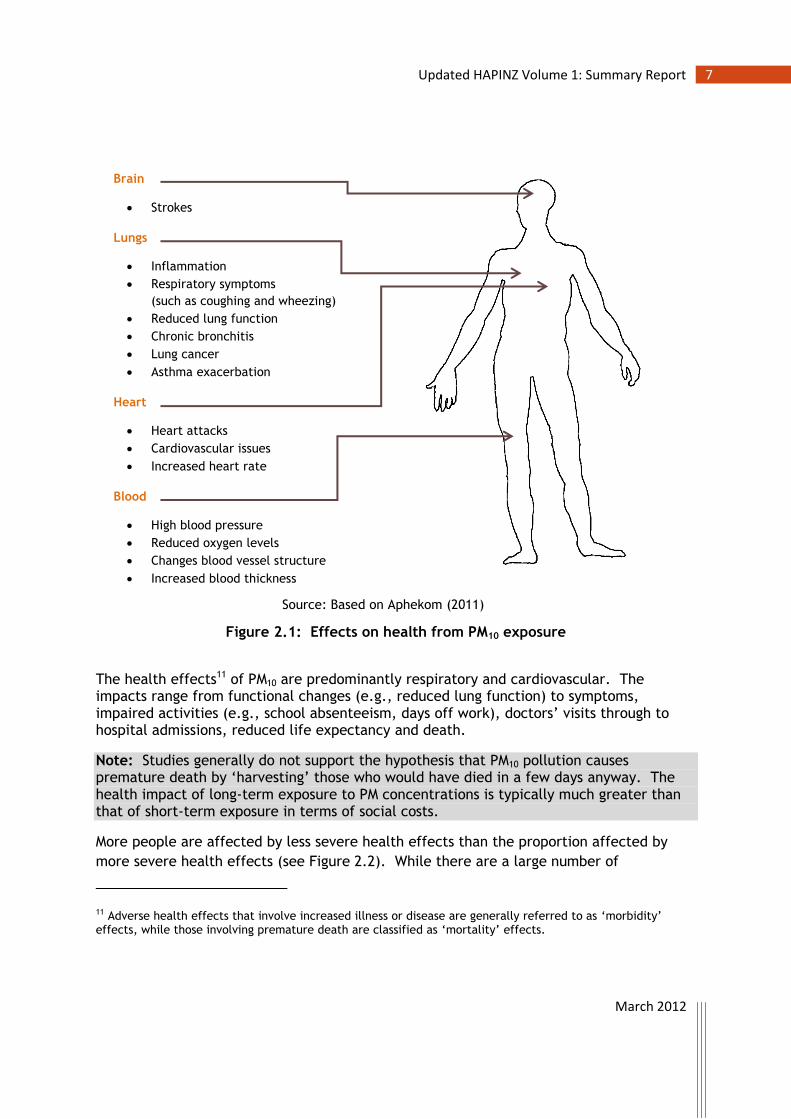
Figure 2.1 outlines the potential health effects specifically associated with PM10 exposure.
March 2012
7 Updated HAPINZ Volume 1: Summary Report
Figure 2.1: Effects on health from PM10 exposure
The health effects11 of PM10 are predominantly respiratory and cardiovascular. The impacts range from functional changes (e.g., reduced lung function) to symptoms, impaired activities (e.g., school absenteeism, days off work), doctors’ visits through to hospital admissions, reduced life expectancy and death.
Note: Studies generally do not support the hypothesis that PM10 pollution causes premature death by ‘harvesting’ those who would have died in a few days anyway. The health impact of long-term exposure to PM concentrations is typically much greater than that of short-term exposure in terms of social costs.
More people are affected by less severe health effects than the proportion affected by
more severe health effects (see Figure 2.2). While there are a large number of
11 Adverse health effects that involve increased illness or disease are generally referred to as ‘morbidity’ effects, while those involving premature death are classified as ‘mortality’ effects.
Brain
Strokes
Lungs
Inflammation
Respiratory symptoms
(such as coughing and wheezing)
Reduced lung function
Chronic bronchitis
Lung cancer
Asthma exacerbation
Heart
Heart attacks
Cardiovascular issues
Increased heart rate
Blood
High blood pressure
Reduced oxygen levels
Changes blood vessel structure
Increased blood thickness
Source: Based on Aphekom (2011)

March 2012
8 Updated HAPINZ Volume 1: Summary Report
acute/transitory health effects due to PM10, the fewer chronic impacts incur a much
greater social cost.
Figure 2.2: Pyramid of PM10 health effects
All PM10 is considered equally toxic
As already mentioned, there is a widespread consensus that air pollution causes adverse health effects. However, the link to individual sources is less clear. Particles from different sources (e.g., domestic fire emissions as opposed to sea spray) will have quite different chemical compositions, different physical characteristics and therefore potentially quite different toxicities but evidence from epidemiological studies is currently inconclusive. The World Health Organization (WHO 2006) states:
“The mass-based standards that have been proposed inherently assume that all airborne PM has the same potential to cause adverse health effects, regardless of chemical composition or physical characteristics. While both observational and experimental findings imply that particle characteristics are determinants of toxicity, definitive links between specific characteristics and the risk of various adverse health effects have yet to be identified.”
Source: WHO (2006)

March 2012
9 Updated HAPINZ Volume 1: Summary Report
Note: This updated HAPINZ study assumes that all PM10 is treated as equally toxic, irrespective of source, which is consistent with the WHO approach, and uses the wording “causes” for adverse effects linked to air pollution in general but uses the wording “is associated with” for adverse effects linked to specific sources of air pollution, such as domestic fires.
2.2 How are the Health Effects of PM10 Assessed?
Health impacts resulting from exposure to air pollution (in this case to PM10) are typically assessed in a step wise process as follows:
Estimate social costs
Base year for monetarisation? Value of statistical life?
Medical costs? Productivity losses?
Availability of supporting data?
Select health outcomes
Long-term or short-term? Age groups and gender?
Ethnicities? Risk of double counting?
Availability of robust response-functions? Availability of standardised incidence data?
Assess people’s exposure
Pollutants? Base year? Sources?
Spatial resolution? Availability and quality of monitoring data?
Availability of population data?

March 2012
10 Updated HAPINZ Volume 1: Summary Report
For each area under assessment (e.g., a census area unit, CAU), the health impacts are generally calculated as follows:
( )
Where ‘cases’ are the number of premature deaths, hospital admissions or restricted activity days etc. depending on the health outcome being assessed. These are usually assessed relative to a baseline rate that can vary significantly by population and region.
Note: We use the term ‘exposure-response’ rather than ‘concentration- or dose-response’ in this study. In this sense, ‘exposure’ refers to the exposure to ambient PM10 concentrations and does not take into account localised influences on personal exposure. This is appropriate because potential inaccuracies associated with higher or lower exposures are likely to balance out as they would have in the derivation of the dose/exposure-response relationships.
The social costs are then calculated as follows:
( )
Results can be aggregated and reported for larger urban areas (such as towns and cities) or management areas (such as regions or airsheds) depending on physical and political boundaries.
The information is used in cost-benefit analyses for a range of applications, such as:
o weighing benefits of health improvements against the costs of (various) air pollution reduction initiatives
o evaluating the effectiveness of existing policy initiatives (back-casting)
o assessing the likely effects of current population and business as usual trends (forecasting)
o developing targeted strategies for reducing the air pollution exposure of particularly vulnerable groups in the population.
The following chapters deal with the major steps in the air pollution health impact assessment in more detail:
o Assessing people’s exposure (which contaminants we selected and why – see Chapter 3)
o Determining the resultant health effects (which health outcomes we selected and why – see Chapter 4)
o Estimating the overall social costs (which cost estimates we used and why – see Chapter 5).

March 2012
11 Updated HAPINZ Volume 1: Summary Report
3. Assessing PM10 Exposure
This section summarises the features of the approach taken to assess the exposure of the New Zealand population to PM10 air pollution in 2006 and the rationale behind the decisions made. The updated methodology is then compared with that used in the original HAPINZ study.
Readers seeking more information are directed to the following two reports contained in the Updated Health and Air Pollution in New Zealand Study Volume 2 – Technical Reports:
Appendix 1 which discusses the methodology for assessing PM10 exposure, including the approaches used for:
o Urban areas with air quality monitoring data
o Urban areas without air quality monitoring data
o Rural areas
Appendix 2 which reviews the results of various source apportionment studies undertaken in New Zealand in order to establish robust estimates of the contribution of natural sources to PM10 concentrations by census area unit (CAU).
3.1 Features of the PM10 Exposure Assessment
The features of the approach used to assess exposure in this update are summarised as follows:
o Particulate matter (PM10) is used as the best available indicator of air pollution exposure due to the wealth of monitoring data now available and the links to existing exposure-response functions developed from New Zealand and international epidemiological studies.
o Actual monitoring data are used in preference to modelling estimates and averaged for 2006 to 2008 to reduce the influence of year to year variability in meteorological conditions.
o For unmonitored areas, annual concentrations are based on comparisons with monitored areas that have the same urban/rural classification12.
o PM10 data are corrected for gravimetric (HiVol) equivalency13 based on a combination of known relationships (applies to areas with 84 per cent of the
12 As defined by Statistics New Zealand. See http://www.stats.govt.nz/census/about-2006-census/2006-census-definitions-questionnaires/definitions/geographic.aspx for details.

March 2012
12 Updated HAPINZ Volume 1: Summary Report
overall monitored population) and estimated relationships (remaining 16 per cent affected). These corrections are applied to the three-year annual averaged data.
o Concentrations are estimated for the following sources – domestic fires, motor vehicles, industry, open burning, and natural.
o Sources are allocated by estimating the natural source contributions (from source apportionment studies where available) and then allocating the remaining (anthropogenic) concentrations by emissions inventory proportions.
o Results are estimated by census area units as at 2006 (1,919 in total) but are able to be aggregated nationally, by regional council (16), by TLA (Territorial Local Authority, such as a city or district council) (74) 14, by urban area (139), and also by airshed (71).
o Sensitivity analyses are undertaken for equivalency, assuming the base case being all data adjusted for HiVol equivalency (1.0) with upper and lower bounds of 0.85 and 1.15 applied to the data respectively.
3.2 How was PM10 Exposure Assessed in this Update?
Mortality and morbidity impacts of air pollution exposure rely on annual or daily average concentration data. In New Zealand, PM10 monitoring data are now available for more than 40 urban areas. These areas range in size from Bluff to Auckland and in some locations PM10 data are available for a number of monitoring sites. Areas without monitoring data are typically small in size and have generally been deemed by regional councils as being low risk in terms of experiencing elevated PM10.
In this update, we developed a national exposure model to determine PM10 concentrations for every CAU in New Zealand that were broken down by source. The model was based on actual monitoring data (averaged for 2006 to 2008) because the information was available for areas covering 83 per cent of the population living in urban areas and 73 per cent of the population overall in 2006. This is an important feature of the update because it gives confidence that estimates of health impacts for the majority of people were based on real monitoring data as an indicator of exposure.
All monitoring data were corrected for gravimetric (HiVol) equivalency as recommended by European Environment and Health Information System (ENHIS) Methodological Guidelines for Health Impact Assessment (2007). This provides a solid basis for
13 HiVol refers to the joint Australian/New Zealand standard reference method for particulate monitoring that
employs a high volumetric sampling rate to determine concentration of particulate on a weight (gravimetric) basis. 14 Note the number of TLAs is based on those that were in existence for the 2006 census. In 2010, there was an amalgamation of the eight Auckland councils so the number of TLAs is now 67 (excluding the Chatham Islands).

March 2012
13 Updated HAPINZ Volume 1: Summary Report
comparisons and ensures we are comparing ‘apples’ with ‘apples’. It further ensures that there is no under-estimation of the impacts of PM10 (as may be the case with uncorrected data). Most data were corrected using known relationships whilst the remaining data were corrected using a default factor. We then undertook sensitivity testing to determine health impacts for locations without known correction factors based on a lower bound representing no correction (0.85) and an upper bound representing additional correction required (1.15). The base case with all data corrected is 1.0.
In unmonitored areas, PM10 concentrations were estimated based on comparison with monitored areas that had the same Statistics New Zealand urban/rural classification.
Sources were assessed on a monthly basis as the relative contributions vary with seasons (e.g., domestic heating is greater in winter). Emissions from domestic heating, open burning and industry were estimated for each CAU using either inventory data or household wood/coal use data (domestic heating), household numbers and inventory derived relationships (open burning). Vehicle emissions were estimated from Ministry of Transport vehicle kilometres travelled (VKT) data by CAU15 and emission factors from the Vehicle Emission Prediction Model version 3.0 (Metcalfe et al. 2009).
Previous New Zealand source apportionment16 studies were reviewed to identify the contribution of natural sources to PM10 concentrations in urban areas. The review found an average natural source contribution of 6.8 µg/m3. This value was used as a default for areas without source apportionment data. Average seasonal profiles were also established to account for seasonal variability.
PM10 concentrations were allocated by source by subtracting the estimated natural sources contribution (such as wind-blown dust and sea spray) and any major industry concentrations17 from the monthly PM10 concentrations. The remaining monthly concentrations were then allocated to the other sources – domestic fires, motor vehicles, open burning and the remainder of industry - based on the relative contribution to total anthropogenic emissions (less major industry) for that month.
For example,
Domestic fire concentration (µg/m3) = Domestic fire emissions (kg/km2/day)
Total anthro less industry with tall stacks emissions (kg/km2/day)
15 The VKT data by CAU were corrected by 0.9 on advice of the Ministry of Transport to align the overall total with the actual total in the NZTA Motor Vehicle Registration Statistics database. 16 Source apportionment studies involve collecting particulate such as PM10 or PM2.5 on filters and then using chemical or elemental signatures to determine the relative fractions coming from different emission sources, e.g., sea spray is high in sodium and chlorine. 17 Major industries – designated ‘tall stack’ industries in the Volume 2 report – were separated out to better account for their dispersion characteristics. Most of these sites emit from stacks that are well above ground level (typically 20 metres and higher).

March 2012
14 Updated HAPINZ Volume 1: Summary Report
The relative contributions of sources to monthly average PM10 concentrations were determined and these contributions were averaged for each year to provide a more robust assessment of the resulting contributions to annual average concentrations.
3.3 Why Only PM10 and not Other Pollutants?
Based on a review of the monitoring data available across New Zealand for 2006 to 2008, PM10 is the best available indicator of air pollution exposure. PM10 has more extensive local observations than any other pollutant. In addition, exposure-response functions outlining subsequent health effects of PM10 are available from New Zealand and international epidemiological studies.
International assessments increasingly use PM2.5 rather than PM10 as the exposure metric. However, we were unable to undertake a robust assessment of the primary health effects due to the dearth of PM2.5 monitoring data available in New Zealand in 2006. However, we did undertake a broad brush sensitivity analysis for one health outcome - mortality for all adults aged 30 years and over - using an estimated fraction of PM2.5 in the PM10 annual average as a cross check (discussed in Chapter 6.3).
Basing the update on PM10 rather than PM2.5 means that proportion of air pollution health impacts attributed to anthropogenic sources, in particular motor vehicles and domestic fires used for home heating, will be lower as these sources make a greater contribution to finer particulate fractions than natural sources.
In addition, there is evidence that both proximity to busy roads and nitrogen dioxide (NO2) exposure have important health impacts (especially respiratory symptoms in children). However, it was not possible to quantify these exposures for the present study. In New Zealand, routinely available health outcome information is geocoded to CAUs, which means it is not sufficiently accurate for studies based on proximity to roads. There is insufficient representative NO2 monitoring data on which to base an assessment of human exposures.
Not being able to robustly assess NO2 exposure means that the results of this update most likely under-estimate the health impacts of motor vehicle-related air pollution.
Carbon monoxide (CO) and benzene were included in the original HAPINZ study. However, these were not included in the exposure assessment due to concerns about potential ‘double-counting’ of health effects (for CO) or due to low levels and low exposure-response functions (for benzene).
Note: Basing the assessment on PM10 does not mean that all health effects are attributed to PM10 alone as urban air pollution is a complex mixture of gases and particles.

March 2012
15 Updated HAPINZ Volume 1: Summary Report
3.4 What about Other Sources?
The following sources were included in the update:
o domestic fires used for home heating
primarily wood burners, coal burners and open fires etc. but some gas-fired appliances where reported in the regional inventories
o motor vehicles
on road only transport such as petrol and diesel cars, vans, trucks and buses
o industry
stationary facilities for manufacturing products or generating energy that release process or combustion emissions
o open burning
burning of biomass (e.g., tree trimmings) or waste outdoors
o natural sources
primarily sea spray and windblown dust
From the inventory data, domestic fires used for home heating are the most widespread and significant source of anthropogenic PM10 in New Zealand, with emissions coming principally from solid-fuel (wood and coal) burning.
Emission estimates for other sources (e.g., other transport including aviation, shipping, rail, as well as off-road construction, farming and agriculture vehicles) are not reported consistently in emission inventories across New Zealand so were not included. However, in most areas, the first four sources – domestic fires, motor vehicles, industry and open burning – are likely to represent at least 95 per cent of all possible anthropogenic PM10 emissions.
As an example, the urban area of Auckland is one of the few places with significant ‘other transport’ sources but these sources have been estimated to only amount to 3.4 per cent of anthropogenic PM10 (AC 2011). Consequently, we estimate that the omission of other anthropogenic sources would likely result in only a minimal error (potentially up to 3 per cent of total anthropogenic emissions).
The main natural sources of PM10 in New Zealand are sea spray (referred to as ‘marine aerosol’) and windblown dusts (referred to as ‘soil’). Other sources such as volcanic eruptions and trans-Tasman emissions from bush fires and dust storms in Australia can be significant but are infrequent occurrences and are difficult to quantify. Only marine aerosol and soil were considered in this update.

March 2012
16 Updated HAPINZ Volume 1: Summary Report
3.5 How does the Update compare with the Original HAPINZ?
Table 3.1 compares the main features of the update and the original HAPINZ studies.
Table 3.1: Comparison of exposure assessment methodologies used in the updated
HAPINZ study versus the original HAPINZ study
Parameter Update Original
Base year 2006 2001
Areas 16 regions, 74 TLAs, 139 ‘urban’ areas
and 71 airsheds by CAU 67 ‘urban’ areas by CAU
Population 4,027,902
covering 100 per cent of 2006 pop’n 2,803,215
covering 73 per cent of 2001 pop’n
Pollutants PM10 only PM10
plus CO, NO2, benzene
Exposure assessment methodology
Actual monitoring data 2006-2008 covering 73 per cent 2006 pop’n with proxy monitoring in remaining areas
Land based regression model to supplement
limited actual monitoring data
Sources Natural sources, Domestic fires
Motor vehicles, Industry and Open burning
Natural sources, Domestic fires, Motor vehicles and Industry
Natural source PM10 contributions
3.6 to 9.5 µg/m3 from source apportionment studies
(default average 6.8 µg/m3)
2 to 16 µg/m3
estimates (average 3.3 µg/m3)

March 2012
17 Updated HAPINZ Volume 1: Summary Report
4. Selecting Health Outcomes
This section summarises the health outcomes assessed and the rationale behind the decisions made. The health outcomes used in the update are then compared with those used in the original HAPINZ study.
Readers seeking more information are directed to the following report contained in the Updated Health and Air Pollution in New Zealand Study Volume 2 – Technical Reports:
Appendix 3 which outlines the recommendations and justification for the following components of the health effects assessment methodology:
o exposure-response functions and methodology for estimation of mortality from PM10 exposure
o whether to specifically assess PM2.5 effects based on literature and available PM2.5 data
o exposure-response functions and methodology for morbidity effects of PM pollution based on review of recent meta-analyses
o review of meta-analyses and available data for other pollutants
o confirmation of methodology to quantify health effects for Māori and other sub-groups.
4.1 Features of the Health Outcome Selection
The health outcomes and exposure-response estimates selected for assessment in this update are as follows:
o Premature mortality from long-term exposure (PM10 annual mean)
o Adults, aged 30 years and over: 7% (3% to 10%) per 10 µg/m3
o Babies, aged 1 month to 1 year: 5% (2% to 8%) per 10 µg/m3
o Hospital admissions from short-term exposure (PM10 daily mean)
o cardiac hospital admissions, all ages: 0.6% (0.3% to 0.9%) per 10 µg/m3
o respiratory hospital admissions, all ages: 1.0% (0.6% to 1.7%) per 10 µg/m3
o Restricted activity days from long-term exposure (PM2.5 annual mean18)
o restricted activity days, all ages: 0.9 (0.5-1.7) per 10 µg/m3
18 Assuming that 60 per cent of annual PM10 in urban areas and 40 per cent of annual PM10 in rural is PM2.5

March 2012
18 Updated HAPINZ Volume 1: Summary Report
o Population sub-group impacts
o premature mortality for Māori adults, aged 30 years and over: 20% (7% to 33%) per 10 µg/m3 (PM10 annual mean)
o respiratory hospital admissions for children aged 1 to 4 years: 1% (0.6% to 1.7%) per 10 µg/m3 (PM10 daily mean)
o respiratory hospital admissions for children aged 5 to 14 years: 3% (0% to 5%) per 10 µg/m3 (PM10 daily mean)
o Sensitivity analyses are conducted on the 95% confidence intervals or upper and lower bounds of the selected exposure-response functions.
o As a cross check, a comparison is also undertaken for one health outcome - mortality for all adults aged 30 years and over - using an indicative exposure-response function for PM2.5 as opposed to PM10 follows:
o all adults, aged 30 years and over: 9% per 10 µg/m3 (PM2.5 annual mean)
4.2 How were the Health Outcomes Selected?
Particulate matter (PM10) was chosen as the best available indicator of air pollution exposure for the purposes of this update. More extensive local observations are available for PM10 than for other pollutants. In addition, major New Zealand and international epidemiological studies have used PM10 as one of the exposure metrics.
The health outcomes selected were based on the need to provide policy-relevant estimates supported by well-established epidemiological results, while avoiding double-counting of effects, and including some less substantial evidence relevant to social justice and equity. They included:
1. an estimate of effects of long-term exposure on mortality in adults (found to be the dominant health impact in previous studies)
2. separate estimates of effects of long-term exposure on mortality in sensitive subpopulations, including infants and Māori
3. estimates of the effects of short-term exposure on hospital admissions for cardiovascular and respiratory diseases and
4. an estimate of restricted activity days.
We did not undertake a full literature review but examined the health outcomes included in recent assessments (particularly meta-analyses) including:
o a nationally representative New Zealand cohort study (Hales et al. 2010)
o a US assessment of PM2.5 (USEPA 2010)
o the Global Burden of Disease Assessment (Cohen pers. comm. 2011)
o one European health impact assessment guide (ENHIS 2007) and

March 2012
19 Updated HAPINZ Volume 1: Summary Report
o one global impact assessment guide (Ostro 2004).
Premature mortality in adults was assessed based on Hales et al. (2010) who reported substantially different air pollution effects in different ethnic groups in a cohort study undertaken in New Zealand. These differences were numerically substantial (20% in Māori as compared to 7% in all ethnicities combined). However, the authors cautioned that the ethnic differences were not statistically significant (i.e., there is overlap between the plausible range of these estimates for the two groups).
For relatively wealthy countries such as New Zealand, the strongest evidence for effects on mortality in children relates to the post neonatal period (ages 1 month to 1 year). We assessed the impact of air pollution on post-neonatal mortality based on the meta-analysis by Lacasaña et al. (2005) as cited in a European guide to air pollution impact assessment (ENHIS 2007). There was insufficient evidence on which to base estimates of mortality impacts of long-term exposure in older children and young adults (aged under 30 years).
We included estimates of effects on hospital admissions for respiratory diseases in children, based on the results of a multi-city Australasian study (Barnett et al. 2005) and the effect on hospital admissions in adults, based on the results of a European meta-analysis, APHEIS (2004), as cited in a European guide to air pollution impact assessment (ENHIS 2007).
Some New Zealand and international studies have also estimated restricted activity days (in which air pollution exposure causes symptoms sufficient to prevent usual activities such as attendance at work or study). We included an estimate of restricted activity days, for all ages (ALA 1995 based on Ostro 1987).
The proposed health outcomes and exposure-response estimates selected are consistent with recommendations of other recent or current international studies of air pollution effects (Cohen pers. comm. 2011).
As discussed earlier, many international studies recommend use of PM2.5 as the exposure metric but we were unable to do this in the update due to a lack of monitoring data currently. However, we did undertake a rudimentary cross-check for the most significant health effect - premature mortality in all adults aged 30 years and over. The New Zealand–specific relationship determined by Hales et al. (2010) for PM10 was scaled using a ratio based on the premature mortality exposure-response functions for PM2.5 to PM10 seen in overseas studies to develop an indicative relationship for PM2.5 exposure of
1.09 (=1.07*1.06/1.043) per 10 µg/m3 PM2.5
This was applied to estimates of PM2.5 concentrations across New Zealand (largely taken from source apportionment work) to check the figures derived based on PM10.

March 2012
20 Updated HAPINZ Volume 1: Summary Report
4.3 What are the Exposure-Response Functions?
We assumed linear, no threshold exposure-response functions for all endpoints. This assumes that health effects are detectable at any concentration above zero and that the increase in the effect is proportional to the increase in concentration. This is in line with current thinking for exposures in the range typically experienced in New Zealand (Schwartz et al. 2002, Schwartz et al. 2008). As discussed in Chapter 2, all PM10 was treated as equal in terms of its health effects, i.e. the exposure-response functions are the same for each health effects irrespective of the PM10 source.
Health effects were calculated by CAU and then aggregated to give national or regional or airshed etc. estimates as follows:
4.3.1 Overall for all Health Effects (Except Restricted Activity Days)
Where:
CasesTotal is the total number of cases observed in the population of interest
CasesBase is the number of baseline cases that would have occurred without exposure to air pollution
CasesAP is the number of extra cases that arise due to exposure to air pollution
CasesAP is calculated as follows for pollutants (such as PM10) that do not have a threshold:
( )
Where:
RR is the relative risk per unit of pollution (selected from epidemiological studies)
E is the exposure for the population of interest (available from monitoring data)
From above
(
( ) )
Therefore:
( (
( ) ))

March 2012
21 Updated HAPINZ Volume 1: Summary Report
Table 4.1: Summary of the parameters and data sources used in the exposure-response functions in the updated HAPINZ study
Health Outcome Relative Risk (RR)7 CasesTotal Exposure (E)
1 Premature mortality, all adults, all ethnicities
1.07 (1.03-1.10) Hales et al. (2010)
MoH data by CAU
2005-2007
Annual average PM10÷10
for 2006
1a Premature mortality, all adults, Māori-only1,2
1.20 (1.07-1.33) Hales et al. (2010)
MoH data by CAU
2005-2007
Annual average PM10÷10
for 2006
2 Premature mortality, babies, all ethnicities3,4
1.05 (1.02-1.08) Lacasaña et al. (2005)
MoH data national only
2005-2007
Annual pop’n wtd average
PM10÷10
for 2006
3 Cardiac hospital admissions, all ages all ethnicities5
1.006 (1.003-1.009) APHEIS (2004)
MoH data by CAU
2005-2007
Annual average PM10÷10 for 2006
4 Respiratory hospital admissions, all ages all ethnicities5
1.01 (1.006-1.017) APHEIS (2004)
MoH data by CAU
2005-2007
Annual average PM10÷10 for 2006
4a Respiratory hospital admissions, children all ethnicities, aged 1-4 years5,6
1.02 (1.01-1.04) Barnett et al. (2005)
MoH data by CAU
2005-2007
Annual average PM10÷10 for 2006
4b Respiratory hospital admissions, children all ethnicities, aged 5-14 years5,6
1.03 (1.00-1.05) Barnett et al. (2005)
MoH data by CAU
2005-2007
Annual average PM10÷10 for 2006
Note:
1. This is a subset of the premature mortality, all adults, all ethnicities health effect and must not be added to the overall results.
2. The confidence intervals for the relative risk factors for ‘all ethnicities’ and ‘Māori-only’ overlap. The ‘Pacific-only’ group is not included as Hales et al. (2010) did not find any significant effects in this group (but this was probably due to low numbers of cases in that ethnic group).
3. For this health outcome, the total cases data are only available as a single national total. To get estimates by CAU the national total has been pro-rated by the number of babies in each CAU versus the total number of babies nationally.
4. These numbers have been multiplied by the population weighted annual average concentrations.
5. The daily average PM10 increments are calculated from the annual average concentrations, assuming 365 days in a year.
6. This is a subset of the ‘respiratory hospital admissions, all ages’ health effect and must not be added to the overall results.
7. Relative risks are per 10µg/m3 PM10.

March 2012
22 Updated HAPINZ Volume 1: Summary Report
4.3.2 Restricted Activity Days
Where:
RF = 0.9 (0.5-1.7) days per person per year per 10 µg/m3 annual PM2.5 (ALA 1995 based on Ostro 1987)
E = annual PM2.5 average in µg/m3 figure per CAU divided by 10 (assuming PM2.5 is 0.6*PM10 in urban areas and 0.4*PM10 in rural areas)
Pop by CAU is the 2006 census population for all ages, all ethnicities (Stats NZ census data)
Note: RADs are not calculated relative to a baseline incidence; hence a risk factor (RF) of 0.9 is used.
4.4 What about Other Health Outcomes such as Asthma?
We considered a number of other health outcomes but did not include them in the updated HAPINZ study for the following reasons:
o Short-term PM10 effects on mortality were not included because they are largely included as part of the assessment of long-term effects and would lead to ‘double counting’.
o Adverse reproductive outcomes, stroke incidence, chronic obstructive pulmonary disease (COPD) and asthma incidence were not included due to limited scientific consensus on the relationships with air pollution. Note there is a distinction between the incidence of disease and worsening of pre-existing disease. Effects of air pollution on stroke and exacerbations of respiratory diseases, including respiratory infections, asthma and chronic airways diseases are partly accounted for in the assessment of morbidity (hospital admissions and RADs).
o Nitrogen dioxide (NO2) exposure was not included due to limited data. There is increasing evidence linking proximity to busy roads and nitrogen dioxide (NO2) exposure with adverse health effects, especially for respiratory symptoms in children. However, it was not possible to quantify these exposures in New Zealand due to limited continuous monitoring data.
o Benzene cancer risk estimates from the original HAPINZ study were not updated because ambient concentrations have dropped significantly in response to reductions in the benzene content of petrol and the very low relative risk factors19.
o Premature mortality associated with carbon monoxide (CO) was not included because it is impossible to separate this effect from mortality due to PM10 and its inclusion would run the risk of ‘double counting’.
19 There was an error in the benzene cancer risk estimates in the original HAPINZ study which over-estimated cancer cases by a factor of 79.

March 2012
23 Updated HAPINZ Volume 1: Summary Report
4.5 How does the Update compare with the Original HAPINZ?
Table 4.2 compares the main features of the update and the original HAPINZ studies.
Table 4.2: Comparison of health outcomes used in the updated HAPINZ study versus
the original HAPINZ study
Health Outcome Factor used in Update Factor used in Original
Premature mortality (PM10) adults, aged 30 yrs & over
all ethnicities
1.07
(1.03-1.10)
1.043
(1.026-1.061)
Premature mortality (PM10) adults, aged 30 yrs & over
Māori
1.020
(1.07-1.33) not included
Premature mortality (PM10) babies, aged 1 mth to 1 yr
all ethnicities
1.05
(1.02-1.08) not included
Cardiac admissions (PM10) all ages
all ethnicities
1.006
(1.003-1.009) 1.01
Respiratory admissions (PM10) all ages
all ethnicities
1.01
(1.006-1.017) 1.013
Respiratory admissions (PM10) children, aged 1 to 4 yrs
all ethnicities
1.02
(1.01-1.04) not included
Respiratory admissions (PM10) children, aged 5 to 14 yrs
all ethnicities
1.03
(1.00-1.05) not included
Restricted activity days (PM2.5) all ages
all ethnicities
0.9
(0.5-1.7) 0.912
COPD (PM10) all ages, all ethnicities
not included due to lack of consensus in
international literature 1.214
Premature mortality (CO) all ages, all ethnicities
not included due to double counting concerns
1.079
Cancer (Benzene) all ages, all ethnicities
not included due to emissions reductions
and low RR 1.0000759

March 2012
24 Updated HAPINZ Volume 1: Summary Report
5. Estimating Social Costs
This section firstly presents the key social cost estimates and then presents the rationale behind the decisions made. The updated estimates are then compared with those used in the original HAPINZ study.
Readers seeking more information are directed to the following report contained in the Updated Health and Air Pollution in New Zealand Study Volume 2 – Technical Reports:
Appendix 4 which outlines the recommendations and justification for the following cost estimates:
o value of statistical life (VOSL) for premature mortality
o social costs for morbidity effects.
5.1 Features of the Social Costs Estimation
The approach used to estimate the social cost estimates in this update are as follows:
o All costs are estimated in New Zealand dollars as at June 2010.
o A transport risk (road safety) based Value of Statistical Life (VOSL) of NZ$3.56 million is used for all cases of premature mortality due to air pollution.
o Average costs of NZ$6,350 (cardiovascular) and NZ$4,535 (respiratory) are used for all hospital admissions. These include medical costs and loss of output during hospitalisation but do not include loss of life quality due to prolonged pain and suffering.
o Restricted activity days are valued at NZ$62, based on the average loss of output per day (irrespective of a working or non-working day).
o Sensitivity analyses are conducted using a VOSL twice as high to reflect higher international values for air pollution risk and using a range of likely loss of life quality and medical costs for the morbidity effects.
5.2 How were the Social Costs Estimated?
Air pollution results in mortality and morbidity health consequences. This amounts to loss of life and life quality of people exposed to pollution. Once the health consequences were estimated, our task was to estimate the total cost to society (the ‘social costs’) resulting from these consequences.

March 2012
25 Updated HAPINZ Volume 1: Summary Report
In this update we estimated the social costs arising from the following health outcomes (selected in Chapter 4):
o premature mortality (all cases, irrespective of age, gender or ethnicity)
o cardiac hospital admissions
o respiratory hospital admissions
o restricted activity days.
Like any other risk area, air pollution increases the risk of death to those exposed to the pollution. The value of a change in risk is generally measured by society’s willingness to pay (WTP) for that change. The amount of money a society is willing to pay to reduce the risk of death so that one premature death is prevented is known as WTP-based value of statistical life (VOSL)20. The official VOSL in New Zealand used by the transport sector and many others is regularly updated by the Ministry of Transport. The VOSL at June 2010 prices was $3.56 million (MoT 2010) and this was adopted for the update.
The total costs per hospitalisation were based on the medical costs and the loss of output only incurred for each health effect – in this case respiratory hospital admissions and cardiovascular hospital admissions.
For the medical costs, we reviewed the hospitalisation data and found that the average length of hospitalisation was 5 days for cardiovascular diseases and 3.3 days for respiratory diseases. An NZIER (2009) report estimated the average medical cost per hospitalisation as $7,700 at 2008 prices, based on an average length of hospitalisation of 12.6 days for traffic accidents and 6.8 days for PM10 pollution (MfE 2004). Using the latest MoT (2010) estimates for hospitalisation of $8,500 as at June 2010, the total medical cost for these two diseases was estimated at $6,040 and $4,330 respectively for cardiovascular and respiratory diseases.
For the loss of output, the average loss per day in hospital was estimated as the average weekly income divided by 7. Statistics New Zealand survey data was used to calculate the average income per person per week as at June 2010 ($436). This gave $62 per day (irrespective of a working or non-working day). Therefore the average loss of output per cardiovascular hospital admissions was $310 (=5*$62) and per respiratory hospital admission was $205 (=3.3*$62).
Combined these gave the total costs for medical costs and loss of output (during hospitalisation) at $6,350 and $4,535 (in June 2010 prices) for cardiovascular and respiratory diseases respectively. 21
20 The VOSL is not a value of an identified individual life. It is the value society as a whole is willing to pay to prevent a premature death. Therefore the subsequent social cost includes the cost to society of premature deaths due to pollution. 21 This does not include the value to society of loss of life quality due to any long term impairment.
March 2012
26 Updated HAPINZ Volume 1: Summary Report
Restricted activity days (RADs) were estimated for the whole population, not just those employed. So RADs refer to loss of activity related to earning as well as non-earning time. Thus average loss per RAD was related to the average loss per affected person. We followed the same methodology as for loss of output during hospitalisation to estimate the loss of income per RAD at $62 per day (irrespective of a working or non-working day) and assuming that the loss per RAD applies to the whole day on average.
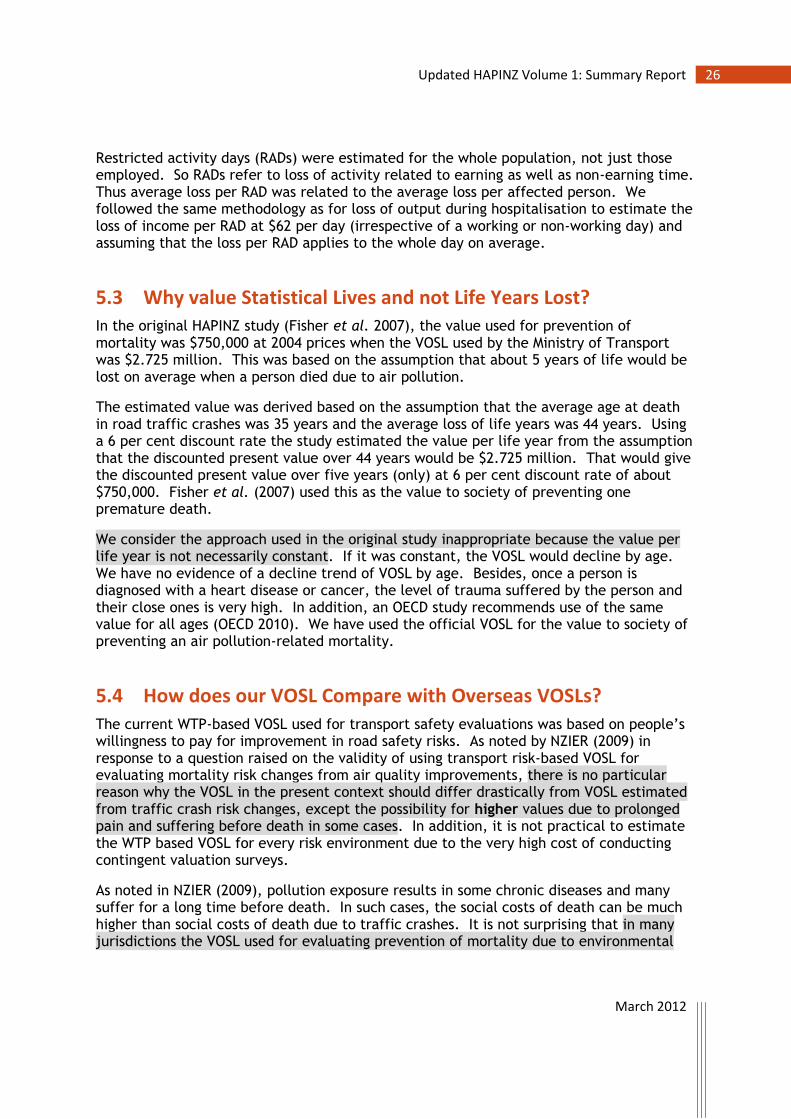
5.3 Why value Statistical Lives and not Life Years Lost?
In the original HAPINZ study (Fisher et al. 2007), the value used for prevention of mortality was $750,000 at 2004 prices when the VOSL used by the Ministry of Transport was $2.725 million. This was based on the assumption that about 5 years of life would be lost on average when a person died due to air pollution.
The estimated value was derived based on the assumption that the average age at death in road traffic crashes was 35 years and the average loss of life years was 44 years. Using a 6 per cent discount rate the study estimated the value per life year from the assumption that the discounted present value over 44 years would be $2.725 million. That would give the discounted present value over five years (only) at 6 per cent discount rate of about $750,000. Fisher et al. (2007) used this as the value to society of preventing one premature death.
We consider the approach used in the original study inappropriate because the value per life year is not necessarily constant. If it was constant, the VOSL would decline by age. We have no evidence of a decline trend of VOSL by age. Besides, once a person is diagnosed with a heart disease or cancer, the level of trauma suffered by the person and their close ones is very high. In addition, an OECD study recommends use of the same value for all ages (OECD 2010). We have used the official VOSL for the value to society of preventing an air pollution-related mortality.
5.4 How does our VOSL Compare with Overseas VOSLs?
The current WTP-based VOSL used for transport safety evaluations was based on people’s willingness to pay for improvement in road safety risks. As noted by NZIER (2009) in response to a question raised on the validity of using transport risk-based VOSL for evaluating mortality risk changes from air quality improvements, there is no particular reason why the VOSL in the present context should differ drastically from VOSL estimated from traffic crash risk changes, except the possibility for higher values due to prolonged pain and suffering before death in some cases. In addition, it is not practical to estimate the WTP based VOSL for every risk environment due to the very high cost of conducting contingent valuation surveys.
As noted in NZIER (2009), pollution exposure results in some chronic diseases and many suffer for a long time before death. In such cases, the social costs of death can be much higher than social costs of death due to traffic crashes. It is not surprising that in many jurisdictions the VOSL used for evaluating prevention of mortality due to environmental

March 2012
27 Updated HAPINZ Volume 1: Summary Report
effects is much higher than the value used for prevention of mortality due to traffic crashes.
While many countries use WTP based VOSL only limited information is available on separate values for environmental effects and transport safety. Many countries use the same value for convenience or in the absence of separate estimates. The difficulty in comparing VOSLs from overseas is that they are expressed in different currencies and also refer to prices of different years.
Table 5.1 shows the VOSLs used in different countries. To avoid complication, we converted all available values to prices in 2009, using per capita GDP as an indexing factor and then expressed them in NZ$. For better comparison between countries, exchange rate was expressed in purchasing power parity (PPP).
Table 5.1: VOSL in different countries in 2009 NZ$ PPP
Country
VOSL in 2009 NZ$ PPP
Transport Environment
New Zealand $3.50M
USA $9.0M $11.1M
Australia $3.2M $7.1M
Canada $8.0M
UK $3.5M
Austria $5.4M
France $2.5M
Germany $2.6M
Table 5-1 shows that the air pollution VOSL adopted for our update (NZ$3.56 million in 2010) is, if anything, at the low end of the range of values adopted by overseas countries. This is especially true for those countries, such as Australia and the USA, who differentiate between a transport and an environmental VOSL.

March 2012
28 Updated HAPINZ Volume 1: Summary Report
5.5 How does the Update compare with the Original HAPINZ?
Table 5.2 compares the main features of the update and the original HAPINZ studies.
Table 5.2: Comparison of social costs used in the updated HAPINZ study versus the
original HAPINZ study
Social Cost Update Original
Basis for costs NZ$ as at June 2010 NZ$ as at June 2004
Premature death all cases
$3.56 million based on full value of
Road Safety VOSL of $3.56M
$750,000 based on discounted value of Road Safety VOSL of $2.73M
Cardiac admissions all cases
$6,350 based on 5 days hospitalisation plus
medical costs & lost productivity $3,675
Respiratory admissions all cases
$4,535 based on 3.3 days hospitalisation plus
medical costs & lost productivity $2,700
Restricted activity days all cases
$62 per day irrespective of whether a working or non-working day
$92 only estimated for working days
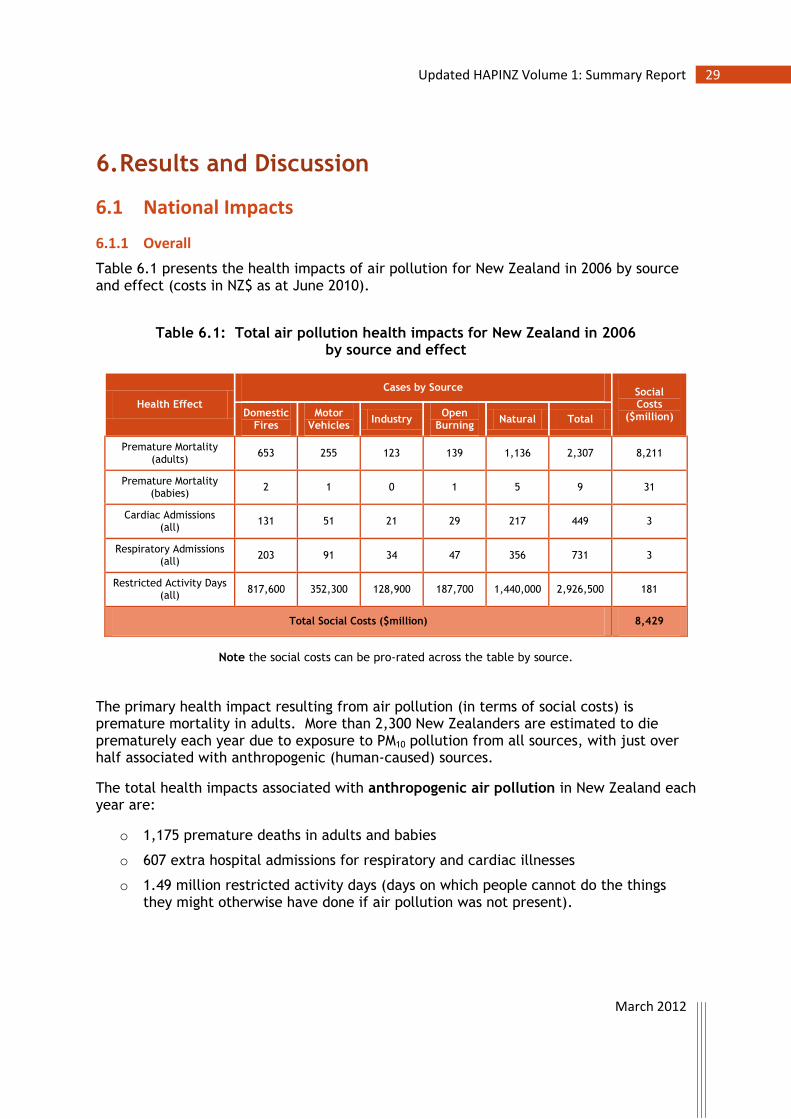
March 2012
29 Updated HAPINZ Volume 1: Summary Report
6. Results and Discussion
6.1 National Impacts
6.1.1 Overall
Table 6.1 presents the health impacts of air pollution for New Zealand in 2006 by source and effect (costs in NZ$ as at June 2010).
Table 6.1: Total air pollution health impacts for New Zealand in 2006
by source and effect
Health Effect
Cases by Source Social Costs
($million) Domestic Fires
Motor Vehicles
Industry Open
Burning Natural Total
Premature Mortality (adults)
653 255 123 139 1,136 2,307 8,211
Premature Mortality (babies)
2 1 0 1 5 9 31
Cardiac Admissions (all)
131 51 21 29 217 449 3
Respiratory Admissions (all)
203 91 34 47 356 731 3
Restricted Activity Days (all)
817,600 352,300 128,900 187,700 1,440,000 2,926,500 181
Total Social Costs ($million) 8,429
Note the social costs can be pro-rated across the table by source.
The primary health impact resulting from air pollution (in terms of social costs) is premature mortality in adults. More than 2,300 New Zealanders are estimated to die prematurely each year due to exposure to PM10 pollution from all sources, with just over half associated with anthropogenic (human-caused) sources.
The total health impacts associated with anthropogenic air pollution in New Zealand each year are:
o 1,175 premature deaths in adults and babies
o 607 extra hospital admissions for respiratory and cardiac illnesses
o 1.49 million restricted activity days (days on which people cannot do the things they might otherwise have done if air pollution was not present).
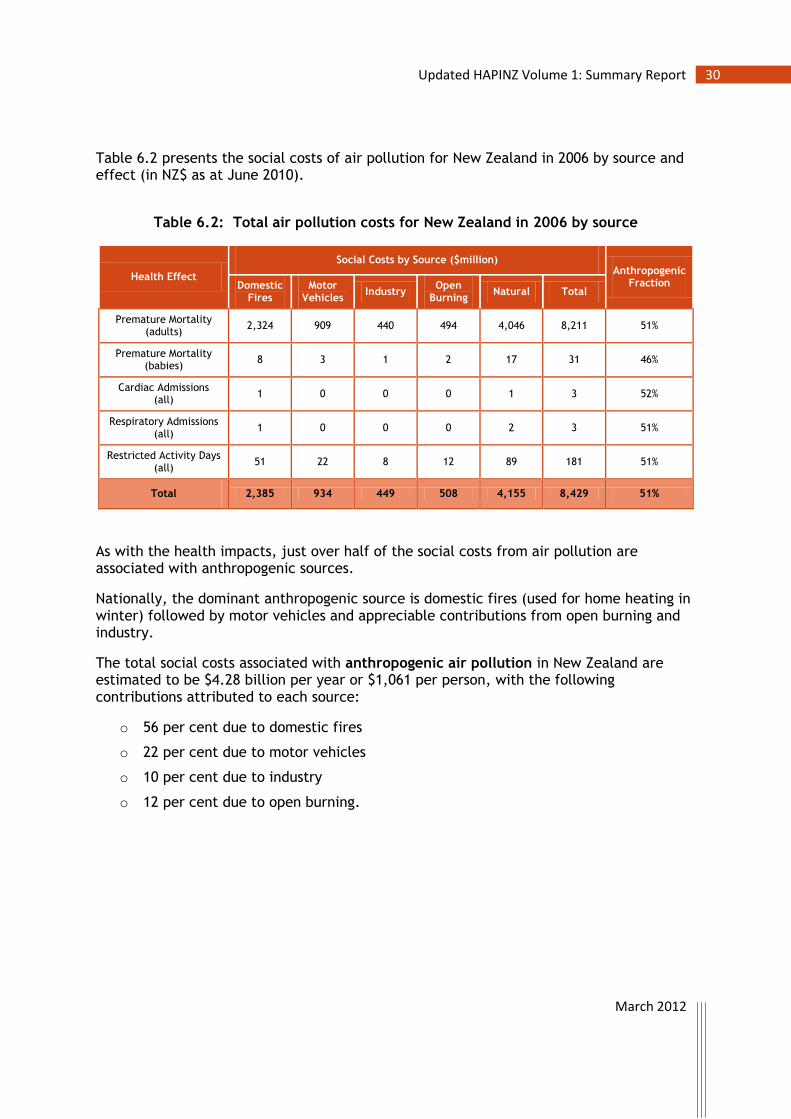
March 2012
30 Updated HAPINZ Volume 1: Summary Report
Table 6.2 presents the social costs of air pollution for New Zealand in 2006 by source and effect (in NZ$ as at June 2010).
Table 6.2: Total air pollution costs for New Zealand in 2006 by source
Health Effect
Social Costs by Source ($million) Anthropogenic
Fraction Domestic Fires
Motor Vehicles
Industry Open
Burning Natural Total
Premature Mortality (adults)
2,324 909 440 494 4,046 8,211 51%
Premature Mortality (babies)
8 3 1 2 17 31 46%
Cardiac Admissions (all)
1 0 0 0 1 3 52%
Respiratory Admissions (all)
1 0 0 0 2 3 51%
Restricted Activity Days (all)
51 22 8 12 89 181 51%
Total 2,385 934 449 508 4,155 8,429 51%
As with the health impacts, just over half of the social costs from air pollution are associated with anthropogenic sources.
Nationally, the dominant anthropogenic source is domestic fires (used for home heating in winter) followed by motor vehicles and appreciable contributions from open burning and industry.
The total social costs associated with anthropogenic air pollution in New Zealand are estimated to be $4.28 billion per year or $1,061 per person, with the following contributions attributed to each source:
o 56 per cent due to domestic fires
o 22 per cent due to motor vehicles
o 10 per cent due to industry
o 12 per cent due to open burning.

March 2012
31 Updated HAPINZ Volume 1: Summary Report
6.1.2 By Population Subgroup
Table 6.3 presents the health impacts of air pollution in New Zealand in 2006 for key population sub-group outcomes by source (costs in NZ$ as at June 2010).
Table 6.3: Total air pollution health impacts and costs for New Zealand in 2006 by source and effect for key population subgroups
Health Effect
Cases per Source Social Costs
($million) Domestic Fires
Motor Vehicles
Industry Open
Burning Natural Total
Premature Mortality (adults)
653 255 123 139 1,136 2,307 8,211
Premature Mortality (Māori adults)
105 41 19 31 228 422 1,504
Respiratory Admissions (all)
203 91 34 47 356 731 3
Respiratory Admissions (children 1-4)
67.5 31.5 11.4 15.7 121.5 247.6 1
Respiratory Admissions (children 5-14)
41.6 18.4 6.9 9.9 75.0 151.8 1
Note these health effects are a sub-group of the shaded categories
and should not be added on to the health effects or costs as this would be ‘double-counting’. Māori are disproportionately represented in the adult premature mortality figures (18.3 per cent of deaths, but are only 8.7 per cent of adult population). However, this is not unexpected because the exposure-response function for Māori is nearly three times that of the whole adult population.
For the respiratory hospital admissions, one third of the cases occur in children aged 1 to 4 years – again a disproportionate effect given the population in that sub-group.
6.2 Regional and Local Impacts
Detailed results by region, TLA, airshed and Statistics NZ urban area are summarised in Appendix 1.
6.2.1 Variation in Anthropogenic versus Natural Fraction
Overall for New Zealand, the anthropogenic fraction of the air pollution health impacts is just over half, at 51 per cent on average. However, this fraction varies with the scale of the area under assessment.

March 2012
32 Updated HAPINZ Volume 1: Summary Report
As seen in the tables in section A1-6 of Appendix 1, the anthropogenic fractions can range from 26 per cent to 76 per cent depending on the location and the resolution. Finer scales (e.g., Statistics NZ urban areas) show a greater range in values.
Urban areas tend to have a higher proportion of impacts associated with anthropogenic sources (due to a greater population density and air pollution emitting activities) than rural areas but this trend is not consistent. It should be noted that the natural contributions are estimated from source apportionment data but this information is not available for all areas. Many of the smaller locations rely on using a default value of 6.8 µg/m3 rather than actual data and therefore may considerably under- or over-estimate the natural fraction.
6.2.2 Variation in the Relative Anthropogenic Sources
Nationally, the overall breakdown in anthropogenic air pollution health impacts is:
o 56 per cent due to domestic fires
o 22 per cent due to motor vehicles
o 12 per cent due to open burning
o 10 per cent due to industry.
On average, domestic fire impacts are 2.5 times those of motor vehicles. However, these anthropogenic proportions vary with location.
The relative contribution of each source is estimated based on the results of source apportionment studies and emission inventories. It is important to note that the accuracy of these relative contributions is limited by the accuracy of these methods. However, the results are based on the best available information and provide a good indication of relative contributions.
As seen in the tables in section A1-6 of Appendix 1, domestic fires dominate the health impacts associated with anthropogenic air pollution in every location across New Zealand, except the Auckland region (most particularly the TLA of Auckland City where motor vehicle health impacts are nearly twice those of domestic fires). The remaining TLAs in the Auckland region show more or less equal proportions of effects attributed to domestic fires and motor vehicles. Other TLAs which also have a higher proportion of motor vehicle emissions than the average22 include Hamilton City, Lower Hutt City, New Plymouth District, Tauranga City, and Wellington City.
Emissions from domestic fires are on average 2.5 times greater than emissions from motor vehicle sources nationally. However, in most South Island and central North Island
22 The ratio of motor vehicle impacts to domestic fire impacts nationally is 39 per cent on average (= 22/55). Therefore domestic fire impacts are greater than 2.5 times those for motor vehicles on average.

March 2012
33 Updated HAPINZ Volume 1: Summary Report
locations, impacts from domestic fires are well in excess of the 2.5 average, with values from domestic fires ranging from 3.8 times greater than for motor vehicles in Christchurch City to 16 in Central Otago District (with many TLAs around 10).
Open burning is an appreciable air pollution source in all locations, rivalling motor vehicles and industry in its effects in many areas.
The effects associated with industry vary significantly across New Zealand. This is because the siting of many industries depends on access to particular resources which are not readily available in all locations.
6.3 Sensitivity Testing
Sensitivity testing was undertaken on key assumptions and for cross-checking using the scenario option in the Health Effects Model as follows:
o high and low values for the HiVol correction factor
o upper and lower bounds/confidence intervals for the exposure-response functions
o cross-check on adult premature mortality using PM2.5 instead of PM10
o upper and lower bounds for the cost estimates
o back-cast to 2001 to compare with 2006.
The results are presented in Appendix 2 and discussed in the following sections. The full list of default (base case) parameters with their typical ranges are listed in Table A3.1 in Appendix 3.
Note: A detailed analysis of uncertainty, often undertaken in overseas assessments of air pollution health impacts, was beyond the scope of and resources available for this update. However, the sensitivity testing undertaken in this section highlights which parameters have the most effect on the outcome of the health impacts assessment and therefore which would warrant refinement in future.
Based on the sensitivity testing, focus on refining the confidence intervals for the exposure-response-functions (for premature mortality, in particular) or the upper/lower bounds for the social cost estimates (for VOSL, in particular) would have the greatest impact on increasing confidence in the estimated impacts.
6.3.1 Effect of HiVol Correction Factor
The base case is all data adjusted for HiVol equivalency (1.0) as outlined in Chapter 4. Realistic upper (1.15) and lower (0.85) correction factors are applied to the data in the sensitivity testing. See Appendix A2.1 for detailed results.
Increasing the HiVol correction factor (i.e., increasing the PM10 concentration in each CAU) by 15 per cent increases the impacts by just over 13 per cent relative to the base case.

March 2012
34 Updated HAPINZ Volume 1: Summary Report
Decreasing the HiVol correction factor (i.e., decreasing the PM10 concentration in each CAU) by 15 per cent decreases the impacts by just under 14 per cent relative to the base case.
Overall effect: Within these two bounds, air pollution health impacts are still predicted to be between $7.27 and $9.56 billion (relative to the base case of $8.43 billion).
The number of premature deaths for adults ranges between 1,989 and 2,615 (relative to the base case of 2,307).
Note: Changing the correction factor from the default of 1.0 (in the model) is only valid for those CAUs which have PM10 data that is not already HiVol equivalent or with a known correlation. In reality, this only affects 16 per cent of the monitored areas and would therefore be expected to have a very minor effect overall.
6.3.2 Effect of Exposure–Response Values
The base case uses the best estimates for all exposure-response functions/risk factors as outlined in Chapter 5. Published 95% confidence intervals or realistic upper and lower bounds for these factors are applied to the data in the sensitivity testing. See Appendix A2.2 for detailed results.
Using the highest likely values for the exposure-response functions increases the impacts by just over 38 per cent relative to the base case.
Using the lowest likely values for the exposure-response functions decreases the impacts by just over 54 per cent relative to the base case.
Overall effect: Within these two bounds, air pollution health impacts are still predicted to be between $3.84 and $11.67 billion (relative to the base case of $8.43 billion).
The number of premature deaths for adults ranges between 1,046 and 3,165 (relative to the base case of 2,307).
6.3.3 Cross-check on Adult Premature Mortality Using PM2.5
The base case uses the best estimate for adult premature mortality due to exposure to PM10 as outlined in Chapter 4. High (0.6) and low (0.4) proportions of PM10 as PM2.5 are combined with the indicative PM2.5 exposure-response function in the sensitivity testing as a cross-check. See Appendix A2.3 for detailed results.
Using the indicative PM2.5 exposure-response function together and assuming PM2.5 is 40 per cent of PM10 (typical of rural areas) predicts fewer premature deaths by 46 per cent than the base case using PM10.

March 2012
35 Updated HAPINZ Volume 1: Summary Report
Using the indicative PM2.5 exposure-response function together and assuming PM2.5 is 60 per cent of PM10 (typical of urban areas) predicts fewer premature deaths by 21 per cent than the base case using PM10.
Overall effect: Within these two bounds, the number of adult premature deaths is still predicted to be between 1,244 and 1,819 (relative to the base case using PM10 of 2,307).
Note: The PM2.5 relationship used is only indicative yet predicts results comparable to those in the base case. Recent epidemiological research suggests that there may be separate effects for the PM2.5 to PM10 fraction in addition to the PM2.5 fraction (Brunekreef pers. comm. 2011). This would make the comparison even closer. Regardless, the cross-check as it stands confirms the magnitude of the effect.
6.3.4 Effect of Social Cost Estimates
The base case uses the best estimates for social costs for the range of health effects investigated as outlined in Chapter 5. Realistic upper and lower estimates for these costs are applied to the data in the sensitivity testing. Note: the lower estimate for VOSL is the same as the best estimate of VOSL ($3.56 million as at June 2010) whilst the upper estimate is double that at $7.12 million. See Appendix A2.4 for detailed results.
Using the upper bounds for the social cost estimates increases the impacts by just over 103 per cent relative to the base case.
Using the lower bounds for the cost estimates decreases the impacts by only 1 per cent relative to the base case.
Overall effect: Within these two bounds, air pollution social costs are still predicted to be between $8.35 and $17.16 billion (relative to the base case of $8.43 billion).
Note: The majority of the increase in the high cost scenario is due to factoring in loss of life quality due to prolonged illness and suffering which is not included in the base case. As seen in Table 5.1 many overseas jurisdictions use a specific environmental VOSL which is considerably higher than a transport (road safety) risk VOSL to adequately account for loss of life quality costs.
6.3.5 Back-cast to 2001 to Compare with 2006
Table 6.4 compares the air pollution health effects for New Zealand for 2006 (from this update) with an estimate for 2001 (using the same methodology). This scenario is based on the actual change in population and the estimated change in emissions for domestic fires and motor vehicles (industry, open burning and natural are assumed to be the same) going from 2006 to 2001 as outlined in Appendix A2.5.
All anthropogenic sources except motor vehicles show a predicted increase in health impacts between 2001 and 2006, largely in response to the increase in population combined with minimal or no estimated changes in emissions. The reduction in motor

March 2012
36 Updated HAPINZ Volume 1: Summary Report
vehicle impacts reflects the significant and genuine improvements made in fuel quality and emissions standard requirements introduced in earnest after 2001.
Comparable improvements have occurred in domestic fire emissions in response to the introduction of the woodburner standards and various insulation and clean heat retrofit programmes with areas such as Christchurch and Nelson showing significant reductions in PM10 concentrations between 2001 and 2006 but changes in most areas are subsequent to 2006. The full impact of these changes is expected to be evident in any future update. This was originally intended to be based on 2011 to align with the census but the March 2011 census has now been postponed to March 2013, due to the disruption caused by the February 2011 Christchurch earthquake.
Open burning has been banned in many regions since 2006 and the impact of this source is also expected to reduce in future HAPINZ updates.
Table 6.4: Comparison of air pollution effects in 2006 versus 2001
Variable 2006 2001 Change
Population (all)
4.03 million 3.74 million +7.8%
Premature Mortality (all sources)
2,316 2,181 +6.2%
Premature Mortality (anthropogenic only)
1,175 1,123 +4.6%
Total Social Costs (NZ$ at June 2010)
$8.43 billion $7.96 billion +5.9%
Social Costs (domestic fires)
$2.38 billion $2.24 billion +6.3%
Social Costs (motor vehicles)
$0.93 billion $0.98 billion -5.1%
Social Costs (industry)
$0.45 billion $0.41 billion +9.8%
Social Costs (open burning)
$0.51 billion $0.47 billion +8.5%
Social Costs (natural)
$4.15 billion $3.86 billion +7.5%

March 2012
37 Updated HAPINZ Volume 1: Summary Report
7. Conclusions and Recommendations
7.1 Key Findings
The primary health impact resulting from air pollution (in terms of social costs) is premature mortality in adults. More than 2,300 New Zealanders are estimated to die prematurely each year due to exposure to PM10 pollution from all sources, with just over half associated with anthropogenic sources.
The total health impacts associated with anthropogenic air pollution in New Zealand each year are:
o 1,175 premature deaths in adults and babies23
o 607 extra hospital admissions for respiratory and cardiac illnesses
o 1.49 million restricted activity days (days on which people cannot do the things they might otherwise have done if air pollution was not present).
The total social costs associated with anthropogenic air pollution in New Zealand are estimated to be $4.28 billion per year or $1,061 per person, with the following contributions attributed to each source:
o 56 per cent due to domestic fires
o 22 per cent due to motor vehicles
o 10 per cent due to industry
o 12 per cent due to open burning.
Domestic fires dominate the health impacts associated with anthropogenic air pollution in every location across New Zealand, except the Auckland region (most particularly in the TLA of Auckland City where motor vehicle health impacts are nearly twice those of domestic fires). However, not being able to robustly assess NO2 exposure means that the results of this update most likely under-estimate the health impacts of motor vehicle-related air pollution.
The remaining TLAs in the Auckland region show more or less equal proportions of effects associated with domestic fires and motor vehicles. Other TLAs which are also more heavily impacted by motor vehicle emissions than the average include Hamilton City, Lower Hutt City, New Plymouth District, Tauranga City, and Wellington City.
23 There were 28,245 deaths in New Zealand in 2006 (Census 2006), with 393 deaths resulting from road
accidents.

March 2012
38 Updated HAPINZ Volume 1: Summary Report
Emissions from domestic fires are on average 2.5 times greater than emissions from motor vehicle sources nationally. However, in most South Island and central North Island locations, impacts from domestic fires are well in excess of the 2.5 average, with values from domestic fires ranging from 3.8 times greater than for motor vehicles in Christchurch City to 16 in Central Otago District (with many TLAs around 10).
Open burning is an appreciable air pollution source in all locations, rivalling motor vehicles and industry in its effects in many areas.
The effects associated with industry impacts vary significantly across New Zealand because the siting of many industries depends on access to particular resources which are often location-specific.
Māori are disproportionately represented in the adult premature mortality figures (18.3 per cent of deaths, but are only 8.7 per cent of adult population). This is not unexpected because the exposure-response function for Māori is 20%, nearly three times that of the whole adult population. However, the confidence intervals for the Māori adult and all adult response functions overlap so this finding may not be statistically significant. Regardless, it is of concern as this subgroup already experiences poorer health outcomes.
For the respiratory hospital admissions, one third of the cases occur in children aged 1 to 4 years – again a disproportionate effect given the population in that sub-group.
7.2 Policy Implications
The large fraction of health impacts associated with air pollution from natural sources is a challenge but highlights the critical importance of effective air quality policy and practices.
Air quality management can only realistically address anthropogenic sources. If nearly half of the adverse effect is associated with sources that cannot be managed then those sources that can be managed must be monitored and controlled more closely.
All anthropogenic sources except motor vehicles show a predicted increase in health effects between 2001 and 2006, largely in response to the increase in population combined with minimal or no estimated changes in emissions. The reduction in motor vehicle impacts reflects the significant and genuine improvements made in fuel quality and emissions standard requirements introduced after 2001.
Comparable improvements have occurred in domestic fire emissions in response to the introduction of the woodburner standards and various insulation and clean heat retrofit programmes but the majority of the impact occurs subsequent to 2006. However, the full impact of these changes will not be able to be quantified until the next HAPINZ update (which is likely to be after the March 2013 Census and subject to funding).
Open burning has been banned in many regions since 2006 and the impact of this source is also expected to reduce in future HAPINZ updates.

March 2012
39 Updated HAPINZ Volume 1: Summary Report
In the interim, the Health Effects Model developed for this update can be used to assist policy makers with designing and evaluating effective air quality management programmes.
7.3 Recommendations for Future Work
This health effects assessment was based on PM10 only. However, it is likely that there are separate and independent health effects resulting from other air pollutants – in particular exposure to NO2. There would be value in designing and undertaking a pilot NO2 exposure assessment in an area already identified as being impacted by motor vehicle emissions given that roadways are also the dominant source of NO2 emissions. The most obvious location would be in the urban area of Auckland where existing continuous NO2 monitoring data are already available and correlations may be able to be undertaken with the NZTA’s national passive sampling network.
Internationally, air pollution health effect assessments are increasingly being based on PM2.5 rather than PM10. We would have preferred to use PM2.5 in this update but there were only limited data available. Future HAPINZ updates should consider opting for PM2.5 but this will only be possible if additional ambient monitoring is undertaken. Currently, New Zealand has a ‘reporting only’ guideline as opposed to a mandatory requirement for monitoring of PM2.5 across the country. A number of submissions during the recent review of the national environmental standards for air quality called for the Ministry for the Environment to consider amending the current air quality regulations to include a standard for PM2.5. A significant advantage of shifting to PM2.5 is that it is easier to manage the sources as the majority of PM10 emitted by anthropogenic sources is smaller than 2.5 µm whilst the majority of natural sources of PM10 are within the range of 2.5 µm to 10 µm.
Open burning has emerged in this update as an appreciable air pollution source in all locations. In many areas across New Zealand, open burning effects rival those from motor vehicles and industry. However, emissions from open burning are difficult to quantify with confidence owing to difficulties in establishing the quantities of material burnt and because emission factors are sourced from overseas. Work is needed to develop a set of robust open burning emissions factors and activity data for New Zealand so this potentially significant source can be better quantified and managed.
A number of sources have not been included in the source apportionment because consistent emissions inventory data are unavailable. This includes emissions from shipping, aviation, rail and other off-road vehicles such as construction and agricultural vehicles. As only half of the diesel in New Zealand is used on-road, off-road diesel transport is one source that is very likely to influence emissions in urban areas and should be considered in future assessments. Work is needed to develop a set of robust off-road transport (including vehicles, marine, and aviation) emissions factors and activity data for New Zealand so these potentially significant sources can be better quantified and managed.
The New Zealand-specific exposure-response relationships used in this update were based on the original HAPINZ exposure model. Therefore, we recommend that this study

March 2012
40 Updated HAPINZ Volume 1: Summary Report
(Hales et al. 2010) be repeated using the 2006 exposure estimates in this report, along with appropriate mortality data from the New Zealand Census Mortality study. This research is particularly important in view of the inconclusive evidence that there are ethnic differences in sensitivity to the life-shortening effects of long term air pollution exposure (Hales et al. 2010). The availability of improved exposure estimates for recent years will increase the statistical power of future epidemiological studies, allowing more precise estimates of air pollution effects to be made.
The estimates undertaken in this update for the population subgroups, in particular those for Māori, indicate the potential for air pollution to further compound the effects of existing health inequalities. More work needs to be undertaken to refine the exposure-response functions for Māori and other ethnic subgroups such as Pacific Islanders to ensure that appropriate policies are in place to minimise their air pollution risks.
One of the critical parameters identified in the sensitivity testing that affects the outcome of any air pollution health impacts assessment is the value of statistical life (VOSL). In the absence of appropriate data, this update uses a published transport safety risk-based VOSL for the environmental risk-based VOSL. Given the likelihood that the environmental risk VOSL should be valued much higher to reflect the suffering and loss of life quality caused by air pollution (as it is in many overseas countries), we recommend that a study be carried out to estimate the relativity between these two types of VOSL specifically for New Zealand.
Another important issue is the loss of life quality for non-fatal cardiovascular and respiratory diseases, as well as cancer. The first two are covered in this update and therefore we recommend that a study also be carried out to estimate the relativity between loss of life quality in serious transport injuries and these non-fatal diseases.
March 2012
41 Updated HAPINZ Volume 1: Summary Report
References
AC (2011). Auckland Air Emissions Inventory 2006 Toolkit, Auckland Council, NZ, 2011
ALA (1995). Dollars and cents: The economic and health benefits of potential particulate matter reduction in the United States, American Lung Association, 1740 Broadway, New York.
APHEIS (2004). Health Impact Assessment of Air Pollution and Communication Strategy, Third Year Report 2002 -2003.
Aphekom (2011). Summary Report of the Aphekom Project 2008-2011. Report prepared on the impact of air pollution on health in Europe. Available from www.aphekom.org
Barnett et al. (2005). Air Pollution and Child Respiratory Health: A Case-Crossover Study in Australia and New Zealand. American Journal of Respiratory and Critical Care Medicine Vol 171 (11) pp 1272–1278
Brook R, Rajagopalan S, Arden Pope III C, Brook J, Bhatnagar A, et al. (2010). Particulate Matter Air Pollution and Cardiovascular Disease: An Update to the Scientific Statement from the American Heart Association. Journal of the American Heart Association. Circulation 2010 121: 2331-2378
Brunekreef B (2011). Pers. comm. Bert Brunekreef gave a keynote address at the CASANZ 2011 Conference held in Auckland, NZ, 31 July to 2 August
Cohen A (2011). Pers. comm. Aaron Cohen works at the Health Effects Institute (the organisation that is currently leading the project for the World Health Organization on the Global Burden of Disease relating to air pollution exposure).
Degobbi C, Saldiva PHN & Rogers C. (2010). Endotoxin as modifier of particulate matter toxicity: a review of the literature. Aerobiologia 27:97-105
ENHIS (2007). Methodological guidelines for Health Impact Assessment, prepared by European Environment and Health Information System (ENHIS), available from http://enhiscms.rivm.nl/object_binary/o2811_080107finalHiAir_Guidelines_web-version1.pdf
Fisher G, Rolfe KA, Kjellstrom T, Woodward A, Hales S et al. (2002). Health Effects due to Motor Vehicle Pollution in New Zealand, report to the Ministry of Transport, Wellington, New Zealand.
Fisher G, Kjellstrom T, Kingham S, Hales S & Shrestha R (2007). Health and Air Pollution in New Zealand: Main Report, A Research Project Funded by: Health Research Council of New Zealand, Ministry for the Environment, Ministry of Transport.
Hales S, Blakely T, Woodward A (2010). Air pollution and mortality in New Zealand: cohort study, Journal of Epidemiology and Community Health. doi:10.1136/jech.2010.112490.
Künzli N, Kaiser R, Medina S, Studnicka M, Chanel O, Filliger P, Herry M, et al. (2000). Public Health Impact of Outdoor and Traffic Related Air Pollution: A European Assessment, Lancet 2000, 356(9232): 795-801.
Kuschel G & Mahon K (2010). A Review and Update of HAPINZ for the Auckland Region, report IR2010/004 prepared for the Auckland Regional Council, NZ, August.
Lacasaña M, Esplugues A & Ballester F (2005). Exposure to ambient air pollution and prenatal and early childhood health effects, European Journal of Epidemiology 20: 183-189.
Metcalfe J, Kuschel G & Elder S (2009). Vehicle Emission Prediction Model, Version 3.0, CD-ROM of model plus supporting documentation prepared for Auckland Regional Council, NZ, February

March 2012
42 Updated HAPINZ Volume 1: Summary Report
MfE (2004). Proposed National Environmental Standards for Air Quality: Resource Management Act S32: Analysis of the Costs and Benefits, prepared by the Ministry for the Environment. Available from www.mfe.govt.nz
MfE (2007). Environment New Zealand 2007, Report ME847 published by the Ministry for the Environment, Wellington. Available from www.mfe.govt.nz
MoT (2010). The Social Cost of Road Crashes and Injuries June 2010 update, prepared by the Ministry of Transport, Wellington, NZ.
NZIER (2009). The value of air quality standards, Review and update of cost benefit analysis of National Environmental Standards on Air Quality, Wellington, New Zealand Institute of Economic Research.
OECD (2010). Valuing lives saved from environmental, transport and health policies: a meta-analysis of stated preference studies, OECD report ENV/EPOC/WPNEP(2008)10/FINAL, Organisation for Economic Co-operation and Development.
Ostro B (1987). Air pollution and morbidity revisited: A specification test, J Environ Econ Manage 14, 87-98.
Ostro B (2004). Outdoor air pollution. WHO environmental burden of disease series, No 5, WHO: Geneva.
Schwartz J, Laden F & Zanobetti A. (2002). The Concentration-Response Relation between PM2.5 and Daily Deaths. Environmnetal Health Perspectives 110 (10) 1025-1029
Schwartz J, Coull B, Laden F & Ryan L. (2008). The Effect of Dose and Timing of Dose on the Association between Airborne Particles and Survival. Environmnetal Health Perspectives 116 (1) 64-69
Steenhof M, Gosens I, Strak M, Godri K, Hoek G, et al. (2011). In vitro toxicity of particulate matter (PM) collected at different sites in the Netherlands is associated with PM composition, size fraction and oxidative potential – the RAPTES project. Particle and Fibre Toxicology 8:26
USEPA (2010). Quantitative Health Risk Assessment for Particulate Matter, US Environmental Protection Agency, Office of Air and Radiation: Research Triangle Park, North Carolina, USA.
WHO (2006). Air Quality Guidelines - Global Update. 2005. Particulate Matter, Ozone, Nitrogen Dioxide and Sulfur Dioxide, published by the World Health Organization Regional Office for Europe, Copenhagen, 2006.

March 2012
43 Updated HAPINZ Volume 1: Summary Report
Glossary
Term Definition
AC Auckland Council
acute short-term duration but severe
airshed a geographic area established to manage air pollution within the area as defined by the AQNES
ALA American Lung Association
anthropogenic generated by human activities, such as the combustion of fuels or processing of raw materials
AQNES National Environmental Standards for Air Quality
ARC Auckland Regional Council (now known as Auckland Council)
cardiovascular of, pertaining to, or affecting the heart and blood vessels
CAU Census Area Unit
CHA cardiovascular hospital admission
chronic long-term duration or constantly recurring
CO carbon monoxide
coarse particulate particles in the PM2.5 to PM10 fraction
COPD chronic obstructive pulmonary disease, which includes a range of conditions such as bronchitis, chronic bronchitis, emphysema, bronchiectasis, extrinsic allegoric alveolitis, and chronic airways obstruction
domestic fire a solid-fuel heating appliance which is intended primarily to heat a residential dwelling
fine particulate particles in the PM2.5fraction
HAPINZ Health and Air Pollution in New Zealand
kaitiakitanga in Māori culture, a kaitiaki is a guardian, and the process and practices of protecting and looking after the environment are referred to as kaitiakitanga
kg kilogram
m metre
MfE Ministry for the Environment
MoH Ministry of Health
morbidity ill health or suffering
mortality death
MoT Ministry of Transport
motor vehicles vehicles registered to travel on public roads, including cars, light commercial vehicles, trucks, buses and motorcycles
natural generated by natural activities, such as wind-blown dust, sea spray, vegetation, animals or volcanoes

March 2012
44 Updated HAPINZ Volume 1: Summary Report
NO2 nitrogen dioxide
NZIER New Zealand Institute for Economic Research
NZTA New Zealand Transport Agency
OECD Organisation for Economic Cooperation and Development
open burning burning of biomass and waste in the outdoors
PM particulate matter
PM2.5 particulate matter less than 2.5 µm in diameter, sometimes referred to as fine particulate – also known as respirable particulate because it deposits deeper in the gas-exchange region including the respiratory bronchioles and alveoli
PM10 particulate matter less than 10 µm in diameter, includes fine particulate (less than 2.5 µm) and coarse particulate (2.5 to-10 µm) - also known as thoracic particulate because it deposits within the lung airways and the gas-exchange region, including the trachea, bronchi, and bronchioles
RADs restricted activity days are days on which people cannot do the things they might otherwise have done if air pollution was not present.
respiratory of, pertaining to, or affecting the lungs and airways
RHA respiratory hospital admission
solid fuel coal and wood (including wood pellets)
taonga in Māori culture, a taonga is a treasured thing, whether tangible or intangible
TLA Territorial Local Authority, such as city or district council
µg microgram, one millionth of a gram
µg/m3 microgram per cubic metre, a unit of concentration
µm micrometre, one millionth of a metre
VKT vehicle kilometres travelled
VOSL value of statistical life
WHO World Health Organization
woodburner a domestic heating appliance that burns wood but which is not an open fire or a multifuel heater, a pellet heater or a coal burning heater or a cooking stove
WTP willingness to pay

March 2012
A1-1 Updated HAPINZ Volume 1: Summary Report
Appendix 1: Tables of Results
A1.1 Premature Mortality (Adults) by Region by Source
Table A1-1: Premature mortality for all adults aged 30 years and over in 2006 by source and by region
Region
Premature Mortality for all adults (cases) Social Costs
($million) Domestic Fires
Motor Vehicles
Industry Open
Burning Natural Total
Auckland 112 126 22 31 320 611 2,177
Bay of Plenty 35 14 10 10 83 153 545
Canterbury 187 45 40 6 156 435 1,548
Gisborne 4 0 0 2 15 21 75
Hawke’s Bay 41 7 9 12 44 113 402
Manawatu-Wanganui 30 7 0 11 75 123 439
Marlborough 14 2 1 5 8 31 111
Nelson 11 3 2 0 10 26 91
Northland 17 5 8 8 50 88 314
Otago 58 11 19 3 60 151 536
Southland 23 1 2 1 29 55 197
Taranaki 18 6 0 10 36 71 252
Tasman 9 1 2 0 12 25 88
Waikato 44 12 9 17 104 187 664
Wellington 43 13 0 19 122 197 701
West Coast 7 1 0 1 11 20 71
Outside 0 0 0 0 0 0 0
National 653 255 123 139 1,136 2,307 8,211

March 2012
A1-2 Updated HAPINZ Volume 1: Summary Report
Table A1-1a: Premature mortality for Māori adults aged 30 years and over in 2006 by source and by region
Region
Premature Mortality for all Māori adults (cases) Social Costs
($million) Domestic Fires
Motor Vehicles
Industry Open
Burning Natural Total
Auckland 18 20 3 5 51 97 347
Bay of Plenty 14 5 5 3 34 60 213
Canterbury 10 3 2 0 9 23 82
Gisborne 3 0 0 2 13 19 66
Hawke’s Bay 13 2 2 4 14 36 126
Manawatu-Wanganui 7 1 0 2 16 27 97
Marlborough 2 0 0 1 1 3 12
Nelson 0 0 0 0 0 1 4
Northland 8 2 3 3 26 42 150
Otago 2 0 1 0 2 5 19
Southland 2 0 0 0 3 5 19
Taranaki 3 1 0 1 6 10 37
Tasman 0 0 0 0 1 1 4
Waikato 16 4 2 6 35 63 226
Wellington 6 2 0 3 16 27 96
West Coast 0 0 0 0 1 1 5
Outside 0 0 0 0 0 0 0
National 105 41 19 31 228 422 1,504

March 2012
A1-3 Updated HAPINZ Volume 1: Summary Report
A1.2 Premature Mortality (Babies) by Region by Source
Table A1-2: Premature mortality for all babies aged 1 month to 1 year in 2006 by source and by region
Region
Premature Mortality for all babies (cases) Social Costs
($million) Domestic Fires
Motor Vehicles
Industry Open
Burning Natural Total
Auckland 0.6 0.6 0.1 0.2 1.6 3.0 11
Bay of Plenty 0.1 0.0 0.0 0.0 0.3 0.6 2
Canterbury 0.4 0.1 0.1 0.0 0.4 1.0 4
Gisborne 0.0 0.0 0.0 0.0 0.1 0.1 0
Hawke’s Bay 0.1 0.0 0.0 0.0 0.1 0.3 1
Manawatu-Wanganui 0.1 0.0 0.0 0.0 0.3 0.5 2
Marlborough 0.0 0.0 0.0 0.0 0.0 0.1 0
Nelson 0.0 0.0 0.0 0.0 0.0 0.1 0
Northland 0.1 0.0 0.0 0.0 0.2 0.3 1
Otago 0.1 0.0 0.0 0.0 0.2 0.3 1
Southland 0.1 0.0 0.0 0.0 0.1 0.2 1
Taranaki 0.1 0.0 0.0 0.0 0.1 0.2 1
Tasman 0.0 0.0 0.0 0.0 0.1 0.1 0
Waikato 0.2 0.1 0.0 0.1 0.5 0.9 3
Wellington 0.2 0.0 0.0 0.1 0.6 0.9 3
West Coast 0.1 0.0 0.0 0.0 0.2 0.3 1
Outside 0.0 0.0 0.0 0.0 0.0 0.0 0
National 2.2 1.0 0.3 0.6 4.7 8.8 31

March 2012
A1-4 Updated HAPINZ Volume 1: Summary Report
A1.3 Cardiac Hospital Admissions by Region by Source
Table A1-3: Cardiac hospital admissions for all New Zealanders in 2006 by source and by region
Region
Cardiac Hospital Admissions for all ages (cases) Social Costs
($million) Domestic Fires
Motor Vehicles
Industry Open
Burning Natural Total
Auckland 25.7 28.2 3.8 7.2 70.0 134.9 1
Bay of Plenty 8.3 2.3 2.1 2.4 16.2 31.2 0
Canterbury 32.2 6.8 6.3 1.4 26.1 72.7 1
Gisborne 0.5 0.1 0.0 0.3 2.3 3.2 0
Hawke’s Bay 9.8 1.6 1.7 3.0 9.1 25.2 0
Manawatu-Wanganui 6.8 1.2 0.0 2.4 15.1 25.7 0
Marlborough 3.1 0.5 0.3 1.1 1.9 6.8 0
Nelson 2.7 0.8 0.4 0.0 2.4 6.3 0
Northland 3.9 1.2 1.6 1.8 10.0 18.4 0
Otago 11.7 2.4 2.6 0.7 10.1 27.5 0
Southland 3.5 0.1 0.2 0.2 4.3 8.4 0
Taranaki 3.0 0.9 0.0 1.7 5.5 11.3 0
Tasman 1.4 0.1 0.4 0.0 1.9 3.8 0
Waikato 8.2 2.5 1.7 3.3 18.2 33.8 0
Wellington 8.2 2.0 0.0 3.5 21.6 35.3 0
West Coast 1.8 0.1 0.0 0.3 1.9 4.1 0
Outside 0.0 0.0 0.0 0.0 0.0 0.0 0
National 130.8 50.9 21.1 29.3 216.5 448.6 3

March 2012
A1-5 Updated HAPINZ Volume 1: Summary Report
A1.4 Respiratory Hospital Admissions by Region by Source
Table A1-4: Respiratory hospital admissions for all New Zealanders in 2006 by source and by region
Region
Respiratory Hospital Admissions for all ages (cases) Social Costs
($million) Domestic Fires
Motor Vehicles
Industry Open
Burning Natural Total
Auckland 50.4 57.0 7.6 14.9 138.2 268.1 1
Bay of Plenty 14.7 3.9 4.2 3.9 27.2 53.9 0
Canterbury 47.9 10.3 9.3 1.7 39.0 108.3 1
Gisborne 1.2 0.2 0.0 0.6 5.3 7.3 0
Hawke’s Bay 11.5 1.6 2.0 3.4 10.1 28.6 0
Manawatu-Wanganui 9.6 1.7 0.0 3.4 20.9 35.6 0
Marlborough 3.0 0.5 0.3 1.0 1.8 6.5 0
Nelson 3.3 1.0 0.5 0.0 2.8 7.7 0
Northland 5.9 1.8 2.5 2.8 14.9 28.0 0
Otago 15.6 4.0 3.9 0.7 13.6 37.8 0
Southland 4.8 0.2 0.4 0.3 6.0 11.6 0
Taranaki 4.6 1.4 0.0 2.6 8.3 16.9 0
Tasman 1.4 0.1 0.4 0.1 2.1 4.2 0
Waikato 12.8 4.0 2.4 5.6 27.2 52.0 0
Wellington 13.5 3.4 0.0 6.1 35.9 58.8 0
West Coast 2.5 0.1 0.0 0.3 2.5 5.5 0
Outside 0.0 0.0 0.0 0.0 0.0 0.0 0
National 202.7 91.2 33.5 47.4 356.0 730.8 3

March 2012
A1-6 Updated HAPINZ Volume 1: Summary Report
Table A1-4a: Respiratory hospital admissions for all children aged 1 to 4 years in 2006 by source and by region
Region
Respiratory Hospital Admissions for children aged 1-4 years (cases) Social Costs
($million) Domestic Fires
Motor Vehicles
Industry Open
Burning Natural Total
Auckland 18.0 20.4 2.8 5.5 49.7 96.4 0
Bay of Plenty 5.8 1.4 1.8 1.4 10.4 20.8 0
Canterbury 16.9 3.6 3.3 0.5 13.9 38.2 0
Gisborne 0.6 0.1 0.0 0.3 2.4 3.3 0
Hawke’s Bay 3.5 0.4 0.6 1.0 2.9 8.4 0
Manawatu-Wanganui 2.8 0.5 0.0 1.0 6.2 10.5 0
Marlborough 0.7 0.1 0.1 0.2 0.5 1.6 0
Nelson 1.3 0.4 0.2 0.0 1.0 2.8 0
Northland 1.7 0.5 0.7 0.8 4.5 8.3 0
Otago 3.8 0.9 0.9 0.2 3.4 9.2 0
Southland 1.7 0.1 0.1 0.1 2.1 4.1 0
Taranaki 1.1 0.4 0.0 0.6 2.1 4.2 0
Tasman 0.5 0.0 0.1 0.0 0.7 1.3 0
Waikato 3.7 1.3 0.7 1.8 8.0 15.6 0
Wellington 4.8 1.2 0.0 2.2 13.0 21.2 0
West Coast 0.7 0.0 0.0 0.1 0.7 1.6 0
Outside 0.0 0.0 0.0 0.0 0.0 0.0 0
National 67.5 31.5 11.4 15.7 121.5 247.6 1

March 2012
A1-7 Updated HAPINZ Volume 1: Summary Report
Table A1-4b: Respiratory hospital admissions for all children aged 5 to 14 years in 2006 by source and by region
Region
Respiratory Hospital Admissions for children aged 5-14 years (cases) Social Costs
($million) Domestic Fires
Motor Vehicles
Industry Open
Burning Natural Total
Auckland 10.4 11.4 1.5 3.1 28.6 55.0 0
Bay of Plenty 3.6 0.9 1.1 0.9 6.6 13.1 0
Canterbury 10.1 2.1 2.0 0.4 8.5 23.0 0
Gisborne 0.3 0.0 0.0 0.2 1.4 2.0 0
Hawke’s Bay 2.5 0.3 0.4 0.7 2.1 6.1 0
Manawatu-Wanganui 1.7 0.4 0.0 0.7 3.9 6.6 0
Marlborough 0.5 0.1 0.1 0.2 0.3 1.1 0
Nelson 0.9 0.3 0.2 0.0 0.8 2.2 0
Northland 1.1 0.3 0.5 0.5 2.8 5.3 0
Otago 2.2 0.5 0.6 0.1 2.1 5.5 0
Southland 1.2 0.0 0.1 0.1 1.5 2.9 0
Taranaki 0.8 0.3 0.0 0.5 1.6 3.3 0
Tasman 0.3 0.0 0.1 0.0 0.5 1.0 0
Waikato 2.4 0.7 0.4 1.1 5.2 9.9 0
Wellington 3.2 0.8 0.0 1.4 8.5 13.9 0
West Coast 0.4 0.0 0.0 0.1 0.5 1.0 0
Outside 0.0 0.0 0.0 0.0 0.0 0.0 0
National 41.6 18.4 6.9 9.9 75.0 151.8 1

March 2012
A1-8 Updated HAPINZ Volume 1: Summary Report
A1.5 Restricted Activity Days by Region by Source
Table A1-5: Restricted activity days for all New Zealanders in 2006 by source and by region
Region
Restricted Activity Days for all ages (cases) Social Costs
($million) Domestic Fires
Motor Vehicles
Industry Open
Burning Natural Total
Auckland 191,590 214,980 30,810 55,320 534,340 1,027,050 64
Bay of Plenty 43,310 10,130 10,020 12,570 84,370 160,400 10
Canterbury 210,410 46,660 38,880 7,770 176,890 480,600 30
Gisborne 3,270 510 0 1,500 13,940 19,220 1
Hawke’s Bay 45,080 6,250 7,500 13,550 44,520 116,890 7
Manawatu-Wanganui 32,810 6,350 80 12,370 74,190 125,810 8
Marlborough 12,150 1,750 1,130 4,420 9,100 28,550 2
Nelson 19,770 4,960 3,050 0 15,590 43,360 3
Northland 16,620 4,550 6,370 7,790 44,200 79,530 5
Otago 66,790 17,780 16,660 3,390 64,290 168,920 11
Southland 21,420 850 1,620 1,330 27,630 52,850 3
Taranaki 18,470 4,700 0 10,610 34,280 68,060 4
Tasman 9,040 1,020 2,460 410 13,520 26,450 2
Waikato 56,550 15,420 10,120 24,960 125,360 232,410 14
Wellington 61,810 15,840 40 30,500 168,020 276,210 17
West Coast 8,460 610 120 1,210 9,590 19,980 1
Outside 40 0 0 10 140 190 0
National 817,580 352,340 128,860 187,710 1,439,980 2,926,470 181

March 2012
A1-9 Updated HAPINZ Volume 1: Summary Report
A1.6 Total Social Costs by Source
Table A1-6: Total social costs from PM10 air pollution in 2006 by source and by region
Region Pop’n
Social Costs by Source ($million) Anthropogenic
Fraction Dom Fires
Motor Vehicles
Industry Open
Burning Natural Total
Auckland 1,303,029 411.8 465.7 79.0 115.0 1,181.6 2,253.1 48%
Bay of Plenty 257,382 128.8 52.4 35.9 37.6 303.0 557.7 46%
Canterbury 521,847 680.9 164.2 145.5 23.4 568.0 1,582.1 64%
Gisborne 44,508 13.2 1.5 0.0 6.5 55.8 77.0 28%
Hawke’s Bay 147,777 148.1 24.3 32.7 44.4 161.4 410.9 61%
Manawatu-Wanganui 222,411 110.2 25.8 0.16 39.8 272.5 448.4 39%
Marlborough 42,564 51.2 6.5 5.3 19.6 30.7 113.2 73%
Nelson 42,897 38.9 11.9 6.4 0.0 36.6 93.8 61%
Northland 148,482 62.5 19.5 28.1 29.4 181.0 320.5 44%
Otago 193,782 212.0 40.9 67.1 11.6 216.5 548.1 61%
Southland 90,873 83.3 2.5 5.9 4.9 104.7 201.2 48%
Taranaki 104,118 65.8 22.3 0.0 36.6 131.9 256.7 49%
Tasman 44,634 32.1 3.2 9.0 1.3 44.7 90.3 50%
Waikato 382,701 161.2 43.9 33.0 62.6 381.6 682.3 44%
Wellington 448,947 156.9 48.1 0.2 70.5 445.8 721.5 38%
West Coast 31,332 27.3 2.1 0.8 4.3 38.7 73.2 47%
Outside 618 0.1 0.0 0.0 0.0 0.2 0.2 26%
National 4,027,902 2,384.2 934.8 448.8 507.7 4,154.7 8,430.3 51%
16 in total (as at 2006)

March 2012
A1-10 Updated HAPINZ Volume 1: Summary Report
Table A1-6a: Total social costs from PM10 air pollution in 2006 by source and by TLA
TLA Pop’n
Social Costs ($million) Anthropogenic
Fraction Dom Fires
Motor Vehicles
Industry Open
Burning Natural Total
Ashburton District 27,375 29.0 3.1 20.5 5.8 31.5 89.9 65%
Auckland City 404,637 137.2 204.6 41.0 38.3 428.4 849.5 50%
Buller District 9,699 14.8 0.8 0.6 2.6 20.2 39.0 48%
Carterton District 7,101 2.1 1.4 0.0 0.4 9.9 13.7 28%
Central Hawke's Bay District 12,957 3.7 0.6 0.0 1.2 13.9 19.5 29%
Central Otago District 16,644 23.4 1.5 0.0 2.0 21.8 48.8 55%
Chatham Islands Territory 609 0.0 0.0 0.0 0.0 0.2 0.2 26%
Christchurch City 348,450 490.5 126.8 105.8 2.3 391.8 1,117.2 65%
Clutha District 16,836 9.0 0.4 0.1 0.9 14.0 24.5 43%
Dunedin City 118,671 145.0 35.4 65.6 2.3 133.7 381.9 65%
Far North District 55,854 20.7 4.7 0.1 6.2 67.6 99.2 32%
Franklin District 58,929 13.4 7.2 3.9 2.1 44.0 70.7 38%
Gisborne District 44,472 13.1 1.5 0.0 6.5 55.8 77.0 28%
Gore District 12,105 14.4 0.4 1.5 0.6 14.7 31.5 53%
Grey District 13,221 9.7 0.8 0.2 1.3 10.2 22.3 54%
Hamilton City 129,246 64.4 26.7 14.8 42.3 121.1 269.4 55%
Hastings District 70,833 79.3 8.8 13.0 20.2 71.4 192.6 63%
Hauraki District 17,196 2.5 0.8 5.4 0.4 16.2 25.3 36%
Horowhenua District 29,868 16.9 4.3 0.0 3.7 46.6 71.5 35%
Hurunui District 10,473 9.1 1.0 0.0 2.7 15.5 28.3 45%
Invercargill City 50,322 62.7 1.4 4.1 3.3 69.3 140.8 51%
Kaikoura District 3,624 4.3 1.4 0.0 1.6 6.2 13.4 54%
Kaipara District 18,138 4.9 1.0 0.0 1.8 20.8 28.6 27%
Kapiti Coast District 46,194 25.2 2.8 0.0 4.9 63.0 95.9 34%
Kawerau District 6,921 0.6 0.0 0.5 0.1 1.1 2.4 52%
Lower Hutt City 97,710 28.2 11.5 0.0 17.7 118.4 175.8 33%
Mackenzie District 3,801 0.6 0.1 0.0 0.2 2.1 3.0 30%
Manawatu District 28,248 18.6 5.0 0.0 4.6 43.0 71.3 40%

March 2012
A1-11 Updated HAPINZ Volume 1: Summary Report
TLA Pop’n
Social Costs ($million) Anthropogenic
Fraction Dom Fires
Motor Vehicles
Industry Open
Burning Natural Total
Manukau City 328,956 87.8 93.2 14.9 29.6 250.2 475.8 47%
Marlborough District 42,552 51.2 6.5 5.3 19.6 30.7 113.2 73%
Masterton District 22,620 17.3 1.5 0.2 4.0 24.6 47.6 48%
Matamata-Piako District 30,471 10.6 2.6 0.2 2.6 35.4 51.5 31%
Napier City 55,365 63.7 14.5 19.7 22.6 71.1 191.6 63%
Nelson City 42,897 38.9 11.9 6.4 0.0 36.6 93.8 61%
New Plymouth District 68,892 39.1 18.0 0.0 28.4 87.4 173.0 49%
North Shore City 205,608 68.0 69.5 5.6 20.7 185.9 349.7 47%
Opotiki District 8,976 3.3 0.7 0.0 1.3 12.6 17.9 29%
Otorohanga District 9,075 2.7 0.7 0.0 0.9 11.7 15.9 27%
Palmerston North City 75,546 30.5 9.9 0.0 21.5 73.7 135.6 46%
Papakura District 45,183 18.7 18.6 2.2 4.3 52.5 96.2 45%
Porirua City 48,543 18.8 6.0 0.0 6.9 36.6 68.3 46%
Queenstown-Lakes District 22,956 4.9 0.9 0.0 0.7 12.7 19.3 34%
Rangitikei District 14,715 3.6 0.6 0.0 0.9 8.5 13.6 37%
Rodney District 89,571 25.0 18.1 7.6 3.5 80.7 134.9 40%
Rotorua District 65,901 42.6 15.1 35.2 2.6 73.9 169.5 56%
Ruapehu District 13,572 9.9 0.9 0.0 2.9 13.7 27.5 50%
Selwyn District 33,663 10.8 1.9 0.5 2.4 18.8 34.5 45%
South Taranaki District 26,484 17.9 3.3 0.0 5.7 30.5 57.5 47%
South Waikato District 22,650 19.4 2.1 8.4 4.2 24.5 58.7 58%
South Wairarapa District 8,886 5.6 0.7 0.0 1.1 14.8 22.2 33%
Southland District 28,446 6.2 0.7 0.4 1.0 20.7 29.0 29%
Stratford District 8,892 8.8 1.0 0.0 2.4 14.1 26.4 46%
Tararua District 17,634 6.3 1.8 0.0 1.3 19.9 29.3 32%
Tasman District 44,634 32.1 3.2 9.0 1.3 44.7 90.3 50%
Taupo District 32,421 21.2 4.6 0.1 3.6 39.8 69.3 43%
Tauranga City 103,638 55.4 32.7 0.0 25.3 138.1 251.5 45%
Thames-Coromandel District 25,938 11.4 1.2 0.4 2.4 40.0 55.5 28%
Timaru District 42,876 106.0 22.9 12.5 3.8 63.2 208.4 70%

March 2012
A1-12 Updated HAPINZ Volume 1: Summary Report
TLA Pop’n
Social Costs ($million) Anthropogenic
Fraction Dom Fires
Motor Vehicles
Industry Open
Burning Natural Total
Upper Hutt City 38,418 18.8 5.5 0.0 5.7 48.7 78.7 38%
Waikato District 43,947 7.3 2.0 0.1 1.6 23.0 34.0 32%
Waimakariri District 42,825 29.4 6.6 6.1 4.4 33.7 80.2 58%
Waimate District 7,209 1.0 0.3 0.1 0.2 4.3 6.0 28%
Waipa District 42,507 16.6 2.1 3.1 3.6 52.4 77.6 33%
Wairoa District 8,475 1.4 0.4 0.0 0.4 5.0 7.2 30%
Waitakere City 186,429 65.4 55.1 3.7 17.2 151.6 292.9 48%
Waitaki District 20,223 29.7 2.7 1.4 5.8 35.1 74.8 53%
Waitomo District 9,438 1.0 0.4 0.4 0.3 3.6 5.7 37%
Wanganui District 42,621 24.4 3.2 0.0 4.9 67.0 99.5 33%
Wellington City 179,460 40.9 18.6 0.0 29.9 129.9 219.3 41%
Western Bay of Plenty District 42,072 10.6 1.9 0.0 4.1 36.5 53.1 31%
Westland District 8,412 2.7 0.4 0.0 0.5 8.3 11.9 30%
Whakatane District 33,294 16.8 2.1 0.1 4.2 42.8 66.1 35%
Whangarei District 74,460 37.0 13.8 27.9 21.4 92.6 192.8 52%
Outside 417 0.0 0.0 0.0 0.0 0.0 0.0 22%
National 4,027,902 2,384.2 934.8 448.8 507.7 4,154.7 8,430.3 51%
74 in total (as at 2006)

March 2012
A1-13 Updated HAPINZ Volume 1: Summary Report
Table A1-6b: Total social costs from PM10 air pollution in 2006 by source and by airshed
Airshed Pop’n
Social Costs by Source ($million) Anthropogenic
Fraction Dom Fires
Motor Vehicles
Industry Open
Burning Natural Total
Alexandra, Clyde & Cromwell 13,104* 19.6 0.5 0.0 1.5 9.9 31.5 69%
Arrowtown & Queenstown 15,216* 3.0 0.3 0.0 0.4 5.8 9.5 39%
Ashburton 16,833 28.3 2.9 20.4 5.6 28.2 85.4 67%
Auckland Urban 1,197,948 380.0 446.4 67.8 110.5 1,077.6 2,082.3 48%
Balclutha & Milton 11,862* 6.0 0.2 0.1 0.4 3.7 10.5 64%
Beachlands & Maraetai 5,277* 0.3 0.1 0.1 0.0 0.8 1.3 38%
Blenheim 30,549 48.2 5.9 5.1 18.9 24.5 102.6 76%
Cambridge 15,060 8.6 1.0 0.0 1.6 23.2 34.4 33%
Christchurch 348,918 482.5 125.4 102.4 0.0 380.6 1,090.8 65%
Dargaville 9,162 1.1 0.3 0.0 0.3 3.9 5.5 30%
Dunedin (North, Central & South), Green Island
& Port Chalmers 97,083* 120.7 32.5 57.3 0.4 108.2 319.1 66%
Geraldine 6,336 1.6 0.3 0.1 0.6 2.4 5.0 52%
Gore 8,967 12.1 0.3 1.3 0.5 12.4 26.7 53%
Hamilton City 144,114 67.0 27.2 14.8 42.6 127.9 279.5 54%
Hastings 31,125 52.1 5.4 6.8 12.4 31.2 107.9 71%
Hawea 1,596 0.3 0.1 0.0 0.1 1.3 1.8 26%
Helensville 5,508 0.6 0.4 0.1 0.1 1.9 3.0 38%
Huntly 8,877 1.2 0.5 0.1 0.7 2.8 5.3 47%
Invercargill 44,115 62.3 1.3 4.1 3.3 67.7 138.6 51%
Kaiapoi 11,430 17.7 4.2 2.8 1.5 13.2 39.4 67%
Kaitaia 8,910 5.0 0.8 0.1 1.2 12.4 19.5 36%
Kapiti Coast 46,317 25.3 2.9 0.0 4.5 62.5 95.3 34%
Karori 14,007 5.8 0.7 0.0 3.9 12.9 23.3 45%
Kerikeri 12,051 1.2 0.2 0.0 0.3 3.3 4.9 34%
Kingston 468 0.9 0.4 0.0 0.2 4.0 5.4 26%
Kumeu & Riverhead 9,555* 4.6 4.0 0.1 0.5 8.2 17.4 53%
Lower Hutt 83,820 24.2 11.0 0.0 16.7 107.6 159.5 33%

March 2012
A1-14 Updated HAPINZ Volume 1: Summary Report
Airshed Pop’n
Social Costs by Source ($million) Anthropogenic
Fraction Dom Fires
Motor Vehicles
Industry Open
Burning Natural Total
Marsden Point 8,730 0.9 0.5 0.0 0.4 5.0 6.8 27%
Matamata 9,105 2.6 0.8 0.1 1.2 5.0 9.6 48%
Morrinsville 9,129 5.6 1.2 0.0 0.9 20.3 28.0 28%
Mosgiel 11,961 22.1 2.1 7.4 1.6 18.3 51.5 64%
Napier 41,358 45.0 11.5 16.1 15.6 48.8 137.0 64%
Naseby & Ranfurly 1,857* 1.8 0.2 0.0 0.2 3.5 5.7 39%
Nelson A 10,878 11.1 2.3 0.5 0.0 5.8 19.7 70%
Nelson B 21,036 18.6 6.1 3.8 0.0 19.3 47.8 60%
Nelson C 10,980 9.3 3.5 2.1 0.0 11.5 26.3 56%
Ngaruawahia 12,198 1.3 0.4 0.0 0.3 5.1 7.1 29%
Oamaru 16,386 27.8 2.2 1.4 5.3 27.1 63.8 58%
Otorohanga 8,685 1.2 0.5 0.0 0.2 5.2 7.2 27%
Paeroa 7,137 0.7 0.3 0.0 0.1 2.9 4.0 27%
Palmerston 1,572 1.6 0.5 0.0 0.4 6.6 9.0 26%
Porirua 68,478 23.9 8.9 0.0 9.5 50.7 93.0 46%
Pukekohe 17,142 6.8 3.6 2.7 1.2 20.0 34.3 42%
Putaruru 7,920 5.0 0.5 7.8 0.3 9.9 23.6 58%
Rangiora 14,742 8.3 1.6 3.3 2.0 10.7 25.9 59%
Reefton 1,269 11.3 0.1 0.4 1.9 6.8 20.5 67%
Richmond 14,319 25.4 2.3 8.9 0.2 20.8 57.5 64%
Rotorua 51,594 34.5 12.3 31.2 1.8 57.0 136.8 58%
Roxburgh 1,683 2.0 0.8 0.0 0.3 8.5 11.5 26%
Snells Beach 4,167 1.0 0.3 0.3 0.2 3.4 5.2 35%
Taihape 4,563 0.4 0.3 0.0 0.1 1.9 2.6 28%
Taumarunui 6,639 8.1 0.5 0.0 2.6 9.6 20.9 54%
Taupo 19,569 16.8 3.9 0.1 2.6 24.0 47.4 49%
Te Aroha 10,593 0.9 0.2 0.0 0.1 3.2 4.4 28%
Te Awamutu & Kihikihi 14,028* 4.0 0.4 3.0 1.5 18.4 27.3 33%
Te Kuiti 7,011 0.6 0.1 0.4 0.2 1.5 2.8 48%
Thames 10,008 3.6 0.3 0.4 0.5 12.2 17.0 28%

March 2012
A1-15 Updated HAPINZ Volume 1: Summary Report
Airshed Pop’n
Social Costs by Source ($million) Anthropogenic
Fraction Dom Fires
Motor Vehicles
Industry Open
Burning Natural Total
Timaru 26,892 97.5 21.6 12.3 1.6 49.8 182.8 73%
Tokoroa 13,530 14.2 1.6 0.6 3.9 14.0 34.2 59%
Tuakau 7,131 0.6 0.3 0.0 0.2 2.0 3.1 34%
Turangi 5,232 0.6 0.1 0.0 0.1 1.9 2.7 30%
Upper Hutt 35,277 17.6 5.4 0.0 5.3 46.3 74.6 38%
Waiheke Island 7,689 0.5 0.2 0.1 0.1 1.7 2.6 35%
Waihi 4,500 1.1 0.1 5.4 0.1 9.4 16.0 41%
Waikouaiti 2,376 0.1 0.1 0.0 0.0 0.5 0.6 26%
Waimate 7,032 0.2 0.1 0.1 0.0 0.8 1.3 35%
Wainuiomata 17,214 5.3 0.6 0.0 1.3 13.2 20.4 35%
Wairarapa 38,607 24.9 3.7 0.2 5.5 49.3 83.5 41%
Waiuku 10,695 1.5 0.8 0.5 0.2 4.4 7.4 41%
Wanaka 5,409 0.7 0.1 0.0 0.1 1.6 2.4 36%
Warkworth 3,270 0.3 0.5 0.0 0.1 0.7 1.6 55%
Wellington 109,224 21.2 11.0 0.0 18.5 76.4 127.1 40%
Wellsford 1,671 0.2 0.1 0.0 0.0 0.7 1.1 39%
Whangamata 3,555 0.7 0.0 0.0 0.1 2.0 2.9 29%
Whangarei 60,069 33.6 12.6 26.7 20.0 80.5 173.4 54%
Whitianga 7,938 1.0 0.4 0.0 0.3 4.5 6.2 27%
Outside 1,037,646 480.4 132.1 29.3 170.6 1,214.3 2,026.7 40%
National 4,027,902 2,384.2 934.8 448.8 507.7 4,154.7 8,430.3 51%
There are officially 71 PM10 airsheds in New Zealand but 76 are shown in the table
because Otago 1, 2, 3 & 4 have been split into specific town airsheds.
Airsheds shown highlighted are combined either because they occupy the same CAU or because the CAUs that apply to them cannot be easily separated.
The population figures marked with * have been combined.
Airsheds are defined by meshblock boundaries whereas the HAPINZ update only has resolution down to CAU boundaries so some minor adjustments have been made.

March 2012
A1-16 Updated HAPINZ Volume 1: Summary Report
Table A1-6c: Total social costs from PM10 air pollution in 2006 by source and by Stats NZ urban area
Stats NZ Urban Area Pop’n
Social Costs by Source ($million) Anthropogenic
Fraction Dom Fires
Motor Vehicles
Industry Open
Burning Natural Total
Alexandra 4,824 1.3 0.0 0.0 0.1 0.5 1.9 74%
Arrowtown 2,148 0.5 0.0 0.0 0.1 0.2 0.8 75%
Ashburton 16,833 28.3 2.9 20.4 5.6 28.2 85.4 67%
Balclutha 4,062 1.7 0.0 0.0 0.1 1.1 2.9 62%
Blenheim 28,527 49.6 6.0 5.1 19.2 23.8 103.7 77%
Bluff 1,791 0.1 0.0 0.0 0.0 0.1 0.2 38%
Brightwater 1,794 0.1 0.0 0.0 0.0 0.3 0.4 29%
Bulls 1,659 0.3 0.1 0.0 0.1 0.5 0.9 47%
Cambridge Zone 15,195 9.0 1.1 0.1 1.6 24.2 36.0 33%
Carterton 4,122 0.5 0.0 0.0 0.1 0.6 1.2 47%
Central Auckland Zone 395,964 135.3 204.2 40.9 37.5 420.3 838.2 50%
Christchurch 360,783 509.2 130.5 105.2 3.7 401.7 1,150.2 65%
Coromandel 1,476 1.9 0.1 0.0 0.2 5.5 7.7 29%
Cromwell 3,588 14.3 0.4 0.0 1.2 7.2 23.1 69%
Dannevirke 5,520 1.8 0.2 0.0 0.4 2.5 4.8 47%
Darfield 1,482 3.7 0.3 0.0 0.9 3.4 8.4 59%
Dargaville 4,455 0.5 0.0 0.0 0.1 1.0 1.6 39%
Dunedin 110,991 144.1 35.2 65.6 2.1 130.0 376.9 66%
Edgecumbe 1,626 0.5 0.0 0.0 0.1 0.8 1.4 42%
Eltham 1,980 1.1 0.1 0.0 0.3 1.4 2.9 53%
Featherston 2,343 2.2 0.1 0.0 0.4 4.0 6.6 40%
Feilding 13,887 11.8 1.7 0.0 2.9 19.2 35.5 46%
Foxton Community 4,446 0.6 0.1 0.0 0.1 0.9 1.8 47%
Geraldine 2,244 1.3 0.1 0.1 0.5 1.0 3.1 66%
Gisborne 32,535 11.2 0.9 0.0 5.9 46.8 64.8 28%
Gore 9,645 14.2 0.3 1.5 0.6 13.8 30.4 55%
Greymouth 9,672 9.1 0.7 0.2 1.2 7.9 19.2 59%
Greytown 1,998 0.4 0.0 0.0 0.1 0.8 1.3 40%

March 2012
A1-17 Updated HAPINZ Volume 1: Summary Report
Stats NZ Urban Area Pop’n
Social Costs by Source ($million) Anthropogenic
Fraction Dom Fires
Motor Vehicles
Industry Open
Burning Natural Total
Hamilton Zone 155,253 70.5 27.6 14.8 43.0 136.5 292.4 53%
Hanmer Springs 729 7.1 0.4 0.0 2.1 6.6 16.2 59%
Hastings Zone 62,109 78.7 8.6 13.0 20.1 69.3 189.6 63%
Hawera 10,779 12.5 2.4 0.0 4.1 16.7 35.7 53%
Helensville 2,529 0.4 0.2 0.1 0.1 1.0 1.6 40%
Hokitika 3,540 0.7 0.0 0.0 0.1 0.6 1.4 58%
Huntly 6,834 1.0 0.3 0.1 0.6 1.6 3.6 57%
Inglewood 3,090 0.7 0.1 0.0 0.2 0.8 1.8 53%
Invercargill 46,770 62.4 1.3 4.1 3.3 68.5 139.6 51%
Kaikohe 4,113 0.7 0.0 0.0 0.1 1.4 2.2 38%
Kaikoura 2,175 3.7 0.9 0.0 1.5 2.8 8.8 68%
Kaitaia 5,205 4.3 0.5 0.0 0.9 8.7 14.4 39%
Kapiti 37,344 17.4 1.8 0.0 3.0 45.6 67.8 33%
Katikati Community 3,582 1.0 0.1 0.0 0.3 2.0 3.4 42%
Kawakawa 1,347 0.1 0.0 0.0 0.0 0.3 0.5 38%
Kawerau 6,921 0.6 0.0 0.5 0.1 1.1 2.4 52%
Kerikeri 5,859 0.9 0.1 0.0 0.2 1.9 3.1 38%
Leeston 1,296 1.8 0.1 0.0 0.5 1.6 4.0 59%
Levin 19,140 11.5 1.5 0.0 2.7 25.8 41.5 38%
Lincoln 2,727 0.7 0.1 0.0 0.2 0.7 1.8 60%
Lower Hutt Zone 97,158 27.8 11.4 0.0 17.5 116.7 173.5 33%
Manaia 924 0.3 0.0 0.0 0.1 0.4 0.9 53%
Mangakino 1,020 0.2 0.0 0.0 0.0 0.4 0.7 42%
Martinborough 1,326 1.1 0.0 0.0 0.2 1.9 3.2 40%
Marton 4,680 2.3 0.1 0.0 0.5 3.2 6.1 47%
Masterton 19,491 17.1 1.4 0.2 4.0 23.8 46.5 49%
Matamata 6,306 2.4 0.6 0.1 1.1 4.3 8.6 50%
Milton 1,884 4.1 0.1 0.1 0.2 1.5 5.9 75%
Moerewa 1,533 0.9 0.1 0.0 0.2 1.9 3.0 38%
Morrinsville 6,603 3.8 0.1 0.0 0.5 11.1 15.6 29%
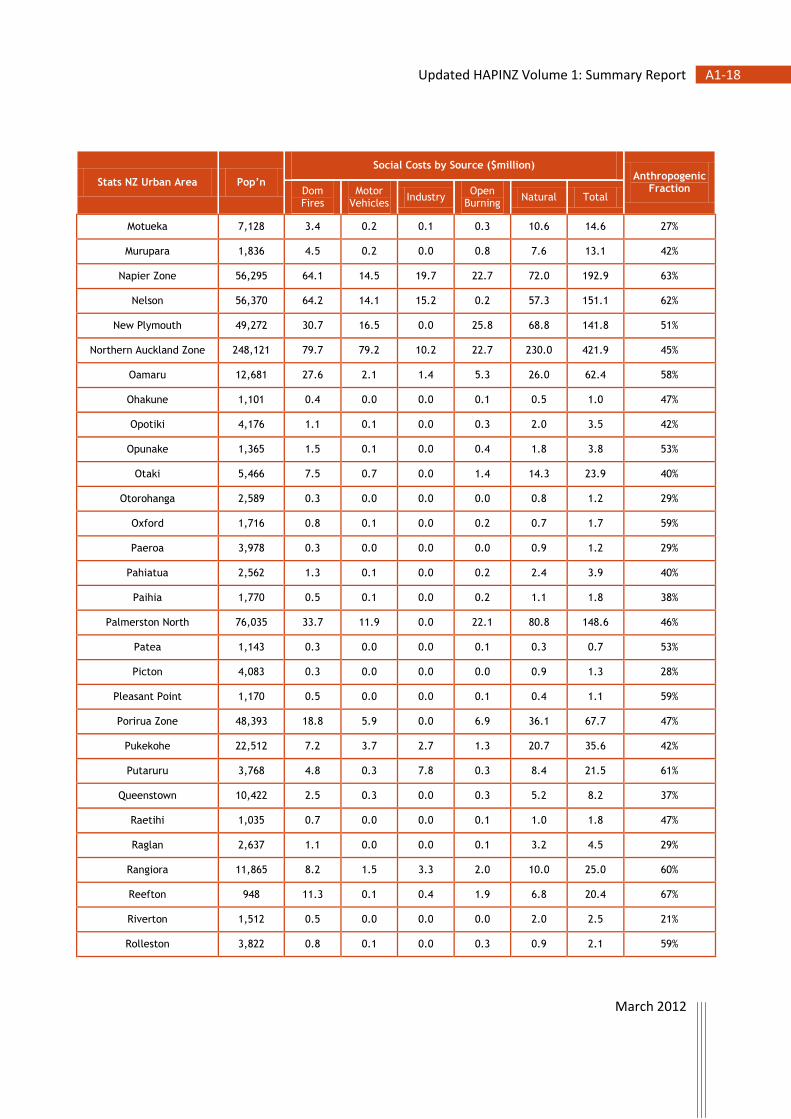
March 2012
A1-18 Updated HAPINZ Volume 1: Summary Report
Stats NZ Urban Area Pop’n
Social Costs by Source ($million) Anthropogenic
Fraction Dom Fires
Motor Vehicles
Industry Open
Burning Natural Total
Motueka 7,128 3.4 0.2 0.1 0.3 10.6 14.6 27%
Murupara 1,836 4.5 0.2 0.0 0.8 7.6 13.1 42%
Napier Zone 56,295 64.1 14.5 19.7 22.7 72.0 192.9 63%
Nelson 56,370 64.2 14.1 15.2 0.2 57.3 151.1 62%
New Plymouth 49,272 30.7 16.5 0.0 25.8 68.8 141.8 51%
Northern Auckland Zone 248,121 79.7 79.2 10.2 22.7 230.0 421.9 45%
Oamaru 12,681 27.6 2.1 1.4 5.3 26.0 62.4 58%
Ohakune 1,101 0.4 0.0 0.0 0.1 0.5 1.0 47%
Opotiki 4,176 1.1 0.1 0.0 0.3 2.0 3.5 42%
Opunake 1,365 1.5 0.1 0.0 0.4 1.8 3.8 53%
Otaki 5,466 7.5 0.7 0.0 1.4 14.3 23.9 40%
Otorohanga 2,589 0.3 0.0 0.0 0.0 0.8 1.2 29%
Oxford 1,716 0.8 0.1 0.0 0.2 0.7 1.7 59%
Paeroa 3,978 0.3 0.0 0.0 0.0 0.9 1.2 29%
Pahiatua 2,562 1.3 0.1 0.0 0.2 2.4 3.9 40%
Paihia 1,770 0.5 0.1 0.0 0.2 1.1 1.8 38%
Palmerston North 76,035 33.7 11.9 0.0 22.1 80.8 148.6 46%
Patea 1,143 0.3 0.0 0.0 0.1 0.3 0.7 53%
Picton 4,083 0.3 0.0 0.0 0.0 0.9 1.3 28%
Pleasant Point 1,170 0.5 0.0 0.0 0.1 0.4 1.1 59%
Porirua Zone 48,393 18.8 5.9 0.0 6.9 36.1 67.7 47%
Pukekohe 22,512 7.2 3.7 2.7 1.3 20.7 35.6 42%
Putaruru 3,768 4.8 0.3 7.8 0.3 8.4 21.5 61%
Queenstown 10,422 2.5 0.3 0.0 0.3 5.2 8.2 37%
Raetihi 1,035 0.7 0.0 0.0 0.1 1.0 1.8 47%
Raglan 2,637 1.1 0.0 0.0 0.1 3.2 4.5 29%
Rangiora 11,865 8.2 1.5 3.3 2.0 10.0 25.0 60%
Reefton 948 11.3 0.1 0.4 1.9 6.8 20.4 67%
Riverton 1,512 0.5 0.0 0.0 0.0 2.0 2.5 21%
Rolleston 3,822 0.8 0.1 0.0 0.3 0.9 2.1 59%

March 2012
A1-19 Updated HAPINZ Volume 1: Summary Report
Stats NZ Urban Area Pop’n
Social Costs by Source ($million) Anthropogenic
Fraction Dom Fires
Motor Vehicles
Industry Open
Burning Natural Total
Rotorua 53,769 40.9 14.4 35.2 2.2 65.8 158.4 58%
Russell 819 4.3 0.3 0.0 0.9 8.8 14.3 38%
Shannon 1,368 1.6 0.2 0.0 0.3 2.3 4.4 47%
Snells Beach 3,234 0.1 0.0 0.0 0.0 0.2 0.3 38%
Southern Auckland Zone 371,649 105.9 111.5 17.1 33.8 300.6 568.9 47%
Stratford 5,337 7.8 0.4 0.0 2.2 9.2 19.7 53%
Taihape 1,788 0.1 0.0 0.0 0.0 0.1 0.2 50%
Taipa Bay-Mangonui 1,566 1.3 0.2 0.0 0.4 3.0 4.8 38%
Tairua 1,266 2.3 0.1 0.0 0.3 6.6 9.2 29%
Takaka 1,152 0.8 0.0 0.1 0.1 2.6 3.7 29%
Taumarunui 5,055 8.1 0.5 0.0 2.6 9.3 20.5 55%
Taupo 21,297 18.3 3.9 0.1 2.7 28.2 53.2 47%
Tauranga 108,888 57.1 32.8 0.0 25.7 140.7 256.4 45%
Te Anau 1,899 0.0 0.0 0.0 0.0 0.3 0.4 6%
Te Aroha 3,768 0.6 0.0 0.0 0.0 1.6 2.2 29%
Te Awamutu Zone 14,457 4.1 0.4 3.0 1.5 18.5 27.5 33%
Te Kuiti 4,419 0.5 0.0 0.4 0.2 0.7 1.7 61%
Te Puke Community 7,080 2.3 0.4 0.0 0.6 4.6 7.8 42%
Temuka 4,044 5.2 0.5 0.0 1.2 4.7 11.5 59%
Thames 6,756 3.5 0.3 0.4 0.5 11.5 16.1 29%
Timaru 26,892 97.5 21.6 12.3 1.6 49.8 182.8 73%
Tokoroa 13,530 14.2 1.6 0.6 3.9 14.0 34.2 59%
Turangi 3,240 0.5 0.0 0.0 0.1 1.2 1.8 31%
Twizel Community 1,017 0.2 0.0 0.0 0.0 0.1 0.3 59%
Upper Hutt Zone 36,405 18.2 4.7 0.0 5.6 44.1 72.5 39%
Waiheke Island 7,689 0.5 0.2 0.1 0.1 1.7 2.6 35%
Waihi 4,500 1.1 0.1 5.4 0.1 9.4 16.0 41%
Waihi Beach 1,776 0.2 0.0 0.0 0.1 0.5 0.8 42%
Waimate 2,835 0.1 0.0 0.1 0.0 0.1 0.3 59%
Waiouru 1,383 0.3 0.0 0.0 0.0 0.4 0.8 48%
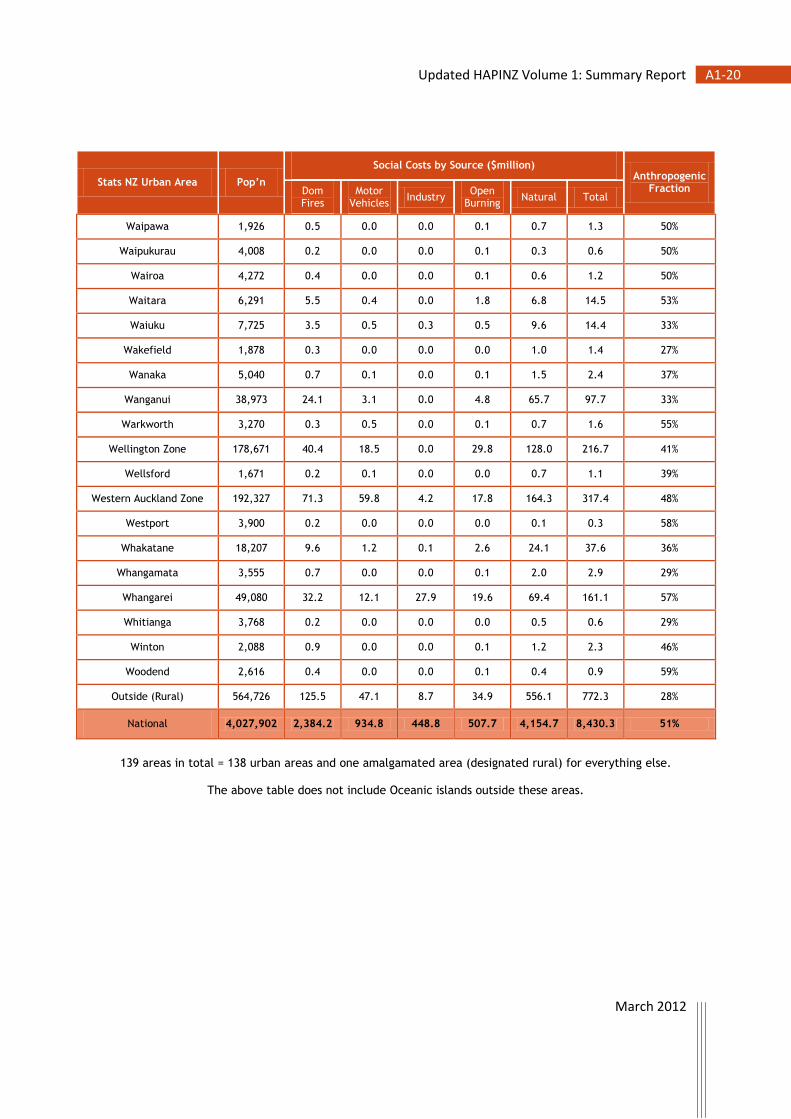
March 2012
A1-20 Updated HAPINZ Volume 1: Summary Report
Stats NZ Urban Area Pop’n
Social Costs by Source ($million) Anthropogenic
Fraction Dom Fires
Motor Vehicles
Industry Open
Burning Natural Total
Waipawa 1,926 0.5 0.0 0.0 0.1 0.7 1.3 50%
Waipukurau 4,008 0.2 0.0 0.0 0.1 0.3 0.6 50%
Wairoa 4,272 0.4 0.0 0.0 0.1 0.6 1.2 50%
Waitara 6,291 5.5 0.4 0.0 1.8 6.8 14.5 53%
Waiuku 7,725 3.5 0.5 0.3 0.5 9.6 14.4 33%
Wakefield 1,878 0.3 0.0 0.0 0.0 1.0 1.4 27%
Wanaka 5,040 0.7 0.1 0.0 0.1 1.5 2.4 37%
Wanganui 38,973 24.1 3.1 0.0 4.8 65.7 97.7 33%
Warkworth 3,270 0.3 0.5 0.0 0.1 0.7 1.6 55%
Wellington Zone 178,671 40.4 18.5 0.0 29.8 128.0 216.7 41%
Wellsford 1,671 0.2 0.1 0.0 0.0 0.7 1.1 39%
Western Auckland Zone 192,327 71.3 59.8 4.2 17.8 164.3 317.4 48%
Westport 3,900 0.2 0.0 0.0 0.0 0.1 0.3 58%
Whakatane 18,207 9.6 1.2 0.1 2.6 24.1 37.6 36%
Whangamata 3,555 0.7 0.0 0.0 0.1 2.0 2.9 29%
Whangarei 49,080 32.2 12.1 27.9 19.6 69.4 161.1 57%
Whitianga 3,768 0.2 0.0 0.0 0.0 0.5 0.6 29%
Winton 2,088 0.9 0.0 0.0 0.1 1.2 2.3 46%
Woodend 2,616 0.4 0.0 0.0 0.1 0.4 0.9 59%
Outside (Rural) 564,726 125.5 47.1 8.7 34.9 556.1 772.3 28%
National 4,027,902 2,384.2 934.8 448.8 507.7 4,154.7 8,430.3 51%
139 areas in total = 138 urban areas and one amalgamated area (designated rural) for everything else.
The above table does not include Oceanic islands outside these areas.

March 2012
A2-1 Updated HAPINZ Volume 1: Summary Report
Appendix 2: Sensitivity Analyses
A2.1 Effect of HiVol Corrections
Table A2-1a: Effect of low (0.85) HiVol correction factor
Health Effect
Cases by Source Social Costs
($million) Domestic Fires
Motor Vehicles
Industry Open
Burning Natural Total
Premature Mortality (adults) 564 220 107 119 979 1,989 7,082
Premature Mortality (babies) 1.9 0.8 0.3 0.5 4.0 8 27
Cardiac Admissions (all) 111.4 43.3 18.0 24.9 184.3 382 2
Respiratory Admissions (all) 172.7 77.7 28.6 40.3 303.3 623 3
Restricted Activity Days (all) 694,940 299,490 109,530 159,550 1,223,980 2,487,500 154
Total Social Costs ($million) 7,268
Note: This scenario sets the PM correction factor to 0.85 for all CAUs which will
significantly under-estimate the total health effects. In reality, the correction factor only applies to those CAUs which are not already HiVol equivalent.
Table A2-1b: Effects of high (1.15) HiVol correction factor
Health Effect
Cases by Source Social Costs
($million) Domestic Fires
Motor Vehicles
Industry Open
Burning Natural Total
Premature Mortality (adults) 739 289 140 157 1,290 2,615 9,309
Premature Mortality (babies) 2.5 1.1 0.3 0.7 5.4 10 36
Cardiac Admissions (all) 150.2 58.4 24.3 33.6 248.6 515 3
Respiratory Admissions (all) 232.5 104.6 38.5 54.4 408.5 838 4
Restricted Activity Days (all) 940,220 405,190 148,180 215,870 1,655,970 3,365,440 209
Total Social Costs ($million) 9,561
Note: This scenario sets the PM correction factor to 1.15 for all CAUs which will
significantly over-estimate the total health effects. In reality, the correction factor only applies to those CAUs which are not already HiVol equivalent.

March 2012
A2-2 Updated HAPINZ Volume 1: Summary Report
A2.2 Effect of Exposure-Response Values
Table A2-2a: Effect of low exposure-response values
Health Effect
Cases by Source Social Costs
($million) Domestic Fires
Motor Vehicles
Industry Open
Burning Natural Total
Premature Mortality (adults) 297 116 57 63 514 1,046 3,724
Premature Mortality (babies) 0.9 0.4 0.1 0.2 2.0 4 13
Cardiac Admissions (all) 65.7 25.6 10.6 14.7 108.7 225 1
Respiratory Admissions (all) 122.4 55.0 20.3 28.6 214.8 441 2
Restricted Activity Days (all) 454,210 195,750 71,590 104,280 799,990 1,625,820 101
Total Social Costs ($million) 3,841
Note: This scenario uses the lower bounds or confidence intervals
for all of the exposure-response functions
Table A2-2b: Effect of high exposure-response values
Health Effect
Cases by Source Social Costs
($million) Domestic Fires
Motor Vehicles
Industry Open
Burning Natural Total
Premature Mortality (adults) 893 350 168 191 1,563 3,165 11,268
Premature Mortality (babies) 3.4 1.5 0.5 0.9 7.2 13 48
Cardiac Admissions (all) 195.3 75.9 31.5 43.7 323.3 670 4
Respiratory Admissions (all) 340.7 153.3 56.3 79.7 599.1 1,229 6
Restricted Activity Days (all) 1,544,320 665,540 243,400 354,570 2,719,960 5,527,770 343
Total Social Costs ($million) 11,669
Note: This scenario uses the upper bounds or confidence intervals
for all of the exposure-response functions

March 2012
A2-3 Updated HAPINZ Volume 1: Summary Report
A2.3 Cross-check of Mortality Effects using PM2.5
Table A2-3a: Cross check of adult mortality based on PM2.5 assuming 0.4
Health Effect
Cases by Source Social Costs
($million) Domestic Fires
Motor Vehicles
Industry Open
Burning Natural Total
Premature Mortality (adults) 353 138 67 75 611 1,244 4,430
Note: This scenario increases the response function for premature mortality to 0.09
and corrects the PM10 concentrations by 0.4 to reflect the proportion of PM2.5 typical for rural areas which will be a potential under-estimate of total effects.
Note also: The splits shown will not be accurate as the proportions of PM2.5 in natural versus anthropogenic sources vary greatly.
Table A2-3b: Cross check of adult mortality based on PM2.5 assuming 0.6
Health Effect
Cases by Source Social Costs
($million) Domestic Fires
Motor Vehicles
Industry Open
Burning Natural Total
Premature Mortality (adults) 516 202 98 109 895 1,819 6,477
Note: This scenario increases the response function for premature mortality to 0.09
and corrects the PM10 concentrations by 0.6 to reflect the proportion of PM2.5 typical for urban areas which will be a potential over-estimate of total effects.
Note also: The splits shown will not be accurate as the proportions of PM2.5 in natural versus anthropogenic sources vary greatly.

March 2012
A2-4 Updated HAPINZ Volume 1: Summary Report
A2.4 Effect of Cost Estimates
Table A2-4a: Effect of low cost estimates
New Zealand
Social Costs ($million) Anthropogenic
Fraction Domestic Fires
Motor Vehicles
Industry Open
Burning Natural Total
Premature Mortality (adults) 2,324 909 440 494 4,046 8,211 51%
Premature Mortality (babies) 8 3 1 2 17 31 46%
Cardiac Admissions (all) 1 0 0 0 1 3 52%
Respiratory Admissions (all) 1 0 0 0 2 3 51%
Restricted Activity Days (all) 28 12 4 6 49 100 51%
Total 2,362 924 445 502 4,115 8,348 51%
Note: This scenario uses the lower bounds or confidence intervals for all of the cost estimates
and is likely to be an under-estimate of the total costs because loss of life quality due to prolonged pain and suffering is not included.
Table A2-4b: Effect of high cost estimates
New Zealand
Social Costs ($million) Anthropogenic
Fraction Domestic Fires
Motor Vehicles
Industry Open
Burning Natural Total
Premature Mortality (adults) 4,648 1,818 879 987 8,092 16,423 51%
Premature Mortality (babies) 16 7 2 4 34 63 46%
Cardiac Admissions (all) 47 18 8 10 77 160 52%
Respiratory Admissions (all) 72 33 12 17 127 260 51%
Restricted Activity Days (all) 71 31 11 16 125 255 51%
Total 4,854 1,907 912 1,034 8,455 17,161 51%
Note: This scenario uses the upper bounds or confidence intervals for all of the cost estimates
and does include loss of life quality due to prolonged pain and suffering.

March 2012
A2-5 Updated HAPINZ Volume 1: Summary Report
A2.5 Estimate of 2001 Air Pollution Health Impacts
Table A2-5: Estimate of total air pollution health impacts for New Zealand in 2001 using the update methodology
Health Effect
Cases by Source Social Costs
($million) Domestic Fires
Motor Vehicles
Industry Open
Burning Natural Total
Premature Mortality (adults) 611 267 113 128 1,054 2,173 7,737
Premature Mortality (babies) 2.3 1.0 0.4 0.5 4.0 8.3 30
Cardiac Admissions (all) 119.1 52.1 22.0 25.0 205.3 423.3 3
Respiratory Admissions (all) 193.8 84.8 35.9 40.7 334.4 689.5 3
Restricted Activity Days (all) 836,320 343,940 154,760 175,600 1,443,470 2,976,220 185
Total Social Costs ($million) 7,958
Note: This scenario is based on the actual change in population and the estimated change in emissions for
domestic fires and motor vehicles (industry, open burning and natural are assumed to be the same) going from 2006 to 2001.
Based on the census data, the population is multiplied by 0.928 relative to 2006.
Based on the number of households and the proportion using wood,
domestic fires emissions are assumed to increase by 1.011 relative to 2006. Based on the total fleet travel and the average fleet emission factors,
motor vehicle emissions are assumed to increase by 1.123 relative to 2006. With the other emissions kept the same, total PM10 emissions are therefore assumed
to increase by 1.017 relative to 2006.
This results in estimated splits for 2001 of 28.1% domestic fires, 12.3% motor vehicles, 5.2% industry, 5.9% open burning, and 48.5% natural as shown above.

March 2012
A3-1 Updated HAPINZ Volume 1: Summary Report
Appendix 3: Users’ Guide to the Health Effects Model
The Health Effects Model consists of the following worksheets:
About This Model
1 Introduction
2 Base case Input
3 Scenario Input
4 Base case Output
5 Scenario Output
6 Comparison
7 Base case Results
8 Scenario Results
9 All Base Data
Report Tables – Base case
Maps
About This Model
The Health Effects Model opens with an ‘About This Model’ page. This page lists the organisations who commissioned and funded the project, those who assisted in providing the base data, and the project team members who developed the model.
Click on the ‘Next’ button to proceed to the Introduction page.
1 Introduction
The Introduction page provides a brief background and outline of the structure of the model and allows users to select whether to run base case analysis or select a scenario by requesting a response to:
Select ‘Run Base case’ to view the base case inputs (this proceeds to 2 Base case Input) and then run the model or ‘Run a Scenario’ to select user-defined inputs and then run the model (proceeds to 3 Scenario Input).
Select ‘Run a Scenario’ to enter user defined input values.
Select ‘Run Base case’ to view Base case default input values.

March 2012
A3-2 Updated HAPINZ Volume 1: Summary Report
2 Base case Input
All base case input values used to run a base case analysis are displayed and input values cannot be changed by the user. An error message is displayed if a value is entered on this page.
Input values for PM10 and population are multipliers but are set to a default value of 1.00 for the base case analysis (as the base case analysis is for the set year of 2006 with set PM10 data).
Click on ‘Run Base case’ to run the model. When the run is complete, the model will go to 4 Base case Output and display the results.
3 Scenario Input
In this sheet, a user can define the input values to run their own scenarios. For example, this function could be used by Councils to assess the likely change in health costs resulting from emission reduction scenarios24.
As with the Base case Input, input values for PM10 and population are multipliers and the user can set different values for the scenario. For example, if a PM10 value of 1.20 is set, this will increase the PM10 concentrations by 20 per cent. Similarly, if a high population scenario is to be assessed, the user can set a value of 2.00 for population which will double the 2006 base population.
Click on ‘Run Scenario’ to run the model. When the run is complete, the model will go to 5 Scenario Output and display the results.
4 Base case Output
This sheet displays the summary base case output table. The default results presented are the national results. Results can be selected by region, TLA, airshed or urban area (as defined by Stats NZ).
24 It is important to note that the Health Effects Model is based on annual average PM10 concentrations. The
model does not directly allow users to estimate the effect of changes in 24 hour average concentrations (e.g., to meet the requirements of the National Environmental Standard for PM10). However, this could be undertaken in locations where the relationship between peak 24 hour average concentrations and annual average concentration has been estimated.

March 2012
A3-3 Updated HAPINZ Volume 1: Summary Report
To select by specific area, click in the desired box and select area from the drop down menu. Note: a dropdown menu does not appear automatically. The cell must be selected first.
A dependent selection is not available in this model, so only one area type can be selected at a time. For example, if the user has viewed results for the Auckland Urban airshed, and wants to view results for the Auckland region, the airshed field must be cleared (set to blank).
The blank option for each area selection is the first option in the drop down menu (the text ‘blank’ does not actually appear).
Options are also provided to view detailed base case results by specific source as indicated above.
Note: Some airsheds have been combined together due to the size of the underlying census area unit (CAU) with two exceptions:
Te Awamutu & Kihikihi –is actually one airshed in reality
Dunedin – is not an airshed but is named as such in this model and includes the actual airsheds of North Dunedin, Central Dunedin, South Dunedin, Green Island and Port Chalmers.
Select cell to view drop down
arrow & menu.
Drop down menu does not appear
automatically.
Set to ‘blank’ if Auckland region results desired else results displayed will be by the airshed.
Select by source.

March 2012
A3-4 Updated HAPINZ Volume 1: Summary Report
5 Scenario Output
This sheet displays the summary scenario output table. Functionality and conditions are the same as those presented in 4 Base case Output.
If no scenario is selected, then the base case results are presented by default.
6 Comparison
This sheet presents both the summary base case and scenario output tables on the same page for comparison. Results displayed here are the same as those displayed in 4 Base case Output and 5 Scenario Output.
Note: To compare results the user must ensure that the areas selected in the Base case Output table and the Scenario Output table are the same.
7 Base case Results
This sheet presents the results and calculations performed in the model for the base case analysis by CAU. Health effects and costs are also broken down by source contribution on this page.
Note: Results are presented by CAU but the detail shown (e.g., decimal places) implies a level of accuracy which is not necessarily justifiable and therefore must be treated with caution. Data are imported from the Exposure Model, which uses ambient monitoring, source apportionment studies and emission inventories to estimate PM10 concentrations by source by CAU. The exposure data are then multiplied by population information, exposure-response functions and costs estimates in the Health Effects Model to determine air pollution health impacts by source by CAU.
Results can be filtered by region, TLA, airshed or urban centre to view the each CAU’s result for the selection. A ‘filtered total’ and ‘national total’ summary is provided at the bottom of the sheet to compare summary results between the selection and national results.
8 Scenario Results
This sheet presents the results and calculations performed in the model for the scenario analysis. Health effects and costs are also broken down by source contribution on this page as per the 7 Base case Results.
Note: Results are presented by CAU and the same caution as with 7 Base case Results applies.
Note: Results can be filtered using the same parameters as indicated in 7 Base case Results.

March 2012
A3-5 Updated HAPINZ Volume 1: Summary Report
9 All Base Data
All base data used for all calculations are presented on this page.
Population data obtained from Census 2006, Statistics New Zealand.
Health data and base incidence rates are the three year average of data provided by Ministry of Health.
PM10 concentrations are from the Exposure Model
Note: Statistics New Zealand do not supply data for CAUs where confidentiality may be breached. Data for these CAUs are represented with a ‘..C’. For the purposes of the model calculations, when this occurs, the data are assumed to be zero.
Note: For the premature mortality cases related to babies, information on the total cases is only available as a national total. To get estimates by CAU, the national total has been pro-rated by the number of babies in each CAU over the total number of babies nationally. These numbers have been multiplied by the population weighted annual average concentrations but only for the 0-1 year population.
Report Tables - Base case
This page contains all the tables for the base case presented in the Updated Health and Air Pollution in New Zealand Study Volume 1 - Summary Report. These tables are only provided as a reference and cannot be changed.
Maps
The following section outlines the steps required to create a map using the data from the Health Effects Model (from sheets ‘7 Base case Results’ and ‘8 Scenario Results’).
1. Obtain the spatial file of the 2006 Census from Statistics New Zealand, or from your organisation’s GIS team.
Prepare the Excel table
1. Tidy up data in sheets ‘7 Base case Results’ or ‘8 Scenario Results’ from the Health Effects Model by deleting all the extra information from the table that is not required.
Tip: Copy and paste into a new Excel workbook the Base case or Scenario Output sheets. Ensure to paste special as ‘values’ in the new workbook so that none of the original data is lost and the formulas are not embedded into this sheet.
2. Remove any blank rows or columns, including any between the heading and data.
3. Ensure each column has a heading. This will correspond as the field name in GIS. Headings cannot have spaces, cannot start with a number and must be 10 characters or less.

March 2012
A3-6 Updated HAPINZ Volume 1: Summary Report
4. Do NOT delete the Census Area Unit Code (2006 Areas) column. These numbers will be needed to match the data in the Excel file with the GIS spatial file. Sort the numbers in ascending order.
5. Remove all formatting in the table and save the file (.xls or .xlsx).
Adding the Excel Table to ArcMap
1. In ArcMap, click the Add Data button, browse to the location of the Excel file and double click the name.
2. Choose the data sheet to add (usually the first sheet on the list) and click Add.
3. Open the attribute table for both the Excel file and the 2006 Census spatial layer.
4. Check that the CAU number column in the data table matches the content a column in the spatial layer. The heading names do not need to match, but the content in each column does need to match. The data in the table will be joined using this common column.
Join the Excel Table to the Spatial Layer
1. Right-click on the 2006 Census spatial data.
2. From the menu, in Joins and Relates, click Join.
3. The Join Data dialog box appears.
4. At ‘What do you want to join to this layer?’ Select Join attributes from a table from the drop down menu.
5. Select the following at:
‘1. Choose the field this layer that the join will be based on:’
Select the field name of the data in the 2006 Census spatial layer that matches the data in the Excel table.
‘2. Choose the table to join to this layer, or load the table from disk:’
Select the sheet of the Excel file (usually Sheet 1 which will appear as Sheet1$)
‘3. Choose the field in the table to base the join on:’
Select the column name from the Excel table which matches that of the 2006 Census spatial layer.
6. Under Join Options, select the Keep all records option.
Verify that the Join worked
1. Right click the 2006 Census spatial data.
2. Click Open Attribute Table
3. Scroll to the right of the attribute table to check if the columns from the Excel file have been added.
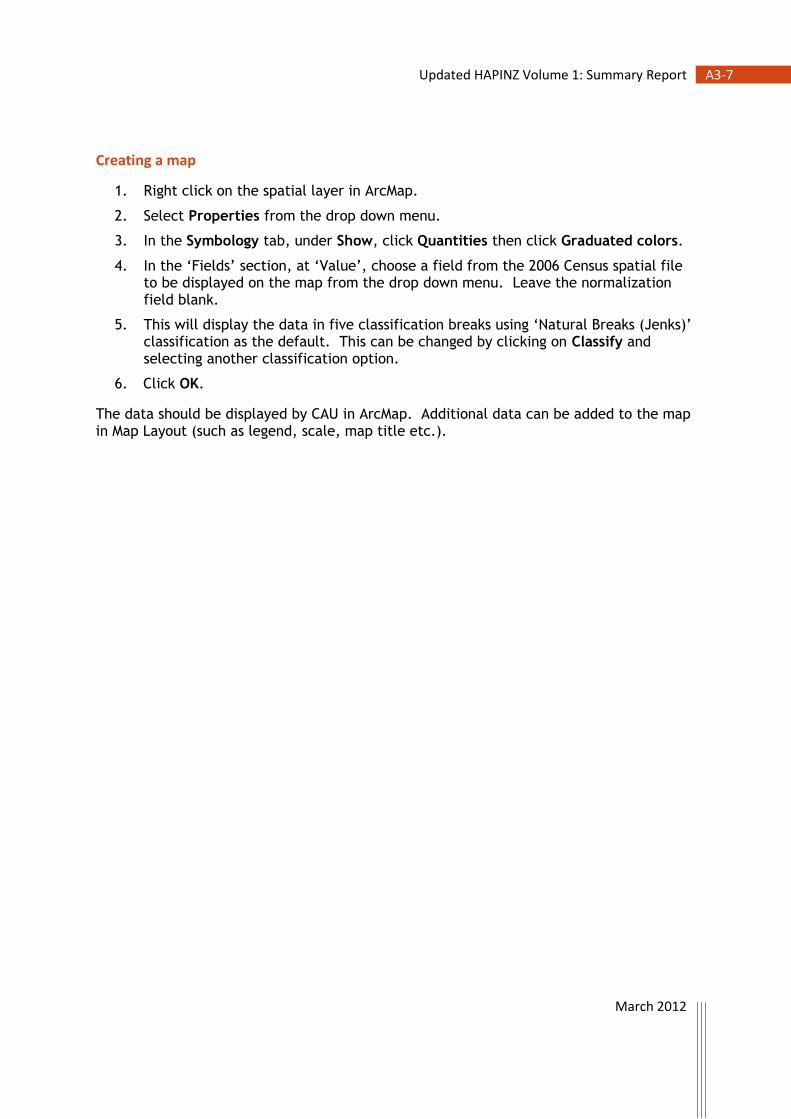
March 2012
A3-7 Updated HAPINZ Volume 1: Summary Report
Creating a map
1. Right click on the spatial layer in ArcMap.
2. Select Properties from the drop down menu.
3. In the Symbology tab, under Show, click Quantities then click Graduated colors.
4. In the ‘Fields’ section, at ‘Value’, choose a field from the 2006 Census spatial file to be displayed on the map from the drop down menu. Leave the normalization field blank.
5. This will display the data in five classification breaks using ‘Natural Breaks (Jenks)’ classification as the default. This can be changed by clicking on Classify and selecting another classification option.
6. Click OK.
The data should be displayed by CAU in ArcMap. Additional data can be added to the map in Map Layout (such as legend, scale, map title etc.).

March 2012
A3-8 Updated HAPINZ Volume 1: Summary Report
Range of Values for Sensitivity Analysis
A list of the range of values available to the user in the Scenario Input page, and those used in the Sensitivity Analysis are listed below.
Table A3-1: Default values and typical ranges for the parameters used
in the Health Effects Model
PM10 Data Default Value
Typical Range
1 Data as supplied by councils and corrected for HiVol equivalency 1.00 (0.85-1.15)
2 Population data as per 2006 Census 1.00 (1.00-1.00)
Health Outcomes Default Value
Typical Range
3 Premature mortality, all adults (30 yrs +) per 10 µg/m3 annual PM10 0.07 (0.03-0.10)
3a Premature mortality, Maori adults (30 yrs +) per 10 µg/m3 annual PM10
0.20 (0.07-0.33)
4 Premature mortality, all children (0-1 yrs) per 10 µg/m3 annual PM10 0.05 (0.02-0.08)
5 Cardiac hospital admissions, all ages per 10 µg/m3 daily PM10 0.006 (0.003-0.009)
6 Respiratory hospital admissions, all ages per 10 µg/m3 daily PM10 0.01 (0.006-0.017)
6a Respiratory hospital admissions, all children (1-4 yrs) per 10 µg/m3 daily PM10
0.02 (0.01-0.04)
6b Respiratory hospital admissions, all children (5-14 yrs) per 10 µg/m3 daily PM10
0.03 (0.00-0.05)
7 Restricted activity days, all ages per 10 µg/m3 daily PM2.5 0.9 (0.5-1.7)
Social Costs (in NZ$ as at June 2011) Default Value
Typical Range
8 Premature mortality, all adults (30 yrs +) per 10 µg/m3 annual PM10 $3.56M ($3.56M-$7.12M)
8a Premature mortality, Maori adults (30 yrs +) per 10 µg/m3 annual PM10
$3.56M ($3.56M-$7.12M)
9 Premature mortality, all children (0-1 yrs) per 10 µg/m3 annual PM10 $3.56M ($3.56M-$7.12M)
10 Cardiac hospital admissions, all ages per 10 µg/m3 daily PM10 $6,350 ($6,350-$356,000)
11 Respiratory hospital admissions, all ages per 10 µg/m3 daily PM10 $4,535 ($4,535-$356,000)
11a Respiratory hospital admissions, all children (1-4 yrs) per 10 µg/m3 daily PM10
$4,535 ($4,535-$356,000)
11b Respiratory hospital admissions, all children (5-14 yrs) per 10 µg/m3 daily PM10
$4,535 ($4,535-$356,000)
12 Restricted activity days, all ages per 10 µg/m3 daily PM2.5 $62 ($34-$87)