Update to the 2035 Transportation CIP and the Nexus Study ...
82
Update to the 2035 Transportation CIP and the Nexus Study for the Development Impact Fee Program Prepared for: CITY OF RANCHO CORDOVA Prepared by: DKS Associates December 2013
Transcript of Update to the 2035 Transportation CIP and the Nexus Study ...

Update to the 2035 Transportation CIP
and the Nexus Study for the Development Impact Fee Program
Prepared for:
CITY OF RANCHO CORDOVA Prepared by:
DKS Associates
December 2013
snobriga
Typewritten Text
ATTACHMENT 1
snobriga
Typewritten Text

1 December 2013
Table of Contents EXECUTIVE SUMMARY ............................................................................................ 2
1.0 INTRODUCTION .............................................................................................. 8
2.0 DEVELOPMENT FORECASTS ....................................................................... 9
3.0 TRANSPORTATION IMPROVEMENTS ........................................................ 10
3.1 ROADWAY SEGMENT CAPACITY NEEDS .............................................................................................. 10 3.2 ROADWAY SEGMENT NEEDS FOR TDIF PROGRAM .............................................................................. 12 3.3 INTERSECTION CAPACITY NEEDS ........................................................................................................ 12 3.4 INTERSECTION NEEDS FOR TDIF PROGRAM ........................................................................................ 23 3.5 EXISTING LOS DEFICIENCIES .............................................................................................................. 24 3.6 TRANSIT FACILITIES ............................................................................................................................ 25 3.7 BIKEWAYS AND WALKWAYS ............................................................................................................... 25
4.0 IMPROVEMENT COSTS ............................................................................... 26
4.1 ROADWAY IMPROVEMENTS ................................................................................................................. 26 4.2 TRANSIT IMPROVEMENTS .................................................................................................................... 26 4.3 BIKEWAY AND WALKWAY IMPROVEMENTS ........................................................................................ 27
5.0 BASIS FOR ALLOCATING IMPROVEMENT COSTS .................................. 28
5.1 ROADWAY CAPACITY IMPROVEMENTS ................................................................................................ 28 5.2 TRANSIT IMPROVEMENTS .................................................................................................................... 30 5.3 BIKEWAY AND WALKWAY IMPROVEMENTS ........................................................................................ 32 5.4 PROGRAM CONTINGENCY .................................................................................................................... 32 5.5 IMPROVEMENTS AND ELEMENTS NOT INCLUDED IN TDIF FEE PROGRAM ........................................... 33
6.0 METHODOLOGY FOR CALCULATING FEES ............................................. 36
6.1 DWELLING UNIT EQUIVALENTS ........................................................................................................... 36 6.2 FEES CALCULATION ............................................................................................................................ 37
7.0 TDIF NEXUS FINDINGS ................................................................................ 38
7.1 PURPOSE OF FEES ................................................................................................................................ 38 7.2 USE OF FEES ........................................................................................................................................ 39 7.3 RELATIONSHIP BETWEEN USE OF FEES AND TYPE OF DEVELOPMENT .................................................. 39 7.4 RELATIONSHIP BETWEEN NEED FOR FACILITY AND TYPE OF DEVELOPMENT ...................................... 39 7.5 RELATIONSHIP BETWEEN AMOUNT OF FEES AND COST ATTRIBUTED TO DEVELOPMENT .................... 39
8.0 ON-GOING ADMINISTRATION OF THE TDIF PROGRAM .......................... 41
8.1 ADMINISTRATION FEE ......................................................................................................................... 41 8.2 TDIF ADJUSTMENTS ............................................................................................................................ 41 8.3 TDIF CREDITS AND REIMBURSEMENTS ................................................................................................... 42 8.4 TDIF EXEMPTIONS .................................................................................................................................. 42 8.5 FEE IMPLEMENTATION ............................................................................................................................. 43
Appendix A: Land Use and Development Assumptions
Appendix B: Detailed Cost Allocation for Roadway and Intersection Improvements
Appendix C: Improvement Cost Estimation Methodology

2 December 2013
Executive Summary
The City of Rancho Cordova’s Capital Improvement Program (CIP) identifies major roadway, transit, bicycle and pedestrian facilities that are needed to accommodate projected travel demand through 2035. Between 2007 and 2035, housing units and employment in the City were projected to grow by 204 percent and 95 percent, respectively. The CIP is intended to identify infrastructure projects that will serve existing community needs, and future needs associated with development.
The City has various methods for financing the transportation improvements in the CIP. One of the key methods is the Transportation Development Impact Fee (TDIF) Program. The intent of the fee program is to provide an equitable means of ensuring that future development contributes their fair share of transportation improvements so that the City’s quality of life can be maintained.
When the City incorporated in July 2003, the City inherited fee programs established by Sacramento County. In 2005, the City established the costs of the roadways in the City’s General Plan and prepared a Nexus Study that resulted in implementation of the City’s first transportation impact fee program which replaced the outdated County roadway fee.
In 2012 the City determined that an update to the TDIF Program was necessary and a new Nexus Study with updated fee rates was prepared in December 2012. The updated TDIF Program was then approved by the City Council in January 2013.
Over the last year, the City has had additional discussions with representatives of the building industry who are concerned about the magnitude of current fee rates. The City first explored a shorter horizon for the fee program as well as potential changes in the methodologies used to allocate costs and calculate fees. After an analysis of those strategies, the City determined that modifications to the horizon or to methodologies were not warranted. However, during 2013, the City has conducted a thorough review of 1) the definition of the improvement projects and 2) the estimated costs of the improvements. That effort has resulted in a modest reductions in the cost per DUE and fee rates from those approved in January 2013. It has also given City staff confidence that the updated project definitions and cost estimates are sound.
The TDIF Program does not include funding for post-2035 transportation improvements and for some of the improvements in the CIP. The transportation elements and the costs that are included and excluded from the TDIF Program are shown in Figure 1 and Table 1, and can be summarized as follows:
The ultimate transportation improvements needed to accommodate full build out of the General Plan is projected to cost $2 billion.
The needs analysis determined that about $341 million of roadway, transit and bikeway improvements may not be required until after 2035.

Figure 1
Project Costs Allocated to New Development
Ultimate General Plan Improvements
2.02 Billion
CIP Improvements
1.67 Billion
TDIF Improvements
1.42 Billion
New Development
$906 Million
Post ‐ 2035 Improvements
341 Million
CIP Improvements Not Included in
TDIF
256 million
City Share of Improvements
in TDIF
512 Million
Not Included in Fee Program
$1.11 Billion

4 December 2013
Table 1 Summary of Costs in CIP and TDIF Program Costs Ultimate General Plan Improvements Roadways, Intersections, Interchanges and Signal System $1,354,728,000
Transit $366,496,000
Bikeways $115,622,000
Pedestrian Facilities and ADA Implementation $20,500,000
Pavement Maintenance $80,495,000
Project Contingency $77,514,000
Total $2,015,355,000
Post-2035 Improvements Roadways, Intersections, Interchanges and Signal System $119,631,000 Transit $186,300,000 Bikeways $22,250,000 Project Contingency $13,127,000
Total $341,308,000 CIP Improvements Roadways, Intersections, Interchanges and Signal System $1,235,373,000
Transit $180,196,000
Bikeways $93,372,000
Pedestrian Facilities and ADA Implementation $20,500,000
Pavement Maintenance $80,495,000
Project Contingency $64,397,000
Total $1,674,333,000
CIP Improvements not included in TDIF Program Roadway Improvements Needed to Accommodate Growth in Thru Trips $12,514,000
Non-Capacity Roadway Improvements $118,686,000
Pavement Maintenance $80,495,000
Bikeways $14,370,000
Pedestrian Facilities and ADA Implementation $20,500,000
Project Contingency $9,863,000 Total $256,428,000
TDIF Program Improvements Roadways, Intersections, Interchanges and Signal System $1,104,173,000
Transit $180,196,000
Bikeways $79,002,000
Project Contingency $54,535,000
Total $1,417,906,000
Source: DKS Associates, 2013

5 December 2013
The CIP analysis determined that about $1.24 billion in roadways, intersections, interchanges and signal system improvements would be required to meet the City’s level of service policy under 2035 travel demand levels
The roadway and intersection improvements included in the TDIF Program were identified to meet the City’s level of service policy under 2035 travel demand levels after “thru trips” (those with neither trip end within the City) were subtracted from the traffic demand. The TDIF Program excluded about $12.5 million in roadway improvements that were determined to accommodate the growth in thru trips.
The TDIF Program also does not include about $220 million in “non-capacity” roadway improvements (such as streetscape improvements), pavement maintenance and pedestrian ADA implementation.
A four percent program contingency has been applied to the total CIP costs and the costs allocated to the TDIF Program. The program contingency is intended to cover project scope changes, alternative nexus-based projects, unforeseen and unbudgeted construction expenses, and other project related expenses.
The City will need to secure funding for those projects excluded from the TDIF Program as well as for its share of existing deficiencies and for “existing development’s” share of transit, pedestrian and walkway improvements. The City has also decided to reduce the developer-funded portion of the following major improvements:
While new development’s fair share of improvements to Sunrise Boulevard north of US 50 (the “Sunrise Complex” described in Section 3.3) was estimated at 44 percent (about $131.5 million), the City has decided to allocate $50 million, which is the equivalent amount that Sacramento County has included in their fee program. The City will work with Sacramento County and SACOG to fund the remaining costs for this regional facility. The revised allocation reduces new development’s share of the Sunrise improvements by about $81.5 million.
The analysis indicates the need for left-turn grade separations at both the Sunrise Boulevard/Douglas Road intersection and the Sunrise Boulevard/International Drive intersection, plus a full urban interchange at the Sunrise Boulevard/White Rock Road intersection. The City has decided to reduce new development’s share of funding for these three intersections to an equivalent cost of at-grade improvements. The revised allocation reduces new development’s share of intersection improvements by about $56.5 million.
The City General Plan downgraded Folsom Boulevard from 6-lanes to a 4-lane arterial. To minimize the impact and improve levels of service, the General Plan identifies aggressive operational improvements on Folsom Boulevard. The CIP includes light rail transit grade separations at four locations along Folsom Boulevard. These grade separations would not benefit light rail trains, since crossing gates allow trains to travel across those roadways without delay, but would mitigate traffic congestion along Folsom Boulevard. While new development could be charged for

6 December 2013
nearly all of the $87.5 million cost for those intersection improvements, the City has decided to reduce new development’s share to 50 percent of the total cost, thereby reducing new development’s share of the improvements by about $43.7 million.
To reduce the developer-funded portion of these key projects, the City needs to secure an additional $182 million in outside funding.
Table 2 shows that of the total $1.42 billion in transportation improvements that are included in the TDIF Program, the City’s obligation would be about $512 million while about $906 million was allocated to new development in TDIF Program.
Fees are differentiated by the type of development and relative demands on the transportation system. In the allocation of costs, each development type is assigned a “dwelling unit equivalent” or “DUE” rate. DUE’s measure how the trip-making characteristics of a land use type compares to a single-family residential unit. The “cost per DUE” is the development fee for a single family home and fees for other land uses are calculated using DUE ratios.
Table 2 Allocation of Costs of TDIF Program Improvements
Transportation Element
Cost Allocation
City Obligation
New Development Total
Roadways, Intersections, Interchanges and Signal System
$360,132,202 $744,041,370 $1,104,173,572
Transit $95,686,400 $84,509,600 $180,196,000Bikeways $36,747,200 $42,254,800 $79,002,000Project Contingency $19,702,632 $34,832,231 $54,534,863Total $512,268,434 $905,638,000 $1,417,906,435
Source: DKS Associates, 2012
Table 3 summarizes the elements and costs that are funded by the TDIF Program and the estimated “cost per DUE”.
The estimated cost per DUE is based on conceptual definitions and preliminary engineering of the improvement projects and then planning-level cost estimates. The cost estimates were originally prepared in 2004/2005 and then refined/updated in 2012 for the TDIF Program adopted in January 2013. For this update of the TDIF, the descriptions of the improvement projects were reviewed and refined as necessary and costs have again updated to reflect the most current unit cost data available.

7 December 2013
Table 3
Estimated Cost per DUE – TDIF Program Update
Elements of TDIF Program Cost Allocated to New
Development in TDIF Program
Roadways, Intersections, Interchanges and Signal System $744,041,370
Transit $84,509,600
Bikeways $42,254,800
Project Contingencies $34,832,231
Total $905,638,000
Fees Collected by City from July 2003 to January 2007 $33,143,248 Total Remaining Costs Funded by TDIF $872,494,752
Total Growth in DUEs 60,364 Cost per DUE $14,454
Administrative Cost (3.75%) per DUE $542
Total Fee per DUE $14,996 Source: DKS Associates, 2012

8 December 2013
1.0 Introduction The City of Rancho Cordova’s Capital Improvement Program (CIP) includes the improvements to the City’s major roadway, transit, bicycle and pedestrian facilities that are needed to accommodate projected 2035 travel demand. The City has various methods for financing the transportation improvements in the CIP. One of the key methods is the Transportation Development Impact Fee (TDIF) Program.
The TDIF Program collects funds from new development in the City to finance the portion of the transportation improvements that result from the travel demand generated by new development in the City through 2035. Fees are differentiated by the type of development in relationship to their relative impacts on the transportation system. The intent of the fee program is to provide an equitable means of ensuring that future development contributes their fair share of transportation improvements so that the City’s General Plan Circulation policies and quality of life can be maintained.
When the City incorporated in July 2003, the City inherited fee programs established by Sacramento County. In 2005, the City established the costs of the roadways in the City’s General Plan and prepared a Nexus Study that resulted in implementation of the City’s first transportation impact fee program which replaced the outdated County roadway fee.
In 2012 the City determined that an update to the TDIF Program was necessary for the following reasons:
Since 2005, the City had been preparing Master Plans that identify the transit, bicycle, and pedestrian infrastructure improvements that are necessary to meet the goals of the General Plan and long-range travel demands in the City. The latest projects and costs identified in those efforts were used in updated fee estimates.
In February 2007, the City Planning Department released new long-range (2035) development forecasts for the City. Those development forecasts were used to conduct a long-range roadway needs analysis.
The City re-evaluated the definitions and cost estimates for a number of improvement projects that were originally prepared in 2004/2005.
The City made some adjustments to the methods used to determine how much of the CIP cost should be allocated to new development, including the removal of “thru” vehicle trips to identify the capacity need that need development would help fund.
A Nexus Study with updated fee rates was prepared in December 2012 and an updated TDIF Program was then approved by the City Council in January 2013.
Over the past year, the City has worked with representatives of the building industry to explore a shorter horizon for the TDIF Program as well as potential changes in the methodologies used to allocate costs and calculate fees. After technical work was performed and analysis of these strategies was evaluated, it was jointly determined by City staff and developer representatives that the efforts did not achieve desired objectives, including a reduction in the fees. Because of the uncertainty of where development would occur, there

9 December 2013
was also no certainty to the development community that all projects necessary to support development would be included in the fee program without a significant increase in fees.
As a result, it was jointly determined that the fee program update should be restored back to the longer development horizon with a renewed focus on project scoping and costs. The City retained Wood Rodgers to update the roadway and intersection cost estimates with current 2013 construction costs for use in this fee program update. Using the 2013 unit costs provided by Wood Rodgers, the City also conducted a thorough review of the definition of the improvement projects and applied the updated unit costs. That effort has resulted in a further reduction to the cost per DUE and the fee rates from those approved in January 2013.
This report documents the methodology and assumptions used to update the Nexus Study for the TDIF Program
2.0 Development Forecasts The transportation needs and fee allocation for this update of the TDIF Program are based on 2035 development forecasts prepared by the City’s Planning Department and released in February 2007. Appendix A describes the assumptions and methodology used to prepare those development forecasts. Table 4 shows the estimated housing and jobs in the City for 2007 (the Base Year for this update of the TDIF Program) and 2035 and the growth over that 28-year period. Between 2007 and 2035, housing units and employment in the City are expected to grow by 204 percent and 95 percent, respectfully.
For non-residential uses, fees are based on the square footage of a building while the travel demand model uses jobs to determine the trips generated by non-residential uses. Therefore, both the estimated number of jobs and building square footage by type is shown in Table 4.
Table 4 Summary of Development Forecasts
Land use Units 2007 2035 Growth
2007 to 2035 Residential Single-Family Detached Dwelling Unit 14,384 36,014 21,630 Single-Family Attached Dwelling Unit 3,757 22,516 18,759 Multi-Family Dwelling Unit 6,308 15,762 9,454
Total Dwelling Unit 24,449 74,292 49,843 Non-Residential
Retail jobs 7,603 12,225 4,622 Office jobs 34,703 77,321 42,618 Industrial jobs 7,541 7,904 363 Total jobs 49,847 97,450 47,603
Retail Square feet 3,801,000 6,112,000 2,311,000 Office Square feet 9,479,000 21,262,000 11,783,000 Industrial Square feet 6,636,000 7,351,000 716,000 Total Square feet 19,916,000 34,725,000 14,810,000
Source: City of Rancho Cordova Planning Department

10 December 2013
3.0 Transportation Improvements
The Circulation Element of the General Plan identifies the long-range transportation system that is needed to accommodate travel demand at full build out of the City. The ultimate General Plan transportation system is outlined in following exhibits in the Circulation Element:
The Roadway System and Sizing Map The Bikeway and Trails Map The Transit System Map
Over the last six years, the City has been evaluating the timing of the transportation improvements in the General Plan. That effort has resulted in the following:
Core Backbone Improvements – The City has identified a priority set of improvements that will be needed in the short-term to avoid substantial congestion levels on key roadways.
CIP – This report summarizes the transportation analyses that have defined the transportation improvements that are needed to accommodate projected growth by 2035, including the long-range roadway needs analysis and the findings from the City’s Master Plan efforts on the transit, bikeways, and pedestrian elements of the transportation system.
Post-2035 Improvements – This report also summarizes those portions of the ultimate General Plan transportation system that are not likely to be needed until after 2035.
Table 5 summarizes the elements and costs that are contained in the City’s ultimate General Plan transportation system and the Capital Improvement Program that is described in this report. This section describes the transportation analysis that determined the improvement projects that would be included in the CIP as well as those that would be funded in the TDIF Program.
3.1 Roadway Segment Capacity Needs
The roadway needs analysis started with the “Roadway System and Sizing” map in the General Plan that identifies the ultimate roadway needs at full build out of the City. The 2035 travel demand forecasts were prepared using SACOG’s regional travel demand model with more detailed traffic analysis zones (TAZs) and roadway and transit networks within the City and surrounding areas. An iterative analysis was conducted to test the need for each of the planned long-range improvements under the City’s latest 2035 development forecasts.
The roadway capacity needs analysis was guided by the level of service policy in the Circulation Element of the General Plan, which calls for maintaining LOS D conditions on all roadways and intersections unless maintaining this standard would, in the City's judgment, be infeasible and/or conflict with the achievement of other goals. The level of service analysis

11 December 2013
used in both the General Plan and CIP analyses is based on the volume to capacity (v/c) ratio on roadways and intersections.
Typically a roadway widening is required if the roadway segment has a projected v/c ratio of 0.9 or greater. However, the maximum number of lanes on a roadway segment would not exceed the number of lanes allowed in the General Plan “Roadway System and Sizing”, which limits the maximum number lanes on most arterial roadways to 6 lanes and limits Folsom Boulevard to 4 lanes. With those limits, the City recognizes that LOS D conditions may not be met on some portions of Sunrise Boulevard and Folsom Boulevard.
Table 5 Summary of Long-Range Transportation Needs
Transportation Element
Estimated Costs Ultimate
General Plan Improvements CIP
Roadway, Intersection and Interchange Improvements Roadway Segments $837,230,948 $780,136,838
Intersections $323,721,607 $261,461,476 Freeway Interchanges $140,000,000 $140,000,000 Signal System $53,775,000 $53,775,000 Pavement Maintenance $80,495,000 $80,495,000 Subtotal $1,435,222,555 $1,315,868,314
Transit, Bikeway and Pedestrian Facilities Transit $366,496,000 $180,196,000 Bikeways and Walkways $115,622,000 $93,372,000 Pedestrian ADA Improvements $20,500,000 $20,500,000 Subtotal $502,618,000 $294,068,000
Project Contingency (4%) $77,513,622 $64,937,453 Total $2,015,354,177 $1,674,333,766
Source: DKS Associates, 2012 The capacities by roadway type listed in the 2006 EIR for City of Rancho Cordova’s General Plan were used for the roadway segment needs analysis. Table 6 summarizes the roadway capacity improvements, forecasted average daily traffic (ADT), and level of service analysis. The roadway needs analysis indicates that about 74 miles of roadway would need to be widened, extended or created by 2035 to accommodate growth and meet the General Plan LOS policy.
Figure 2 shows the General Plan Roadway Sizing for each roadway segment in Table 6 while Figure 3 shows the CIP roadway sizing.

12 December 2013
3.2 Roadway Segment Needs for TDIF Program
The City needs to construct or widen roadways to accommodate future development. Much of the increase in traffic demand would result from growth within the City, but some of the growth in traffic would be from “thru” vehicle trips that have neither end of the trip within the City. To define the roadway and intersection improvements that would be included in the TDIF Program, the roadway segment analysis was performed a second time with the growth in “thru trips” removed. The revised roadway system needs analysis with thru trips removed is also summarized in Table 6.
For the purpose of the TDIF Program, if it was determined that the 2035 roadway improvement would still be needed with the growth in thru trips removed, then the TDIF Program would be required to pay for the entire 2035 improvement. However, if it was determined that a reduced roadway improvement would operate at acceptable levels, then the TDIF Program would only include the cost of the reduced improvement.
3.3 Intersection Capacity Needs
The analysis used to identify the required number of intersection turn lanes was based on Sacramento County’s Traffic Impact Guidelines (that were also used in recent EIRs for the City) and involves the Circular 212 methodology with the County’s “critical movement” capacities. The level of service analysis used in both the General Plan and CIP analyses is based on the volume to capacity (v/c) ratio on roadways and intersections. Typically an intersection improvement is required if the v/c ratio is 0.9 or greater without the improvement.
The number of through lanes at most intersections was determined by the required number of lanes on the adjacent roadway segments. When the number of lanes would change at an intersection, because roadway segments on either side of the intersection require a different number of lanes, then an intersection analysis was performed to determine the number of through lanes required at the intersection. New two-lane roads were assumed to have a single left and a single right turn lane at an intersection approach while new four and six lane roads were assumed to have a double left and a single right turn lane at an intersection approach. At intersections where the General Plan calls for urban interchanges to replace surface street intersections, an intersection analysis was performed to see if an interchange or a left-turn grade separation was required under 2035 traffic volumes.
Table 7 summarizes the 2035 intersection improvement needs and resulting levels of service. Figure 4 shows the location of each intersection in Table 7.
The City recognizes that future detailed analyses may indicate that either less or more turn lanes may be appropriate at some intersections but the CIP analysis provides a good foundation for the determination of the system-wide roadway improvement costs.
The General Plan and 2035 roadway needs analysis indicate the need for a series of capacity improvements along Zinfandel Drive and Sunrise Boulevard in the form of roadway widening, at-grade intersection improvements, and grade separations. Due to the close spacing of intersections along these two corridors, the TDIF combines these individual projects into groups referred to as “complexes”.

13 December 2013
Table 6 Summary of 2035 Roadway Improvement Needs Analysis
ID # Roadway
Segment Travel Lanes ADT LOS
From To 2005
General Plan
Roadway Sizing1
Revised 2035 Need
Revised Need 2035 Without Thru Trips
2005 2035 2035
Without Thru Trips
2005 2035 2035
Without Thru Trips
1
Rio Del Oro Pkwy
Sunrise Blvd Rancho Cordova Pkwy - 6 6 4 - 30,900 27,700 A C 2 Rancho Cordova Pkwy Centennial Dr - 4 2 2 - 3,300 3,300 A A 3 Centennial Dr Americanos Blvd - 4 2 2 - 4,400 4,400 A A 4 Americanos Blvd White Rock Rd - 4 2 2 - 10,100 10,100 A A 7 Easton Valley Pkwy Folsom Blvd - 2 2 2 - 1,800 1,700 A A 8
Villagio Dr
Douglas Rd Rancho Cordova Pkwy - 2 2 - 15,800 13,800 D C 9 Rancho Cordova Pkwy Centennial Dr - 2 2 - 10,300 8,400 A A 10 Centennial Dr Americanos Blvd. - 2 2 - 6,400 4,700 A A 11 Americanos Blvd White Rock Rd. - 2 2 - 7,700 5,800 A A 19 Easton Valley
Pkwy Rancho Cordova Pkwy Rio Del Oro - 6 6 6 - 48,800 43,700 E D
20 Rio Del Oro Hazel Avenue 6 48,800 43,700 E D 24.1
Centennial Dr
International Dr Rio Del Oro - 4 2 2 - 9,100 8,100 A A 24.2 Rio Del Oro Pkwy Villagio Dr - 4 2 2 - 8,600 7,600 A A 24.3 Villagio Dr Americanos Blvd - 4 2 2 - 11,000 9,700 B A 24.4 Americanos Blvd Grant Line - 4 2 2 - 12,000 9,200 B A 25
Americanos Blvd
Kiefer Blvd Chrysanthy Blvd. - 4 2 2 - 12,900 12,700 C C 26 Chrysanthy Blvd Douglas Rd - 4 2 2 - 5,500 5,300 A A 27 Douglas Rd Centennial Dr - 4 2 2 - 9,900 9,400 A A 28 Centennial Dr Villagio Dr - 4 2 2 - 10,100 8,400 A A 29 Villagio Dr Rio Del Oro - 4 2 2 - 12,900 11,300 C B 30 Rio Del Oro International Dr - 4 2 2 - 11,100 9,500 B A
39 Bradshaw Rd
Old Placerville US 50-Interchange 6 6 6 47,100 62,700 34,300 D F B
40 US 50-Interchange Folsom Blvd. 6 6 6 6 22,600 29,300 23,900 A A B
45 Chrysanthy Blvd
Sunrise Blvd Rancho Cordova Pkwy - 4 4 - 10,100 10,100 - A A 46 Rancho Cordova Pkwy Americanos Rd - 4 4 4 - 17,200 17,200 - A A 47 Americanos Rd Grant Line Rd - 4 2 2 - 10,800 10,800 - B B 52 Coloma Rd Folsom Blvd Sunrise Blvd 4 4 4 4 21,400 24,700 23,100 A B B
54.1
Douglas Rd
Eagles Nest Rd West City Limit 2 6 6 6 6,000 40,500 34,600 A C B 55 West City Limit Sunrise Blvd. 2 6 6 6 6,000 37,600 32,200 A B A 56 Sunrise Blvd Villagio Dr 2 6 6 6,000 35,000 32,000 A B B 57 Villagio Dr Rancho Cordova Pkwy 2 6 6 6 3,800 32,900 31,200 A B A 58 Rancho Cordova Pkwy Americanos Rd. 2 6 6 4 3,000 25,900 24,200 A A B 59 Americanos Rd Grant Line Rd. 2 6 4 4 2,300 19,300 17,300 A A A
73 Femoyer St Mather Blvd International Dr - 4 4 - 1,500 1,400 A A

14 December 2013
Table 6 Summary of 2035 Roadway Improvement Needs Analysis
ID # Roadway
Segment Travel Lanes ADT LOS
From To 2005
General Plan
Roadway Sizing1
Revised 2035 Need
Revised Need 2035 Without Thru Trips
2005 2035 2035
Without Thru Trips
2005 2035 2035
Without Thru Trips
79
Folsom Blvd
Bradshaw Rd Routier Rd 4 4 4 6 27,100 41,800 40,600 C F F 80 Routier Rd Mather Field Rd 4 4 4 6 30,000 41,400 39,600 D F E 81 Mather Field Rd Coloma Rd 4 4 4 6 33,500 34,100 32,000 E E D 82 Coloma Rd Zinfandel Dr 4 4 4 4 26,100 26,600 26,500 C C C 83 Zinfandel Dr Kilgore Rd 4 4 4 4 20,000 16,500 16,500 A A A 84 Kilgore Rd Sunrise Blvd 4 4 4 6 17,000 23,100 23,100 A B B 85 Sunrise Blvd Mercantile Dr 4 4 4 13,300 12,100 12,000 A A B
86 Mercantile Dr Rancho Cordova Pkwy 4 4 4 13,300 6,500 6,200 A A A
87 Rancho Cordova Pkwy Rio Del Oro 4 4 4 13,300 14,000 13,800 A A C
93
Grant Line Rd
Jackson Hwy Rancho Cordova Pkwy 2 6 6 4 7,600 34,600 21,900 A B B 94 Rancho Cordova Pkwy Kiefer Blvd. 2 6 6 4 7,600 32,000 19,100 A A A 95 Kiefer Blvd Chrysanthy Blvd 2 6 6 4 7,400 31,000 18,700 A A A 96 Chrysanthy Blvd Douglas Rd 2 6 6 4 9,600 39,100 26,400 A B B 97 Douglas Rd Centennial Dr 2 6 6 6 8,000 44,500 31,800 A D A 98 Centennial Dr City Limit 2 6 6 6 8,000 59,300 38,200 A F C
103 Old Placerville Rd
Bradshaw Rd Routier Rd 2 6 6 6 20,300 70,200 50,200 F F E
104 Routier Rd McCuen 4 6 6 6 13,100 67,200 48,900 A F E
105
International Dr
Old Placerville at McCuen
International at Airpark - 6 64 6 - 35,200 34,000 B B
106 McCuen / Airpark Zinfandel 4 6 6 8 12,000 51,100 48,600 A E E 109 Zinfandel Dr Kilgore Rd. 6 6 6 8 6,800 53,600 51,500 A E E 110 Kilgore Rd Sunrise Blvd. - 6 6 8 - 55,900 53,700 - F E 111 Sunrise Blvd Rancho Cordova Pkwy - 6 4 4 - 34,100 32,500 - A A 112 Rancho Cordova Pkwy Old International - 4 4 2 - 16,600 14,800 - A D 113 Centennial Dr Americanos Blvd - 4 4 2 - 12,100 11,200 - A B 114 Americanos Blvd White Rock Rd - 4 4 4 - 17,900 15,500 - A A
115 White Rock Rd From White Rock Rd. /
City Limit - 4 4 2 - 16,200 13,100 - A C
116 City limit Rancho Cordova Pkwy - 6 4 2 - 18,300 14,600 - A D 116 Rancho Cordova Pkwy Folsom South Canal - 2 2 2 - 13,400 12,500 - C B
116 Folsom South Canal Mercantile - 2 2 2 - 13,400 12,500 - C B
124 Jackson Hwy Sunrise Blvd Grant Line Rd. 2 6 4 4 15,400 24,700 15,900 D B A

15 December 2013
Table 6 Summary of 2035 Roadway Improvement Needs Analysis
ID # Roadway
Segment Travel Lanes ADT LOS
From To 2005
General Plan
Roadway Sizing1
Revised 2035 Need
Revised Need 2035 Without Thru Trips
2005 2035 2035
Without Thru Trips
2005 2035 2035
Without Thru Trips
126
Rancho Cordova Pkwy
Grant Line Rd Kiefer Blvd. - 4 2 2 - 2,500 2,400 - A A 127 Kiefer Blvd Chrysanthy Blvd. - 4 4 4 - 16,900 16,700 - A A 128 Chrysanthy Blvd Douglas Rd. - 6 4 4 - 28,700 28,500 - C C 129 Douglas Rd Villagio Dr - 6 4 4 - 17,400 17,200 - A A 130 Villagio Dr Rio Del Oro Pkwy - 6 4 4 - 16,900 16,700 - A A 131 Rio Del Oro Pkwy International Dr. - 6 6 6 - 37,900 34,500 - C B 132 International Dr White Rock Rd. - 6 6 4 - 32,400 29,200 - B D 133 White Rock Rd International Dr. - 6 6 6 - 46,400 42,900 - D C 134 International Dr Easton Valley Pkwy - 6 6 8 - 56,900 51,000 - F E 142
Kiefer Blvd Sunrise Blvd Rancho Cordova Pkwy - 4 2 - 8,800 8,600 - A A
143 Rancho Cordova Pkwy Americanos Rd. - 4 2 2 - 12,500 12,300 - B B 143 Americanos Blvd Grant Line Rd. - 4 2 2 - 11,600 11,200 - B B 144
Kilgore Rd International Dr White Rock Rd. 4 4 4 4 8,600 13,600 13,500 A A A
145 White Rock Rd Sun Center Dr. 2 2 2 4 8,300 11,100 11,100 A B B 146 Sun Center Dr Folsom Blvd. 2 2 2 2
147
Mather Blvd
McCuen (International) Whitehead (Mather Field
Rd.) 4 4 4 - 34,000 16,000 E A
148 Whitehead (Mather Field
Rd.) Femoyer St. 4 4 4 - 20,000 17,000 A A
149 Femoyer St Zinfandel Dr. 4 4 4 - 21,300 18,300 A A
151
Mather Field Rd
(Von Kaman /Whitehead) - Mather Blvd
McCuen 4 4 - 14,200 11,000 A B
152 Peter A. McCuen Blvd Rockingham Rd. 6 6 8 - 51,100 46,600 E D 153 Rockingham Rd US 50-Interchange 6 6 6 8 33,700 62,400 51,800 B F E 154 US 50-Interchange Folsom Blvd. 4 6 6 4 26,400 30,100 29,200 C A D
162 Rockingham Dr Mather Blvd. (Old
Placerville Rd.) Mather Field Rd. 4 4 4 - 19,700 13,400 A A
166 Routier Rd
Old Placerville Rd. (International Dr.)
Hwy. 50 2 4 2 2 - 9,400 9,000 A A
166 At Hwy 50 Routier Road at Hwy 50 2 4 2 2 - 8,700 8,400 A A 166 Hwy 50 Folsom 2 4 2 2 - 8,700 8,400 A A
173 Sun Center Dr Sunrise Blvd Folsom South Canal / City
Limit 2 2 2 2 - 12,800 12,800 C C
177 Sunrise Blvd
Jackson Hwy Kiefer Blvd. 2 6 6 6 16,500 42,700 38,800 E C C 178 Kiefer Blvd Chrysanthy Blvd. 2 6 6 6 18,000 40,100 35,700 F C B 179 Chrysanthy Blvd Douglas Rd. 2 6 6 6 20,000 46,000 41,700 F D C

16 December 2013
Table 6 Summary of 2035 Roadway Improvement Needs Analysis
ID # Roadway
Segment Travel Lanes ADT LOS
From To 2005
General Plan
Roadway Sizing1
Revised 2035 Need
Revised Need 2035 Without Thru Trips
2005 2035 2035
Without Thru Trips
2005 2035 2035
Without Thru Trips
180
Sunrise Blvd
Douglas Rd Rio Del Oro 4 6 6 8 25,500 53,600 46,800 C E D 181 Rio Del Oro Fitzgerald Rd. 4 6 6 6 25,500 42,900 39,300 C C C 182 Fitzgerald Rd International Dr. (Monier) 4 6 6 8 25,500 54,600 51,000 C F E
183 International Dr.
(Monier) White Rock Rd. 4 6 6 8 25,500 58,300 54,000 C F F
184 White Rock Rd Sun Center Dr. 6 6 6 6 37,200 44,200 39,800 B D C 185 Sun Center Dr Folsom Blvd. 6 6 6 10 57,400 70,300 65,600 F F F 186 Folsom Blvd US 50-Interchange 6 6 6 10 52,100 70,200 65,800 E F F 187 US 50-Interchange Zinfandel Dr. 6 6 6 14 80,000 106,500 95,400 F F F 188 Zinfandel Dr Coloma Rd. 6 6 6 12 82,400 100,700 89,800 F F F 189 Coloma Rd Gold Country Blvd. 6 6 6 12 80,300 100,300 89,900 F F F
190 Gold Country Blvd American River / Planning
Boundary 6 6 6 16 84,200 98,500 83,700 F F F
191
White Rock Rd
International Dr Capitol Center Drive. 2 4 4 4 14,000 37,000 36,900 C F F 192 Capitol Center Drive Zinfandel Dr. 2 4 4 4 14,000 30,500 30,400 C D D 193 Zinfandel Dr Kilgore Rd. 6 6 6 17,900 26,700 25,100 A A B 194 Kilgore Rd Sunrise Blvd. 6 6 6 6 25,400 36,000 34,000 A B B 195 Sunrise Blvd Luyung / City Limit 2 6 6 6 13,200 40,300 36,800 C C B 196 Luyung / City Limit Rancho Cordova Pkwy 2 6 6 6 8,800 42,500 39,700 A C C 197 Rancho Cordova Pkwy International 2 6 6 6,000 32,300 29,100 A A A 198 International Dr Rio Del Oro Pkwy 2 6 6 6,000 35,000 29,000 A B A 199 Rio Del Oro Pkwy Villagio Dr 2 6 6 6,000 32,900 27,000 A B A 200 Villagio Dr City Limit 2 6 6 6,000 34,000 27,300 A B A
203.0
Zinfandel Dr
Douglas Rd Villages of Zinfandel /
City Limit - 6 6 6 - 37,900 34,500 - C B
203.1 Villages of Zinfandel /
City Limit North Mather Blvd. - 6 6 6 - 37,900 34,500 - C B
204 North Mather Blvd International Dr. - 6 6 8 - 55,800 55,100 - F F 205 International Dr White Rock Rd. 6 6 6 19,700 26,700 25,800 A A C 206 White Rock Rd US 50-Interchange2 6 6 6 8 41,900 61,700 58,900 C F F 207 Olson Dr Folsom Blvd. 4 4 4 4 22,700 27,600 27,600 B C C 208 Folsom Blvd Sunrise Blvd. 2 2 2 2 7,100 13,200 13,200 A C C
1 Ultimate roadway travel lanes defined in the “Roadway System and Sizing” map in the General Plan. See Figure 2.2 Ultimate improvement does not assume Zinfandel Complex which would provide an acceptable LOS Source: DKS Associates, 2013

Coloma Rd
Su
nri
se
Blv
d
Gra
nt
Lin
e R
d
Douglas Rd
Mather Blvd
Centennial Dr
Zinfandel D r
Kiefer Blvd
Folsom B
lvd
Americanos Blvd
Ro
utie
r R
d
Jackson Hwy
International D
r
Ra
nch
o C
ord
ova
Pkw
y
Chrysanthy Blvd
Easton Valley Pkwy
Old PlacervilleRd
Vill
agio
Dr
Bra
dsh
aw
Rd
Rio
Del O
ro P
kwy
Ki lg
or e
Rd
White Rock Rd
Sun
Center Dr
Mather Field R
d
Su
nri
se
Blv
d
International Dr
Zinf
ande
l Dr
Folsom B
lvd
Rancho C
ord
ova
Pkw
y
Sunrise B
lvd
Gra
nt L
ine
Rd
White Rock Rd
8
27
97
25
46
1
127 95
2
79
87
178
19
26
45
177
4
94
11
85
82
126
24.4
83
9
93
143
58 59
86
124
47
7
142
131
129
204
96
105
39
57
133
55
73
3
111
80
179
116
174
24.3
128
130
10
91
14940
203
81
115
84
56
132 30
198
180
199197
104
28
112
200
181
196
52146
54.1
145
189
103
184
110205
182
144
114
192
319
191
183
106
190
152
185
162
318
203.1
153
143.1
98
147
206
154
166.2
186
151
£¤50
·|}þ16
£¤50
Rancho Cordova City Limit
UTIMATE IMPROVEMENTS
Widened Roadways
4 Lanes
6 Lanes
New Roadways
2 Lane
4 Lane
6 Lanes
Other
Complex
Non-Capacity
FIGURE 2GENERAL PLAN ROADWAYSIZING FOR POST 2035TRAFFIC DEMAND
Roadway Identification Number180
20

Coloma Rd
Su
nri
se
Blv
d
Gra
nt
Lin
e R
d
Douglas Rd
Mather Blvd
Centennial Dr
Zinfandel D r
Kiefer Blvd
Folsom B
lvd
Americanos Blvd
Ro
utie
r R
d
Jackson Hwy
International D
r
Ra
nch
o C
ord
ova
Pkw
y
Chrysanthy Blvd
Easton Valley Pkwy
Old PlacervilleRd
Vill
agio
Dr
Bra
dsh
aw
Rd
Rio
Del O
ro P
kwy
Ki lg
or e
Rd
White Rock Rd
Sun
Center Dr
Mather Field R
d
Su
nri
se
Blv
d
International Dr
Zinf
ande
l Dr
Folsom B
lvd
Rancho C
ord
ova
Pkw
y
Sunrise B
lvd
Gra
nt L
ine
Rd
White Rock Rd
8
27
97
25
46
1
127 95
2
79
87
178
19
26
45
177
4
94
11
85
82
126
24.4
83
9
93
143
58 59
86
124
47
7
142
131
129
204
96
105
39
57
133
55
73
3
111
80
179
116
174
24.3
128
130
10
91
14940
203
81
115
84
56
132 30
198
180
199197
104
28
112
200
181
196
52146
54.1
145
189
103
184
110205
182
144
114
192
319
191
183
106
190
152
185
162
318
203.1
153
143.1
98
147
206
154
166.2
186
151
£¤50
·|}þ16
£¤50
Rancho Cordova City Limit
2035 CIP IMPROVEMENTS
Widened Roadways
4 Lanes
6 Lanes
New Roadways
2 Lane
4 Lane
6 Lanes
Other
Complex
Non-Capacity
FIGURE 32035 CIP ROADWAY SIZING
Roadway Identification Number180
20

19 December 2013
Table 7 Intersection Lane Requirements from 2035 Needs Analysis
Project ID NO Intersection1
General Plan Roadway
Sizing
Revised 2035 Need
Revised Need2035 Without Thru Trips
2035 2035 Without Thru Trips
LOS2 V/C2 LOS2 V/C2
209 Rio del Oro Pkwy / Sunrise Blvd 6 x 6 Tee 4 x 6 Tee C 0.746 C 0.701 210 Rio del Oro / Rancho Cordova Pkwy 6 x 6 New 4 x 4 New 211 Rio del Oro Pkwy / International Dr 4 x 4 New 2 x 2 New 212 Rio del Oro Pkwy / Americanos Rd 4 x 4 New 2 x 2 New 213 Rio del Oro Pkwy / White Rock Rd 4 x 6 2 x 4 C 0.728 B 0.641 217 Villagio Dr / Douglas Rd 4 x 6 Tee 2 x 6 Tee 2 x 4 Tee A 0.571 A 0.572 218 Villagio Dr / Rancho Cordova Pkwy 4 x 6 New 2 x 4 New 219 Villagio Dr / International Dr 4 x 4 New 2 x 2 New 220 Villagio Dr / Americanos Blvd 4 x 4 New 2 x 2 New 221 Villagio Dr / White Rock Rd 4 x 6 2 x 4 C 0.705 A 0.501
226 Easton Valley Pkwy / Rancho Cordova Pkwy
Urban Interchange F1 1.287 F1 1.197
230.1 7th at Folsom Blvd 4 x 4 Tee 2 x 4 Tee 230.2 Centennial Dr / International Dr 4 x 4 Tee 2 x 4 Tee 2 x 2 Tee 230.3 Centennial Dr / Americanos Blvd 4 x 4 2 x 2 New 230.4 Centennial Dr / Grant Line Rd 4 x 2 x 6 x 6 2 x 6 C 0.77 A 0.485
231 Americanos Blvd / Kiefer Blvd 4 x 4 Tee New 2 x 2 Tee
New A 0.541 A 0.541 232 Americanos Blvd / Chrysanthy Blvd 4 x 4 New 2 x 2 New B 0.604 B 0.604 233 Americanos Blvd / Douglas Rd 4 x 6 2 x 4 B 0.615 A 0.572 234 Americanos Blvd / International Dr 4 x 4 New 2 x 4 240 Bradshaw Rd / Old Placerville Rd 6 x 6 Tee F 1.534 F 1.074 245 Chrysanthy Blvd / Sunrise Blvd 4 x 6 2 x 6 B 0.618 B 0.618
246 Chrysanthy Blvd / Rancho Cordova Pkwy
4 x 4 x 4 x 6 New 4 x 4 2 x 4 C 0.706 C 0.706
247 Chrysanthy Blvd / Grant Line Rd 4 x 2 x 6 x 6 2 x 6 2 x 4 A 0.542 A 0.577 251 Coloma Rd / Sunrise Blvd Sunrise Complex F1 1.027 E1 0.955

20 December 2013
Table 7 Intersection Lane Requirements from 2035 Needs Analysis
Project ID NO Intersection1
General Plan Roadway
Sizing
Revised 2035 Need
Revised Need2035 Without Thru Trips
2035 2035 Without Thru Trips
LOS2 V/C2 LOS2 V/C2
253 Douglas Rd / Sunrise Blvd Urban
Interchange Left turn
Separation Left turn
Separation E1 0.93 D 0.847 254 Douglas Rd / Rancho Cordova Pkwy 6 x 6 6 x 4 4 x 4 C 0.706 C 0.766 255 Douglas Rd / Grant Line Rd 4 x 6 4 x 4 B 0.698 B 0.679 265 Femoyer St / International Dr 4 x 6
267.2 Folsom Blvd / Bradshaw Rd 4 x 6 B 0.687 B 0.687 267.3 Folsom Blvd / Routier Rd 4 x 6 4 x 2 D 0.870 D 0.826 267.4 Folsom Blvd / Mather Field Rd 4 x 6 4 x 4 E 0.995 E 0.945 267.5 Folsom Blvd / Coloma Rd 4 x 4 Tee 267.6 Folsom Blvd / Zinfandel Dr 4 x 4 B 0.639 B 0.601
268 Folsom Blvd / Sunrise Blvd Enhanced at
Grade F 1.016 E 0.934 270 Gold Country Blvd / Sunrise Blvd Sunrise Complex F1 1.007 E1 0.927 273 Grant Line Rd / Jackson Hwy 6 x 6 6 x 4 4 x 4 D 0.804 C 0.755 274 Grant Line Rd / Rancho Cordova Pkwy 6 x 4 Tee 6 x 2 4 x 2 A 0.437 A 0.499 275 Grant Line Rd / Kiefer Blvd. 6 x 4 Tee 6 x 2 4 x 2 B 0.606 B 0.613 278 Old Placerville Rd / Routier Rd 6 x 6 6 x 2
278.1 Old Placerville (International) / Peter McCuen extension 6 x 4 x 6 Tee
278.2 Old Placerville Rd / Rockingham At Ultimate
279 International Dr (Old Placerville Rd) / Mather Blvd 6 x 4 F 1.18 F 1.015
279.1 Mather Blvd / Mather Field Rd 4 x 4 279.2 Mather Blvd / Femoyer St 4 x 4 x 4 x 2 279.3 Mather Blvd / Zinfandel Dr At Ultimate
280 International Dr. (Peter A McCuen Blvd.) / Mather Field Rd 6 x 6

21 December 2013
Table 7 Intersection Lane Requirements from 2035 Needs Analysis
Project ID NO Intersection1
General Plan Roadway
Sizing
Revised 2035 Need
Revised Need2035 Without Thru Trips
2035 2035 Without Thru Trips
LOS2 V/C2 LOS2 V/C2
280.1 International Dr / Peter McCuen extension 4 x 6 x 6 Tee
281 International Dr. / Zinfandel Dr 6 x 6 F 1.208 F 1.208 282 International Dr / Kilgore Rd 6 x 4
283 International Dr / Sunrise Blvd. Urban
Interchange Left turn
Separation Left turn
Separation F1 1.104 F1 1.005 284 International Dr / Rancho Cordova Pkwy 6 x 4 x 6 x 6 New 4 x 6 C 0.799 C 0.735
284.1 International Dr / White Rock Rd 4 x 6 x 6 x 6 New 4 x 6 2 x 4 B 0.665 C 0.753 284.2 International Dr / Rancho Cordova Pkwy 6 x 6 Tee New 2 x 6 D 0.829 C 0.730 288 Jackson Hwy / Sunrise Blvd 6 x 6 4 x 6 D 0.813 C 0.740 289 Rancho Cordova Pkwy / Kiefer Blvd 4 x 4 2 x 2 A 0.554 A 0.554
290 Rancho Cordova Pkwy / White Rock Rd Enhanced at
Grade D 0.871 D 0.810 290.1 Rancho Cordova Pkwy at Sun Center 6 x 2 Tee 294 Kiefer Blvd / Sunrise Blvd 4 x 6 C 0.795 C 0.795 295 Mather Field Rd / Rockingham Rd 6 x 4 297 Sun Center Dr / Sunrise Blvd At Ultimate
299 Sunrise Blvd / White Rock Rd. Urban
Interchange E1 0.939 D1 0.854 300 Sunrise Blvd / Zinfandel Dr Sunrise Complex E1 0.924 E1 0.924 301 Sunrise Blvd / Gold Express Dr Sunrise Complex 302 White Rock Rd / Zinfandel Dr Part of 318.1 F1 1.327 F1 1.327
1 The volume/capacity and LOS reflect an analysis of at-grade improvements. An acceptable LOS would be provided by a grade separation. 2 See Figure 4 for location of intersection improvements Source: DKS Associates, 2012

!
!
!
!
!
!
!
!
!
�! !
� ! !
! !
!
!
!
!
!
!
!
!
!
!
!
!! � !
!
!
!!
!
!
!
!
!
!
!
!
!
!
! !
!
!
!
!
!
!
!
!
�
!
!
!
!
!
!
!
$
$
$
ÐÐ
ÐÐ
ÐÐ
ÐÐ
!
!
!
Coloma Rd
Su
nri
se
Blv
d
Gra
nt
Lin
e R
d
Douglas Rd
Mather Blvd
Centennial Dr
Zinfandel D r
Kiefer Blvd
Folsom B
lvd
Americanos Blvd
Ro
utie
r R
d
Jackson Hwy
International D
r
Ra
nch
o C
ord
ova
Pkw
y
Chrysanthy Blvd
Easton Valley Pkwy
Old Placerville Rd
Vill
agio
Dr
Bra
dsh
aw
Rd
Rio
Del O
ro P
kwy
Ki lg
or e
Rd
White Rock Rd
Sun
Center Dr
Mather Field R
d
Su
nri
se
Blv
d
International Dr
Zinf
ande
l Dr
Folsom B
lvd
Rancho C
ord
ova
Pkw
y
Sunrise B
lvd
Gra
nt L
ine
Rd
White Rock Rd
267.65
267.45
267.35
267.25
297
317
316
313
301
279
252
226
274
211
212
220
280
247232
231
213
217
234
219
233
209
210
218
221
284283282
281
245
265
246
302
295
278
240
273
288
275
289294
255254253
290
299
300
270
251
268
318.1
319.2
290.1
280.1278.2
278.1
279.2
230.4
279.3
230.1
230.2
230.3
284.2
279.1
284.1
267.6
267.5
267.4
267.3
267.2
tu50
����16
tu50
Rancho Cordova City Limit
! No Improvement
! At-Grade Improvement
! At-Grade New Intersection
� Urban Interchange/ Grade Separation
! Complex
ÐÐ LRT Grade-Separation
$ Interchange Modification
$ New Interchange
FIGURE 42035 INTERSECTIONIMPROVEMENT LOCATIONS

23 December 2013
Zinfandel Complex
The Zinfandel Complex includes at-grade intersection improvements including additional turning at intersections along Zinfandel Drive, as well as widening of Zinfandel Drive to accommodate additional through lanes on some segments from south of White Rock Road to Folsom Boulevard. It also includes some modifications to the existing interchange at US 50.
Sunrise Complex
The portion of Sunrise Boulevard between US 50 and Fair Oaks Boulevard is one of the highest volume roadways in the Sacramento region. It carries regional as well as local traffic and thus needs a regional solution. The City’s General Plan Circulation Element indicates the need for two partial grade-separated intersections and two full grade-separated urban interchanges along Sunrise Boulevard between US 50 and Gold Country Boulevard. The City has had discussions with Sacramento County about improvements to the Sunrise Boulevard corridor. Alternative concepts include auxiliary lanes, a “thru-traffic bypass”, grade separations, Bus Rapid Transit (BRT), Intelligent Transportation Systems (ITS), or any combination of these measures to reduce traffic congestion along Sunrise Boulevard. For the City’s CIP, the assumed improvement concept is a grade-separated “thru-traffic bypass” between US 50 and north of Gold Country Boulevard.
3.4 Intersection Needs for TDIF Program
The City needs to construct or widen intersections to accommodate future development. Much of the increase in traffic demand would result from growth within the City, but some of the growth in traffic would be from “thru” vehicle trips that have neither end of the trip within the City. To define the intersection improvements that would be included in the TDIF Program, the intersection analysis was performed a second time with the growth in thru trips removed. The revised intersection needs analysis with thru trips removed is also summarized in Table 7.
For the purpose of the TDIF Program, if it was determined that the 2035 intersection improvement was still needed with the growth in thru trips removed, then the TDIF Program would be required to pay for the entire 2035 improvement. However, if it was determined that a reduced intersection improvement would operate at acceptable levels, then the TDIF Program would include only the cost for the reduced improvement.
The roadway needs analysis indicates that nine intersections would operate at LOS F conditions in 2035 with the roadway widening in the TDIF Program. These intersections are listed in Table 7. These intersection LOS calculations do not take into account grade separations – including urban interchanges, left-turn grade separations and grade separations for light-rail tracks over major roadways near their intersection with Folsom Boulevard. An analysis of 2035 peak hour conditions indicates that significant reductions in congestion could be achieved at about eight of those intersections through the addition of grade separating various movements and these improvements are included in the TDIF Program.

24 December 2013
3.5 Existing LOS Deficiencies
Roadway Segments Deficiencies
An analysis of traffic demand in the 2007 Base Year of this update of the TDIF Program shows that about five miles of roadways in the City of Rancho Cordova operated at LOS E or F conditions. The locations and volume-to-capacity ratio of roadways with “existing LOS deficiencies” are summarized below:
Sunrise Boulevard – American River to Gold Country Boulevard (1.56) Sunrise Boulevard – Gold Country Boulevard to Coloma Road (1.54) Sunrise Boulevard – Coloma Road to Zinfandel Drive (1.53) Sunrise Boulevard – Zinfandel Drive to U.S. 50 Interchange (1.48) Sunrise Boulevard – U.S. 50 Interchange to Folsom Boulevard (0.96) Sunrise Boulevard –Folsom Boulevard to Sun Center Drive (1.06) Sunrise Boulevard – Douglas Road to Chrysanthy Boulevard (1.11) Sunrise Boulevard – Chrysanthy Boulevard to Kiefer Boulevard (1.00) Sunrise Boulevard – Kiefer Boulevard to SR-16 (0.92)
Since 2007, Sunrise Boulevard has been widened and thus no longer is an existing deficiency. The 2007 “Base Year” for the TDIF Program remains for this 2013 update of the Program. By maintaining this Base Year, future development will help fund improvements that have already been constructed (such as the widening of Sunrise Boulevard) and that now have excess capacity that can be utilized by future development.
The General Plan calls for a maximum of six lanes on the City’s busiest arterial roadways. Some of these roadways already have six lanes. Many two or four lane arterials could be widened under the CIP, but some roadway segments would operate at LOS E or F conditions in 2035 with the maximum of lanes allowed under the General Plan. For 2035 traffic demand, about nine miles of roadway that would operate at LOS E or F conditions even with the maximum of lanes allowed under the General Plan.
Intersection Deficiencies
There are five intersections that currently operate at LOS E or F conditions and are thus existing deficiencies. These intersections are listed in Table 8.
Table 8 Existing Intersection Deficiencies Project ID No. North-South Street East-West Street Level of Service Volume/Capacity
251 Sunrise Boulevard Coloma Road E 0.96 267.4 Mather Field Road Folsom Boulevard E 0.99 270 Sunrise Boulevard Gold Country Blvd F 1.02 273 Grant Line Road Jackson Road F 1.04 288 Sunrise Boulevard Jackson Road E 0.97
Source: DKS Associates, 2012

25 December 2013
3.6 Transit Facilities
Transit improvements identified in the Capital Improvement Program are directly tied to recommendations from the City of Rancho Cordova Transit Master Plan approved by City Council in September of 2006. Since the adoption of the Master Plan, an implementation strategy has been initiated and refinements to Bus Rapid Transit (BRT) Routes have been identified. The transit capital improvements included in the Transit Master Plan are supported by SACOG and have been included in the 2035 Metropolitan Transportation Plan.
A BRT route will be built along the Sunrise Corridor between the Sunrise RT light rail station and the American river connecting to an exclusive lane built on the Sunrise Bridge over the River. The Rancho Cordova Transit Signature Route will be implemented on Rancho Cordova Parkway with shared lanes and using enhancements such as transit signal priority. Streetcars have been identified as an appropriate technology for the 18 mile long Signature Route, however only a 4.7 mile streetcar loop thorough the downtown area is conceived for the 2035 horizon year. The remainder of the Signature Route will be served by rubber tire vehicles until streetcar expansion becomes feasible.
Twenty station sites have been identified along the Signature Route, five of which will be Regional Transit Centers providing travel information services, fare purchase centers and other transit supportive amenities. Four station rehabilitation projects have also been identified along Regional Transit’s Gold Line and new stations sites are proposed at Horn Road and Mine Shaft Road.
The CIP and the TDIF Program include capital costs for transit but not cost for operations and maintenance. Funding transit O&M costs is a considerable challenge.
3.7 Bikeways and Walkways
ADA Implementation is identified in the City’s ADA Transition Plan which was approved by City Council in 2005. The 2011 Council Approved Bicycle Master Plan and Pedestrian Master Plan guide the requirements for cycling and walking facilities.

26 December 2013
4.0 Improvement Costs
4.1 Roadway Improvements
Capital costs for roadway, intersection, and interchange projects in the TDIF Program are shown in Tables B-1 and B-2 of Appendix B. These cost estimates were developed based on updated standard unit costs prepared by Wood Rogers. The methodology used to prepare these unit costs is described in Appendix C. Some individual project costs for improvements that have already been constructed were provided by City staff. The costs shown herein are only those considered for inclusion in the impact fee program and do not include roadway and intersection frontage improvements considered to be the obligation of the adjacent land owner.
4.2 Transit Improvements
HDR prepared cost estimates for the streetcar vehicles, streetcar track work and the transit maintenance facility as part of the City’s 2006 Transit Master Plan. URS right-of-way unit costs were used for transit station and maintenance facility lands, and URS pavement unit costs were used for the BRT bus lanes on the Sunrise Corridor. Costs for bus shuttles, light rail stations, light rail station upgrades, BRT stations and Signature Route stations are based on consultation with Sacramento Regional Transit and other local service providers. Table 9 provides costs for transit improvements.
Table 9 Summary of Transit Improvement Costs
Project ID No Facility Description Cost
304 Transit Facilities, Bus Lanes and Stations
Sunrise Corridor BRT, Transit Stations, Promenade Transit Lanes $81,616,000
305
City Transit System, Street Cars, Shuttles and Transit Facilities
Transit Maintenance Facility, Streetcar (Stage 1 & 2 only), Streetcar Vehicles, Bus Shuttles $87,970,000
305.1 Completion of Signature Route - Post 2035
Street car technology on remaining 13.3 miles of Signature Route $186,300,000
306 Transit Facilities, Light Rail
Light Rail station Upgrades and New Light Rail Stations $10,610,000
Total $366,496,000
Source: City of Rancho Cordova
Table 9 includes capital costs for transit but not cost for operations and maintenance.

27 December 2013
4.3 Bikeway and Walkway Improvements
Costing information for the ADA Transition Plan was prepared by MIG Associates, Inc. The bicycle and pedestrian system costs are based on the Rancho Cordova 2011 Bicycle Master Plan and 2011 Pedestrian Master Plan, prepared by PMC. The City is currently in the process of updating the Bicycle Master Plan and has added new bicycle system improvements that were not considered in the 2011 Bicycle Master Plan. Table 10 provides costs for bikeway and pedestrian improvements.
Table 10 Summary of Bicycle and Pedestrian Improvement Costs
Project ID No Facility Description Cost
303
Pedestrian Facilities and ADA Implementation
Implementation of ADA Transition Plan, Sidewalk Gap Program and Pedestrian Appurtenances $20,500,000
307 Grade Separations (Bike Bridges)
Class I system over and under crossings $51,650,000
307.1 Vision Bridges - Post 2035 Remaining over and under crossings
$14,370,000
307.2 Feasibility Locations $22,25000
308 Routes and Connections
Infill trails and gaps east of Sunrise Blvd $27,352,000
Total $136,122,000 Source: City of Rancho Cordova

28 December 2013
5.0 Basis for Allocating Improvement Costs
The basis for allocating the cost of transportation improvements for the TDIF program update is summarized in Table 11 and is discussed in the following sections.
5.1 Roadway Capacity Improvements
The improvements included in the TDIF Program Update were identified to meet the City’s level of service policy under 2035 travel demand levels after “thru trips” (those with neither trip end within the City) were subtracted from the traffic demand. Roadway capacity improvements were limited by the maximum number of lanes allowed under the General Plan.
Tables B-1 and B-2 in Appendix B list each of the roadway and intersections requiring improvements under the General Plan and show the description and costs of: 1) the ultimate improvements, 2) the CIP improvements needed to accommodate 2035 traffic volumes and 3) the improvements in the Fee Program. For a roadway that currently operates at LOS D or better conditions but that would operate at LOS E or F conditions under “2035 traffic demand without thru trips”, the entire cost of the capacity improvement was allocated to the TDIF Program. The cost of the capacity improvement allocated to the TDIF does not include the following:
Roadway frontage improvements (i.e. curb travel lane, bike lane, curb and gutter plus sidewalk) where development is expected to occur
Portion of cross-section on roadways along jurisdictional boundaries that was assumed to be improved by Sacramento County
For existing deficiencies (roadways that currently operate at LOS E or F), the cost of the improvement that is allocated to the TDIF program is equal to the percent of total cost that is needed to return the roadway to existing congestion levels. This allocation is equal to the percentage of the total change in volume/capacity (v/c) ratio (due to the improvement) that is needed to return the v/c ratio to current levels.
For example, the v/c ratio of a two-lane roadway currently equals 0.94 (LOS E conditions) and its v/c ratio under “2035 traffic demand without thru trips”, is estimated at 1.24 (LOS F conditions) without any improvements and at 0.62 if the roadway is widened to four lanes. The cost allocated to the TDIF program for this example is calculated as follows:
(1.24 – 0.94) / (1.24 – 0.62) = 48%.

29 December 2013
Under this example, the City will need to secure funding for the remaining 52% of the cost of this improvement from other sources.
Table 11 Basis of Cost Allocation – TDIF Program Update
Improvement Type Facility Type
Basis for Allocating Cost to Transportation Development Impact
Fee Program
Capacity Improvements
on roadways and intersections
Roadway that currently operates at LOS D or better conditions and would operate at LOS E or F conditions in 2035
Full implementation cost
Existing Deficiencies - Roadway that currently operates at LOS E or F conditions and would operate at LOS E or F conditions in 2035
Cost that is needed to bring roadway to existing congestion level based on: Percentage of the total change in volume/capacity (v/c) ratio due to the improvement that is needed to return the v/c ratio to current levels For the Sunrise and Zinfandel Complexes, the cost allocated to the TDIF Program is based on the percentage of total 2035 vehicle trips using these roadway segments that are from new development in the City
Transit Improvements Portion of Transit Master Plan needed by 2035
Costs are spilt between existing and new development based on: 2007 to 2035 growth in total person trips generated in the City as a percent of total 2035 person trips Walkway/Bikeway
Improvements
Portion of Draft Pedestrian Master Plan and General Plan. Bike Trails needed by 2035
Source: DKS Associates, 2012

30 December 2013
For the Zinfandel Complex, the cost allocated to the TDIF Program is based on the percentage of total 2035 vehicle trips using Zinfandel between White Rock Road and US 50 that are from new development in the City.
The portion of Sunrise Boulevard between US 50 and Fair Oaks Boulevard carries regional as well as local traffic and thus needs a regional solution. While new development’s fair share of improvements to that section of Sunrise Boulevard (the “Sunrise Complex” described in Section 3.3) was estimated at 44 percent (about $131.5 million), the City has decided to allocate $50 million, which is the equivalent amount that Sacramento County has included in their fee program. The City will work with Sacramento County and SACOG to fund the remaining costs for this regional facility.
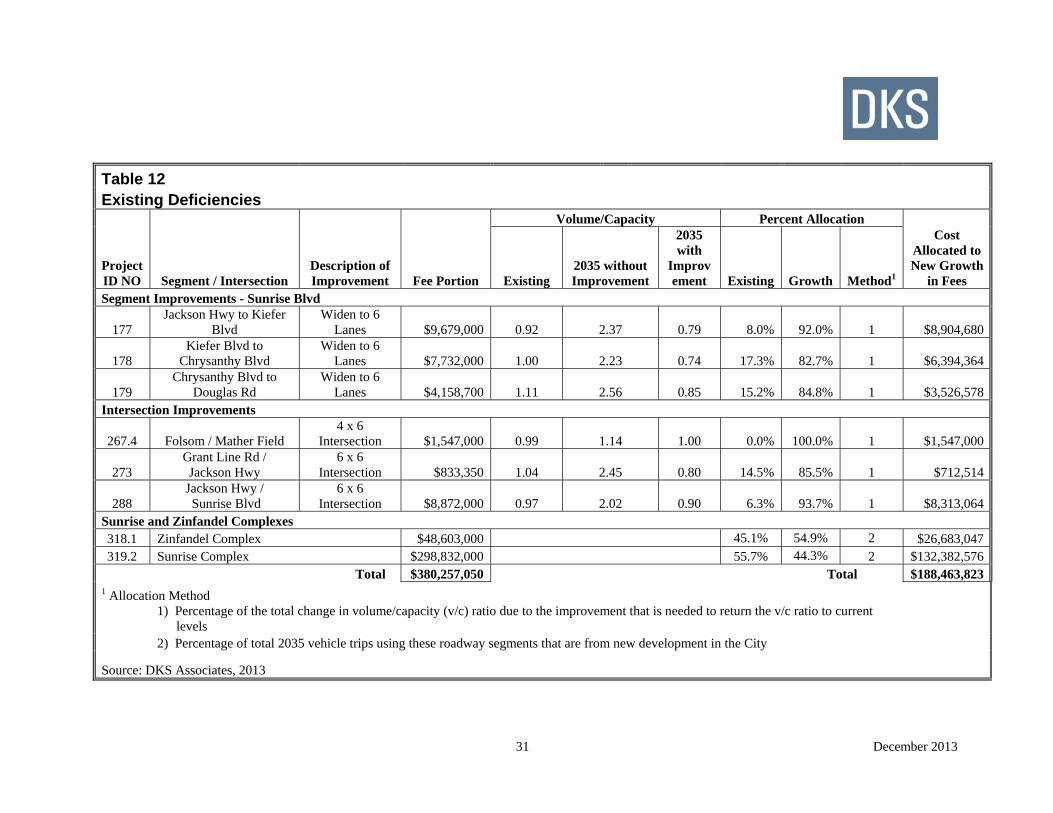
Table 12 summarizes how the costs of the 2035 improvements on roadway and intersections that are existing deficiencies were allocated to new development in the TDIF Program.
Tables B-1 and B-2 in Appendix B show the cost allocated to new development in the City through the Fee Program for each roadway and intersection.
5.2 Transit Improvements
SACOG’s travel demand model is multimodal and estimates travel demand through the following basic steps:
It estimates trip generation in “person trips” based on the number of households and their demographics and the number of jobs by type in each traffic analysis zone (TAZ).
It estimates the origins and destinations of each person trip based on travel time during four periods of a day.
It estimates the travel mode that would be used by each person trip based on the available transit services and roadway facilities and on general characteristics of bike and pedestrian facilities in an area
It assigns transit trips by route and vehicle trips by roadway based on estimated travel time during four periods of a day.
New development’s “fair share” of transit improvements is based on the estimated growth in daily “person trips” generated by development in the City between 2007 to 2035 growth as a percent of total 2035 person trips. The growth in person trips Citywide is as follows:
Existing (2007) person trips 40.9% 2007 to 2035 person trips 59.1% Total 100.0%
31 December 2013
Table 12 Existing Deficiencies
Project ID NO Segment / Intersection
Description of Improvement Fee Portion
Volume/Capacity Percent Allocation Cost
Allocated to New Growth
in Fees Existing 2035 without Improvement
2035 with
Improvement Existing Growth Method1
Segment Improvements - Sunrise Blvd
177 Jackson Hwy to Kiefer
Blvd Widen to 6
Lanes $9,679,000 0.92 2.37 0.79 8.0% 92.0% 1 $8,904,680
178 Kiefer Blvd to
Chrysanthy Blvd Widen to 6
Lanes $7,732,000 1.00 2.23 0.74 17.3% 82.7% 1 $6,394,364
179 Chrysanthy Blvd to
Douglas Rd Widen to 6
Lanes $4,158,700 1.11 2.56 0.85 15.2% 84.8% 1 $3,526,578 Intersection Improvements
267.4 Folsom / Mather Field 4 x 6
Intersection $1,547,000 0.99 1.14 1.00 0.0% 100.0% 1 $1,547,000
273 Grant Line Rd / Jackson Hwy
6 x 6 Intersection $833,350 1.04 2.45 0.80 14.5% 85.5% 1 $712,514
288 Jackson Hwy / Sunrise Blvd
6 x 6 Intersection $8,872,000 0.97 2.02 0.90 6.3% 93.7% 1 $8,313,064
Sunrise and Zinfandel Complexes 318.1 Zinfandel Complex $48,603,000 45.1% 54.9% 2 $26,683,047 319.2 Sunrise Complex $298,832,000 55.7% 44.3% 2 $132,382,576
Total $380,257,050 Total $188,463,823 1 Allocation Method
1) Percentage of the total change in volume/capacity (v/c) ratio due to the improvement that is needed to return the v/c ratio to current
levels 2) Percentage of total 2035 vehicle trips using these roadway segments that are from new development in the City
Source: DKS Associates, 2013

32 December 2013
Table 13 shows the nexus-based allocation of transit improvement costs in the TDIF Program, which yields about $106 million allocated to new development and results in about $1,764 per DUE for transit improvements. The City has decided that a lower level of transit funding of $1,400 per DUE from new development is appropriate, which would generate about $84.5 million and require the City to seek additional funding from other sources.
Table 13 Allocation of CIP Transit Improvements Cost Percent Nexus-Based Allocation of Transit Improvements in TDIF Program City Obligation $73,700,164 40.9% New Development’s Share $106,495,836 59.1% Total $180,196,000 100.0% Selected Allocation of Transit Improvements in TDIF Program1 City Obligation $95,686,400 53.1% New Development’s Share1 $84,509,600 46.9% Total $180,196,000 100.0% Transit Improvements Not Included in TDIF ProgramPost-2035 Improvements in Transit Master Plan $186,300,000 Ultimate General Plan Transit System
Total $366,496,000 1 Selected allocation results in $1,400 per DUE in transit funding for new development, which is less than the nexus-based allocation.
Source: DKS Associates, 2013 5.3 Bikeway and Walkway Improvements
The costs of three elements shown in Table 10 were not included in the Fee Program: 1) improvements to meet ADA requirements, 2) post-2035 “vision” bike bridges and 3) the “feasibility locations” category of bike bridges. Table 14 shows the allocation of walkway and bikeway improvements to the TDIF Program. Like transit improvements, the nexus-based allocation of the remaining $79 million of walkway and bikeway improvements to new development is based on the estimated growth in daily “person trips” generated by development in the City between 2007 to 2035 growth as a percent of total 2035 person trips. This allocation yields about $46.7 million to new development, or about $773 per DUE. The City has decided that a lower level of transit funding of $700 per DUE from new development is appropriate, which would generate about $42.3 million.
5.4 Program Contingency
A four percent (4%) program contingency has been applied to the total costs allocated to the TDIF Program Update. The program contingency will be managed at the City’s sole discretion to cover project scope changes, alternative nexus-based projects, unforeseen and

33 December 2013
unbudgeted construction expenses, and other project related expenses. The program contingency will be first prioritized for regional projects being delivered by the City.
Table 14 Allocation of CIP Walkway and Bikeway Improvements
Improvements Cost Percent
Nexus-Based Allocation of Bikeway Improvements in TDIF Program City Obligation $32,311,818 40.9% New Development’s Share $46,690,182 59.1% Total $79,002,000 100.0% Selected Allocation of Bikeway Improvements in TDIF Program1 City Obligation $36,747,200 62.9% New Development’s Share1 $42,254,800 37.1% Total $79,002,000 100.0% Bikeway and Pedestrian Improvements Not Included in TDIF Program Post-2035 Walkway and Bikeway Improvements $22,250,000 Pedestrian Facilities and ADA Implementation $20,500,000
Ultimate General Plan System Total $117,314,000
1 Selected allocation results in $700 per DUE in transit funding for new development, which is less than the nexus-based allocation.
Source: DKS Associates, 2012 5.5 Improvements and Elements Not Included in TDIF Fee Program
The TDIF Program does not include funding for a number of roadway improvements in the CIP and for roadway maintenance. The City will need to secure funding for those projects as well as for its share of existing deficiencies and its share of transit, pedestrian and walkway improvements. The transportation improvements and costs not allocated to new development in the TDIF Program are summarized below.
Roadways, intersections and interchanges:
The TDIF Program does not include the “ultimate” roadway, intersection and interchange improvements that are needed post-2035. These are estimated to cost about $120 million. An estimated $119 million in CIP roadway projects that are non-capacity improvements were not included in the TDIF Program. The TDIF Program also does not include those CIP improvements that are not warranted when “thru trips” (those with neither the origin nor destination of the trip in the City) are subtracted from the travel demand. These are estimated to cost about $12.5 million.

34 December 2013
The City has also decided to reduce the developer-funded portion of the following major improvements:
While new development’s fair share of improvements to Sunrise Boulevard north of US 50 (the “Sunrise Complex” described in Section 3.3) was estimated at 44 percent (see Table 12) or about $131.5 million), the City has decided to allocate $50 million, which is the equivalent amount that Sacramento County has included in their fee program. The City will work with Sacramento County and SACOG to fund the remaining costs for this regional facility. The revised allocation reduces new development’s share of the Sunrise improvements by about $81.5 million.
The analysis indicates the need for left-turn grade separations at both the Sunrise Boulevard/Douglas Road intersection and the Sunrise Boulevard/International Drive intersection, plus a full urban interchange at the Sunrise Boulevard/White Rock Road intersection. The City has decided to reduce new development’s share of funding for these three intersections to an equivalent cost of at-grade improvements. The revised allocation reduces new development’s share of intersection improvements by about $56.5 million.
The City General Plan downgraded Folsom Boulevard from 6-lanes to a 4-lane arterial. To minimize the impact and improve levels of service, the General Plan identifies aggressive operational improvements on Folsom Boulevard. The CIP includes grade separations for the light rail tracks over four major roadways near their intersection with Folsom Boulevard: Bradshaw Road, Routier Road, Mather Field Road and Zinfandel Road. These grade separations would not benefit light rail trains since crossing gates allow trains to travel across those roadways without delay. The over-crossings are needed to mitigate traffic congestion at four intersections along Folsom Boulevard. While new development could be charged for nearly all of the $87.5 million cost for those intersection improvements, the City has decided to reduce new development’s share to 50 percent of the cost of those improvements. The revised allocation reduces new development’s share of intersection improvements by about $43.7 million.
To reduce the developer-funded portion of these key projects, the City needs to secure an additional $182 million in outside funding.
Pavement Maintenance
The TDIF Program also does not include an estimated $80.5 million for pavement maintenance.
Transit:
The TDIF Program does not include completion of the last 13.3 miles of street car technology on the 18-mile Signature Route estimated at $186.3 million. The CIP includes capital costs for transit but not cost for operations and maintenance.

35 December 2013
Bikeway and Walkways
The TDIF Program does not include the ten “Vision” grade separations (bike bridges), estimated at $22.2 million, which were assumed to be post-2035 improvements. The “feasibility locations” category of bike bridges, estimated at about $14.4 million is needed by 2035 but was not included in the TDIF Program. The TDIF Program also does not include walkway improvements needed to satisfy ADA sidewalk gap and pedestrian appurtenances requirements estimated to cost $20.5 million. In addition to the grade separations that are part of the City’s CIP, developers will be constructing about $92 million in grade separations and bike trail construction along the trail system. Summary
Table 15 summarizes the transportation elements and costs not allocated to new development in the TDIF Program. Table 15 Cost Not Allocated to New Development in TDIF Program Costs Post-2035 Improvements Roadways, Intersections and Interchanges $119,631,000 Transit $186,300,000 Bikeway and Walkway $22,250,000 Project Contingency $13,127,000
Subtotal $341,308,000
CIP Improvements not Included in TDIF Program Roadway Improvements needed to Accommodate Growth in Thru Trips $12,514,000 Non-Capacity Roadway Improvements $118,686,000 Pavement Maintenance $80,495,000 Bikeways $14,370,000 Pedestrian Facilities and ADA Implementation $20,500,000 Project Contingency $9,863,000
Subtotal $256,428,000
City Obligation to Improvements in TDIF Program Existing Roadway and Intersection Deficiencies $191,385,718 Reductions in Development Funding for Key Projects $146,752,484 Signal System $21,994,000 Transit Improvements $95,686,400 Bikeway Improvements $36,747,200 Project Contingency $19,703,000
Subtotal $512,268,802
Total $1,109,717,802 Source: DKS Associates, 2013

36 December 2013
6.0 Methodology for Calculating Fees
6.1 Dwelling Unit Equivalents
In the allocation of costs to various types of developments, each development type is assigned a “dwelling unit equivalent” or “DUE” rate. DUE’s are numerical measures of how the trip-making characteristics of a land use type compares to a single-family residential unit. A single-family residential unit is assigned a DUE of 1. Land uses which have greater overall traffic impacts than single-family residential units are assigned values greater than 1, while land uses with lower overall traffic impacts are assigned values less than 1.
DUE’s were developed by comparing both the trip generation and trip length characteristics of various land uses to those of the single-family residential units. The DUE’s reflect the relative daily trips generated by each general land use type in the travel demand model. Also considered in the calculation of DUE’s are “percent new” trips since some of the vehicles attracted to non-residential uses would have been on the roadway system regardless of the presence of the traffic generator. Average trip lengths for the remaining "primary" trips generated by a development were then utilized to better reflect overall impact of longer trips on the City’s roadway system.
The DUE rates were thus based on estimates of the average daily vehicle-miles of travel (VMT) generated by each general land use type. The DUE rates used to estimate the fees are shown in Table 16. Thus, 1,000 square feet of retail development is estimated to have a traffic impact on the City’s roadway system which is 1.21 times that of a single-family detached residential unit.
Table 16 DUE Rates
Land Use Category1
Daily Trip Rate per
Unit2 Unit
Trip Length (miles)
Percent New trips
VMT per Unit
DUE per Unit
Single-Family Detached 9.57 Dwelling
Unit
5.1 100 48.81 1.00 Single-Family Attached 8.45 5.1 100 43.09 0.88 Multi-Family 6.72 5.1 100 34.27 0.70 Retail 42.94 1,000
Square Feet
2.3 60 59.26 1.21 Office 11.01 5.1 92 51.66 1.06 Industrial 4.96 4.8 92 21.90 0.45 1 The definitions of the residential and non-residential uses are provided in Appendix A 2 ITE Trip Generation 7th Edition
Source: DKS Associates, 2012
Table 17 shows the estimated growth in DUEs in the City between 2007 and 2035 which is calculated by applying the DUE per unit rates in Table 16 to the estimated development growth shown in Table 4.

37 December 2013
Table 17 Growth in Citywide DUEs
Land Use Category
Units Growth in Units
2007 to 2035 DUE Rate per Unit2
Growth in DUEs2007 to 2035
Single-Family Detached Dwelling
Unit
21,630 1.00 21,630
Single-Family Attached 18,759 0.88 16,508 Multi-Family 9,454 0.70 6,618 Retail
1,000 Sq. Ft
2,311 1.21 2,796 Office 11,783 1.06 12,490 Industrial/Other 716 0.45 322
Total 60,364 Source: DKS Associates, 2012
6.2 Fees Calculation
Table 18 summarizes the costs allocated to new development in the TDIF Program and the resulting costs per DUE.
Table 18 Estimated Cost per DUE – TDIF Program Update
Elements of TDIF Program Cost Allocated to New
Development in TDIF Program
Roadways, Intersections, Interchanges and Signal System1 $744,041,370
Transit2 $84,509,600
Bikeways3 $42,254,800
Project Contingencies4 $34,832,231
Total $905,638,000
Fees Collected by City from July 2003 to January 2007 $33,143,248 Total Remaining Costs Funded by TDIF $872,494,752
Total Growth in DUEs 60,364 Cost per DUE $14,454
Administrative Cost (3.75%) per DUE $542
Total Fee per DUE $14,996 1 See Tables B-1 and B-2 in Appendix B for summary of costs allocated to TDIF Program 2 See Table 13 for summary of costs of transit improvements allocated to TDIF Program 3 See Table 14 for summary of costs of bikeway and pedestrian improvements allocated to TDIF Program4 See Section 5.4 for summary of contingencies allocated to TDIF Program Source: DKS Associates, 2013

38 December 2013
The 2007 “Base Year” for the TDIF Program remains for this 2013 update of the Program, including the definition of existing improvements. By maintaining this Base Year, future development will help fund improvements that have already been constructed (such as the widening of Sunrise Boulevard from White Rock Road to Kiefer Boulevard) and that now have excess capacity that can be utilized by future development.
7.0 TDIF Nexus Findings A nexus analysis has been prepared on the City’s TDIF Program in accordance with the procedural guidelines established in AB1600 which is codified in California Government Section 66000 et seq. These code sections set forth the procedural requirements for establishing and collecting various development impact fees. These procedures require that “a reasonable relationship or nexus must exit between a governmental exaction and the purpose of the condition.” Specifically, each local agency imposing a fee must:
Identify the purpose of the fee;
Identify how the fee is to be used;
Determine how a reasonable relationship exists between the fee’s use and the type of development project on which the fee is imposed.
Determine how a reasonable relationship exists between the need for the public facility and the type of development project on which the fee is imposed; and,
Demonstrate a reasonable relationship between the amount of the fee and the cost of public facility or potion of the public facility attributable to the development on which the fee is imposed.
The prior sections of this report identify the facilities that are included in the City’s General Plan and updated CIP and TDIF Program, summarize the updated costs of those facilities and show how shares of those costs were allocated to new development to mitigate its transportation impacts. All of that information is used in this section to demonstrate that the resulting fees meet the AB 1600 nexus requirements, as outlined below.
7.1 Purpose of Fees
The purpose of the TDIF Program is to fund improvements to the County’s major roadway, transit, bicycle and pedestrian facilities needed to accommodate travel demand generated by new land development in the City through 2035.
The TDIF Program will help meet the City’s General Plan policies including maintaining adequate levels of service and safety for roadway facilities. New development in the City will increase the demand for all modes of travel (including walking, biking, transit, automobile and truck/goods movement) and thus the need for improvements to transportation facilities. The TDIF Program will help fund transportation facilities necessary to accommodate residential and non-residential development in the City.

39 December 2013
7.2 Use of Fees
The fees from new development in the TDIF Program will be used to fund additions and improvements to the transportation system needed to accommodate future travel demand resulting from residential and non-residential development. The TDIF Program will help fund improvements to roadways (include the widening or extensions of arterial and collector roadways and intersection improvements) transit facilities, bikeways and walkways. The transportation improvements wholly or partially funded by the program are described in more detail in Section 4.
7.3 Relationship between use of Fees and Type of Development
Fee revenues generated by the TDIF Program will be used to develop the transportation improvements as outlined in Section 4. New development in the City will generate resident and employees who will demand new and expanded roadway, transit, bicycle and pedestrian facilities. All of these improvements increase the capacity of those segments of the transportation system affected by new development. The results of the transportation modeling analysis summarized in this report demonstrates that new development, both new residential and non-residential uses, will benefit from these improvements by improving service above levels that would occur if these improvements were not completed. Consequently, the cost of transportation improvements is allocated to both residential and non-residential development in the City.
7.4 Relationship between Need for Facility and Type of Development
The projected residential and non-residential development described in Section 3 will add to the incremental need for transportation facilities by increasing the amount of demand on the transportation system. The transportation improvements outlined in Section 4 are required to minimize the degradation in current levels of service caused by new development.
7.5 Relationship between Amount of Fees and the Cost of Facility Attributed to Development upon which Fee is Imposed
Construction of necessary transportation improvements will directly serve residential and non-residential development within the City and will directly benefit new development. The basis for allocating improvement costs to development is described in Section 6.
To define the required roadway and intersection improvements that would be included in the TDIF Program, the roadway segment and intersection level of service (LOS) analysis was performed first with total 2035 travel demand and then a second time with the growth in “thru trips” removed. For the purpose of the TDIF Program, if it was determined that the 2035 roadway improvement would still be needed with the growth in thru trips removed, then the TDIF Program would be required to pay for the entire 2035 improvement. However, if it was determined that a reduced roadway improvement would operate at acceptable levels, the TDIF Program would only include the cost of the reduced improvement.

40 December 2013
For existing deficiencies (roadways or intersections that currently operate at LOS E or F), the cost of the improvement that is allocated to the TDIF program is equal to the percent of total cost that is needed to return the roadway to existing congestion levels. This allocation is equal to the percentage of the total change in volume/capacity (v/c) ratio (due to the improvement) that is needed to return the v/c ratio to current levels
The fee that a developer pays for a new residential unit or commercial building varies by the type of development based on its impact on the transportation system. Each development type is assigned a “dwelling unit equivalent” or “DUE” rate based on its estimated vehicle-miles of travel (VMT) per unit of development.
DUE’s are numerical measures of how the trip-making characteristics of a land use type compares to a single-family residential unit. DUE’s were developed by comparing both the trip generation and trip length characteristics of various land uses to those of the single-family residential units. Also considered in the calculation of DUE’s are “percent new” trips. The DUE rates were thus based on estimates of the average daily vehicle-miles of travel (VMT) generated by each land use type.

41 December 2013
8.0 On-Going Administration of the TDIF Program
8.1 Administration Fee
To defray the City’s costs associated with administering the TDIF, including program management of CIP projects, project scope refinements, updating engineering studies, tracking fee credits and reimbursements, updating the Nexus Study, and any other necessary studies in support of the TDIF Program, the City will levy and collect an administration charge equal to 3.75% of the total fees. The program administration fee must be paid at building permit issuance, or as designated by the City, and cannot be credited through a fee credit or reimbursement agreement.
8.2 TDIF Adjustments
The TDIF will be adjusted in future years to reflect revised facility standards, receipt of funding from alternative sources (e.g., state or federal grants), revised costs, or changes in demographics or land use. In addition to such adjustments, in January of each calendar year, the TDIF for each type of development will automatically be adjusted by the increase, if any, in the 20-city Construction Cost Index (CCI) as reported in the Engineering News Record for the twelve- month period ending October of the prior year. For example, the adjustment for January 2015 will be determined by calculating the increase, if any, from October 2013 to October 2014 in the 20-city CCI.
As discussed in Section V, the fee categories summarized in the prior section may not be applicable to specialized development projects in the City. For example, development of a cemetery, golf course, and/or stadium would not fall under one of these categories. Other examples of specialized development projects are projects that increase trip generation rates, but do not include building square footage, such as a parking lot expansion. For specialized development projects, the City staff will review traffic generation rates applicable to the specialized development and decide on an applicable fee.
Certain redevelopment projects may also be eligible for a fee adjustment. If, for example, a project applicant demolishes an existing 10,000 square foot building and rebuilds a 20,000 square foot building of the same land use, the applicant may be eligible for a waiver of 50% of the TDIF. If a redevelopment project results in a change of land use on a particular parcel, City staff will determine the appropriate TDIF adjustment to reflect the different trip characteristics of the original and new land uses. The City will review redevelopment requests for fee adjustments on a case-by-case basis. If the previously built structure has been vacant for more than five years, the parcel will be treated as if it was undeveloped, and no such adjustment will be applied.

42 December 2013
8.3 TDIF Credits and Reimbursements
The City established a set of policies and procedures regarding fee credits and reimbursements. These policies are codified in Ordinance No. 33-2005 (“Ordinance”), which was adopted by the City Council on December 19, 2005. The Ordinance added Chapter 16.84 to the Rancho Cordova Municipal Code. Among other things, the Ordinance specifies that the City may authorize and issue a credit toward the construction of any transportation facilities in order of “priority”. In other words, developers who construct “priority” facilities will likely receive credits or reimbursements ahead of those developers who construct “non-priority” facilities. For purposes of this Nexus Study, “priority” facilities are those facilities as determined by the City Engineer to avoid substantial congestion levels on key roadways.
8.4 TDIF Exemptions
All determinations regarding the exemptions provided in this section will be made by the City Manager or his/her designee. Generally, the following uses will be exempt from payment of the TDIF:
Public Agencies
All federal and state agencies, public school districts, and the City will be exempt from the TDIF. Other non-City public agencies will be subject to payment of the TDIF; however, the City may choose to waive some or all of the TDIF in certain cases.
Replacement/Reconstruction a. Any replacement or reconstruction (no change in use) of any residential unit that is
damaged or destroyed as a result of fire, flood, explosion, wind, earthquake, riot, or other calamity, or act of God shall be exempt from the TDIF. However, if the residential unit(s) replaced or reconstructed exceeds the documented total number of units of the damaged/destroyed residential structure, the excess units are subject to the TDIF.
b. Any replacement or reconstruction (no change in use) of any non-residential structure that is damaged or destroyed as a result of fire, flood, explosion, wind, earthquake, riot, or other calamity, or act of God shall be exempt from the TDIF. However, if the building replaced or reconstructed exceeds the documented total floor area of the damaged/destroyed building, the excess square footage is subject to the TDIF.
c. If a residential and/or non-residential structure is replaced with an alternative land use, such as replacing an office building with a retail building, then City staff will determine the appropriate TDIF adjustment to reflect the different trip characteristics of the original and new land uses.

43 December 2013
Additions/Alterations/Modifications/Temporary Facilities a. Additions that increase the living area of a residential unit to more than 1,200 square
feet.
b. Additions to single family residential structures provided no change in use occurs and a second full kitchen is not added.
c. Additions to multi-family residential structures that are not part of a mixed use type project provided no change in use occurs and no additional units result.
d. Supporting use square footage in multi-family projects, such as the office and recreation areas required to directly serve the multi-family project. The residential unit fee will provide the full mitigation required in multi-family projects.
e. Non-habitable residential s t ruc tures such as decks , pools , pool cabanas , sheds , garages, etc.
f. Construction of a granny unit that does not have a full kitchen.
g. Mobile or manufactured homes with no permanent foundation.
8.5 Fee Implementation
According to the California Government Code, prior to levying a new fee or increasing an existing fee, an agency must hold at least one open and public meeting. At least ten days prior to this meeting, the agency must make data on infrastructure costs and funding sources available to the public. Notice of the time and place of the meeting, and a general explanation of the matter, are to be published in accordance with Section 6062a of the Government Code, which states that publication of notice shall occur for ten days in a newspaper regularly published once a week or more. The City may then adopt the new fees at the second reading.
The nexus-based calculation of fee per Dwelling Unit Equivalent (DUE) documented in Sections 1 through 6 is based on general land use categories (single family, multi-family, retail, office, and industrial) which are the categories used in the transportation forecasting process. When a developer gets a building permit and pays fees, a more specific land use is known and the number of DUEs for some specific land use will be based on specific DUE rates for that category. Those DUE rates are based on estimates of the average vehicle-miles of travel (VMT) generated on an average weekday for each land use type. Table 19 shows the calculation of DUE factors for each detailed land use type.
The City will determine the appropriate trip DUE factors for other land uses that may develop within the City that are not shown in Table 19.

44 December 2013
Table 19 Detailed DUE Rates
Land Use
Weekday trip
Rate
Trip Length (miles)
Percent New Trips
Vehicle Miles of Travel (VMT)
Due Rate
Residential
Single Family Detached, greater than 1,200 sq. ft.1 9.57 per unit 5.1 100% 48.81 1.00
Single Family Detached, less than or equal to 1,200 sq. ft.2 8.45 per unit 5.1 100% 43.09 0.88
Single Family Attached3 8.45 per unit 5.1 100% 43.09 0.88
Multi-Family4 6.72 per unit 5.1 100% 34.27 0.70
Non-Residential
Commercial 42.94 per KSF 2.3 60% 59.26 1.21
Office 11.01 per KSF 5.1 92% 51.66 1.06
Industrial 4.96 per KSF 4.8 92% 21.90 0.45
Miscellaneous
Church 9.11per KSF 3.9 90% 31.98 0.66
Gasoline/Service Station 168.56 per position 1.9 20% 64.05 1.31
Hotel/Motel 6.90 per room 6.4 65% 28.70 0.59
Mobile Home Park 4.99 per unit 5.1 100% 25.45 0.52
1 Includes all single family detached residential units with more than 1,200 square feet of living area based on the square footage reflected on the building permit issued for construction of the unit.
2 Includes all single family detached residential units with 1,200 square feet or less of living area based on the square footage reflected on the building permit issued for construction of the unit.
3 Includes (i) all attached units within a structure comprising 2-4 units, regardless of ownership status, and (ii) all attached units within a structure comprising 5 or more units that are greater than 1,200 SF and are available for sale.
4 Includes (i) all attached units within a structure comprising 5 or more units that are solely available for rent, and (ii) all attached units structure comprising 5 or more units that are 1,200 SF or less and are available for sale.

A-1 December 2013
Appendix A
Land Use and Development Assumptions For CIP and TDIF Program
LAND USE ASSUMPTIONS
The City’s Planning Department created an i-PLACE3S (Internet-based PLAnning for Community Energy, Economic, and Environmental Sustainability) land use model to survey existing land uses within the current City limits and the larger General Plan Planning Area. The model also projected future growth through 2035 and at buildout of the General Plan. The resulting land use estimates and projections are incorporated in this report and used to develop the City’s GP Transportation System and CIP. The land use estimates and projections also serve as the basis for determining which improvements are included the TDIF Program and which improvements are attributable to new growth. A summary of the i-PLACE3S model and its associated assumptions is provided below.
i-PLACE3S
i-PLACE3S is a geographic information system (“GIS”) software tool developed by the State of California Energy Commission in partnership with the Oregon Department of Energy and the Washington State Energy Office. The system was originally designed to help jurisdictions enhance the sustainability of their communities, but in recent years, as the software has been further developed and refined, local and regional agencies have been using it to evaluate growth scenarios and the associated impacts.
i-PLACE3S is unique from other GIS mapping tools (including the City’s existing GIS system) in that the data is dynamic. When land use categories are applied to a parcel, development characteristics, including dwelling units per acre and employees per acre, are also applied. i-PLACE3S then runs a detailed set of calculations on every parcel in the project to determine the total number of dwelling units, jobs per sector, and building square footage by sector. Because i-PLACE3S is geographically based, data can be summarized for sub-areas within a planning area.
Assumptions and Components of the i-PLACE3S Model
Parcel-based Planning
The 2007 i-PLACE3S land use model was based on the most recent parcel data for the City and the larger General Plan planning area that were available from Sacramento County in January 2007. Utilizing this base geometry, City staff modified the parcels to include recently approved tentative parcel maps for larger development projects (e.g., Sunridge Park and The Preserve). The intent of these changes was to provide a greater level of detail from which to estimate land use assumptions based on recent City approvals.

A-2 December 2013
Land Use Typologies
When assumptions are placed on a parcel, it is done by using a development “Place Type”. Place Types are created from a detailed set of assumptions that include the following:
Percent of development type by sector (i.e., residential, retail/commercial, office, industrial, public, and other)
Square footage by sector – the average dwelling unit size per Place Type or average number of square feet of building area per employee
Parking ratios per 1,000 square feet or per dwelling unit
Parking distribution (e.g., number of levels and location)
Landscaping and setback requirements as a percentage of the site area
Square feet per parking space, including drive aisles
Residential type
Average lot size for single-family detached lots
Maximum height in stories
When i-PLACE3S calculates the resulting development potential (e.g., residential density or employment intensity) of a Place Type, it creates a maximum intensity. As City staff applies the Place Types to parcels, development percentages that reduce the maximum intensity of a category to a likely level are used.
For parcels where more than one Place Type could or should be used, a blended Place Type has been created. Blended Place Types are made up of percentages of development Place Types (i.e., 10% parks, 60% Low Density Residential, 30% Commercial Mixed Use). Development percentages similar to those used for development Place Types have also been applied.
Constraints
The impact of environmental and physical constraints on potential development has also been taken into account as projections have been made. i-PLACE3S includes a constraint function that will hold out a given percentage of land from a geographic area. City staff has estimated this percentage based on previous mapping efforts and studies and has applied them based on the General Plan planning areas. Constraints have been applied only within those Planning Areas that do not have completed detailed mapping or for which a completed detailed land plan was not available at the time the General Plan was under development.
Traffic Analysis Zones – Role in Traffic Modeling and Creating 2035 Data
While the land use model is a parcel-based model, data is summarized based on Traffic Analysis Zones (“TAZ”). Once in this format, the data from the land use mode can be imported into the regional traffic model. The TAZs for the City were provided by Fehr and Peers in 2004 as part of development of the General Plan.
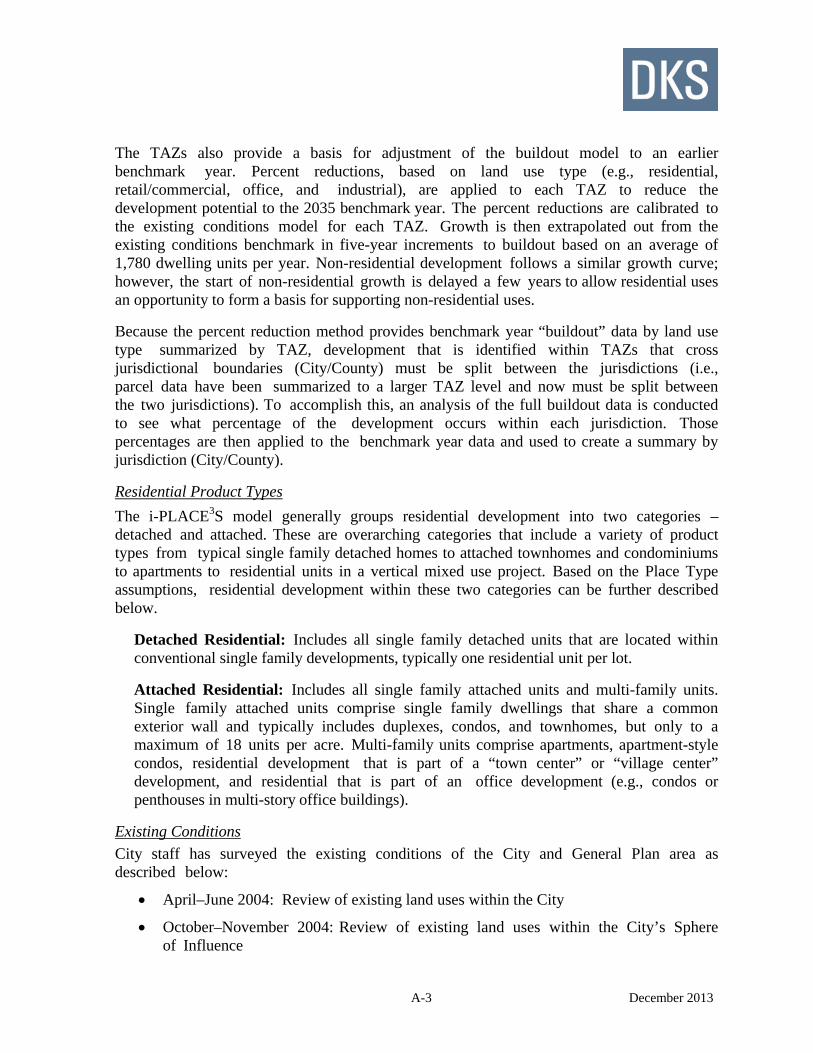
A-3 December 2013
The TAZs also provide a basis for adjustment of the buildout model to an earlier benchmark year. Percent reductions, based on land use type (e.g., residential, retail/commercial, office, and industrial), are applied to each TAZ to reduce the development potential to the 2035 benchmark year. The percent reductions are calibrated to the existing conditions model for each TAZ. Growth is then extrapolated out from the existing conditions benchmark in five-year increments to buildout based on an average of 1,780 dwelling units per year. Non-residential development follows a similar growth curve; however, the start of non-residential growth is delayed a few years to allow residential uses an opportunity to form a basis for supporting non-residential uses.
Because the percent reduction method provides benchmark year “buildout” data by land use type summarized by TAZ, development that is identified within TAZs that cross jurisdictional boundaries (City/County) must be split between the jurisdictions (i.e., parcel data have been summarized to a larger TAZ level and now must be split between the two jurisdictions). To accomplish this, an analysis of the full buildout data is conducted to see what percentage of the development occurs within each jurisdiction. Those percentages are then applied to the benchmark year data and used to create a summary by jurisdiction (City/County).
Residential Product Types
The i-PLACE3S model generally groups residential development into two categories – detached and attached. These are overarching categories that include a variety of product types from typical single family detached homes to attached townhomes and condominiums to apartments to residential units in a vertical mixed use project. Based on the Place Type assumptions, residential development within these two categories can be further described below.
Detached Residential: Includes all single family detached units that are located within conventional single family developments, typically one residential unit per lot.
Attached Residential: Includes all single family attached units and multi-family units. Single family attached units comprise single family dwellings that share a common exterior wall and typically includes duplexes, condos, and townhomes, but only to a maximum of 18 units per acre. Multi-family units comprise apartments, apartment-style condos, residential development that is part of a “town center” or “village center” development, and residential that is part of an office development (e.g., condos or penthouses in multi-story office buildings).
Existing Conditions
City staff has surveyed the existing conditions of the City and General Plan area as described below:
April–June 2004: Review of existing land uses within the City
October–November 2004: Review of existing land uses within the City’s Sphere of Influence

A-4 December 2013
April 2005: Review of existing land uses in Rosemont, Larchmont, and Gold River
January 2007: Field survey of new growth areas, review of aerial photography in the built areas of the City, and review of building permit data for new home construction.
In addition, the Sacramento Area Council of Governments (“SACOG”) has supplied information on existing land uses in portions of the General Plan planning area that have not been surveyed in detail by staff (e.g., Jackson Planning Area, Grant Line South Planning Area, East Planning Area). City staff has reviewed the SACOG data and compared it to the latest aerial photography on record to make it as accurate as possible.
Based on this collected data, an existing conditions model is created in i-PLACE3S. This is a parcel-based model that attributes existing development (e.g., dwelling units and square footage) to each parcel within the study area.
Buildout and 2035 Benchmark Year
The i-PLACE3S model is based on buildout of the General Plan. It looks at the full extent of urban development across the entire General Plan planning area, including both areas within and just outside of the City. In addition to providing City-wide data on development within the City, this practice provides contextual land use information for the surrounding unincorporated area.
While the 2007 land use model is generally the same as the General Plan model, there were two areas of the City where staff made adjustments, consistent with the General Plan, based on recent planning efforts. These are described below in detail.
Redevelopment Areas
In redevelopment areas of the City (e.g., Folsom Boulevard, Capital Center Business Park, and Sunrise Boulevard), the General Plan model was utilized as a base but was supplemented by updated zoning information from the Folsom Boulevard Specific Plan and 2006 General Plan Implementation Rezoning (November 2006) which included the creation of several new mixed use districts and the rezoning of over 200 parcels within the Folsom Boulevard, Sunrise Boulevard, and Zinfandel Drive/Downtown Rancho Cordova areas.
New Growth Areas
The land use model that covers new growth areas of the City is based on a combination of approved and pending development plans, consistent with the development potential outlined in the General Plan. Because the 2007 i-PLACE3S model utilizes a more detailed parcel data set than the General Plan model, several land plans were updated with more detailed information. Table A-1 below lists the new growth project areas and the corresponding land plan used for the 2007 i-PLACE3S land use model.

A-5 December 2013
Table A-1 New Growth Project Area and Land Use Plans
Project Land Plan Used
Westborough December 2004 map provided by Fehr & Peers, as provided by GenCorp, consistent with General Plan
Glenborough Consistent with the adopted General Plan
Rio del Oro February 2005 draft Specific Plan Land Use Map; consistent with the General Plan
Suncreek Consistent with General Plan
Sunridge East Approved land plan (February 2006 edition)
Sunridge Park Approved land plan (June 2006)
Sunridge (all others) Consistent
Sunridge (all others) Consistent with the General Plan’s parcel-specific designations and updated to reflect approved tentative maps
The Arboretum Consistent with the General Plan
Source: City of Rancho Cordova
Land Use Summary
Using the i-PLACE3S land use model, the City’s Planning Department estimates that, as of January 1, 2007, there are approximately 24,500 residential units and approximately 19.9 million square feet of retail/commercial, office, and industrial uses in the City. Existing residential development is comprised of 14,387 single family detached units, 3,757 single family attached units, and 10,069 multifamily units; existing non-residential development is comprised of 3.8 million square feet of retail/commercial, 9.5 million square feet of office, and 6.6 million square feet of industrial uses.
The Planning Department projects that approximately 49,800 additional residential units and 14.8 million square feet of retail/commercial, office, and industrial land uses remain to be developed in the City through 2035. Trip generation factors were applied to this projected growth to calculate the number of dwelling unit equivalents (DUEs) that would impact and, therefore, contribute to the cost of new roadway improvements. Table 17 in this report shows the total DUE calculation.
In all, total development in the City is expected to grow to approximately 74,300 residential units and 34.7 million square feet of non-residential land uses through 2035.

A-6 December 2013
TDIF PROGRAM LAND USE CATEGORIES
The Mitigation Fee Act requires that a reasonable relationship exist between the need for public facilities and the type of development on which an impact fee is imposed. General and detailed land use categories have been defined in order to distinguish between the number of trips generated by residents and employees associated with various types of land use. Existing and projected land uses generated by the i-PLACE3S model are classified by general land use types (e.g., single family detached, single family attached, multi-family, retail/commercial, office, and industrial) and serve as the basis for the cost per dwelling unit equivalent calculation included in this Nexus Study. However, detailed land use categories, as defined below, have been established for purposes of implementing the TDIF Program. These categories have been created to differentiate specific impacts from each detailed land use on transportation facilities. For example, residential land use categories are defined based on characteristics related to unit type (e.g., detached and attached) and unit size as discussed further below.
Data from the American Housing Survey and SACOG implies an indirect relationship between the size of a housing unit and the number of trips generated by a housing unit. The data indicates a negligible difference in trip generation for medium to large single family homes; however, a significant reduction in overall trip generation applies to homes that are 1,200 square feet or less. Based on these findings, a 1,200 square feet cutoff is used to delineate between residential land uses for purposes of this Nexus Study. Specifically, the American Housing Survey for the Sacramento region suggests a proportional relationship between the square footage of a dwelling unit and the number of persons residing in that unit – generally, persons per unit increases as the size of a residential unit increases. In addition, data on travel characteristics from SACOG’s 2000 Household Travel Survey suggests a proportional relationship between the number of persons in a home and the number of trips generated by that household, namely that trips per household increase as persons per household increase. Based on combined data from these two sources, it can be concluded that the average number of trips generated per day is proportionally related to the number of people living in the dwelling unit, which is generally related to the size of the dwelling unit.
A TDIF has been calculated per dwelling unit for residential land uses and per square-foot of building space for most non-residential land use categories. Exceptions in the non-residential land use categories include the following: (i) gasoline/service stations for which impacts are calculated per vehicle position; (ii) mobile home parks impacts for which impacts are calculated per dwelling unit, and (iii) hotels and motels for which impacts are calculated per room. Specifically, the following detailed land use categories are identified for purposes of the TDIF Program:
Single Family Detached, greater than 1,200 sq. ft.:
Includes all single family detached residential units with more than 1,200 square feet of living area based on the square footage reflected on the building permit issued for construction of the unit.
Single Family Detached, Includes all single family detached residential units with 1,200

A-7 December 2013
1,200 sq. ft. or less: square feet or less of living area based on the square footage reflected on the building permit issued for construction of the unit.
Single Family Attached: Includes the following:
All units within a structure that has 2-4 attached units, whether such units are all offered for rent or for sale to individual owners.
All units within a structure that has 5 or more attached units that (i) are available for sale to individual owners, and (ii) have a living area greater than 1,200 square feet.
Multi-Family: Includes the following: All units within a structure that has 5 or more units, all of
which are offered for rent to the general public.
All units within a structure that has 5 or more attached units that (i) are available for sale to individual owners, and (ii) have a living area less than 1,200 square feet.
Retail/Commercial: Includes, but is not limited to, retail stores, clothing stores, book stores, video rental stores, drug stores, professional services (e.g., barber shops, dry cleaners), restaurants, supermarkets, hospitals, movie theaters, appliance and electronics stores, home supply stores, tire stores, auto parts stores, and other businesses providing auto-related products and services.
Office: Includes, but is not limited to, buildings in which professional, banking, insurance, real estate, administrative or in-office medical or dental activities are conducted.
Industrial: Includes, but is not limited to, all forms of industrial, manufacturing, and warehousing land uses. Specific portions of any building space within this category that are used distinctly for retail/commercial sales, office space, or other such specific use may be charged the representative fees according to use. Remaining portions of the building will be charged fees on the industrial rate.
Miscellaneous: Includes churches, gas stations, hotels/motels, and mobile home parks.
City staff will make the final determination as to which land use category a particular development type will be assigned. Staff will determine the land use category that

A-8 December 2013
corresponds most directly to the development or, alternatively, can determine that none of the land use categories in this Nexus Study adequately correspond to the development in question and may work in conjunction with other members of City staff to determine the applicable fee amounts based on trip DUE factors.

December 2013
Appendix B
Detailed Cost Allocation for Roadway and Intersection Improvements

Table B-1Summary of Roadway Segment Improvements and Costs in TDIF Program
From ToUltimate
Improvement 2035 CIPDescription
for Fees
City Obligation
for ExistingNew City
Development Total
1 Sunrise Blvd Rancho Cordova Pkwy New 6 Lanes 4 $2,582,000 $2,582,000 $2,134,000 $0 $2,134,000 $2,134,0002 Rancho Cordova Pkwy Centennial Dr New 4 Lanes 2 $1,975,000 $1,545,000 $1,545,000 $0 $1,545,000 $1,545,0003 Centennial Dr Americanos Blvd New 4 Lanes 2 $677,000 $530,000 $530,000 $0 $530,000 $530,0004 Americanos Blvd. White Rock Rd. New 4 Lanes 2 $1,241,000 $971,000 $971,000 $0 $971,000 $971,0007 Easton Valley Pkwy Folsom Blvd New 4 Lanes 2 $4,559,000 $4,350,000 $4,350,000 $0 $4,350,000 $4,350,0008 Douglas Rd Rancho Cordova Pkwy New 2 Lanes $0 $0 $0 $0 $0 $09 Rancho Cordova Pkwy Centennial Dr New 2 Lanes $0 $0 $0 $0 $0 $0
10 Centennial Dr Americanos Blvd New 2 Lanes $0 $0 $0 $0 $0 $011 Americanos Blvd White Rock Rd. New 2 Lanes $0 $0 $0 $0 $0 $019 Rancho Cordova Pkwy Rio Del Oro Pkwy New 6 Lanes $2,466,000 $2,466,000 $2,466,000 $0 $2,466,000 $2,466,00020 Rio Del Oro Pkwy Hazel Ave New 6 Lanes $3,434,000 $3,434,000 $3,434,000 $3,434,000 $3,434,000
24.1 International Dr Rio Del Oro Pkwy New 4 Lanes 2 $734,000 $574,000 $574,000 $0 $574,000 $574,00024.2 Rio Del Oro Pkwy Villagio Dr New 4 Lanes 2 $1,016,000 $795,000 $795,000 $0 $795,000 $795,00024.3 Villagio Dr Americanos Blvd New 4 Lanes 2 $1,524,000 $1,192,000 $1,192,000 $0 $1,192,000 $1,192,00024.4 Americanos Blvd Grant Line Rd New 4 Lanes 2 $3,217,000 $3,217,000 $3,217,000 $0 $3,217,000 $3,217,00025 Kiefer Blvd Chrysanthy Blvd. New 4 Lanes 2 $4,013,000 $3,276,000 $3,276,000 $0 $3,276,000 $3,276,00026 Chrysanthy Blvd. Douglas Rd. New 4 Lanes 2 $2,709,000 $2,119,000 $2,119,000 $0 $2,119,000 $2,119,00027 Douglas Rd Centennial Dr New 4 Lanes 2 $4,182,000 $3,408,000 $3,408,000 $0 $3,408,000 $3,408,00028 Centennial Dr Villagio Dr New 4 Lanes 2 $1,411,000 $1,104,000 $1,104,000 $0 $1,104,000 $1,104,00029 Villagio Dr Rio Del Oro New 4 Lanes 2 $1,411,000 $1,104,000 $1,104,000 $0 $1,104,000 $1,104,00030 Rio Del Oro International Dr. New 4 Lanes 2 $564,000 $441,000 $441,000 $0 $441,000 $441,00039 Old Placerville Rd US 50-Interchange At Ultimate $0 $0 $0 $0 $0 $040 US 50-Interchange Folsom Blvd At Ultimate $0 $0 $0 $0 $0 $045 Sunrise Blvd Rancho Cordova Pkwy New 4 Lanes $2,596,000 $2,596,000 $2,596,000 $0 $2,596,000 $2,596,00046 Rancho Cordova Pkwy Americanos Blvd New 4 Lanes $3,449,000 $3,449,000 $3,449,000 $0 $3,449,000 $3,449,00047 Americanos Blvd Grant Line Rd New 4 Lanes 2 $2,596,000 $2,031,000 $2,031,000 $0 $2,031,000 $2,031,00052 Coloma Rd Folsom Blvd Sunrise Blvd Improve Pavement $4,988,000 $4,988,160 $0 Not in fees $0 $0 $0
54.1 Eagles Nest Rd West City Limit Formerly part of 312.3 $2,843,000 $2,843,000 $2,843,000 $0 $2,843,000 $2,843,00055 West City Limit Sunrise Blvd. Widen to 6 Lanes $15,802,000 $15,802,000 $15,802,000 $0 $15,802,000 $15,802,00056 Sunrise Blvd Villagio Dr Widen to 6 Lanes 4 $1,040,000 $1,040,000 $734,000 $0 $734,000 $734,00057 Villagio Dr Rancho Cordova Pkwy Widen to 6 Lanes $2,698,000 $2,698,000 $2,698,000 $0 $2,698,000 $2,698,00058 Rancho Cordova Pkwy Americanos Blvd Widen to 6 Lanes 4 $5,828,000 $5,828,000 $4,411,000 $0 $4,411,000 $4,411,00059 Americanos Blvd Grant Line Rd Widen to 6 Lanes 4 $5,202,000 $4,446,000 $4,446,000 $0 $4,446,000 $4,446,00073 Femoyer St Mather Blvd International Dr Widen/New 4 Lanes $2,120,000 $1,210,000 $1,210,000 $0 $1,210,000 $1,210,00079 Bradshaw Rd Routier Rd. Improvements $17,019,000 $17,019,000 $0 Not in fees $0 $0 $080 Routier Rd Mather Field Rd. Improvements $8,370,000 $8,370,000 $0 $0 $0 $081 Mather Field Rd Coloma Rd. Improvements $6,417,000 $6,417,000 $0 $0 $0 $082 Coloma Rd Zinfandel Dr. Improvements $12,957,000 $12,957,000 $0 $0 $0 $083 Zinfandel Dr Kilgore Rd. Improvements $11,180,000 $11,180,000 $0 $0 $0 $084 Kilgore Rd Sunrise Blvd. Improvements $7,254,000 $7,254,000 $0 $0 $0 $085 Sunrise Blvd Mercantile Dr. Improvements $13,671,000 $13,671,000 $0 $0 $0 $086 Mercantile Dr Rancho Cordova Pkwy Improvements $9,765,000 $9,765,000 $0 $0 $0 $087 Rancho Cordova Pkwy Rio Del Oro Pkwy Improvements $18,414,000 $18,414,000 $0 $0 $0 $091 Gold Center Dr Zinfandel Dr Prospect Park Dr (East) Pavement $429,000 $429,000 $0 $0 $0
93Jackson Hwy Rancho Cordova Pkwy Widen to 6 Lanes Exprwy 4 (2 Sac Co) $4,556,000 $1,171,980 $845,640
Excludes County funding $0 $845,640 $845,640
94 Rancho Cordova Pkwy Kiefer Blvd. Widen to 6 Lanes Exprwy 4 (2 Sac Co) $4,934,000 $1,302,200 $939,600 $0 $939,600 $939,60095 Kiefer Blvd Chrysanthy Blvd. Widen to 6 Lanes Exprwy 4 (2 Sac Co) $16,452,000 $2,962,505 $2,137,590 $0 $2,137,590 $2,137,59096 Chrysanthy Blvd Douglas Rd. Widen to 6 Lanes Exprwy 4 (2 Sac Co) $5,124,000 $1,367,310 $986,580 $0 $986,580 $986,58097 Douglas Rd Centennial Dr Widen to 6 Lanes Exprwy $5,867,000 $1,920,745 $1,499,780 $0 $1,499,780 $1,499,78098 Centennial Dr City Limit Widen to 6 Lanes Exprwy $841,000 $585,990 $457,560 $0 $457,560 $457,560
Cost Allocation
NotesProject ID NO Roadway
Segment Description of Ultimate Improvement (General Plan
Roadway Sizing)
2035 CIP Lanes Based on Needs Analysis (Blank = Same as Ultimate)
Revised Lanes for Fees without
Thru Trips (Blank = Same as 2035 Needs)
Bradshaw Rd
Chrysanthy Blvd
Roadway Improvements
Estimated Cost (without frontage improvements)
Rio Del Oro Pkwy
Villagio Dr
Centennial Dr
Americanos Blvd
Easton Valley Pkwy
Not in fees
Douglas Rd
Folsom Blvd
Grant Line Rd
December 2013

Table B-1Summary of Roadway Segment Improvements and Costs in TDIF Program
From ToUltimate
Improvement 2035 CIPDescription
for Fees
City Obligation
for ExistingNew City
Development Total
Cost Allocation
NotesProject ID NO Roadway
Segment Description of Ultimate Improvement (General Plan
Roadway Sizing)
2035 CIP Lanes Based on Needs Analysis (Blank = Same as Ultimate)
Revised Lanes for Fees without
Thru Trips (Blank = Same as 2035 Needs)
Estimated Cost (without frontage improvements)
103 Bradshaw Rd Routier Rd. Widen to 6 Lanes Exprwy $19,262,000 $19,262,000 $19,262,000 $0 $19,262,000 $19,262,000104 Routier Rd McCuen Widen to 6 Lanes Exprwy $16,676,000 $16,676,000 $16,676,000 $0 $16,676,000 $16,676,000105 McCuen Airpark New 6 Lanes Exprwy $17,571,000 $17,571,000 $17,571,000 $0 $17,571,000 $17,571,000106 Airpark Zinfandel Dr. Non Capacity $1,068,000 $1,068,000 $0 Not in fees $0 $0 $0107 White Rock Rd Femoyer St. Not Used $0 $0 $0 $0 $0 $0108 Femoyer St Zinfandel Dr. Not Used $0 $0 $0 $0 $0 $0109 Zinfandel Dr Kilgore Rd. Non Capacity $1,399,000 $1,399,000 $0 Not in fees $0 $0 $0110 Kilgore Rd Sunrise Blvd. 6 Lanes New $13,815,721 $13,815,721 $13,815,721 $0 $13,815,721 $13,815,721111 Sunrise Blvd Rancho Cordova Pkwy New 4 Lanes $30,950,000 $30,950,000 $30,950,000 $0 $30,950,000 $30,950,000112 Rancho Cordova Pkwy Centennial Dr New 4 Lanes 2 $1,066,527 $1,066,527 $834,341 $0 $834,341 $834,341113 Centennial Dr Americanos Blvd New 4 Lanes 2 $474,000 $474,000 $371,000 $0 $371,000 $371,000114 Americanos Blvd White Rock Rd. New 4 Lanes $237,000 $237,000 $237,000 $0 $237,000 $237,000115 White Rock Rd City Limit New 4 Lanes 2 $3,558,000 $2,941,000 $2,038,000 $0 $2,038,000 $2,038,000116 City limit Rancho Cordova Pkwy New 6 Lanes 4 2 $2,965,000 $2,451,000 $1,698,000 $0 $1,698,000 $1,698,000
116.1 Rancho Cordova Pkwy Folsom South Canal No Fee Work $0 $0 $0 $0 $0 $0116.2 Folsom South Canal Mercantile Dr. $3,480,000 $3,480,000 $3,480,000 $0 $3,480,000 $3,480,000
124Jackson Hwy Sunrise Blvd Grant Line Rd. Widen to 6 Lanes Exprwy 4 $3,586,000 $3,586,000 $3,586,000
Excludes County funding $0 $3,586,000 $3,586,000
126 Grant Line Rd Kiefer Blvd. New 4 Lanes 2 $3,273,000 $2,560,000 $2,560,000 $0 $2,560,000 $2,560,000127 Kiefer Blvd Chrysanthy Blvd. New 4 Lanes $6,061,000 $6,061,000 $6,061,000 $0 $6,061,000 $6,061,000128 Chrysanthy Blvd Douglas Rd. New 6 Lanes 4 $1,734,000 $1,734,000 $1,734,000 $0 $1,734,000 $1,734,000129 Douglas Rd Villagio Dr New 6 Lanes 4 $3,499,000 $3,499,000 $3,499,000 $0 $3,499,000 $3,499,000130 Villagio Dr Rio Del Oro Pkwy New 6 Lanes 4 $1,667,000 $1,667,000 $1,667,000 $0 $1,667,000 $1,667,000131 Rio Del Oro Pkwy International Dr. New 6 Lanes $3,387,000 $3,387,000 $3,387,000 $0 $3,387,000 $3,387,000132 International Dr White Rock Rd. New 6 Lanes 4 $1,290,000 $1,290,000 $1,067,000 $0 $1,067,000 $1,067,000133 White Rock Rd International Dr. New 6 Lanes Exprwy $4,572,000 $4,572,000 $4,572,000 $0 $4,572,000 $4,572,000134 International Dr Easton Valley Pkwy New 6 Lanes Exprwy $847,000 $847,000 $847,000 $0 $847,000 $847,000142 Sunrise Blvd Rancho Cordova Pkwy New 4 Lanes $3,171,000 $3,171,000 $3,171,000 $0 $3,171,000 $3,171,000143 Rancho Cordova Pkwy Americanos Blvd New 4 Lanes 2 $2,674,000 $2,158,000 $2,158,000 $0 $2,158,000 $2,158,000
143.1 Americanos Blvd Grant Line Rd. New 4 Lanes 2 $621,000 $486,000 $486,000 $0 $486,000 $486,000144 International Dr White Rock Rd. Widen to 4 Lanes $693,000 $693,000 $693,000 $0 $693,000 $693,000145 White Rock Rd Sun Center Dr. Improve Pavement $169,000 $169,000 $0 Not in fees $0 $0 $0146 Sun Center Dr Folsom Blvd. Improve Pavement $338,000 $338,000 $0 $0 $0 $0147 McCuen (International) Whitehead (Mather Field) Widen to 4 Lanes $7,050,000 $7,050,000 $7,050,000 $0 $7,050,000 $7,050,000148 Whitehead (Mather Field) Femoyer St. Widen to 4 Lanes $4,502,000 $4,502,000 $4,502,000 $0 $4,502,000 $4,502,000149 Femoyer St Zinfandel Dr. New 4 Lanes $5,714,000 $5,714,000 $5,714,000 $0 $5,714,000 $5,714,000
151(Von Kaman & Whitehead)
- Mather BlvdMcCuen Improve 2 Way Couplet $422,000 $422,000 $0 Not in fees
$0 $0 $0152 McCuen Blvd Rockingham Rd. Non Capacity $428,000 $428,000 $0 $0 $0 $0153 Rockingham Rd US 50-Interchange Non Capacity $463,000 $463,000 $0 Not in fees $0 $0 $0154 US 50-Interchange Folsom Blvd. Widen to 6 Lanes 4 $1,527,000 $1,527,000 $0 $0 $0 $0
162Rockingham Rd
Mather Blvd. (Old Placerville Rd.)
Mather Field Rd. Improve Pavement Only $1,428,000 $1,428,000 $0 Not in fees$0 $0 $0
166 Old Placerville Rd Hwy. 50 Widen to 4 Lanes 2 $2,705,000 $0 $0 $0 $0 $0
166.1 At Hwy 50 At Hwy 50 Widen Structure to 4 Lanes 2 $5,040,000 $0 $0 $0 $0 $0
166.2 Hwy 50 Folsom Widen to 4 Lanes 2 $998,000 $0 $0 $0 $0 $0172 Kilgore Rd Sunrise Blvd. At Ultimate $0 $0 $0 $0 $0 $0
173 Sunrise Blvd Folsom South Canal / City
LimitNew Canal Crossing (Post
2035)$10,555,000 $0 $0 Not in fees $0 $0 $0
International Dr
Mather Field Rd
Routier Rd
Sun Center Dr
Rancho Cordova Pkwy
Kiefer Blvd
Kilgore Rd
Mather Blvd
Old Placerville Rd
December 2013

Table B-1Summary of Roadway Segment Improvements and Costs in TDIF Program
From ToUltimate
Improvement 2035 CIPDescription
for Fees
City Obligation
for ExistingNew City
Development Total
Cost Allocation
NotesProject ID NO Roadway
Segment Description of Ultimate Improvement (General Plan
Roadway Sizing)
2035 CIP Lanes Based on Needs Analysis (Blank = Same as Ultimate)
Revised Lanes for Fees without
Thru Trips (Blank = Same as 2035 Needs)
Estimated Cost (without frontage improvements)
177 Jackson Hwy Kiefer Blvd. Widen to 6 Lanes $10,364,000 $10,364,000 $9,679,000 $774,320 $8,904,680 $9,679,000
178 Kiefer Blvd Chrysanthy Blvd. Widen to 6 Lanes $7,732,000 $7,732,000 $7,732,000 $1,337,636 $6,394,364 $7,732,000
179 Chrysanthy Blvd Douglas Rd. Widen to 6 Lanes $4,158,700 $4,158,700 $4,158,700 $632,122 $3,526,578 $4,158,700180 Douglas Rd Rio Del Oro Pkwy No Fee Work $0 $0 $0 $0 $0 $0181 Rio Del Oro Pkwy Fitzgerald Rd. Widen to 6 Lanes $3,275,000 $3,275,000 $3,275,000 $0 $3,275,000 $3,275,000182 Fitzgerald Rd International Dr. (Monier) 6 Lane Special $2,966,000 $2,966,000 $2,966,000 $0 $2,966,000 $2,966,000183 International Dr. (Monier) White Rock Rd. 6 Lane Special $1,711,000 $1,711,000 $1,711,000 $0 $1,711,000 $1,711,000184 White Rock Rd Sun Center Dr. 6 Lane Special $4,983,000 $4,983,000 $4,983,000 $0 $4,983,000 $4,983,000185 Sun Center Dr Folsom Blvd. 6 Lane Special $3,236,000 $3,236,000 $3,236,000 $0 $3,236,000 $3,236,000
186 Folsom Blvd US 50-Interchange All work contained in 319.1 $0 $0 $0
Existing deficiency $0 $0 $0
187 US 50-Interchange Zinfandel Dr. All work contained in 319.1 $0 $0 $0 $0 $0 $0188 Zinfandel Dr Coloma Rd. All work contained in 319.1 $0 $0 $0 $0 $0 $0189 Coloma Rd Gold Country Blvd. 6 Lane Special $2,023,000 $2,023,000 $2,023,000 $1,082,305 $940,695 $2,023,000190 Gold Country Blvd American River 6 Lane Special $1,020,000 $1,020,000 $1,020,000 $607,920 $412,080 $1,020,000191 International Dr Capitol Center Drive. Improve Pavement Only $979,000 $979,000 $0 Not in fees $0 $0 $0192 Capitol Center Drive Zinfandel Dr. Improve 4 Lanes add Median $425,000 $425,000 $0 $0 $0 $0193 Zinfandel Dr Kilgore Rd. At Ultimate $0 $0 $0 $0 $0 $0
194 Kilgore Rd Sunrise Blvd. Improve 6 Lanes add Median $534,000 $534,000 $534,000 $0 $534,000 $534,000
196 Sunrise Blvd Rancho Cordova Pkwy Widen to 6 Lanes $4,197,000 $4,197,000 $4,197,000 $0 $4,197,000 $4,197,000
197 Rancho Cordova Pkwy City Limit Widen to 6 Lanes $12,926,000 $12,926,000 $12,926,000 $0 $12,926,000 $12,926,000203 Douglas Rd City Limit Formerly part of 312.3 $4,816,000 $4,816,000 $4,816,000 $0 $4,816,000 $4,816,000
203.1 City Limit North Mather Blvd. At Ultimate $0 $0 $0 $0 $0 $0204 North Mather Blvd International Dr. At Ultimate $0 $0 $0 $0 $0 $0205 International Dr White Rock Rd. At Ultimate $0 $0 $0 $0 $0 $0206 White Rock Rd US 50-Interchange All work contained in 318.1 $0 $0 $0 $0 $0 $0207 US 50-Interchange Folsom Blvd. Widen to 6 Lanes $0 $0 $0 Not in fees $0 $0 $0208 Folsom Blvd Sunrise Blvd. Sidewalk Improvements $541,000 $541,000 $0 $0 $0 $0
Total $486,949,948 $429,855,838 $302,690,512 $4,434,303 $298,256,209 $302,690,512
COMPLEXES
318.1Zinfandel Drive White Rock Road US-50 Interchange Zinfandel Dr Complex $51,449,000 $51,449,000 $51,449,000
Existing deficiency $24,776,152 $26,672,848 $51,449,000
319.2Sunrise Blvd Folsom Boulevard Fair Oaks Boulevard Sunrise Blvd. Complex $298,832,000 $298,832,000 $298,832,000
Existing deficiency $248,832,000 $50,000,000 $298,832,000
Source: DKS Associates, 2012
White Rock Rd
Zinfandel Dr
Sunrise Blvd
Excludes assumed County
funding
December 2013

Table B-2Summary of Intersection and Interchange Improvements and Costs in TDIF Program
Ultimate Improvement 2035 CIP
Description for Fees
City Obligation
New City Development Total
209 Rio del Oro Pkwy / Sunrise Blvd 6 x 6 Tee 4 x 6 Tee $1,174,000 $1,174,000 $1,117,000 $0 $1,117,000 $1,117,000210 Rio del Oro Pkwy / Rancho Cordova Pkwy 6 x 6 New 4 x 4 New $1,854,000 $1,624,000 $1,624,000 $0 $1,624,000 $1,624,000211 Rio del Oro Pkwy / International Dr 4 x 4 New 2 x 2 New $1,547,000 $1,347,000 $1,347,000 $0 $1,347,000 $1,347,000212 Rio del Oro Pkwy / Americanos Rd 4 x 4 New 2 x 2 New $1,547,000 $1,347,000 $1,347,000 $0 $1,347,000 $1,347,000213 Rio del Oro Pkwy / White Rock Rd 4 x 6 2x4 $1,055,000 $847,000 $847,000 $0 $847,000 $847,000215 Rio del Oro Pkwy / Easton Valley Pkwy 4 x 6 New $1,620,000 $0 $0 $0 $0216 Rio del Oro Pkwy / Folsom Blvd 4 x 4 $1,138,000 $0 $0 $0 $0217 Villagio Dr / Douglas Rd 4 x 6 Tee 2 x 6 Tee 2 x 4 Tee $1,404,000 $1,336,000 $1,149,000 $0 $1,149,000 $1,149,000218 Villagio Dr / Rancho Cordova Pkwy 4 x 6 New 2 x 4 New $1,620,000 $1,412,000 $1,412,000 $0 $1,412,000 $1,412,000219 Villagio Dr / International Dr 4 x 4 New 2 x 2 New $1,547,000 $1,347,000 $1,347,000 $0 $1,347,000 $1,347,000220 Villagio Dr / Americanos Blvd 4 x 4 New 2 x 2 New $1,547,000 $1,347,000 $1,347,000 $0 $1,347,000 $1,347,000221 Villagio Dr / White Rock Rd 4 x 6 2 x 4 $888,000 $680,000 $680,000 $0 $680,000 $680,000226 Easton Valley Pkwy / Rancho Cordova Pkwy Urban Interchange $30,400,000 $30,400,000 $30,400,000 $0 $30,400,000 $30,400,000
227 Easton Valley Pkwy / Hazel AvePartial Grade Separation
$0 $0 $0$0 $0
230.1 7th at Folsom Blvd 4 x 4 Tee 2 x 4 Tee $0 $0 $0 Not in City $0 $0 $0230.2 Centennial Dr / International Dr 4 x 4 Tee 2 x 4 Tee 2 x 2 Tee $1,138,257 $1,445,126 $988,710 $0 $988,710 $988,710230.3 Centennial Dr / Americanos Blvd 4 x 4 2 x 2 New $1,547,000 $1,347,000 $1,347,000 $0 $1,347,000 $1,347,000230.4 Centennial Dr / Grant Line Rd 4 x 2 x 6 x 6 2 x 6 $1,900,000 $1,790,000 $1,790,000 $0 $1,790,000 $1,790,000231 Americanos Blvd / Keifer Blvd 4 x 4 Tee New 2 x 2 Tee New $1,138,000 $989,000 $989,000 $0 $989,000 $989,000232 Americanos Blvd / Chrysanthy Blvd 4 x 4 New 2 x 2 New $1,547,000 $1,347,000 $1,347,000 $0 $1,347,000 $1,347,000233 Americanos Blvd / Douglas Rd 4 x 6 2 x 4 $1,459,000 $1,251,000 $1,251,000 $0 $1,251,000 $1,251,000234 Americanos Blvd / International Dr 4 x 4 New 2 x 4 $1,547,000 $1,445,000 $1,445,000 $0 $1,445,000 $1,445,000
240 Bradshaw Rd / Old Placerville Rd 6 x 6 Tee 4 x 6 Tee$1,383,000 $1,383,000 $0
Existing deficiency; no improvement necessary without thru trips $0 $0 $0
245 Chrysanthy Blvd / Sunrise Blvd 4 x 6 2 x 6 $2,510,000 $2,510,000 $1,719,000 $0 $1,719,000 $1,719,000246 Chrysanthy Blvd / Rancho Cordova Pkwy 4 x 4 x 4 x 6 New 4 x 4 2 x 4 $1,826,000 $1,826,000 $1,692,000 $0 $1,692,000 $1,692,000247 Chrysanthy Blvd / Grant Line Rd 4 x 2 x 6 x 6 2 x 6 2 x 4 $1,505,000 $1,505,000 $1,406,000 $0 $1,406,000 $1,406,000251 Coloma Rd / Sunrise Blvd Sunrise Viaduct $0 $0 $0 Existing deficiency $0 $0 $0252 Douglas Rd/Zinfandel (was part of 312.3) 4x6 $3,004,000 $3,004,000 $3,004,000 $0 $3,004,000 $3,004,000
253 Douglas Rd / Sunrise Blvd Urban Interchange Lt Turn Separation Lt Turn Separation $19,480,000 $2,603,000 $2,603,000 Developer funded portion reduced to cost of 6x6 at-grade improvement $0 $2,603,000 $2,603,000
254 Douglas Rd / Rancho Cordova Pkwy 6 x 6 6 x 4 4 x 4 $2,530,000 $2,415,000 $2,415,000 $0 $2,415,000 $2,415,000255 Douglas Rd / Grant Line Rd 4 x 6 4 x 4 $1,557,000 $1,557,000 $1,484,000 Excludes assumed portion funded by Co $0 $1,484,000 $1,484,000265 Femoyer St / International Dr 4 x 6 $1,364,000 $1,364,000 $1,364,000 $0 $1,364,000 $1,364,000
267.2 Folsom Blvd / Bradshaw Rd 4 x 6 $1,620,000 $1,620,000 $1,620,000 $0 $1,620,000 $1,620,000267.3 Folsom Blvd / Routier Rd 4 x 6 4 x 2 $1,620,000 $1,412,000 $1,412,000 $0 $1,412,000 $1,412,000267.4 Folsom Blvd / Mather Field Rd 4 x 6 4 x 4 $1,620,000 $1,620,000 $1,547,000 Existing deficiency $0 $1,547,000 $1,547,000267.5 Folsom Blvd / Coloma Rd 4 x 4 Tee $1,138,000 $1,138,000 $1,138,000 $0 $1,138,000 $1,138,000267.6 Folsom Blvd / Zinfandel Dr 4 x 4 $1,547,000 $1,547,000 $1,547,000 $0 $1,547,000 $1,547,000268 Folsom Blvd / Sunrise Blvd Enhanced at Grade $2,000,000 $2,000,000 $2,000,000 $0 $2,000,000 $2,000,000270 Gold Country Blvd / Sunrise Blvd Sunrise Viaduct $0 $0 $0 Existing deficiency $0 $0 $0273 Grant Line Rd / Jackson Hwy 6 x 6 6 x 4 4 x 4 $833,350 $833,350 $833,350 Excludes assumed portion funded by Co $120,836 $712,514 $833,350274 Grant Line Rd / Rancho Cordova Pkwy 6 x 4 Tee 6 x 2 4 x 2 $1,054,000 $1,321,000 $1,149,000 $0 $1,149,000 $1,149,000275 Grant Line Rd / Keifer Blvd. 6 x 4 Tee 6 x 2 4 x 2 $1,198,000 $1,385,000 $1,198,000 Excludes assumed portion funded by Co $0 $1,198,000 $1,198,000278 Old Placerville Rd / Routier Rd 6 x 6 6 x 2 $3,031,000 $2,717,000 $2,717,000 $0 $2,717,000 $2,717,000
278.1 Old Placerville / McCuen extension 6 x 4 x 6 Tee $5,201,000 $5,201,000 $5,201,000 $0 $5,201,000 $5,201,000278.2 Old Placerville Rd / Rockingham At Ultimate $0 $0 $0 $0 $0 $0
Project ID NO
Description of Ultimate
Improvement
2035 CIP Lanes Based on Needs Analysis (Blank = Same as Ultimate)
Revised Lanes for Fees without
Thru Trips (Blank = Same as 2035 Needs)
Estimated Cost
NotesIntersections
Intersection
Cost Allocation
December 2013

Table B-2Summary of Intersection and Interchange Improvements and Costs in TDIF Program
Ultimate Improvement 2035 CIP
Description for Fees
City Obligation
New City Development Total
Project ID NO
Description of Ultimate
Improvement
2035 CIP Lanes Based on Needs Analysis (Blank = Same as Ultimate)
Revised Lanes for Fees without
Thru Trips (Blank = Same as 2035 Needs)
Estimated Cost
NotesIntersection
Cost Allocation
279 International Dr / Mather Blvd 6 x 4 $1,620,000 $1,620,000 $1,620,000 $0 $1,620,000 $1,620,000279.1 Mather Blvd / Mather Field Rd 4 x 4 $5,351,000 $5,351,000 $5,351,000 $0 $5,351,000 $5,351,000279.2 Mather Blvd / Femoyer St 4 x 4 x 4 x 2 $5,480,000 $5,480,000 $5,480,000 $0 $5,480,000 $5,480,000279.3 Mather Blvd / Zinfandel Dr At Ultimate $0 $0 $0 $0 $0 $0280 International Dr. / Mather Field Rd 6 x 6 $9,994,000 $9,994,000 $9,994,000 $0 $9,994,000 $9,994,000
280.1 International Dr / McCuen extension 4 x 6 x 6 Tee $6,168,000 $6,168,000 $6,168,000 $0 $6,168,000 $6,168,000281 International Dr. / Zinfandel Dr 6 x 6 $0 $0 $0 $0 $0 $0282 International Dr / Kilgore Rd 6 x 4 $524,000 $524,000 $524,000 $0 $524,000 $524,000
283 International Dr / Sunrise Blvd. Urban Interchange Lt Turn Separation Lt Turn Separation $50,123,000 $19,480,000 $19,480,000Developer funded portion reduced to cost
of 6x6 at-grade improvement $15,666,000 $3,814,000 $19,480,000284 International Dr / Rancho Cordova Pkwy 6 x 4 x 6 x 6 New 4 x 6 $1,739,000 $1,739,000 $1,739,000 $0 $1,739,000 $1,739,000
284.1 International Dr / White Rock Rd 4 x 6 x 6 x 6 New 4 x 6 2x4 $1,146,000 $1,146,000 $857,000 $0 $857,000 $857,000284.2 International Dr / Rancho Cordova Pkwy 6 x 6 Tee New 2 x 6 $1,390,000 $1,289,000 $1,289,000 $0 $1,289,000 $1,289,000288 Jackson Hwy / Sunrise Blvd 6 x 6 4 x 6 $9,139,000 $9,005,000 $8,872,000 Existing deficiency $558,936 $8,313,064 $8,872,000289 Rancho Cordova Pkwy / Keifer Blvd 4 x 4 2 x 2 $1,547,000 $1,347,000 $1,347,000 $0 $1,347,000 $1,347,000290 Rancho Cordova Pkwy / White Rock Rd Enhanced at Grade $6,003,000 $6,003,000 $6,003,000 $0 $6,003,000 $6,003,000
290.1 Rancho Cordova Pkwy at Sun Center 6 x 2 Tee $1,015,000 $1,015,000 $1,015,000 $0 $1,015,000 $1,015,000294 Keifer Blvd / Sunrise Blvd 4 x 6 $1,864,000 $1,864,000 $1,864,000 $0 $1,864,000 $1,864,000295 Mather Field Rd / Rockingham Rd 6 x 4 $0 $0 $0 $0 $0 $0297 Sun Center Dr / Sunrise Blvd At Ultimate $0 $0 $0 $0 $0 $0
299 Sunrise Blvd / White Rock Rd. Urban Interchange$19,480,000 $10,500,000 $10,500,000
Developer funded portion reduced to cost of at-grade improvement $0 $10,500,000 $10,500,000
300 Sunrise Blvd / Zinfandel Dr Sunrise Viaduct $0 $0 $0 Existing deficiency $0 $0 $0301 Sunrise Blvd / Gold Express Dr Sunrise Viaduct $0 $0 $0 Existing deficiency $0 $0 $0302 White Rock Rd. / Zinfandel Dr. Contained in 318.1 $0 $0 $0 $0 $0 $0
267.25 Bradshaw Rd LRT Grade Sep $12,500,000 $12,500,000 $12,500,000 $6,250,000 $6,250,000 $12,500,000267.35 Routier Rd LRT Grade Sep $25,000,000 $25,000,000 $25,000,000 $12,500,000 $12,500,000 $25,000,000267.45 Mather Field Rd LRT Grade Sep $25,000,000 $25,000,000 $25,000,000 $12,500,000 $12,500,000 $25,000,000267.65 Zinfandel Dr LRT Grade Sep $25,000,000 $25,000,000 $25,000,000 $12,500,000 $12,500,000 $25,000,000
Total Ints $323,721,607 $261,461,476 $257,427,060 $60,095,772 $197,331,288 $257,427,060
313 Rancho Cordova Parkway /US 50 New Interchange $110,000,000 $110,000,000 $110,000,000 $0 $110,000,000 $110,000,000316 Bradshaw Rd. / US 50 Interchange Mod $10,000,000 $10,000,000 $10,000,000 $0 $10,000,000 $10,000,000317 Mather Field Rd / US 50 Interchange Mod $20,000,000 $20,000,000 $20,000,000 $0 $20,000,000 $20,000,000
Total Intx $140,000,000 $140,000,000 $140,000,000 $0 $140,000,000 $140,000,000
Source: DKS Associates, 2012
Interchanges
Developer funded portion reduced from nexux-based calcualtion
December 2013

December 2013
Appendix C
Improvement Cost Estimation Methodology

TECHNICAL MEMORANDUM TO: City of Rancho Cordova FROM: Mark Rayback P.E., Project Manager Steven Robinson P.E., Project Engineer DATE: December 6, 2013 SUBJECT: Rancho Cordova Fee Program 2013 Update: Unit Cost and Cost Estimate
Methodology Wood Rodgers was tasked by the City of Rancho Cordova (City) to update the roadway and intersection cost estimates with current 2013 construction costs for use in the 2013 Fee Program update. This memorandum summarizes the methodology used to develop the item unit costs and cost estimates.
UNITCOSTS The City provided Wood Rodgers with cost estimates and bid results (dated between March 2011 and March 2013) from 14 different projects located in the Sacramento area. These 14 projects consisted of a wide range of project types, including the Suncreek and Cordova Hills Specific Plans, various County of Sacramento roadway improvement projects, a City of Folsom landscaping project, and the State Route 99/Elverta Road interchange. Using a construction item list that was consistent with previous cost assumptions, along with a few new items needed for phasing purposes, Wood Rodgers extracted the unit costs from the provided bids and cost estimates and compiled them into a single spreadsheet. This spreadsheet is provided in Attachment 1. Not every bid and estimate had every construction item, so only those items that were in the bid and estimate are included in the spreadsheet. Also, the costs were provided in a variety of different price per units. For example, within the 14 bids/estimates, Aggregate Base was priced per Square Foot, per Cubic Yard, and per Ton. To be consistent, each cost was converted into the same price per unit as those used in the City’s previous unit cost evaluation. For each item, the minimum, maximum, and average unit cost was calculated from the compiled costs. Some of the costs from the bids and estimates were significantly higher or lower than the overall average unit cost. These costs were considered to be outside of the reasonable cost range for the item, and were removed from the unit cost calculations. These values are shown in red in Attachment 1. Comparing the minimum, maximum, and average unit costs, Wood Rodgers used its engineering judgment to determine a unit cost for each construction item. These costs are shown in Attachment 1 under the column “Proposed Unit Cost.” Costs were included for items both within the Fee portion and the Developer portion of the roadways and intersections.

2 | P a g e
UNIT COSTS FROM OTHER SOURCES A few costs could not be directly determined from the provided cost estimates and bid results because they were either not provided, or insufficient information was available to compare (e.g. a different cost breakdown was used, only one cost was available, etc.). For these few items, Wood Rodgers used costs from other recent project estimates Wood Rodgers has prepared and recent Caltrans bid results to develop a unit cost. The unit cost for storm drain system was developed assuming a storm drain main of 24-inch reinforced concrete pipe at $85 per linear foot, 2 drain inlets (DI) at a cost of $2,500 each, 12-inch lateral pipes at $70 per linear foot (assumed 60-foot wide road), and one manhole at $4,000, all of which occurs over 500 feet of roadway. ($85/Ft 24” Pipe x 500 Ft + $2,500 x 2 DI + $70/Ft 12” Pipe x 60 Ft + $4,000 Manhole) / 500 Ft ≈ $112 per foot
Only two cost estimates included costs for frontage street lighting, and Wood Rodgers believes both to be low. Based on several roadway projects Wood Rodgers has recently been involved with, we have found street lights to cost between $5,000 and $7,000 each. City street lighting standards require street lights to be spaced approximately 180 feet apart. At this spacing, 10 street lights will be needed for every 1,000 feet of road (5 each side).
($5,000 x 10 Street Lights) / 1,000 feet = $50 per foot
The cost for Storm Water Pollution Prevention Plan (SWPPP) was always a lump sum cost in the bids/estimates, which was of little use in establishing a unit cost. The City’s 2007 unit cost evaluation had a price of $9 per linear foot. However, new regulations put in place since 2007 have increased the cost of implementing a SWPPP. It is difficult to put an overall price on a SWPPP, as every project will have different requirements and costs. However, it is Wood Rodgers judgment that the new regulations could double the cost of implementing a SWPPP from what it would have cost before, hence the proposed unit price of $18 per linear foot.
ROADWAYCOSTESTIMATES The City provided Wood Rodgers the roadway segment calculation spreadsheet used in the 2007 unit cost evaluation. This spreadsheet was set up to calculate the Fee and Developer funded portions of the cost per foot of a typical 2-lane, 4-lane, and 6-lane roadway section. Using this spreadsheet as a template, Wood Rodgers created new 4-lane and 6-lane roadway sections based on possible phased construction per DKS Associates new future traffic demand model. New quantities were calculated for each new phase, and the updated 2013 item unit costs were applied to calculate an overall roadway cost per linear foot. Asphalt concrete and aggregate base thicknesses were assumed to be the same as those used in 2007. The new detailed phased roadway cost calculations are shown in Attachment 2 and are highlighted in blue. Wood Rodgers also updated the unit costs for the roadway sections that widen or rehabilitate an existing road, but did not modify the quantities. These are also shown in Attachment 2 but are not highlighted.

3 | P a g e
DEVELOPER FUNDED PORTION Consistent with the assumptions used in the previous cost evaluation, it was assumed that the Developer funded portion of the roadway consists of the outside frontage landscaping, curb, gutter, sidewalk, and street lighting. Also included is the outside 15 feet of roadway, consisting of any asphalt concrete, aggregate base, striping, and storm drainage. The Developer funded portion includes all excavation and clearing and grubbing required between the right of way line and the outside 15 feet of roadway. It is assumed that the Developer will be responsible for drain inlets and storm drain laterals between the drain inlet and main storm drain pipe. Since the cost of drain inlets and laterals is small compared to the cost of the main pipe on a per foot basis (the main pipe is assumed to be within the Fee portion of the roadway), the Developer’s portion of the storm drain cost has been set at $12 per foot. The Developer funded portion of the SWPPP is assumed to be 50 percent of the total SWPPP cost when roadwork is required by both the City (Fee) and the Developer on the same phase. The Developer is assumed to cover the entire cost of the storm drain system and SWPPP when no City (Fee) work is required, such as on 2-lane roads. FEE FUNDED PORTION The Fee funded portion of the roadway consists of all roadway and features not included in the Developer funded portion, which includes the No. 1 lanes and median on a 4-lane roadway, and the No. 1 and No. 2 lanes and median on a 6-lane roadway. Included in this work is the roadway excavation and clear and grubbing for those lanes and median, asphalt concrete (AC), aggregate base (AB), median curb, temporary and permanent median landscaping, striping, and remaining storm drain system not included in the Developer funded portion. The Fee funded portion of the SWPPP is assumed to be 50 percent of the total SWPPP cost when roadwork is required by both the City (Fee) and the Developer on the same phase. However, the Fee is assumed to pay the entire SWPPP cost during any phase that does not include Developer work. Also included in the Fee funded portion is an item for signal interconnect. Unless otherwise noted in Attachment 2, a 20 percent contingency is included on all roadway sections that involve widening to cover stage construction/traffic handling and any unknown costs that may arise from widening an existing road. ROADWAY PHASING It is assumed that if a roadway is phased (i.e. only partially built at first and then widened in the future), the outside lanes would be constructed first, with the inside lane(s) constructed in the future. This results in the Developer funded portion of the roadway always being constructed under Phase 1. This also requires that the storm drain system always be constructed under Phase 1, as the gutter and DI’s installed by the Developer need the main storm drain pipe to drain to. It is also assumed that signal interconnect is installed in Phase 1, as most if not all major intersections will be signalized in the first phase. When a roadway is phased, the Fee funded portion will include a two foot wide inside paved shoulder and AC dike to separate the roadway from the median. Median area intended to be converted to roadway in a future phase will be minimally landscaped with temporary plants and/or ground cover. The portion of the median that is intended to always be median (permanent) will be landscaped with permanent plants and ground cover.

4 | P a g e
For each future phase, the temporary median being converted to roadway will require excavation, clearing and grubbing, AC, AB, striping of the new lane, and median curb if it is the final phase or AC dike if it is not. A new SWPPP is also assumed to be required at full cost to the Fee. A 20 percent contingency is included on all future phases to cover stage construction/traffic handling and any unknown costs that may arise from widening an existing road.
INTERSECTIONCOSTESTIMATES The intersection cost estimates were developed to provide a single total cost for each intersection configuration. Intersection costs include any and all features on each leg of the roadway within 450 feet of the center of the intersection. Similar to the roadway estimates, a spreadsheet was set up to calculate the Fee and Developer funded portions for each intersection configuration per DKS Associates new future traffic demand model. Phased construction of the intersection has been considered, and it is assumed that no intersection would ever have more than two construction phases. New quantities were calculated for up to two phases for each intersection configuration, and the updated 2013 item unit costs were applied to calculate a total intersection cost. The detailed intersection cost calculations are shown in Attachment 3. Based on direction from the City, it is assumed that only a 4x4 intersection or 4x4 Tee intersection would have right turn lanes with “pork chop” raised median islands. No other configuration would have such islands. DEVELOPER FUNDED PORTION Consistent with the assumptions used in the previous cost evaluation, it is assumed that the Developer funded portion of the intersection consists of the outside frontage landscaping, curb, gutter, sidewalk (see Fee Funded Portion for exception), and street lighting. Also included is the outside 15 feet of roadway, consisting of any asphalt concrete, aggregate base, striping, and storm drainage. The Developer funded portion includes all excavation and clearing and grubbing required between the right of way line and the outside 15 feet of roadway. It is assumed that the Developer will be responsible for drain inlets and storm drain laterals between the drain inlet and main storm drain pipe. Since the cost of drain inlets and laterals is small compared to the cost of the main pipe on a per foot basis (the main pipe is assumed to be within the Fee funded portion of the roadway), the Developer funded portion of the storm drain cost is set at $12 per foot. The Developer funded portion of the SWPPP is assumed to be 50 percent of the total SWPPP cost when roadwork is required by both the City (Fee) and the Developer on the same phase. The Developer is assumed to cover the entire cost of the storm drain system and SWPPP when no City (Fee) work is required, such as on 2-lane roads. FEE FUNDED PORTION The Fee funded portion of the intersection consists of all construction items not included in the Developer funded portion. Included in this work is the roadway excavation and clearing and grubbing for the inside lanes and median, AC, AB, median curb, temporary and permanent median landscaping, striping, and remaining storm drain system not included in the Developer funded portion. Also included is the curb, gutter, and sidewalk at the curb returns, plus 25 feet in

5 | P a g e
either direction. The Developer funded portion does not include this 70± feet of hardscape. The “pork chop” raised median islands on 4x4 intersections are also included in the Fee funded portion. The Fee funded portion of the SWPPP is assumed to be 50 percent of the total SWPPP cost when roadwork is required by both the City (Fee) and the Developer on the same phase. However, the Fee is assumed to pay the entire SWPPP cost during any phase that does not include Developer work. Also included in the Fee funded portion is an item for signal interconnect and all traffic signal costs. INTERSECTION PHASING It is assumed that if an intersection is phased, the outside lanes would be constructed first, with the inside lane(s) constructed in the future. This results in the Developer funded portion of the intersection always being constructed under Phase 1. This also requires that the storm drain system always be constructed under Phase 1, as the gutter and DI’s installed by the Developer need the main storm drain pipe to drain to. It is also assumed that signal interconnect and traffic signal is installed in Phase 1, as it is expected that most if not all major intersections will be signalized in the first Phase. When an intersection is phased, the Fee funded portion will include a two foot wide inside paved shoulder and AC dike on the travel lanes approaching the intersection to separate the roadway from the median. Median area intended to be converted to roadway in a future phase will be minimally landscaped with temporary plants and/or ground cover. The portion of the median that is intended to always be median (permanent) will be landscaped with permanent plants and ground cover. For each future phase, the temporary median being converted to roadway will require excavation, clearing and grubbing, AC, AB, striping of the new lane, and median curb if it is the final phase or AC dike if it is not. A new SWPPP is also assumed to be required at full cost to the Fee. It is also assumed that any future phase will require signal modification to accommodate the additional travel lanes (e.g. extending a mast arm, adding or moving a signal head, etc.), so a signal modification cost is included. A 20 percent contingency is included on all future phases to cover stage construction/traffic handling and any unknown costs that may arise from widening an existing road.
ATTACHMENTS Attachment 1 – Unit Cost Comparison Attachment 2 – Roadway Segment Cost Estimates Attachment 3- Intersection Cost Estimates

ATTACHMENT 1
UNIT COST COMPARISON

ATTACHMENT 1 UNIT COST AND COST ESTIMATE METHODOLOGY
ITEM UNITCALTRANS/
WR
SUNCREEK SP(MACKAY &
SOMPS)
Estimate Bid 1 Bid 2 Bid 3 Bid 1 Bid 2 Bid 3 Bid 4 Bid 5 Bid 1 Bid 2 Bid 3 Bid 4 Bid 5 Bid 6 Bid 7 Bid 8 Bid 9
Clearing and Grubbing SF $0.10 $0.10
Roadway Excavation CY $12.00 $5.00 $1.00 $10.00 $17.00 $8.50 $18.00 $8.00 $15.00 $11.00
6" Asphalt Concrete SF $3.50 $3.24 $3.64 $3.38 $3.56 $2.60 $2.52 $2.91 $3.56 $3.29 $3.87 $3.56 $3.87 $5.04 $5.42 $4.49 $5.46 $5.73 $7.17
6.5" Asphalt Concrete SF $3.75 $3.51 $3.93 $3.65 $3.85 $2.80 $2.72 $3.14 $3.85 $3.56 $4.19 $3.85 $4.19 $5.44 $5.86 $4.86 $5.90 $6.20 $7.74
14" Aggregate Base SF $1.30 $1.61 $1.65 $1.36 $1.10 $1.12 $1.08 $1.53 $1.59 $1.72 $2.78 $2.97 $2.54 $4.24 $8.06 $5.09 $5.60 $6.62 $6.79
16" Aggregate Base SF $1.50 $1.84 $1.88 $1.54 $1.25 $1.27 $1.23 $1.74 $1.81 $1.98 $3.16 $3.38 $2.89 $4.82 $9.16 $5.79 $6.36 $7.52 $7.71
AC Dike (Type A) LF $3.00 $2.00 $4.00 $4.50
Curb & Gutter (Type 2) LF $24.00 $18.00 $39.80 $24.00 $41.00 $23.10 $18.50 $31.00 $16.00 $37.00 $31.00
Curb (Type 3) LF $16.00 $14.00 $17.00 $18.00 $22.00 $18.90 $17.00 $23.00 $18.00 $27.00 $22.00
Curb (Type 4) LF $16.00 $13.00 $9.00 $12.00 $25.00 $12.50 $16.00 $13.00 $21.50 $12.00 $11.00 $13.00 $18.00 $20.00
Thermoplastic Striping LF $0.75 $1.00 $0.90 $0.80 $0.75 $1.00 $0.75 $0.88 $0.75 $1.05 $1.00 $1.50 $1.35 $1.26 $1.27 $1.23 $1.56 $1.16
Storm Drain (2 DI,MH & DI lead @ 500', 1lf 24"D/lf Road) LF $100.00 $100.00 $116.00 $118.00
Median Landscaping and Irrigation (Permanent) SF $7.00 $4.00
Median Landscaping (Temporary) SF $3.00
Median PCC Island SF $6.75 $8.00
Sidewalk (7' wide) SF $6.75 $4.00 $8.00 $6.15 $6.50 $8.00 $4.50 $3.30 $8.50 $4.00 $6.00 $6.50
Frontage Landscaping SF $7.00 $4.50
Frontage Street Lighting (Cost per LF of Road) LF $50.00 $25.00
New Traffic Signal (Cost per Leg) EA $50,000.00 $53,000.00 $55,000.00 $50,000.00
Modify Traffic Signal (Cost per Leg) EA
Traffic Signal Interconnect LF $12.00 $6.00SWPPP LF $18.00
COUNTY OF SACRAMENTOWHITE ROCK ROAD WIDENING
APRIL 2012
COUNTY OF SACRAMENTOELVERTA INTERCHANGE
APRIL 2012
COUNTY OF SACRAMENTOFAIR OAKS BLVD AT MARCONI AVE IMPROVEMENT
FEBRUARY 2012
ITEM UNIT
Clearing and Grubbing SFRoadway Excavation CY
6" Asphalt Concrete SF
6.5" Asphalt Concrete SF
14" Aggregate Base SF
16" Aggregate Base SF
AC Dike (Type A) LF
Curb & Gutter (Type 2) LF
Curb (Type 3) LF
Curb (Type 4) LF
Thermoplastic Striping LFStorm Drain (2 DI,MH & DI lead @ 500', 1lf 24"D/lf Road) LF
Median Landscaping and Irrigation (Permanent) SF
Median Landscaping (Temporary) SF
Median PCC Island SF
Sidewalk (7' wide) SF
Frontage Landscaping SF
Frontage Street Lighting (Cost per LF of Road) LF
New Traffic Signal (Cost per Leg) EA
Modify Traffic Signal (Cost per Leg) EA
Traffic Signal Interconnect LFSWPPP LF
Bid 1 Bid 2 Bid 3 Bid 1 Bid 2 Bid 1 Bid 2 Bid 3 Bid 1 Bid 2 Bid 3 Bid 4 Bid 5 Bid 6 Bid 7 Bid 8 Bid 9 Bid 10
$10.00 $35.00 $56.00
$3.49 $4.65 $4.42 $6.28 $3.49
$3.77 $5.02 $4.77 $6.78 $3.77
$1.87 $2.97 $2.54 $5.68 $3.82 $3.39 $3.39 $4.75 $2.37 $2.39 $3.31 $9.33 $2.12 $3.39 $4.66 $5.91 $4.66 $3.99
$2.12 $3.38 $2.89 $6.46 $4.34 $3.86 $3.86 $5.40 $2.70 $2.71 $3.76 $10.61 $2.41 $3.86 $5.30 $6.72 $5.30 $4.53
$34.00 $22.00 $18.00 $16.80 $20.00 $23.00 $21.50 $24.70 $17.00 $21.80 $24.00 $19.50 $35.00 $19.60 $23.00 $44.70 $20.00 $32.00
$19.00 $16.00 $12.00 $22.00 $45.00 $16.00 $16.00 $17.95 $8.00 $13.75 $28.00 $16.00 $25.00 $10.45 $17.00 $25.00 $22.00 $21.00
$11.00 $16.00 $16.00 $10.36 $15.00 $16.00 $17.00 $17.70 $10.00 $17.20 $17.00 $17.50 $13.75 $10.45 $15.00 $13.50 $15.00 $13.00
$1.31 $0.81 $0.78 $1.60 $1.20 $1.26 $1.05 $1.39 $1.14 $1.21 $1.16 $0.98 $1.04 $1.23 $1.14 $1.26 $0.94 $1.43
$6.50 $4.50 $4.75 $4.50 $5.00 $4.50 $3.50 $3.20 $6.30 $5.00 $6.50 $3.92 $7.00 $8.50 $5.00 $8.00
$43,300.00 $44,300.00 $44,300.00 $35,500.00 $37,875.00 $42,220.00 $35,060.00 $33,925.00 $39,250.00 $30,250.00 $31,750.00 $46,550.00 $32,500.00 $31,750.00 $29,750.00 $29,750.00
COUNTY OF SACRAMENTOFREEDOM PARK DRIVE
APRIL 2011
COUNTY OF SACRAMENTOAUBURN BLVD
JULY 2011
COUNTY OF SACRAMENTOEL CAMINO AVENOVEMBER 2012
COUNTY OF SACRAMENTOMARCONI AVE STREET AND SIDEWALK IMPROVEMENT
JANUARY 2013
srobinson
Typewritten Text
1 of 2

ATTACHMENT 1 UNIT COST AND COST ESTIMATE METHODOLOGY
ITEM UNIT
Clearing and Grubbing SFRoadway Excavation CY
6" Asphalt Concrete SF
6.5" Asphalt Concrete SF
14" Aggregate Base SF
16" Aggregate Base SF
AC Dike (Type A) LF
Curb & Gutter (Type 2) LF
Curb (Type 3) LF
Curb (Type 4) LF
Thermoplastic Striping LFStorm Drain (2 DI,MH & DI lead @ 500', 1lf 24"D/lf Road) LF
Median Landscaping and Irrigation (Permanent) SF
Median Landscaping (Temporary) SF
Median PCC Island SF
Sidewalk (7' wide) SF
Frontage Landscaping SF
Frontage Street Lighting (Cost per LF of Road) LF
New Traffic Signal (Cost per Leg) EA
Modify Traffic Signal (Cost per Leg) EA
Traffic Signal Interconnect LFSWPPP LF
Bid 1 Bid 2 Bid 3 Bid 4 Bid 5 Bid 6 Bid 7 Bid 8 Bid 9 Bid 10 Bid 11 Bid 12 Bid 1 Bid 2 Bid 3 Bid 4 Bid 5 Bid 1 Bid 2 Bid 3 Bid 1 Bid 2 Bid 3 Bid 4 Bid 5
$16.50 $15.00 $24.00 $12.90 $25.00 $35.25 $25.00 $23.00 $21.00 $28.00 $13.00 $20.70 $13.00 $5.00 $16.00
$3.06 $2.71 $2.91 $2.83 $3.29 $3.19 $3.16 $3.49 $3.41 $3.37 $3.18 $3.54 $3.22 $3.10 $3.25 $5.39 $4.65 $6.32 $5.81 $7.75
$3.31 $2.93 $3.14 $3.06 $3.56 $3.44 $3.41 $3.77 $3.68 $3.64 $3.43 $3.82 $3.47 $3.35 $3.52 $5.82 $5.02 $6.82 $6.28 $8.37
$2.43 $1.87 $6.36 $2.35 $2.54 $2.05 $2.54 $2.97 $3.05 $3.82 $3.22 $2.08 $1.44 $2.46 $2.12 $4.96 $3.82 $3.73 $3.39 $8.48
$2.76 $2.12 $7.23 $2.67 $2.89 $2.33 $2.89 $3.38 $3.47 $4.34 $3.66 $2.36 $1.64 $2.80 $2.41 $5.64 $4.34 $4.24 $3.86 $9.64
$3.00 $2.65 $3.00
$18.90 $15.00 $13.50 $16.20 $15.00 $19.50 $17.00 $14.00 $17.70 $16.00 $16.00 $23.75 $18.00 $25.00 $16.00
$13.80 $15.00 $9.50 $11.40 $11.00 $10.30 $15.90 $9.50 $11.00 $21.00 $13.00 $20.50 $15.00 $24.00 $15.00
$12.80 $10.00 $8.50 $9.00 $8.40 $13.20 $11.00 $8.50 $9.00 $11.00 $10.00 $11.80 $11.00 $9.00 $10.00
$0.64 $1.40 $0.56 $0.63 $0.56 $0.52 $0.52 $0.56 $0.59 $0.57 $0.67 $0.54 $1.17 $1.05 $1.17 $1.65 $1.25 $1.15 $1.00 $0.90
$111.00 $97.00 $173.00
$1.35 $1.25 $1.30 $1.50 $1.32
$9.25 $16.00 $21.00 $13.80 $13.00
$3.90 $4.25 $2.80 $3.50 $3.50 $6.40 $3.00 $3.00 $3.75 $4.00 $3.31 $4.15 $3.00 $4.00 $3.00 $5.70 $9.00 $5.50 $6.00 $4.00
COUNTY OF SACRAMENTOWATT AVE INTERCHANGE
AUGUST 2012
COUNTY OF SACRAMENTOORANGE GROVE AVE PED IMPROVEMENT
AUGUST 2012
CITY OF FOLSOM MADISON/GREENBACK
MARCH 2013
COUNTY OF SACRAMENTOGATEWAY 5 - DUDLEY BLVD IMPROVEMENTS
MARCH 2011
ITEM UNIT
Clearing and Grubbing SFRoadway Excavation CY
6" Asphalt Concrete SF
6.5" Asphalt Concrete SF
14" Aggregate Base SF
16" Aggregate Base SF
AC Dike (Type A) LF
Curb & Gutter (Type 2) LF
Curb (Type 3) LF
Curb (Type 4) LF
Thermoplastic Striping LFStorm Drain (2 DI,MH & DI lead @ 500', 1lf 24"D/lf Road) LF
Median Landscaping and Irrigation (Permanent) SF
Median Landscaping (Temporary) SF
Median PCC Island SF
Sidewalk (7' wide) SF
Frontage Landscaping SF
Frontage Street Lighting (Cost per LF of Road) LF
New Traffic Signal (Cost per Leg) EA
Modify Traffic Signal (Cost per Leg) EA
Traffic Signal Interconnect LFSWPPP LF
CORDOVA HILLS SPA(MACKAY & SOMPS)
MIN AVERAGE MAX PROPOSED UNIT COST2007 UNIT
COSTS
Bid 1 Bid 2 Bid 3 Bid 4 Bid 5 Bid 6 Bid 7
$0.18 $0.10 $0.13 $0.18 $0.10 $0.10$30.00 $5.00 $16.31 $35.25 $12.00 $15.00
$2.91 $3.10 $3.68 $3.41 $3.35 $4.26 $3.56 $4.20 $2.52 $3.28 $3.87 $3.25 $3.35
$3.14 $3.35 $3.98 $3.68 $3.62 $4.60 $3.85 $4.55 $2.72 $3.55 $4.19 $3.50 $3.60
$1.36 $1.70 $1.87 $2.29 $1.53 $2.09 $1.70 $3.92 $1.08 $2.40 $3.99 $1.75 $2.25
$1.54 $1.93 $2.12 $2.60 $1.74 $2.37 $1.93 $4.48 $1.23 $2.74 $4.53 $2.00 $2.60
$2.00 $3.16 $4.50 $3.00
$15.00 $10.30 $23.00 $24.00 $30.80 $26.50 $28.50 $25.00 $10.30 $19.85 $34.00 $20.00 $20.00
$9.50 $14.60 $19.00 $14.00 $14.00
$9.00 $10.00 $7.50 $8.50 $9.25 $8.25 $10.50 $7.50 $12.22 $18.00 $12.00 $14.00
$1.03 $0.92 $1.05 $0.90 $0.92 $0.82 $1.10 $2.00 $0.52 $1.03 $2.00 $1.25 $1.40$97.00 $107.00 $118.00 $110.00 $123.00
$6.00 $4.00 $5.67 $7.00 $6.00 $5.00
$1.25 $1.62 $3.00 $3.00 $3.00
$6.75 $12.54 $21.00 $15.00
$3.00 $5.75 $5.00 $6.00 $7.20 $3.80 $6.50 $6.00 $2.80 $5.14 $9.00 $6.00 $5.60
$4.50 $5.75 $7.00 $6.00 $5.00
$13.00 $25.00 $37.50 $50.00 $50.00 $23.00
$75,000.00 $50,000.00 $56,600.00 $75,000.00 $55,000.00 $75,000.00
$37,500.00 $29,750.00 $36,795.88 $46,550.00 $37,500.00 $50,000.00
$13.00 $6.00 $10.33 $13.00 $12.00 $25.00$18.00 $18.00 $18.00 $18.00 $9.00
COUNTY OF SACRAMENTOFEMOYER STREET INTERSECTION
MARCH 2013
srobinson
Typewritten Text
2 of 2

ATTACHMENT 2
ROADWAY SEGMENT COST ESTIMATES

ATTACHMENT 2 UNIT COST AND COST ESTIMATE METHODOLOGY
M Construct Median ImprovementsQuantity Unit $/unit $
Import Fill 0.3 cy $15.00 $4.50Minor Excavation & Saw cut 1 sf $20.00 $20.00Med Landscape 13 sf $6.00 $78.00Curb (Type 3) 2 lf $14.00 $28.00SWPPP 1 lf $18.00 $18.00
Subtotal $148.5020%
*Unit Price Increase for Type of Work Total $178.20
C&G Curb & GutterConstruct 4ft bike lane, C & G, sidewalk and landscaping (one side) per unit price below.
Quantity Unit $/unit $Excavation 0.5 cy $12.00 $6.00
Depth of AC 6.5 $3.50Depth of AB 16 $2.00
Curb & Gutter (Type 2) 1 lf $20.00 $20.00Clear & Grub 22 sf $0.10 $2.20SWPPP 1 lf $18.00 $18.00Sidewalk 7 sf $6.00 $42.00Drainage 1 lf $12.00 $12.00Street Lights 1 lf $25.00 $25.00Landscape 8 sf $6.00 $48.00
Subtotal $195.2020% *
*Unit Price Increase for Type of Work Total $234.24
GRANT LINE 4 Lane Ultimate; 2 Lanes constructed in City R/W (one side) per unit price below (No Phasing).Fee
Quantity Unit $/unit $Excavation 5 cy $12.00 $60.00
Depth of AC 10 $5.40Depth of AB 25 $3.15
Striping 3 lf $1.25 $3.75Clear & Grub 100 sf $0.10 $10.00SWPPP 1 lf $9.00 $9.00Signal Interconect 1 lf $6.00 $6.00
Subtotal $422.2020%
Contengency included to cover stage construction costs and unknowns. Total $506.64
JACKSON 4 Lane Ultimate; 2 Lanes constructed in City R/W (one side) per unit price below (No Phasing). JACKSON 4 Lane Ultimate; 2 Lanes constructed in City R/W (one side) per unit price below (No Phasing).Fee Fee
Quantity Unit $/unit $ Quantity Unit $/unit $Excavation 3 cy $12.00 $36.00 Excavation 3 cy $12.00 $36.00
Depth of AC 10 $5.40 Depth of AC 10 $5.40Depth of AB 25 $3.15 Depth of AB 25 $3.15
Striping 3 lf $1.25 $3.75 Striping 3 lf $1.25 $3.75Clear & Grub 25 sf $0.10 $2.50 Clear & Grub 35 sf $0.10 $3.50SWPPP 1 lf $9.00 $9.00 Sidewalk 7 sf $6.00 $42.00Signal Interconect 1 lf $6.00 $6.00 Curb and Gutter (Type 2) 1 lf $20.00 $20.00
Subtotal $228.25 Frontage Landscape 8 sf $6.00 $48.0020% Drainage 1 lf $56.00 $56.00
Contengency included to cover stage construction costs and unknowns. Total $273.90 SWPPP 1 lf $9.00 $9.00Signal Interconect 1 lf $6.00 $6.00Street Lights 1 lf $25.00 $25.00
Subtotal $395.2520%
Contengency included to cover stage construction costs and unknowns. Total $474.30
101 2 Lane Ultimate; construct new 2 lane street, R/W line to R/W line.Developer
Quantity Unit $/unit $Excavation 2.4 cy $12.00 $28.80
Depth of AC 6 $3.25Depth of AB 14 $1.75
Striping 3 lf $1.25 $3.75Sidewalk 14 sf $6.00 $84.00Clear & Grub 64 sf $0.10 $6.40Curb & Gutter (Type 2) 2 lf $20.00 $40.00Drainage 1 lf $112.00 $112.00SWPPP 1 lf $18.00 $18.00Signal Interconect 1 lf $12.00 $12.00Street Lights 1 lf $50.00 $50.00
Subtotal $517.45
Total $517.45
101-B 2 Lane Ultimate; construct new 2 lane street, r/w line to r/w line.Developer
Quantity Unit $/unit $Cold Plane Pavement 32.5 sf $0.25 $8.13
Depth of AC 2 $1.30Depth of AB 0 $0.00
Striping 3 lf $1.25 $3.75Sidewalk 14 sf $6.00 $84.00Clear & Grub 30 sf $0.10 $3.00Curb & Gutter (Type 2) 2 lf $20.00 $40.00Drainage 1 lf $112.00 $112.00SWPPP 1 lf $18.00 $18.00Street Lights 1 lf $50.00 $50.00
Subtotal $361.1320%
Total $433.35
101-C 2 lane ultimate; repave and restripe. Drainage and curb & gutter already exist.Developer
Quantity Unit $/unit $Cold Plane Pavement 32.5 sf $0.25 $8.13
Depth of AC 2 $1.30Depth of AB 0 $0.00
Striping 3 lf $1.25 $3.75SWPPP 1 lf $18.00 $18.00
Subtotal $72.1330% *
Total $93.76
20 sf $171.00
$162.50
$42.25
4 sf $22.00
32.5
2 LANE ULTIMATE
39 sf $333.45
sf
20 sf $171.00
sf
FEE or CITY PORTION DEVELOPER PORTION
No Fee Work Associated with Section 101
No Developer Work
SPECIAL SECTIONS
*Because this work is performed in an existing street location, traffic control will be necessary. In addition, the major items of work will be constucted in thin strips to maintain traffic flow which will result in higher unit costs.
32.5 sf $42.25
32.5
1 OF 4

ATTACHMENT 2 UNIT COST AND COST ESTIMATE METHODOLOGY
FEE or CITY PORTION DEVELOPER PORTION
102-U 4 Lane Ultimate; 4 Lanes constructed per unit price below (No Phasing, 2 sides). 104-U 4 Lane Ultimate; 4 Lanes constructed per unit price below (No Phasing, 2 sides).Fee Developer
Quantity Unit $/unit $ Quantity Unit $/unit $Excavation 1.7 cy $12.00 $20.40 Excavation 2.8 cy $12.00 $33.60
Depth of AC 6 $3.25 Depth of AC 6 $3.25Depth of AB 14 $1.75 Depth of AB 14 $1.75
Striping 4 lf $1.25 $5.00 Striping 2 lf $1.25 $2.50Med Landscape 13 sf $6.00 $78.00 Frontage Landscape 16 sf $6.00 $96.00Clear & Grub 38 sf $0.10 $3.80 Clear & Grub 66 sf $0.10 $6.60Curb (Type 3) 2 lf $14.00 $28.00 Curb & Gutter (Type 2) 2 lf $20.00 $40.00Storm Drain Sys. 1 lf $100.00 $100.00 Sidewalk 14 sf $6.00 $84.00SWPPP 1 lf $9.00 $9.00 Storm Drain Sys. 1 lf $12.00 $12.00Signal Interconect 1 lf $12.00 $12.00 SWPPP 1 lf $9.00 $9.00
Subtotal $376.20 Street Lights 1 lf $50.00 $50.00Subtotal $483.70
Assumes 102 is constructed together with 104 and prior to 106 Total $376.20Assumes 104 is constructed together with 102 Total $483.70
102-P1 PHASE 1 - 4 Lane Ultimate; 2 Outside Lanes + median actually constructed per unit price below (2 sides). 104 PHASE 1 - 4 Lane Ultimate; 2 Outside Lanes + frontage actually constructed per unit price below (2 sides).Fee Developer
Quantity Unit $/unit $ Quantity Unit $/unit $Excavation 0.25 cy $12.00 $3.00 Excavation 2.8 cy $12.00 $33.60
Depth of AC 6 $3.25 Depth of AC 6 $3.25Depth of AB 14 $1.75 Depth of AB 14 $1.75
Striping 2 lf $1.25 $2.50 Striping 2 lf $1.25 $2.50Med Landscape (Temporary) 20 sf $3.00 $60.00 Frontage Landscape 16 sf $6.00 $96.00Med Landscape 13 sf $6.00 $78.00 Clear & Grub 66 sf $0.10 $6.60Clear & Grub 38 sf $0.10 $3.80 Curb & Gutter (Type 2) 2 lf $20.00 $40.00AC Dike (Type A) 2 lf $3.00 $6.00 Sidewalk 14 sf $6.00 $84.00Storm Drain Sys. 1 lf $100.00 $100.00 Storm Drain Sys. 1 lf $12.00 $12.00SWPPP 1 lf $9.00 $9.00 SWPPP 1 lf $9.00 $9.00Signal Interconect 1 lf $12.00 $12.00 Street Lights 1 lf $50.00 $50.00
Subtotal $294.30 Subtotal $483.70
Assumes 102 is constructed together with 104 and prior to 106 Total $294.30 Assumes 104 is constructed together with 102 Total $483.70
102-P2 PHASE 2 - 4 Lane Ultimate; 2 Inside Lanes constructed per unit price below (2 sides). 104 PHASE 1 - 4 Lane Ultimate; 2 Outside Lanes + frontage actually constructed per unit price below (1 side).Fee Developer
Quantity Unit $/unit $ Quantity Unit $/unit $Excavation 1.4 cy $12.00 $16.80 Excavation 1.4 cy $12.00 $16.80
Depth of AC 6 $3.25 Depth of AC 6 $3.25Depth of AB 14 $1.75 Depth of AB 14 $1.75
Striping 4 lf $1.25 $5.00 Striping 1 lf $1.25 $1.25Clear & Grub 20 sf $0.10 $2.00 Frontage Landscape 8 sf $6.00 $48.00Curb (Type 3) 2 lf $14.00 $28.00 Clear & Grub 33 sf $0.10 $3.30SWPPP 1 lf $18.00 $18.00 Curb & Gutter (Type 2) 1 lf $20.00 $20.00
Subtotal $169.80 Sidewalk 7 sf $6.00 $42.0020% Storm Drain Sys. 1 lf $6.00 $6.00
Assumes 102 and 104 are constructed prior to 106 Total $203.76 SWPPP 1 lf $4.50 $4.50Contengency included to cover stage construction costs. Street Lights 1 lf $25.00 $25.00
Subtotal $241.85
Assumes 104 is constructed together with 102 Total $241.85
102-Sunrise 4 Lane Ultimate; 2 Lanes + median actually constructed per unit price below.Fee
Quantity Unit $/unit $Excavation 3 cy $12.00 $36.00
Depth of AC 7 $3.80Depth of AB 17 $2.20
Striping 4 lf $1.25 $5.00Med Landscape 13 sf $6.00 $78.00Clear & Grub 46 sf $0.10 $4.60Curb (Type 3) 2 lf $14.00 $28.00Storm Drain Sys. 1 lf $100.00 $100.00SWPPP 1 lf $18.00 $18.00Signal Interconect 1 lf $12.00 $12.00Street Lights 0 lf $50.00 $0.00
Subtotal $425.60
Assumes 102 is constructed prior to 104 Total $425.60
106
FeeQuantity Unit $/unit $
Excavation 1.8 cy $12.00 $21.60Depth of AC 6 $3.25Depth of AB 14 $1.75
Striping 6 lf $1.25 $7.50Med Landscape 13 sf $6.00 $78.00Curb (Type 3) 2 lf $14.00 $28.00Drainage 1 lf $100.00 $100.00SWPPP 1 lf $18.00 $18.00Signal Interconect 1 lf $12.00 $12.00
Subtotal $385.1020%
Total $462.12
106-A
FeeQuantity Unit $/unit $
Import fill for Median 0.3 cy $15.00 $4.50Depth of AC 2 $1.30Depth of AB 0 $0.00
Striping 6 lf $1.25 $7.50Med Landscape 13 sf $6.00 $78.00Curb (Type 3) 2 lf $14.00 $28.00Cold Plane Pavement 24 sf $0.25 $6.00SWPPP 1 lf $18.00 $18.00
Subtotal $173.2020%
Total $207.84
No Developer Work
30 sf $150.004 sf $20.00
24 sf $144.00
4 LANE ULTIMATE
Section 106-A (Fee) - 4 Lane Ultimate; Existing 2 Lanes upgraded by cold planing 2" AC & repaving with 2" AC and median added per unit price below.
24 sf $31.20
15 sf $75.0020 sf $100.00
24 sf $120.00 30 sf $150.00
Section 106 (Fee) - 4 Lane Ultimate; Existing 2 Lanes upgraded by removing and replacing structural section and median added per unit price below.
24 sf $120.00
2 OF 4

ATTACHMENT 2 UNIT COST AND COST ESTIMATE METHODOLOGY
FEE or CITY PORTION DEVELOPER PORTION
103-U 6 Lane Ultimate; 6 Lanes constructed per unit price below (No Phasing, 2 sides). 105-U 6 Lane Ultimate; 6 Lanes constructed per unit price below (No Phasing, 2 sides).Fee Developer
Quantity Unit $/unit $ Quantity Unit $/unit $Excavation 3.2 cy $12.00 $38.40 Excavation 2.8 cy $12.00 $33.60
Depth of AC 6.5 $3.50 Depth of AC 6.5 $3.50Depth of AB 16 $2.00 Depth of AB 16 $2.00
Striping 6 lf $1.25 $7.50 Striping 2 lf $1.25 $2.50Med Landscape 14 sf $6.00 $84.00 Frontage Landscape 16 sf $6.00 $96.00Clear & Grub 60 sf $0.10 $6.00 Clear & Grub 66 sf $0.10 $6.60Curb (Type 3) 2 lf $14.00 $28.00 Curb & Gutter (Type 2) 2 lf $20.00 $40.00Storm Drain Sys. 1 lf $100.00 $100.00 Sidewalk 14 sf $6.00 $84.00SWPPP 1 lf $9.00 $9.00 Storm Drain Sys. 1 lf $12.00 $12.00Signal Interconect 1 lf $12.00 $12.00 SWPPP 1 lf $9.00 $9.00
Subtotal $537.90 Street Lights 1 lf $50.00 $50.00Subtotal $498.70
Assumes 103-U is constructed together with 105-U Total $537.90Assumes 105-U is constructed together with 103-U Total $498.70
103-P1 PHASE 1 - 6 Lane Ultimate; 2 Outside Lanes + median actually constructed per unit price below (2 sides). 105 PHASE 1 - 6 Lane Ultimate; 2 Outside Lanes + Frontage constructed per unit price below (2 sides).Fee Developer
Quantity Unit $/unit $ Quantity Unit $/unit $Excavation 0.3 cy $12.00 $3.60 Excavation 2.8 cy $12.00 $33.60
Depth of AC 6.5 $3.50 Depth of AC 6.5 $3.50Depth of AB 16 $2.00 Depth of AB 16 $2.00
Striping 2 lf $1.25 $2.50 Striping 2 lf $1.25 $2.50Med Landscape 14 sf $6.00 $84.00 Frontage Landscape 16 sf $6.00 $96.00Med Landscape (Temporary) 21 sf $3.00 $63.00 Clear & Grub 66 sf $0.10 $6.60Clear & Grub 60 sf $0.10 $6.00 Curb & Gutter (Type 2) 2 lf $20.00 $40.00AC Dike (Type A) 2 lf $3.00 $6.00 Sidewalk 14 sf $6.00 $84.00Storm Drain Sys. 1 lf $100.00 $100.00 Storm Drain Sys. 1 lf $12.00 $12.00SWPPP 1 lf $9.00 $9.00 SWPPP 1 lf $9.00 $9.00Signal Interconect 1 lf $12.00 $12.00 Street Lights 1 lf $50.00 $50.00
Subtotal $308.10 Subtotal $498.700%
Assume 103-P1 is constructed at same time as 105 and prior to 103-P2 Total $308.10 Assume 105 is constructed at same time as 103 Total $498.70
103-P2 PHASE 2 - 6 Lane Ultimate; 2 Middle Lanes constructed per unit price below (2 sides). 105 6 Lane Ultimate; 2 Outside Lanes + Frontage constructed per unit price below (1 side).Fee Developer
Quantity Unit $/unit $ Quantity Unit $/unit $Excavation 1.5 cy $12.00 $18.00 Excavation 1.4 cy $12.00 $16.80
Depth of AC 6.5 $3.50 Depth of AC 6.5 $3.50Depth of AB 16 $2.00 Depth of AB 16 $2.00
Striping 4 lf $1.25 $5.00 Striping 1 lf $1.25 $1.25Clear & Grub 22 sf $0.10 $2.20 Frontage Landscape 8 sf $6.00 $48.00AC Dike (Type A) 2 lf $3.00 $6.00 Clear & Grub 33 sf $0.10 $3.30SWPPP 1 lf $18.00 $18.00 Curb & Gutter (Type 2) 1 lf $20.00 $20.00
Subtotal $170.20 Sidewalk 7 sf $6.00 $42.0020% Storm Drain Sys. 1 lf $6.00 $6.00
Assume 103-P2 is constructed after 103-P1 and prior to 103-P3 Total $204.24 SWPPP 1 lf $4.50 $4.50Contengency included to cover stage construction costs. Street Lights 1 lf $25.00 $25.00
Subtotal $249.350%
103-P3 PHASE 3 - 6 Lane Ultimate; 2 Inside Lanes constructed per unit price below (2 sides). Assume 105 is constructed at same time as 103 Total $249.35Fee
Quantity Unit $/unit $Excavation 1.4 cy $12.00 $16.80
Depth of AC 6.5 $3.50Depth of AB 16 $2.00
Striping 4 lf $1.25 $5.00Clear & Grub 20 sf $0.10 $2.00Curb (Type 3) 2 lf $14.00 $28.00SWPPP 1 lf $18.00 $18.00
Subtotal $179.8020%
Assume 103-P3 is constructed after 103-P2 Total $215.76Contengency included to cover stage construction costs.
103-P1A PHASE 1 - 6 Lane Ultimate; 4 Outside Lanes + median actually constructed per unit price below (2 sides).Fee
Quantity Unit $/unit $Excavation 1.8 cy $12.00 $21.60
Depth of AC 6.5 $3.50Depth of AB 16 $2.00
Striping 4 lf $1.25 $5.00Med Landscape 14 sf $6.00 $84.00Med Landscape (Temporary) 20 sf $3.00 $60.00Clear & Grub 60 sf $0.10 $6.00AC Dike (Type A) 2 lf $3.00 $6.00Storm Drain Sys. 1 lf $100.00 $100.00SWPPP 1 lf $9.00 $9.00Signal Interconect 1 lf $12.00 $12.00
Subtotal $446.60
Assume 103-P1A is constructed at same time as 105 and prior to 103-P3 Total $446.60Phase 2 is 103-P3
103-Sunrise Section 103 (Fee) - 6 Lane Ultimate; 4 Lanes + median actually constructed per unit price below. 105-SunriseFee
Quantity Unit $/unit $ DeveloperExcavation 5 cy $12.00 $60.00 Quantity Unit $/unit $
Depth of AC 7 $3.80 Excavation 1.7 cy $12.00 $20.40Depth of AB 17 $2.20 Depth of AC 7 $3.80
Striping 6 lf $1.25 $7.50 Depth of AB 17 $2.20Med Landscape 13 sf $6.00 $78.00 Sidewalk 7 sf $6.00 $42.00Clear & Grub 68 sf $0.10 $6.80 Med Landscape 8 sf $6.00 $48.00Curb (Type 3) 2 lf $14.00 $28.00 Clear & Grub 30 sf $0.10 $3.00Storm Drain Sys. 1 lf $100.00 $100.00 Striping 2 lf $1.25 $2.50SWPPP 1 lf $18.00 $18.00 Curb & Gutter (Type 2) 1 lf $20.00 $20.00Signal Interconect 1 lf $12.00 $12.00 Drainage 1 lf $12.00 $12.00
Subtotal $586.30 SWPPP 1 lf $18.00 $18.00Street Lights 1 lf $50.00 $50.00
Assume 103 is constructed prior to 105 Total $586.30 Subtotal $305.9020%
Assume 105 constructed after 103 Total $367.08
Section 105 (Developer) - 6 Lane Ultimate; 1 Lane, 1 bike lane, curb & gutter & sidewalk constructed on one side only per unit price below.
6 LANE ULTIMATE
22 sf
$276.00
sf $110.00
4 sf $22.00
46 sf
$121.00
20
46 sf $253.00
15 sf $90.00
sf $165.0030
15
30 sf $165.00
sf $82.50
26 sf $143.00
3 OF 4

ATTACHMENT 2 UNIT COST AND COST ESTIMATE METHODOLOGY
FEE or CITY PORTION DEVELOPER PORTION107
FeeQuantity Unit $/unit $
Excavation 3.4 cy $12.00 $40.80Depth of AC 6.5 $3.50Depth of AB 16 $2.00
Striping misc 6 lf $1.25 $7.50Med Landscape 13 sf $6.00 $78.00Curb (Type 3) 2 lf $14.00 $28.00Drainage 1 lf $100.00 $100.00SWPPP 1 lf $18.00 $18.00Signal Interconect 1 lf $12.00 $12.00Street Lights 1 lf $50.00 $50.00
Subtotal $587.3020%
Total $704.76
107-A
FeeQuantity Unit $/unit $
Import fill for Median 0.3 cy $15.00 $4.50Depth of AC 2 $1.30Depth of AB 0 $0.00
Striping misc 6 lf $1.25 $7.50Med Landscape 13 sf $6.00 $78.00Curb (Type 3) 2 lf $14.00 $28.00Cold Plane Pavement 46 sf $0.25 $11.50SWPPP 1 lf $18.00 $18.00Street Lights 1 lf $50.00 $50.00
Subtotal $257.3020%
Total $308.76
108
FeeQuantity Unit $/unit $
Excavation 4 cy $12.00 $48.00Depth of AC 6 $3.25Depth of AB 14 $1.75
Striping misc 6 lf $1.25 $7.50SWPPP 1 lf $18.00 $18.00Signal Interconect 1 lf $12.00 $12.00Street Lights 1 lf $50.00 $50.00
Subtotal $405.5020% *
Total $486.60
108-A
FeeQuantity Unit $/unit $
Cold Plane Pavement 54 sf $0.25 $13.50Depth of AC 2 $1.30Depth of AB 0 $0.00
Striping misc 6 lf $1.25 $7.50SWPPP 1 lf $18.00 $18.00
Subtotal $109.2030%
Total $141.96
109
FeeQuantity Unit $/unit $
Excavation 5.6 cy $12.00 $67.20Depth of AC 6.5 $3.50Depth of AB 16 $2.00
Striping misc 8 lf $1.25 $10.00SWPPP 1 lf $18.00 $18.00Signal Interconect 1 lf $12.00 $12.00Street Lights 1 lf $50.00 $50.00
Subtotal $575.2020% *
Total $690.24
109-A 9350 35.41666667
FeeQuantity Unit $/unit $ 0.164705882
Cold Plane Pavement 76 sf $0.25 $19.00Depth of AC 2 $1.30Depth of AB 0 $0.00
Striping misc 8 lf $1.25 $10.00SWPPP 1 lf $18.00 $18.00
Subtotal $145.8030% *
Total $189.54
NOTES:P1 = Phase 1P2 = Phase 2P3 = Phase 3U = Ultimate
INCREASE EXISTING STRUCTURAL SECTION (4 & 6 LANE) -- CITY OBLIGATION: NOT INCLUDED IN FEE
76 sf $98.80
Section 109-A (Fee) - Upgrade 6 Lane street by cold planing pavement and repaving from median curb to gutter lip per unit price below. Assumes existing drainage in place.
Section 108 (Fee) - Upgrade 4 Lane street by removing and replacing structural section from median curb to gutter lip per unit price below. Assumes existing drainage in place.
Section 109 (Fee) - Upgrade 6 Lane street by removing and replacing structural section from median curb to gutter lip per unit price below. Assumes existing drainage in place.
$59.80
76 sf $418.00
Section 108-A (Fee) - Upgrade 4 Lane street by cold planing pavement and repaving from median curb to gutter lip. Assumes existing drainage in place.
54 sf $70.20
Section 107 (Fee) - 6 Lane Ultimate; Existing 4 Lanes upgraded by removing and replacing structural section and median added per unit price below.
46 sf $253.00
54 sf $270.00
Section 107-A (Fee) - 6 Lane Ultimate; Existing 4 Lanes upgraded by cold planing 2" AC & repaving with 2" AC and median added per unit price below.
46 sf
4 OF 4

ATTACHMENT 3
INTERSECTION COST ESTIMATES

ATTACHMENT 3 UNIT COST AND COST ESTIMATE METHODOLOGY
4x4 4x4 Ultimate (No Phasing) constructed per unit price below. 4x4 4x4 Ultimate (No Phasing) constructed per unit price below.Fee Developer
Quantity Unit $/unit $ Quantity Unit $/unit $Excavation 3671 cy $12.00 $44,052.00 Excavation 4331 cy $12.00 $51,972.00
Depth of AC 6 $3.25 Depth of AC 6 $3.25Depth of AB 14 $1.75 Depth of AB 14 $1.75
Striping 6925 lf $1.25 $8,656.25 Striping 4880 lf $1.25 $6,100.00Med Landscape 22348 sf $6.00 $134,088.00 Frontage Landscape 24330 sf $6.00 $145,980.00Clear & Grub 78900 sf $0.10 $7,890.00 Clear & Grub 125440 sf $0.10 $12,544.00Curb (Type 2) 272 lf $20.00 $5,440.00 Curb (Type 2) 2825 lf $20.00 $56,500.00Sidewalk 1632 sf $6.00 $9,792.00 Sidewalk 19650 sf $6.00 $117,900.00Median PCC (Ped Island) 3190 sf $15.00 $47,850.00 Storm Drain Sys. 1800 lf $12.00 $21,600.00Curb (Type 3) 3780 lf $14.00 $52,920.00 SWPPP 1800 lf $9.00 $16,200.00Storm Drain Sys. 1800 lf $100.00 $180,000.00 Street Lights 1800 lf $50.00 $90,000.00SWPPP 1800 lf $9.00 $16,200.00 Subtotal $854,796.00Signal Interconect 1800 lf $12.00 $21,600.00
Traffic Signal 4 leg $55,000.00 $220,000.00 Assumes Fee is constructed together with Developer Total $854,796.00Subtotal $1,031,238.25
Assumes Fee is constructed together with Developer Total $1,031,238.25
2x2 PHASE 1 - 4x4 Ultimate; 2x2 Outside Lanes + median actually constructed per unit price below. 2x2 PHASE 1 - 4x4 Ultimate; 2x2 Outside Lanes + median actually constructed per unit price below.Fee Developer
Quantity Unit $/unit $ Quantity Unit $/unit $Excavation 1552 cy $12.00 $18,624.00 Excavation 4331 cy $12.00 $51,972.00
Depth of AC 6 $3.25 Depth of AC 6 $3.25Depth of AB 14 $1.75 Depth of AB 14 $1.75
Striping 4450 lf $1.25 $5,562.50 Striping 4880 lf $1.25 $6,100.00Med Landscape (Temporary) 34320 sf $3.00 $102,960.00 Frontage Landscape 24330 sf $6.00 $145,980.00Med Landscape 22348 sf $6.00 $134,088.00 Clear & Grub 125440 sf $0.10 $12,544.00Clear & Grub 78900 sf $0.10 $7,890.00 Curb (Type 2) 2825 lf $20.00 $56,500.00Curb (Type 2) 272 lf $20.00 $5,440.00 Sidewalk 19650 sf $6.00 $117,900.00AC Dike (Type A) 3250 lf $3.00 $9,750.00 Storm Drain Sys. 1800 lf $12.00 $21,600.00Sidewalk 1632 sf $6.00 $9,792.00 SWPPP 1800 lf $9.00 $16,200.00Median PCC (Ped Island) 3190 sf $15.00 $47,850.00 Street Lights 1800 lf $50.00 $90,000.00Curb (Type 3) 530 lf $14.00 $7,420.00 Subtotal $854,796.00Storm Drain Sys. 1800 lf $100.00 $180,000.00
SWPPP 1800 lf $9.00 $16,200.00 Assumes Fee is constructed together with Developer Total $854,796.00Signal Interconect 1800 lf $12.00 $21,600.00Traffic Signal 4 leg $55,000.00 $220,000.00
Subtotal $898,326.50
Assumes Fee is constructed together with Developer Total $898,326.50
4x4 PHASE 2 - Inside lanes added to 2x2 intersection to create 4x4 per unit price below.Fee
Quantity Unit $/unit $Excavation 2119 cy $12.00 $25,428.00
Depth of AC 6 $3.25Depth of AB 14 $1.75
Striping 6925 lf $1.25 $8,656.25Clear & Grub 34320 sf $0.10 $3,432.00Curb (Type 3) 3250 lf $14.00 $45,500.00SWPPP 1800 lf $18.00 $32,400.00Traffic Signal Modification 4 leg $12,000.00 $48,000.00
Subtotal $335,016.2520%
Assumes 2x2 is constructed prior to 4x4 Total $402,019.50Contengency included to cover stage construction costs
2x4 PHASE 1A - 4x4 Ultimate; 2x4 Outside Lanes + median actually constructed per unit price below. 2x4 PHASE 1A - 4x4 Ultimate; 2x4 Outside Lanes + median actually constructed per unit price below.Fee Developer
Quantity Unit $/unit $ Quantity Unit $/unit $Excavation 2611 cy $12.00 $31,332.00 Excavation 4331 cy $12.00 $51,972.00
Depth of AC 6 $3.25 Depth of AC 6 $3.25Depth of AB 14 $1.75 Depth of AB 14 $1.75
Striping 1632 lf $1.25 $2,040.00 Striping 4880 lf $1.25 $6,100.00Med Landscape (Temporary) 17160 sf $3.00 $51,480.00 Frontage Landscape 24330 sf $6.00 $145,980.00Med Landscape 22348 sf $6.00 $134,088.00 Clear & Grub 125440 sf $0.10 $12,544.00Clear & Grub 78900 sf $0.10 $7,890.00 Curb (Type 2) 2825 lf $20.00 $56,500.00Curb (Type 2) 272 lf $20.00 $5,440.00 Sidewalk 19650 sf $6.00 $117,900.00AC Dike (Type A) 1625 lf $3.00 $4,875.00 Storm Drain Sys. 1800 lf $12.00 $21,600.00Sidewalk 1632 sf $6.00 $9,792.00 SWPPP 1800 lf $9.00 $16,200.00Median PCC (Ped Island) 3190 sf $15.00 $47,850.00 Street Lights 1800 lf $50.00 $90,000.00Curb (Type 3) 2420 lf $14.00 $33,880.00 Subtotal $854,796.00Storm Drain Sys. 1800 lf $100.00 $180,000.00
SWPPP 1800 lf $9.00 $16,200.00 Assumes Fee is constructed together with Developer Total $854,796.00Signal Interconect 1800 lf $12.00 $21,600.00Traffic Signal 4 leg $55,000.00 $220,000.00
Subtotal $963,417.00
Assumes Fee is constructed together with Developer Total $963,417.00
4x4 PHASE 2A - Inside lanes added to 2x2 intersection to create 4x4 per unit price below.Fee
Quantity Unit $/unit $Excavation 1060 cy $12.00 $12,720.00
Depth of AC 6 $3.25Depth of AB 14 $1.75
Striping 3463 lf $1.25 $4,328.75Clear & Grub 17160 sf $0.10 $1,716.00Curb (Type 3) 1625 lf $0.00 $0.00SWPPP 900 lf $18.00 $16,200.00Traffic Signal Modification 2 leg $12,000.00 $24,000.00
Subtotal $144,764.7520%
Assumes 2x4 is constructed prior to 4x4 Total $173,717.70Contengency included to cover stage construction costs
4x4 LANE ULTIMATE INTERSECTION - 2x2 LANE PHASE 1
4x4 LANE ULTIMATE INTERSECTION - 2x4 LANE PHASE 1
39390 sf $196,950.00 67200 sf $336,000.00
17160 sf $85,800.00
34320 sf $171,600.00
FEE or CITY PORTION DEVELOPER PORTION4x4 LANE ULTIMATE INTERSECTION
22230 sf $111,150.00 67200 sf $336,000.00
56550 sf $282,750.00 67200 sf $336,000.00
1 OF 8

ATTACHMENT 3 UNIT COST AND COST ESTIMATE METHODOLOGY
FEE or CITY PORTION DEVELOPER PORTION
4x4 TEE 4x4 Tee Ultimate (No Phasing) constructed per unit price below. 4x4 TEE 4x4 Tee Ultimate (No Phasing) constructed per unit price below.Fee Developer
Quantity Unit $/unit $ Quantity Unit $/unit $Excavation 2688 cy $12.00 $32,256.00 Excavation 3921 cy $12.00 $47,052.00
Depth of AC 6 $3.25 Depth of AC 6 $3.25Depth of AB 14 $1.75 Depth of AB 14 $1.75
Striping 5194 lf $1.25 $6,492.50 Striping 3735 lf $1.25 $4,668.75Med Landscape 16761 sf $6.00 $100,566.00 Frontage Landscape 18848 sf $6.00 $113,088.00Clear & Grub 59175 sf $0.10 $5,917.50 Clear & Grub 95205 sf $0.10 $9,520.50Curb (Type 2) 204 lf $20.00 $4,080.00 Curb (Type 2) 2194 lf $20.00 $43,880.00Sidewalk 1224 sf $6.00 $7,344.00 Sidewalk 15263 sf $6.00 $91,578.00Median PCC (Ped Island) 1595 sf $15.00 $23,925.00 Storm Drain Sys. 1350 lf $12.00 $16,200.00Curb (Type 3) 2703 lf $14.00 $37,842.00 SWPPP 1350 lf $9.00 $12,150.00Storm Drain Sys. 1350 lf $100.00 $135,000.00 Street Lights 1350 lf $50.00 $67,500.00SWPPP 1350 lf $9.00 $12,150.00 Subtotal $657,637.25Signal Interconect 1350 lf $12.00 $16,200.00
Traffic Signal 3 leg $55,000.00 $165,000.00 Assumes Fee is constructed together with Developer Total $657,637.25Subtotal $758,838.00
Assumes Fee is constructed together with Developer Total $758,838.00
2x2 TEE PHASE 1 - 4x4 Tee Ultimate; 2x2 Tee Outside Lanes + median actually constructed per unit price below. 2x2 TEE PHASE 1 - 4x4 Tee Ultimate; 2x2 Tee Outside Lanes + median actually constructed per unit price below.Fee Developer
Quantity Unit $/unit $ Quantity Unit $/unit $Excavation 1098 cy $12.00 $13,176.00 Excavation 3921 cy $12.00 $47,052.00
Depth of AC 6 $3.25 Depth of AC 6 $3.25Depth of AB 14 $1.75 Depth of AB 14 $1.75
Striping 3338 lf $1.25 $4,172.50 Striping 3735 lf $1.25 $4,668.75Med Landscape (Temporary) 25740 sf $3.00 $77,220.00 Frontage Landscape 18848 sf $6.00 $113,088.00Med Landscape 16761 sf $6.00 $100,566.00 Clear & Grub 95205 sf $0.10 $9,520.50Clear & Grub 59175 sf $0.10 $5,917.50 Curb (Type 2) 2194 lf $20.00 $43,880.00Curb (Type 2) 204 lf $20.00 $4,080.00 Sidewalk 15263 sf $6.00 $91,578.00AC Dike (Type A) 2438 lf $3.00 $7,314.00 Storm Drain Sys. 1350 lf $12.00 $16,200.00Sidewalk 1224 sf $6.00 $7,344.00 SWPPP 1350 lf $9.00 $12,150.00Median PCC (Ped Island) 1595 sf $15.00 $23,925.00 Street Lights 1350 lf $50.00 $67,500.00Curb (Type 3) 265 lf $14.00 $3,710.00 Subtotal $657,637.25Storm Drain Sys. 1350 lf $100.00 $135,000.00
SWPPP 1350 lf $9.00 $12,150.00 Assumes Fee is constructed together with Developer Total $657,637.25Signal Interconect 1350 lf $12.00 $16,200.00Traffic Signal 3 leg $55,000.00 $165,000.00
Subtotal $659,140.00
Assumes Fee is constructed together with Developer Total $659,140.00
4x4 TEE PHASE 2 - Inside lanes added to 2x2 Tee intersection to create 4x4 Tee per unit price below.Fee
Quantity Unit $/unit $Excavation 1590 cy $12.00 $19,080.00
Depth of AC 6 $3.25Depth of AB 14 $1.75
Striping 5194 lf $1.25 $6,492.50Clear & Grub 25740 sf $0.10 $2,574.00Curb (Type 3) 2438 lf $14.00 $34,132.00SWPPP 1350 lf $18.00 $24,300.00Traffic Signal Modification 3 leg $12,000.00 $36,000.00
Subtotal $251,278.5020%
Assumes 2x2 Tee is constructed prior to 4x4 Tee Total $301,534.20Contengency included to cover stage construction costs
4x6 4x6 Ultimate (No Phasing) constructed per unit price below. 4x6 4x6 Ultimate (No Phasing) constructed per unit price below.Fee Developer
Quantity Unit $/unit $ Quantity Unit $/unit $Excavation 5244 cy $12.00 $62,928.00 Excavation 5126 cy $12.00 $61,512.00
Depth of AC 6.5 $3.25 Depth of AC 6.5 $3.25Depth of AB 16 $1.75 Depth of AB 16 $1.75
Striping 8532 lf $1.25 $10,665.00 Striping 6072 lf $1.25 $7,590.00Med Landscape 20972 sf $6.00 $125,832.00 Frontage Landscape 25176 sf $6.00 $151,056.00Clear & Grub 94584 sf $0.10 $9,458.40 Clear & Grub 115764 sf $0.10 $11,576.40Curb (Type 2) 404 lf $20.00 $8,080.00 Curb (Type 2) 2788 lf $20.00 $55,760.00Sidewalk 2360 sf $6.00 $14,160.00 Sidewalk 19544 sf $6.00 $117,264.00Curb (Type 3) 3080 lf $14.00 $43,120.00 Storm Drain Sys. 1800 lf $12.00 $21,600.00Storm Drain Sys. 1800 lf $100.00 $180,000.00 SWPPP 1800 lf $9.00 $16,200.00SWPPP 1800 lf $9.00 $16,200.00 Street Lights 1800 lf $50.00 $90,000.00Signal Interconect 1800 lf $12.00 $21,600.00 Subtotal $827,188.40Traffic Signal 4 leg $55,000.00 $220,000.00
Subtotal $1,080,053.40 Assumes Fee is constructed together with Developer Total $827,188.40
Assumes Fee is constructed together with Developer Total $1,080,053.40
4x4 LANE TEE ULTIMATE INTERSECTION - 2x2 LANE TEE PHASE 1
50400 sf $252,000.00
25740 sf $128,700.00
sf $294,630.00
16673 sf $83,365.00
4x4 LANE TEE ULTIMATE INTERSECTION
42413 sf $212,065.00 50400 sf $252,000.00
4x6 LANE ULTIMATE INTERSECTION
73602 sf $368,010.00 58926
2 OF 8

ATTACHMENT 3 UNIT COST AND COST ESTIMATE METHODOLOGY
FEE or CITY PORTION DEVELOPER PORTION
2x4 PHASE 1 - 4x6 Ultimate; 2x4 Outside Lanes + median actually constructed per unit price below. 2x4 PHASE 1 - 4x6 Ultimate; 2x4 Outside Lanes + median actually constructed per unit price below.Fee Developer
Quantity Unit $/unit $ Quantity Unit $/unit $Excavation 2790 cy $12.00 $33,480.00 Excavation 5126 cy $12.00 $61,512.00
Depth of AC 6.5 $3.25 Depth of AC 6.5 $3.25Depth of AB 16 $1.75 Depth of AB 16 $1.75
Striping 4744 lf $1.25 $5,930.00 Striping 6072 lf $1.25 $7,590.00Med Landscape (Temporary) 35334 sf $3.00 $106,002.00 Frontage Landscape 25176 sf $6.00 $151,056.00Med Landscape 20972 sf $6.00 $125,832.00 Clear & Grub 115764 sf $0.10 $11,576.40Clear & Grub 94584 sf $0.10 $9,458.40 Curb (Type 2) 2788 lf $20.00 $55,760.00Curb (Type 2) 404 lf $20.00 $8,080.00 Sidewalk 19544 sf $6.00 $117,264.00AC Dike (Type A) 3080 lf $3.00 $9,240.00 Storm Drain Sys. 1800 lf $12.00 $21,600.00Sidewalk 2360 sf $6.00 $14,160.00 SWPPP 1800 lf $9.00 $16,200.00Storm Drain Sys. 1800 lf $100.00 $180,000.00 Street Lights 1800 lf $50.00 $90,000.00SWPPP 1800 lf $9.00 $16,200.00 Subtotal $827,188.40Signal Interconect 1800 lf $12.00 $21,600.00
Traffic Signal 4 leg $55,000.00 $220,000.00 Assumes Fee is constructed together with Developer Total $827,188.40Subtotal $941,322.40
Assumes Fee is constructed together with Developer Total $941,322.40
4x6 PHASE 2 - Inside lanes added to 2x4 intersection to create 4x6 per unit price below.Fee
Quantity Unit $/unit $Excavation 2454 cy $12.00 $29,448.00
Depth of AC 6.5 $3.25Depth of AB 16 $1.75
Striping 8532 lf $1.25 $10,665.00Clear & Grub 35334 sf $0.10 $3,533.40Curb (Type 3) 3080 lf $14.00 $43,120.00SWPPP 1800 lf $18.00 $32,400.00Traffic Signal Modification 4 leg $12,000.00 $48,000.00
Subtotal $343,836.4020%
Assumes 2x4 is constructed prior to 4x6 Total $412,603.68Contengency included to cover stage construction costs
2x6 PHASE 1A - 4x6 Ultimate; 2x6 Outside Lanes + median actually constructed per unit price below. 2x6 PHASE 1A - 4x6 Ultimate; 2x6 Outside Lanes + median actually constructed per unit price below.Fee Developer
Quantity Unit $/unit $ Quantity Unit $/unit $Excavation 4085 cy $12.00 $49,020.00 Excavation 5126 cy $12.00 $61,512.00
Depth of AC 6.5 $3.25 Depth of AC 6.5 $3.25Depth of AB 16 $1.75 Depth of AB 16 $1.75
Striping 6956 lf $1.25 $8,695.00 Striping 6072 lf $1.25 $7,590.00Med Landscape (Temporary) 11174 sf $3.00 $33,522.00 Frontage Landscape 25176 sf $6.00 $151,056.00Med Landscape 20972 sf $6.00 $125,832.00 Clear & Grub 115764 sf $0.10 $11,576.40Clear & Grub 94584 sf $0.10 $9,458.40 Curb (Type 2) 2788 lf $20.00 $55,760.00Curb (Type 2) 404 lf $20.00 $8,080.00 Sidewalk 19544 sf $6.00 $117,264.00AC Dike (Type A) 1540 lf $3.00 $4,620.00 Storm Drain Sys. 1800 lf $12.00 $21,600.00Curb (Type 3) 1540 lf $14.00 $21,560.00 SWPPP 1800 lf $9.00 $16,200.00Sidewalk 2360 sf $6.00 $14,160.00 Street Lights 1800 lf $50.00 $90,000.00Storm Drain Sys. 1800 lf $100.00 $180,000.00 Subtotal $827,188.40SWPPP 1800 lf $9.00 $16,200.00
Signal Interconect 1800 lf $12.00 $21,600.00 Assumes Fee is constructed together with Developer Total $827,188.40Traffic Signal 4 leg $55,000.00 $220,000.00
Subtotal $1,006,797.40
Assumes Fee is constructed together with Developer Total $1,006,797.40
4x6 PHASE 2A - Inside lanes added to 2x6 intersection to create 4x6 per unit price below.Fee
Quantity Unit $/unit $Excavation 1192 cy $12.00 $14,304.00
Depth of AC 6.5 $3.25Depth of AB 16 $1.75
Striping 3376 lf $1.25 $4,220.00Clear & Grub 17160 sf $0.10 $1,716.00Curb (Type 3) 1540 lf $14.00 $21,560.00SWPPP 900 lf $18.00 $16,200.00Traffic Signal Modification 2 leg $12,000.00 $24,000.00
Subtotal $167,800.0020%
Assumes 2x6 is constructed prior to 4x6 Total $201,360.00Contengency included to cover stage construction costs
4x6 LANE ULTIMATE INTERSECTION - 2x6 LANE PHASE 1
58810 sf $294,050.00 58926 sf $294,630.00
17160 sf $85,800.00
35334 sf
38268 sf $191,340.00 58926 sf $294,630.00
4x6 LANE ULTIMATE INTERSECTION - 2x4 LANE PHASE 1
$176,670.00
3 OF 8

ATTACHMENT 3 UNIT COST AND COST ESTIMATE METHODOLOGY
FEE or CITY PORTION DEVELOPER PORTION
4x4 PHASE 1B - 4x6 Ultimate; 4x4 Outside Lanes + median actually constructed per unit price below. 4x4 PHASE 1B - 4x6 Ultimate; 4x4 Outside Lanes + median actually constructed per unit price below.Fee Developer
Quantity Unit $/unit $ Quantity Unit $/unit $Excavation 4058 cy $12.00 $48,696.00 Excavation 5126 cy $12.00 $61,512.00
Depth of AC 6.5 $3.25 Depth of AC 6.5 $3.25Depth of AB 16 $1.75 Depth of AB 16 $1.75
Striping 33622.5 lf $1.25 $42,028.13 Striping 6072 lf $1.25 $7,590.00Med Landscape (Temporary) 8870 sf $3.00 $26,610.00 Frontage Landscape 25176 sf $6.00 $151,056.00Med Landscape 20972 sf $6.00 $125,832.00 Clear & Grub 115764 sf $0.10 $11,576.40Clear & Grub 94584 sf $0.10 $9,458.40 Curb (Type 2) 2788 lf $20.00 $55,760.00Curb (Type 2) 404 lf $20.00 $8,080.00 Sidewalk 19544 sf $6.00 $117,264.00AC Dike (Type A) 1540 lf $3.00 $4,620.00 Storm Drain Sys. 1800 lf $12.00 $21,600.00Curb (Type 3) 1540 lf $14.00 $21,560.00 SWPPP 1800 lf $9.00 $16,200.00Sidewalk 2360 sf $6.00 $14,160.00 Street Lights 1800 lf $50.00 $90,000.00Storm Drain Sys. 1800 lf $100.00 $180,000.00 Subtotal $827,188.40SWPPP 1800 lf $9.00 $16,200.00
Signal Interconect 1800 lf $12.00 $21,600.00 Assumes Fee is constructed together with Developer Total $827,188.40Traffic Signal 4 leg $55,000.00 $220,000.00
Subtotal $1,031,019.53
Assumes Fee is constructed together with Developer Total $1,031,019.53
4x6 PHASE 2B - Inside lanes added to 4x4 intersection to create 4x6 per unit price below.Fee
Quantity Unit $/unit $Excavation 1218 cy $12.00 $14,616.00
Depth of AC 6.5 $3.25Depth of AB 16 $1.75
Striping 4353 lf $1.25 $5,441.25Clear & Grub 17535 sf $0.10 $1,753.50Curb (Type 3) 1540 lf $14.00 $21,560.00SWPPP 900 lf $18.00 $16,200.00Traffic Signal Modification 2 leg $12,000.00 $24,000.00
Subtotal $171,245.7520%
Assumes 4x4 is constructed prior to 4x6 Total $205,494.90Contengency included to cover stage construction costs
4x6 TEE 4x6 Tee Ultimate (No Phasing) constructed per unit price below. 4x6 TEE 4x6 Tee Ultimate (No Phasing) constructed per unit price below.Fee Developer
Quantity Unit $/unit $ Quantity Unit $/unit $Excavation 4322 cy $12.00 $51,864.00 Excavation 3927 cy $12.00 $47,124.00
Depth of AC 6.5 $3.25 Depth of AC 6.5 $3.25Depth of AB 16 $1.75 Depth of AB 16 $1.75
Striping 6822 lf $1.25 $8,527.50 Striping 4532 lf $1.25 $5,665.00Med Landscape 26632 sf $6.00 $159,792.00 Frontage Landscape 18942 sf $6.00 $113,652.00Clear & Grub 75673 sf $0.10 $7,567.30 Clear & Grub 86861 sf $0.10 $8,686.10Curb (Type 2) 300 lf $20.00 $6,000.00 Curb (Type 2) 2162 lf $20.00 $43,240.00Sidewalk 1748 sf $6.00 $10,488.00 Sidewalk 14795 sf $6.00 $88,770.00Curb (Type 3) 2321 lf $14.00 $32,494.00 Storm Drain Sys. 1350 lf $12.00 $16,200.00Storm Drain Sys. 1350 lf $100.00 $135,000.00 SWPPP 1350 lf $9.00 $12,150.00SWPPP 1350 lf $9.00 $12,150.00 Street Lights 1350 lf $50.00 $67,500.00Signal Interconect 1350 lf $12.00 $16,200.00 Subtotal $628,977.10Traffic Signal 3 leg $55,000.00 $165,000.00
Subtotal $909,112.80 Assumes Fee is constructed together with Developer Total $628,977.10
Assumes Fee is constructed together with Developer Total $909,112.80
2x4 TEE PHASE 1 - 4x6 Tee Ultimate; 2x4 Tee Outside Lanes + median actually constructed per unit price below. 2x4 TEE PHASE 1 - 4x6 Tee Ultimate; 2x4 Tee Outside Lanes + median actually constructed per unit price below.Fee Developer
Quantity Unit $/unit $ Quantity Unit $/unit $Excavation 2472 cy $12.00 $29,664.00 Excavation 3927 cy $12.00 $47,124.00
Depth of AC 6.5 $3.25 Depth of AC 6.5 $3.25Depth of AB 16 $1.75 Depth of AB 16 $1.75
Striping 3771 lf $1.25 $4,713.75 Striping 4532 lf $1.25 $5,665.00Med Landscape (Temporary) 26632 sf $3.00 $79,896.00 Frontage Landscape 18942 sf $6.00 $113,652.00Med Landscape 15816 sf $6.00 $94,896.00 Clear & Grub 86861 sf $0.10 $8,686.10Clear & Grub 75673 sf $0.10 $7,567.30 Curb (Type 2) 2162 lf $20.00 $43,240.00Curb (Type 2) 300 lf $20.00 $6,000.00 Sidewalk 14795 sf $6.00 $88,770.00AC Dike (Type A) 2321 lf $3.00 $6,963.00 Storm Drain Sys. 1350 lf $12.00 $16,200.00Sidewalk 1748 sf $6.00 $10,488.00 SWPPP 1350 lf $9.00 $12,150.00Storm Drain Sys. 1350 lf $100.00 $135,000.00 Street Lights 1350 lf $50.00 $67,500.00SWPPP 1350 lf $9.00 $12,150.00 Subtotal $628,977.10Signal Interconect 1350 lf $12.00 $16,200.00
Traffic Signal 3 leg $55,000.00 $165,000.00 Assumes Fee is constructed together with Developer Total $628,977.10Subtotal $739,408.05
Assumes Fee is constructed together with Developer Total $739,408.05
4x6 TEE PHASE 2 - Inside lanes added to 2x4 Tee intersection to create 4x6 Tee per unit price below.Fee
Quantity Unit $/unit $Excavation 1850 cy $12.00 $22,200.00
Depth of AC 6.5 $3.25Depth of AB 16 $1.75
Striping 6822 lf $1.25 $8,527.50Clear & Grub 26632 sf $0.10 $2,663.20Curb (Type 3) 2321 lf $14.00 $32,494.00SWPPP 1350 lf $18.00 $24,300.00Traffic Signal Modification 3 leg $12,000.00 $36,000.00
Subtotal $259,344.7020%
Assumes 2x4 is constructed prior to 4x6 Total $311,213.64Contengency included to cover stage construction costs
4x6 LANE TEE ULTIMATE INTERSECTION - 2x4 LANE TEE PHASE 1
4x6 LANE ULTIMATE INTERSECTION - 4x4 LANE PHASE 1
58435 sf $292,175.00 58926 sf $294,630.00
17535 sf $87,675.00
sf $304,030.00 45198 sf
45198 sf $225,990.0034174 sf $170,870.00
4x6 LANE TEE ULTIMATE INTERSECTION
$225,990.00
26632 sf $133,160.00
60806
4 OF 8

ATTACHMENT 3 UNIT COST AND COST ESTIMATE METHODOLOGY
FEE or CITY PORTION DEVELOPER PORTION
6x6 6x6 Ultimate (No Phasing) constructed per unit price below. 6x6 6x6 Ultimate (No Phasing) constructed per unit price below.Fee Developer
Quantity Unit $/unit $ Quantity Unit $/unit $Excavation 6625 cy $12.00 $79,500.00 Excavation 5204 cy $12.00 $62,448.00
Depth of AC 6.5 $3.50 Depth of AC 6.5 $3.50Depth of AB 16 $2.00 Depth of AB 16 $2.00
Striping 8705 lf $1.25 $10,881.25 Striping 6050 lf $1.25 $7,562.50Med Landscape 17740 sf $6.00 $106,440.00 Frontage Landscape 24825 sf $6.00 $148,950.00Clear & Grub 113125 sf $0.10 $11,312.50 Clear & Grub 114200 sf $0.10 $11,420.00Curb (Type 2) 416 lf $20.00 $8,320.00 Curb (Type 2) 2745 lf $20.00 $54,900.00Curb (Type 3) 3052 lf $14.00 $42,728.00 Sidewalk 19248 sf $6.00 $115,488.00Sidewalk 2348 sf $6.00 $14,088.00 Storm Drain Sys. 1800 lf $12.00 $21,600.00Storm Drain Sys. 1800 lf $100.00 $180,000.00 SWPPP 1800 lf $9.00 $16,200.00SWPPP 1800 lf $9.00 $16,200.00 Street Lights 1800 lf $50.00 $90,000.00Signal Interconect 1800 lf $12.00 $21,600.00 Subtotal $849,394.50Traffic Signal 4 leg $55,000.00 $220,000.00
Subtotal $1,235,714.75 Assumes Fee is constructed together with Developer Total $849,394.50
Assumes Fee is constructed together with Developer Total $1,235,714.75
4x4 PHASE 1 - 6x6 Ultimate; 4x4 Outside Lanes + median actually constructed per unit price below. 4x4 PHASE 1 - 6x6 Ultimate; 4x4 Outside Lanes + median actually constructed per unit price below.Fee Developer
Quantity Unit $/unit $ Quantity Unit $/unit $Excavation 4190 cy $12.00 $50,280.00 Excavation 5204 cy $12.00 $62,448.00
Depth of AC 6.5 $3.50 Depth of AC 6.5 $3.50Depth of AB 16 $2.00 Depth of AB 16 $2.00
Striping 6870 lf $1.25 $8,587.50 Striping 6050 lf $1.25 $7,562.50Med Landscape (Temporary) 35070 sf $3.00 $105,210.00 Frontage Landscape 24825 sf $6.00 $148,950.00Med Landscape 17740 sf $6.00 $106,440.00 Clear & Grub 114200 sf $0.10 $11,420.00Clear & Grub 113125 sf $0.10 $11,312.50 Curb (Type 2) 2745 lf $20.00 $54,900.00Curb (Type 2) 416 lf $20.00 $8,320.00 Sidewalk 19248 sf $6.00 $115,488.00AC Dike (Type A) 3052 lf $3.00 $9,156.00 Storm Drain Sys. 1800 lf $12.00 $21,600.00Sidewalk 2348 sf $6.00 $14,088.00 SWPPP 1800 lf $9.00 $16,200.00Storm Drain Sys. 1800 lf $100.00 $180,000.00 Street Lights 1800 lf $50.00 $90,000.00SWPPP 1800 lf $9.00 $16,200.00 Subtotal $849,394.50Signal Interconect 1800 lf $12.00 $21,600.00
Traffic Signal 4 leg $55,000.00 $220,000.00 Assumes Fee is constructed together with Developer Total $849,394.50Subtotal $1,082,954.00
Assumes Fee is constructed together with Developer Total $1,082,954.00
6x6 PHASE 2 - Inside lanes added to 4x4 intersection to create 6x6 per unit price below.Fee
Quantity Unit $/unit $Excavation 2435 cy $12.00 $29,220.00
Depth of AC 6.5 $3.50Depth of AB 16 $2.00
Striping 8705 lf $1.25 $10,881.25Clear & Grub 35070 sf $0.10 $3,507.00Curb (Type 3) 3052 lf $14.00 $42,728.00SWPPP 1800 lf $18.00 $32,400.00Traffic Signal Modification 4 leg $12,000.00 $48,000.00
Subtotal $359,621.2520%
Assumes 4x4 is constructed prior to 6x6 Total $431,545.50Contengency included to cover stage construction costs
4x6 PHASE 1 - 6x6 Ultimate; 4x6 Outside Lanes + median actually constructed per unit price below. 4x6 PHASE 1 - 6x6 Ultimate; 4x6 Outside Lanes + median actually constructed per unit price below.Fee Developer
Quantity Unit $/unit $ Quantity Unit $/unit $Excavation 5408 cy $12.00 $64,896.00 Excavation 5204 cy $12.00 $62,448.00
Depth of AC 6.5 $3.50 Depth of AC 6.5 $3.50Depth of AB 16 $2.00 Depth of AB 16 $2.00
Striping 7788 lf $1.25 $9,735.00 Striping 6050 lf $1.25 $7,562.50Med Landscape (Temporary) 17535 sf $3.00 $52,605.00 Frontage Landscape 24825 sf $6.00 $148,950.00Med Landscape 17740 sf $6.00 $106,440.00 Clear & Grub 114200 sf $0.10 $11,420.00Clear & Grub 113125 sf $0.10 $11,312.50 Curb (Type 2) 2745 lf $20.00 $54,900.00Curb (Type 2) 416 lf $20.00 $8,320.00 Sidewalk 19248 sf $6.00 $115,488.00Curb (Type 3) 1526 lf $14.00 $21,364.00 Storm Drain Sys. 1800 lf $12.00 $21,600.00AC Dike (Type A) 1526 lf $3.00 $4,578.00 SWPPP 1800 lf $9.00 $16,200.00Sidewalk 2348 sf $6.00 $14,088.00 Street Lights 1800 lf $50.00 $90,000.00Storm Drain Sys. 1800 lf $100.00 $180,000.00 Subtotal $849,394.50SWPPP 1800 lf $9.00 $16,200.00
Signal Interconect 1800 lf $12.00 $21,600.00 Assumes Fee is constructed together with Developer Total $849,394.50Traffic Signal 4 leg $55,000.00 $220,000.00
Subtotal $1,159,341.00
Assumes Fee is constructed together with Developer Total $1,159,341.00
6x6 PHASE 2 - Inside lanes added to 4x6 intersection to create 6x6 per unit price below.Fee
Quantity Unit $/unit $Excavation 1218 cy $12.00 $14,616.00
Depth of AC 6.5 $3.50Depth of AB 16 $2.00
Striping 4353 lf $1.25 $5,441.25Clear & Grub 17535 sf $0.10 $1,753.50Curb (Type 3) 1526 lf $14.00 $21,364.00SWPPP 900 lf $18.00 $16,200.00Traffic Signal Modification 2 leg $12,000.00 $24,000.00
Subtotal $179,817.2520%
Assumes 4x6 is constructed prior to 6x6 Total $215,780.70Contengency included to cover stage construction costs
6x6 LANE ULTIMATE INTERSECTION - 4x4 LANE PHASE 1
sf $331,760.00
17535 sf $96,442.50
77855 sf $428,202.50
35070 sf $192,885.00
6x6 LANE ULTIMATE INTERSECTION - 4x6 LANE PHASE 1
58332 sf
95390 sf $524,645.00 58332 sf $320,826.00
$320,826.00
58332 sf $320,826.00
6x6 LANE ULTIMATE INTERSECTION
60320
5 OF 8

ATTACHMENT 3 UNIT COST AND COST ESTIMATE METHODOLOGY
FEE or CITY PORTION DEVELOPER PORTION
4x2 PHASE 1 - 6x6 Ultimate; 4x2 Outside Lanes + median actually constructed per unit price below. 4x2 PHASE 1 - 6x6 Ultimate; 4x2 Outside Lanes + median actually constructed per unit price below.Fee Developer
Quantity Unit $/unit $ Quantity Unit $/unit $Excavation 2856 cy $12.00 $34,272.00 Excavation 5204 cy $12.00 $62,448.00
Depth of AC 6.5 $3.50 Depth of AC 6.5 $3.50Depth of AB 16 $2.00 Depth of AB 16 $2.00
Striping 4744 lf $1.25 $5,930.00 Striping 6050 lf $1.25 $7,562.50Med Landscape (Temporary) 35334 sf $3.00 $106,002.00 Frontage Landscape 24825 sf $6.00 $148,950.00Med Landscape 20972 sf $6.00 $125,832.00 Clear & Grub 114200 sf $0.10 $11,420.00Clear & Grub 94584 sf $0.10 $9,458.40 Curb (Type 2) 2745 lf $20.00 $54,900.00Curb (Type 2) 404 lf $20.00 $8,080.00 Sidewalk 19248 sf $6.00 $115,488.00AC Dike (Type A) 3080 lf $3.00 $9,240.00 Storm Drain Sys. 1800 lf $12.00 $21,600.00Sidewalk 2360 sf $6.00 $14,160.00 SWPPP 1800 lf $9.00 $16,200.00Storm Drain Sys. 1800 lf $100.00 $180,000.00 Street Lights 1800 lf $50.00 $90,000.00SWPPP 1800 lf $9.00 $16,200.00 Subtotal $849,394.50Signal Interconect 1800 lf $12.00 $21,600.00
Traffic Signal 4 leg $55,000.00 $220,000.00 Assumes Fee is constructed together with Developer Total $849,394.50Subtotal $966,434.90
Assumes Fee is constructed together with Developer Total $966,434.90
6x6 PHASE 2 - Inside lanes added to 4x2 intersection to create 6x6 per unit price below.Fee
Quantity Unit $/unit $Excavation 2454 cy $12.00 $29,448.00
Depth of AC 6.5 $3.50Depth of AB 16 $2.00
Striping 8526 lf $1.25 $10,657.50Clear & Grub 35334 sf $0.10 $3,533.40Curb (Type 3) 3052 lf $14.00 $42,728.00SWPPP 1800 lf $18.00 $32,400.00Traffic Signal Modification 4 leg $12,000.00 $48,000.00
Subtotal $361,103.9020%
Assumes 4x2 is constructed prior to 6x6 Total $433,324.68Contengency included to cover stage construction costs
6x2 PHASE 1C - 6x6 Ultimate; 6x2 Outside Lanes + median actually constructed per unit price below. 6x2 PHASE 1C - 6x6 Ultimate; 6x2 Outside Lanes + median actually constructed per unit price below.Fee Developer
Quantity Unit $/unit $ Quantity Unit $/unit $Excavation 4012 cy $12.00 $48,144.00 Excavation 5204 cy $12.00 $62,448.00
Depth of AC 6.5 $3.50 Depth of AC 6.5 $3.50Depth of AB 16 $2.00 Depth of AB 16 $2.00
Striping 6299 lf $1.25 $7,873.75 Striping 6050 lf $1.25 $7,562.50Med Landscape (Temporary) 17404 sf $3.00 $52,212.00 Frontage Landscape 24825 sf $6.00 $148,950.00Med Landscape 20972 sf $6.00 $125,832.00 Clear & Grub 114200 sf $0.10 $11,420.00Clear & Grub 94584 sf $0.10 $9,458.40 Curb (Type 2) 2745 lf $20.00 $54,900.00Curb (Type 2) 404 lf $20.00 $8,080.00 Sidewalk 19248 sf $6.00 $115,488.00AC Dike (Type A) 1518 lf $3.00 $4,554.00 Storm Drain Sys. 1800 lf $12.00 $21,600.00Sidewalk 2360 sf $6.00 $14,160.00 SWPPP 1800 lf $9.00 $16,200.00Storm Drain Sys. 1800 lf $100.00 $180,000.00 Street Lights 1800 lf $50.00 $90,000.00SWPPP 1800 lf $9.00 $16,200.00 Subtotal $849,394.50Signal Interconect 1800 lf $12.00 $21,600.00
Traffic Signal 4 leg $55,000.00 $220,000.00 Assumes Fee is constructed together with Developer Total $849,394.50Subtotal $1,025,843.65
Assumes Fee is constructed together with Developer Total $1,025,843.65
6x6 PHASE 2C - Inside lanes added to 6x2 intersection to create 6x6 per unit price below.Fee
Quantity Unit $/unit $Excavation 1209 cy $12.00 $14,508.00
Depth of AC 6.5 $3.50Depth of AB 16 $2.00
Striping 5046 lf $1.25 $6,307.50Clear & Grub 17404 sf $0.10 $1,740.40Curb (Type 3) 1518 lf $14.00 $21,252.00SWPPP 900 lf $18.00 $16,200.00Traffic Signal Modification 2 leg $12,000.00 $24,000.00
Subtotal $179,729.9020%
Assumes 6x2 is constructed prior to 6x6 Total $215,675.88Contengency included to cover stage construction costs
6x6 TEE 6x6 Tee Ultimate (No Phasing) constructed per unit price below. 6x6 TEE 6x6 Tee Ultimate (No Phasing) constructed per unit price below.Fee Developer
Quantity Unit $/unit $ Quantity Unit $/unit $Excavation 4969 cy $12.00 $59,628.00 Excavation 3927 cy $12.00 $47,124.00
Depth of AC 6.5 $3.50 Depth of AC 6.5 $3.50Depth of AB 16 $2.00 Depth of AB 16 $2.00
Striping 6529 lf $1.25 $8,161.25 Striping 4532 lf $1.25 $5,665.00Med Landscape 13305 sf $6.00 $79,830.00 Frontage Landscape 18942 sf $6.00 $113,652.00Clear & Grub 84844 sf $0.10 $8,484.40 Clear & Grub 86861 sf $0.10 $8,686.10Curb (Type 2) 312 lf $20.00 $6,240.00 Curb (Type 2) 2162 lf $20.00 $43,240.00Curb (Type 3) 2289 lf $14.00 $32,046.00 Sidewalk 14795 sf $6.00 $88,770.00Sidewalk 1761 sf $6.00 $10,566.00 Storm Drain Sys. 1350 lf $12.00 $16,200.00Storm Drain Sys. 1350 lf $100.00 $135,000.00 SWPPP 1350 lf $9.00 $12,150.00SWPPP 1350 lf $9.00 $12,150.00 Street Lights 1350 lf $50.00 $67,500.00Signal Interconect 1350 lf $12.00 $16,200.00 Subtotal $651,576.10Traffic Signal 3 leg $55,000.00 $165,000.00
Subtotal $926,792.15 Assumes Fee is constructed together with Developer Total $651,576.10
Assumes Fee is constructed together with Developer Total $926,792.15
sf $95,722.00
35334 sf $194,337.00
6x6 LANE TEE ULTIMATE INTERSECTION
39211 sf $215,660.50
6x6 LANE ULTIMATE INTERSECTION - 6x2 LANE PHASE 1
57769 sf $317,729.50 58332 sf $320,826.00
17404
58332 sf
$248,589.0071543 sf $393,486.50 45198 sf
6x6 LANE ULTIMATE INTERSECTION - 4x2 LANE PHASE 1
$320,826.00
6 OF 8

ATTACHMENT 3 UNIT COST AND COST ESTIMATE METHODOLOGY
FEE or CITY PORTION DEVELOPER PORTION
6x2 TEE 6x2 Tee Ultimate (No Phasing) constructed per unit price below. 6x2 TEE 6x2 Tee Ultimate (No Phasing) constructed per unit price below.Fee Developer
Quantity Unit $/unit $ Quantity Unit $/unit $Excavation 3313 cy $12.00 $39,756.00 Excavation 3927 cy $12.00 $47,124.00
Depth of AC 6.5 $3.50 Depth of AC 6.5 $3.50Depth of AB 16 $2.00 Depth of AB 16 $2.00
Striping 4353 lf $1.25 $5,441.25 Striping 4532 lf $1.25 $5,665.00Med Landscape 8870 sf $6.00 $53,220.00 Frontage Landscape 18942 sf $6.00 $113,652.00Clear & Grub 56563 sf $0.10 $5,656.30 Clear & Grub 86861 sf $0.10 $8,686.10Curb (Type 2) 208 lf $20.00 $4,160.00 Curb (Type 2) 2162 lf $20.00 $43,240.00Curb (Type 3) 1526 lf $14.00 $21,364.00 Sidewalk 14795 sf $6.00 $88,770.00Sidewalk 1761 sf $6.00 $10,566.00 Storm Drain Sys. 1350 lf $45.34 $61,209.00Storm Drain Sys. 900 lf $100.00 $90,000.00 SWPPP 1350 lf $12.00 $16,200.00SWPPP 900 lf $9.00 $8,100.00 Street Lights 1350 lf $50.00 $67,500.00Signal Interconect 900 lf $12.00 $10,800.00 Subtotal $700,635.10Traffic Signal 3 leg $55,000.00 $165,000.00
Subtotal $676,386.05 Assumes Fee is constructed together with Developer Total $700,635.10
Assumes Fee is constructed together with Developer Total $676,386.05
6x2 TEE PHASE 1 - 6x6 Tee Ultimate; 6x2 Tee Outside Lanes + median actually constructed per unit price below. 6x2 TEE PHASE 1 - 6x6 Tee Ultimate; 6x2 Tee Outside Lanes + median actually constructed per unit price below.Fee Developer
Quantity Unit $/unit $ Quantity Unit $/unit $Excavation 3825 cy $12.00 $45,900.00 Excavation 3927 cy $12.00 $47,124.00
Depth of AC 6.5 $3.50 Depth of AC 6.5 $3.50Depth of AB 16 $2.00 Depth of AB 16 $2.00
Striping 5432 lf $1.25 $6,790.00 Striping 4532 lf $1.25 $5,665.00Med Landscape (Temporary) 15676 sf $3.00 $47,028.00 Frontage Landscape 18942 sf $6.00 $113,652.00Med Landscape 13305 sf $6.00 $79,830.00 Clear & Grub 86861 sf $0.10 $8,686.10Clear & Grub 84844 sf $0.10 $8,484.40 Curb (Type 2) 2162 lf $20.00 $43,240.00Curb (Type 2) 312 lf $20.00 $6,240.00 Sidewalk 14795 sf $6.00 $88,770.00Curb (Type 3) 1516 lf $14.00 $21,224.00 Storm Drain Sys. 1350 lf $12.00 $16,200.00AC Dike (Type A) 758 lf $3.00 $2,274.00 SWPPP 1350 lf $9.00 $12,150.00Sidewalk 1761 sf $6.00 $10,566.00 Street Lights 1350 lf $50.00 $67,500.00Storm Drain Sys. 1350 lf $100.00 $135,000.00 Subtotal $651,576.10SWPPP 1350 lf $9.00 $12,150.00
Signal Interconect 1350 lf $12.00 $16,200.00 Assumes Fee is constructed together with Developer Total $651,576.10Traffic Signal 3 leg $55,000.00 $165,000.00
Subtotal $859,571.40
Assumes Fee is constructed together with Developer Total $859,571.40
6x6 TEE PHASE 2 - Inside lanes added to 6x2 Tee intersection to create 6x6 Tee per unit price below.Fee
Quantity Unit $/unit $Excavation 1089 cy $12.00 $13,068.00
Depth of AC 6.5 $3.50Depth of AB 16 $2.00
Striping 2383 lf $1.25 $2,978.75Clear & Grub 15676 sf $0.10 $1,567.60Curb (Type 3) 758 lf $14.00 $10,612.00SWPPP 450 lf $18.00 $8,100.00Traffic Signal Modification 1 leg $12,000.00 $12,000.00
Subtotal $134,544.3520%
Assumes 6x2 Tee is constructed prior to 6x6 Tee Total $161,453.22
6x4 TEE PHASE 1 - 6x6 Tee Ultimate; 6x4 Tee Outside Lanes + median actually constructed per unit price below. 6x4 TEE PHASE 1 - 6x6 Tee Ultimate; 6x4 Tee Outside Lanes + median actually constructed per unit price below.Fee Developer
Quantity Unit $/unit $ Quantity Unit $/unit $Excavation 4360 cy $12.00 $52,320.00 Excavation 3927 cy $12.00 $47,124.00
Depth of AC 6.5 $3.50 Depth of AC 6.5 $3.50Depth of AB 16 $2.00 Depth of AB 16 $2.00
Striping 6070 lf $1.25 $7,587.50 Striping 4532 lf $1.25 $5,665.00Med Landscape (Temporary) 8768 sf $3.00 $26,304.00 Frontage Landscape 18942 sf $6.00 $113,652.00Med Landscape 13305 sf $6.00 $79,830.00 Clear & Grub 86861 sf $0.10 $8,686.10Clear & Grub 84844 sf $0.10 $8,484.40 Curb (Type 2) 2162 lf $20.00 $43,240.00Curb (Type 2) 312 lf $20.00 $6,240.00 Sidewalk 14795 sf $6.00 $88,770.00Curb (Type 3) 1526 lf $14.00 $21,364.00 Storm Drain Sys. 1350 lf $12.00 $16,200.00AC Dike (Type A) 758 lf $3.00 $2,274.00 SWPPP 1350 lf $9.00 $12,150.00Sidewalk 1761 sf $6.00 $10,566.00 Street Lights 1350 lf $50.00 $67,500.00Storm Drain Sys. 1350 lf $100.00 $135,000.00 Subtotal $651,576.10SWPPP 1350 lf $9.00 $12,150.00
Signal Interconect 1350 lf $12.00 $16,200.00 Assumes Fee is constructed together with Developer Total $651,576.10Traffic Signal 3 leg $55,000.00 $165,000.00
Subtotal $888,582.40
Assumes Fee is constructed together with Developer Total $888,582.40
6x6 TEE PHASE 2 - Inside lanes added to 6x4 Tee intersection to create 6x6 Tee per unit price below.Fee
Quantity Unit $/unit $Excavation 609 cy $12.00 $7,308.00
Depth of AC 6.5 $3.50Depth of AB 16 $2.00
Striping 2177 lf $1.25 $2,721.25Clear & Grub 8768 sf $0.10 $876.80Curb (Type 3) 758 lf $14.00 $10,612.00SWPPP 450 lf $18.00 $8,100.00Traffic Signal Modification 1 leg $12,000.00 $12,000.00
Subtotal $89,842.0520%
Assumes 6x2 Tee is constructed prior to 6x6 Tee Total $107,810.46
6x6 LANE TEE ULTIMATE INTERSECTION - 6x2 LANE TEE PHASE 1
6x6 LANE TEE ULTIMATE INTERSECTION - 6x4 LANE TEE PHASE 1
15676 sf $86,218.00
55070 sf $302,885.00 45198 sf $248,589.00
6x2 LANE TEE ULTIMATE INTERSECTION
47695 sf $262,322.50 45198 sf $248,589.00
8768 sf $48,224.00
62775 sf $345,262.50 45198 sf $248,589.00
7 OF 8

ATTACHMENT 3 UNIT COST AND COST ESTIMATE METHODOLOGY
FEE or CITY PORTION DEVELOPER PORTION
6x2 TEE PHASE 1 - 6x4 Tee Ultimate; 6x2 Tee Outside Lanes + median actually constructed per unit price below. 6x2 TEE PHASE 1 - 6x4 Tee Ultimate; 6x2 Tee Outside Lanes + median actually constructed per unit price below.Fee Developer
Quantity Unit $/unit $ Quantity Unit $/unit $Excavation 3719 cy $12.00 $44,628.00 Excavation 3927 cy $12.00 $47,124.00
Depth of AC 6.5 $3.50 Depth of AC 6.5 $3.50Depth of AB 16 $2.00 Depth of AB 16 $2.00
Striping 5326 lf $1.25 $6,657.50 Striping 4532 lf $1.25 $5,665.00Med Landscape (Temporary) 15921 sf $3.00 $47,763.00 Frontage Landscape 18942 sf $6.00 $113,652.00Med Landscape 15814 sf $6.00 $94,884.00 Clear & Grub 86861 sf $0.10 $8,686.10Clear & Grub 74821 sf $0.10 $7,482.10 Curb (Type 2) 2162 lf $20.00 $43,240.00Curb (Type 2) 300 lf $20.00 $6,000.00 Sidewalk 14795 sf $6.00 $88,770.00Curb (Type 3) 1494 lf $14.00 $20,916.00 Storm Drain Sys. 1350 lf $12.00 $16,200.00AC Dike (Type A) 759 lf $3.00 $2,277.00 SWPPP 1350 lf $9.00 $12,150.00Sidewalk 1748 sf $6.00 $10,488.00 Street Lights 1350 lf $50.00 $67,500.00Storm Drain Sys. 1350 lf $100.00 $135,000.00 Subtotal $651,576.10SWPPP 1350 lf $9.00 $12,150.00
Signal Interconect 1350 lf $12.00 $16,200.00 Assumes Fee is constructed together with Developer Total $651,576.10Traffic Signal 3 leg $55,000.00 $165,000.00
Subtotal $863,954.10
Assumes Fee is constructed together with Developer Total $863,954.10
6x4 TEE PHASE 2 - Inside lanes added to 6x2 Tee intersection to create 6x4 Tee per unit price below.Fee
Quantity Unit $/unit $Excavation 1106 cy $12.00 $13,272.00
Depth of AC 6.5 $3.50Depth of AB 16 $2.00
Striping 1684 lf $1.25 $2,105.00Clear & Grub 15921 sf $0.10 $1,592.10Curb (Type 3) 759 lf $14.00 $10,626.00SWPPP 450 lf $18.00 $8,100.00Traffic Signal Modification 1 leg $12,000.00 $12,000.00
Subtotal $135,260.6020%
Assumes 6x2 Tee is constructed prior to 6x4 Tee Total $162,312.72
6x4 LANE TEE ULTIMATE INTERSECTION - 6x2 LANE TEE PHASE 1
53547 sf $294,508.50 45198 sf $248,589.00
15921 sf $87,565.50
8 OF 8