“Update on the Future of Mineral...
60
Jon Price Nevada Bureau of Mines and Geology Round Mountain, NV (2007) Azurite & Malachite, Ely, NV (J. Scovil photo) “Update on the Future of Mineral Resources” 18 November 2011
Transcript of “Update on the Future of Mineral...

Jon Price Nevada Bureau of Mines and Geology
Round Mountain, NV (2007) Azurite & Malachite, Ely, NV (J. Scovil photo)
“Update on the Future of
Mineral Resources” 18 November 2011

Round Mountain, NV (2007)
“Update on the Future of
Mineral Resources”
Demand is high.
China is #1.
The trends will help
guide exploration.

Iron
Demand is high for nearly every mineral resource, due
to rising population and average standard of living.
~18X more production
than 100 years ago
Data source: USGS
~4X more population
than 100 years ago
~4X more per capita
consumption than
100 years ago

Demand is high for nearly every mineral resource.
Data source: USGS
Copper
~33X more
production
than 110 years ago
~8X more per capita
consumption than
100 years ago

Photo copyrighted by Michael Collier, from the AGI website, Rio
Tinto/Kennecott Utah Copper mine; the remaining
resource as of 16 May 2008 = 3.06 million metric tons of Cu
Global copper production in 2010 (16.2 million metric tons) nearly equaled over 100 years
of production from the Bingham Canyon mine (17.0 million metric tons).

Demand is high for nearly every mineral resource.
~same per capita
consumption as
100 years ago
Gold
~4X more production
than 100 years ago
Data source: USGS

Barrick’s Betze pit, 2000 Newmont’s Carlin East pit and portal, 2000
Global gold production in 2010 (2,500 metric tons) approximately equaled the cumulative
production from the Carlin trend (2,400 tons), one of world’s top regions.

Coal
~80% more
production
than 30 years ago
~same per capita
consumption as
30 years ago
(higher by ~19%)
Demand is high for nearly every mineral resource.
Data source: EIA

Coal seams near Healy, Alaska
Annual global coal production (~7.0 billion metric tons)
equals approximately 4.9 km3 of coal, or ~1,600 km2 of land
with an average coal thickness of 3 m.

Round Mountain, NV (2007)
“Update on the Future of
Mineral Resources”
Demand is high.
China is #1.
The trends will help
guide exploration.

Coal
China produces ~44%
of the world’s coal.

Valmy coal-fired power plant, Humboldt County, Nevada
The amount of CO2 released from burning of coal in 2009 would have been enough,
without natural reduction from plant growth, rain, and other processes, to raise the
concentration of CO2 in the atmosphere by ~2.6 ppmv, a bit more than the recent
global trend of CO2 increasing ~1.8 ppmv per year.

There has been a great recession in the USA, but not significantly in China,
Australia, or India (by this measure – iron ore).
Data source: USGS
Iron
With 19% of the
population, China
produces ~38% of the
world’s iron ore and
~45% of the world’s steel.

Copper
China produces only ~6% of
the world’s copper but is
aggressively seeking
resources elsewhere.

Gold China has been the #1
gold producing
country since 2007.
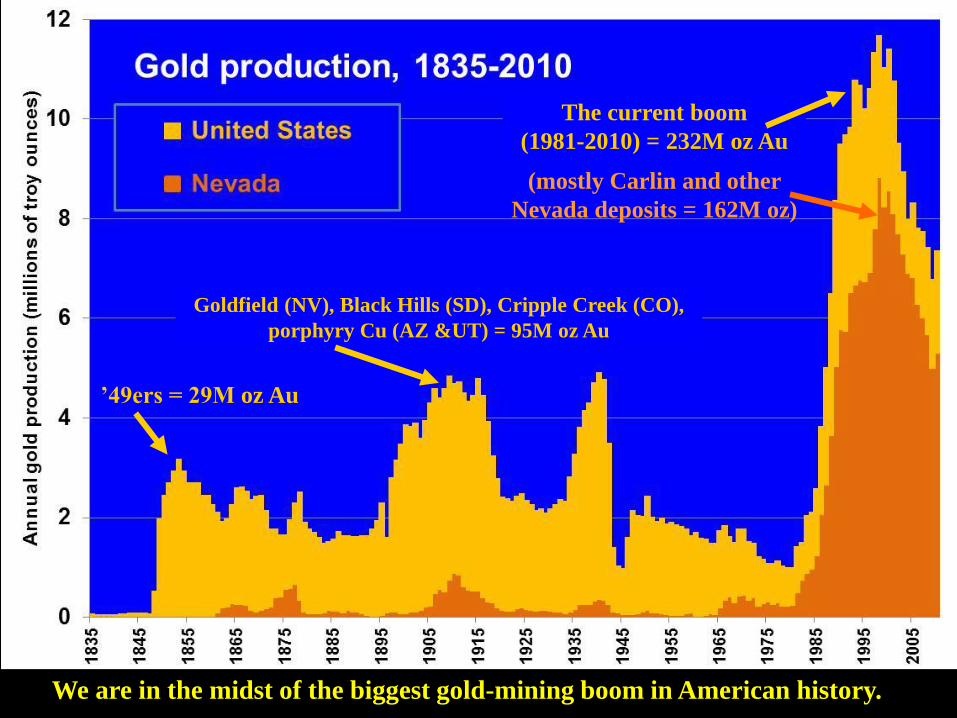
The current boom
(1981-2010) = 232M oz Au
(mostly Carlin and other
Nevada deposits = 162M oz)
Goldfield (NV), Black Hills (SD), Cripple Creek (CO),
porphyry Cu (AZ &UT) = 95M oz Au
’49ers = 29M oz Au
We are in the midst of the biggest gold-mining boom in American history.

Data source: CIA

Data sources: CIA, USGS, EIA

In production of 46 mineral commodities, China ranks well above all others.
Country Number of commodities Number of commodities
for which this country is for which this country is
the #1 producer among the top 3 producers
China 25 31
Russia 3 12
USA 2 13
Australia 2 10
2010 production statistics from USGS

Of these 46 commodities, in 2010
China was the #1 producer of 25 and
among the top three producers of 31.
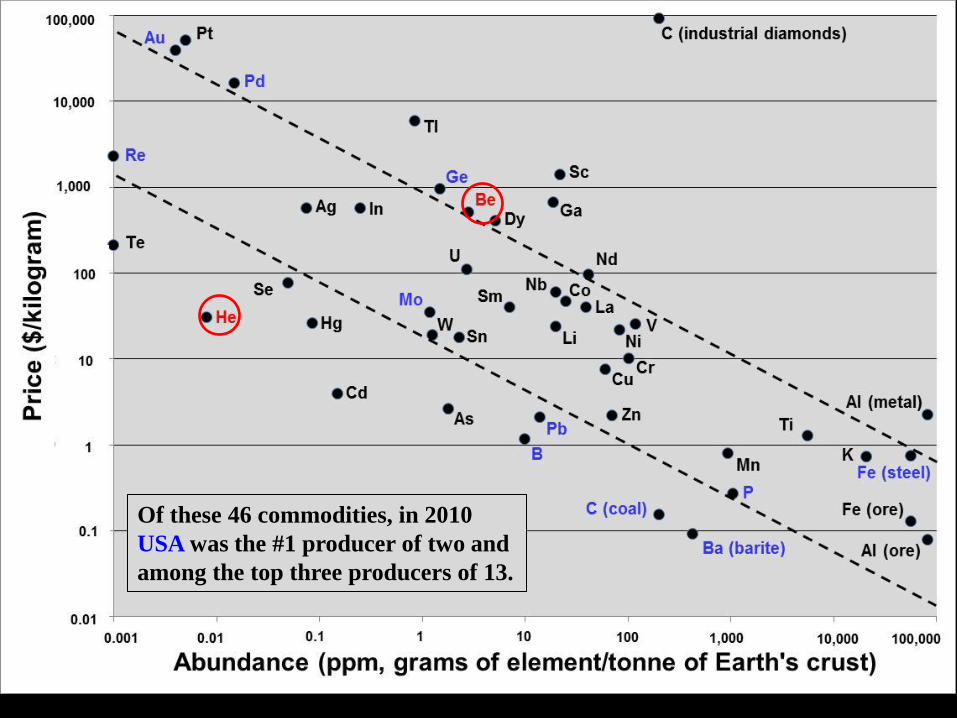
Of these 46 commodities, in 2010
USA was the #1 producer of two and
among the top three producers of 13.

Of these 46 commodities, in 2010 Russia
was the #1 producer of three and among
the top three producers of 12.

Of these 46 commodities, in 2010
Australia was the #1 producer of two and
among the top three producers of 10.

So what?
And who cares?

Round Mountain, NV (2007)
“Update on the Future of
Mineral Resources”
Demand is high.
China is #1.
The trends will help
guide exploration.
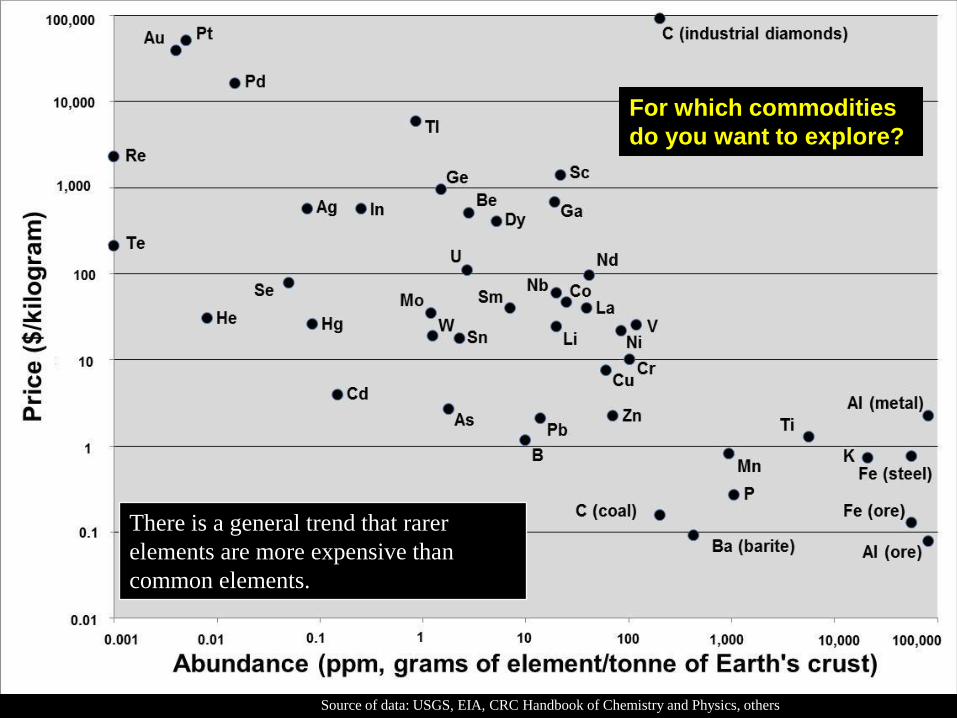
There is a general trend that rarer
elements are more expensive than
common elements.
Source of data: USGS, EIA, CRC Handbook of Chemistry and Physics, others
For which commodities
do you want to explore?
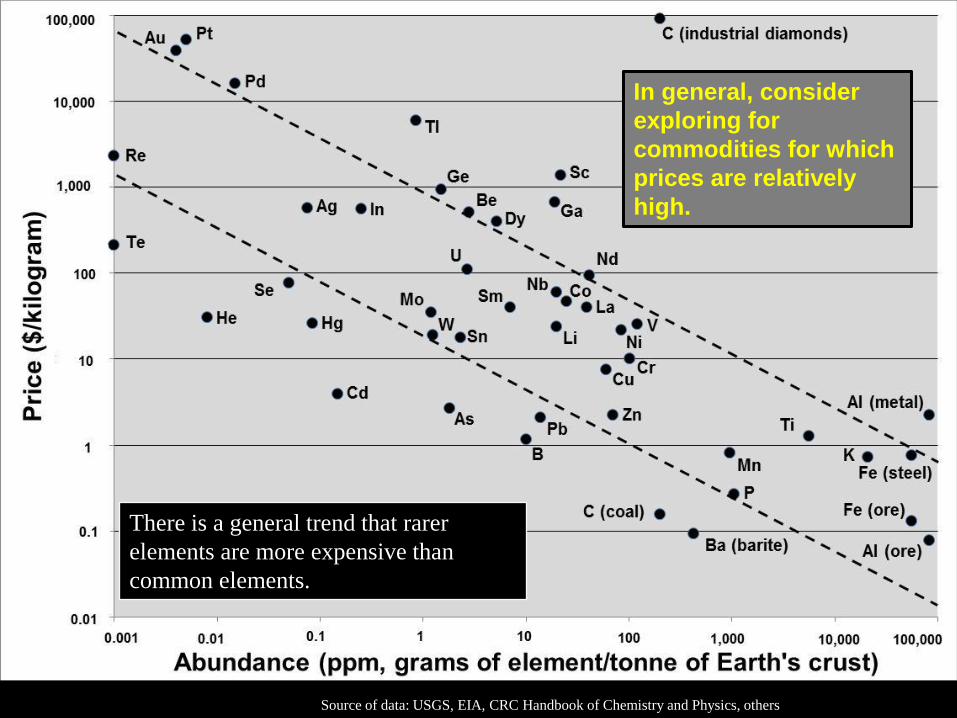
There is a general trend that rarer
elements are more expensive than
common elements.
Source of data: USGS, EIA, CRC Handbook of Chemistry and Physics, others
In general, consider
exploring for
commodities for which
prices are relatively
high.

Source of data: USGS, EIA, CRC Handbook of Chemistry and Physics, others

The average annual price of gold is reaching the inflation-adjusted historical high;
$613/ounce in 1980 = $1,689/ounce in 2011, when adjusted for inflation.

In general, the prices of commodity prices have risen in recent years.

In general, gold has kept its purchasing power over the years. Gold is money.

Of these 46 commodities, in 2010
China was the #1 producer of 25 and
among the top three producers of 31.
Consider exploring for
commodities for which
China may control the
market: REEs, W, Sn,
In, barite.


Consider exploring for
mineral resources that
will likely be in higher
demand in the future.
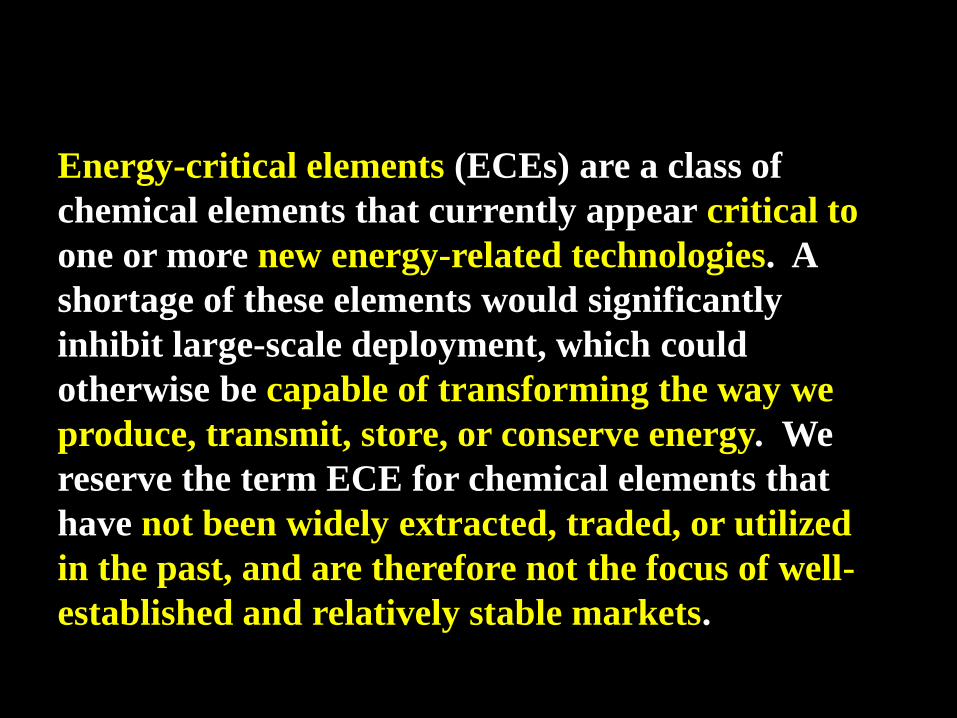
Definition:
Energy-critical elements (ECEs) are a class of
chemical elements that currently appear critical to
one or more new energy-related technologies. A
shortage of these elements would significantly
inhibit large-scale deployment, which could
otherwise be capable of transforming the way we
produce, transmit, store, or conserve energy. We
reserve the term ECE for chemical elements that
have not been widely extracted, traded, or utilized
in the past, and are therefore not the focus of well-
established and relatively stable markets.

Some ECEs today

• Renewable
• CO2 neutral
Tellurium Gallium Indium Germanium
Neodymium Dysprosium
Praseodymium
Samarium
Terbium
Europium
Helium Lithium
Lanthanum
New Energy Technologies

Source of data: USGS, EIA, CRC Handbook of Chemistry and Physics, others
ECEs – less common and more expensive

Source of data: USGS, EIA, CRC Handbook of Chemistry and Physics, others
ECEs that are byproducts
from Cu-Mo
from
Cu
from natural gas
from Cu
from Zn
from Zn
from Al
from several
metals

Main product Byproduct Byproduct
Cu Se Te
Global production 16,200,000 2,260 ~500
(metric tons)
Price ($/kg) $7.54/kg $77.16/kg $210/kg
Value of global
production ($) $122 x 109 $174 x 106 $105 x 106
Ratio of values of Cu:Se = Cu:Te =
global production 700:1 1200:1
2010 data from USGS
Securing more mineral resources that are recovered as byproducts will require either
exploration for new types of resources or research on metallurgical extraction.

World’s leading copper
producer (Chile, 34%)
Countries with 4% or more
of global production
Other countries with production
or major reserves
Copper resources are broadly distributed, but not much is known
about the byproduct-element concentrations in many copper ores.
Cu
Data source: USGS
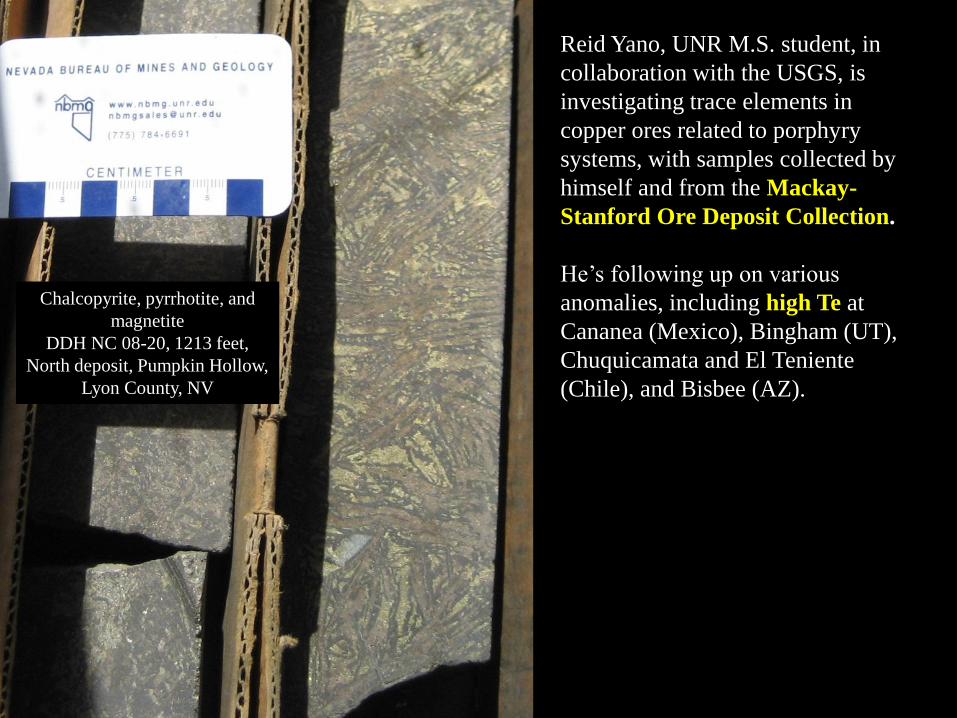
Chalcopyrite, pyrrhotite, and
magnetite
DDH NC 08-20, 1213 feet,
North deposit, Pumpkin Hollow,
Lyon County, NV
Reid Yano, UNR M.S. student, in
collaboration with the USGS, is
investigating trace elements in
copper ores related to porphyry
systems, with samples collected by
himself and from the Mackay-
Stanford Ore Deposit Collection.
He’s following up on various
anomalies, including high Te at
Cananea (Mexico), Bingham (UT),
Chuquicamata and El Teniente
(Chile), and Bisbee (AZ).

China is the Number One Producer
for 25 of these 46 commodities.
Consider exploring for
commodities for which
China doesn’t have
enough to meet its
likely domestic
demand: Au, Cu, Co, K,
PGEs, Ni, Cr.

China’s economy will likely drive up the demand for those
commodities for which it can’t mine enough domestically.
Commodity % from China % from Canada % from US Leading Producer
Platinum 0 3 2 South Africa (75%)
Potash 9 29 3 Canada (29%)
Chromium ~0 ~0 ~0 South Africa (39%)
Copper 6 3 7 Chile (34%)
Nickel 5 10 0 Russia (17%)
Production statistics from USGS
For example, the leading
producers of nickel are
Russia (17% of 2010 mine
production), Indonesia
(15%), Philippines (10%),
Canada (10%), and
Australia (9%).
Mount Keith Ni mine, Western Australia: 323
million metric tons @ 0.56% Ni
Spinifex texture in serpentinite, Honeymoon Well nickel deposit,
Western Australia - indicator of bladed crystals of olivine, from
quenching of an ultramafic lava flow

Watch for competition in the regions of resource-rich Precambrian cratons,
which are major sources of iron, manganese, nickel, chromium, titanium,
copper, cobalt, zinc, gold, palladium, platinum, and uranium. This includes
parts of Africa, Australia, South America (particularly Brazil and Venezuela),
Russia, and Canada.
X X
X
X X X
X
X X
X X
X
X X X
X
X

World’s leading nickel
producer (Russia, 17%) Countries with 4% or more
of global production
Other countries with
production or major reserves
Ni
(China 5%)
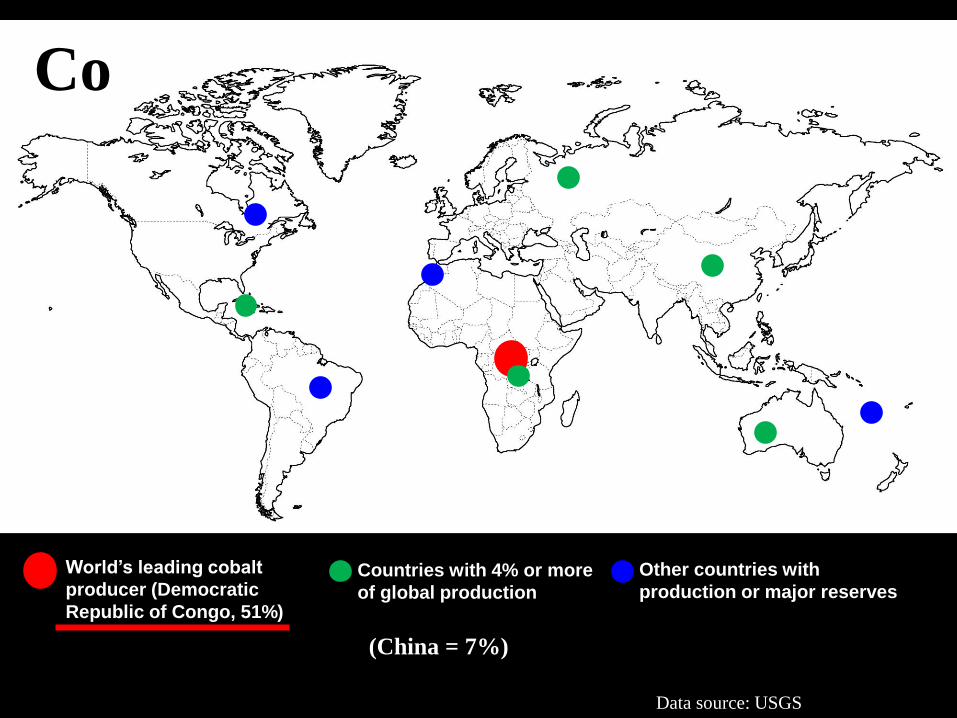
World’s leading cobalt
producer (Democratic
Republic of Congo, 51%)
Countries with 4% or more
of global production
Other countries with
production or major reserves
Co
(China = 7%)
Data source: USGS
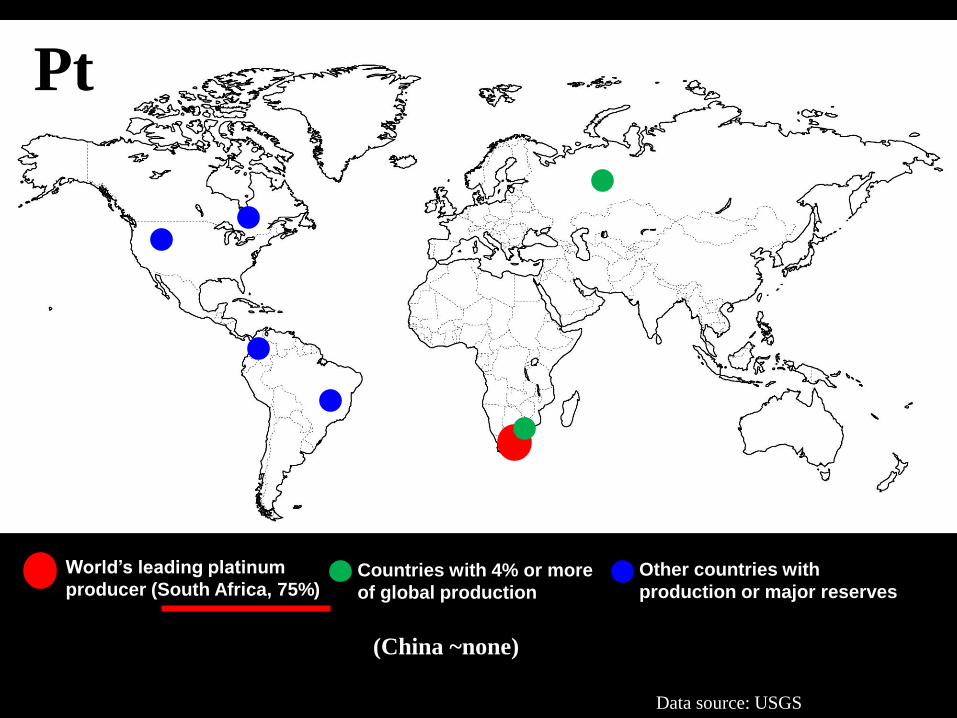
World’s leading platinum
producer (South Africa, 75%) Countries with 4% or more
of global production
Other countries with
production or major reserves
Pt
Data source: USGS
(China ~none)

Also watch for competition in the resource-rich current and past continental
and island-arc settings that are major sources of copper, molybdenum,
tungsten, gold, and silver. This includes the Pacific Rim of Fire, particularly
the Cordillera of South and North America, Mongolia, and several other
locations.
X X X
X X X
X
X X X
X X
X
X
X
X X
X
X X
X
X X X X
X X
X X
X
X X
X
X

Arrowhead clipart from www.firstpeople.us
Critical and strategic
minerals will change
with time.
Avatar

Critical and strategic
minerals will change
with time.
Arrowhead clipart from www.firstpeople.us
CuInxGa(1-x)Se2 or CIGS, for solar panels?
CdTe , GaAs, and Ge for solar panels?
Nd for magnets for wind and other electrical turbines?
Li and V for different types of batteries?

Lithium-brine evaporation pond, 2008,
Clayton Valley (Silver Peak), Nevada
Why explore in Nevada?
Among many other reasons, Nevada is the US leader
in gold, barite, and lithium; a significant historical
producer of copper, silver, and zinc; and a key source
of industrial minerals for construction (gypsum,
cement resources, aggregate).

5.3 million ounces* in 2010
73% of U.S. and 7% of world production
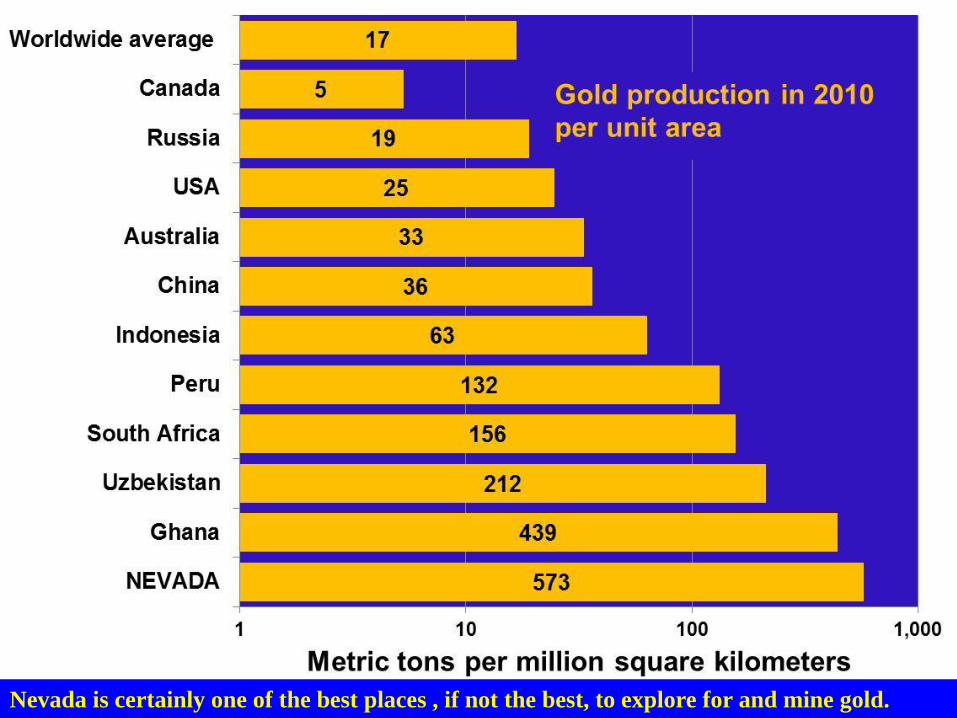
Nevada is certainly one of the best places , if not the best, to explore for and mine gold.

18 plants at 12 sites sold
~$145 million of electricity
in 2010, up from
~$110 million in 2009.

Net output lags behind capacity. Current
projects should add 2,100 to 2,400 Mw of
capacity within 10 years.

Nevada is a great place to explore and
mine: $7.7 billion production in 2010,
#1 nonfuel mineral producer in the U.S.
Round Mountain, NV (2007)
“Update on the Future of
Mineral Resources”
Demand is high.
China is #1.
The trends will help
guide exploration.

Thank you!
Round Mountain, NV (2007) Azurite & Malachite, Ely, NV (J. Scovil photo)