Update on Development of a Method to Assess PIBI Goal Attainment
16
Update on Development of a Method to Assess PIBI Goal Attainment Claire Buchanan (ICPRB) TMAW meeting October 5, 2006
description
Update on Development of a Method to Assess PIBI Goal Attainment. Claire Buchanan (ICPRB) TMAW meeting October 5, 2006. PIBI Goal. Living Resources Subcommittee (LRSC) approved a PIBI interim goal of 4.0 on a 1.0 - 5.0 scale at its January 26, 2006 meeting - PowerPoint PPT Presentation
Transcript of Update on Development of a Method to Assess PIBI Goal Attainment

Update on Development of a Method to Assess PIBI Goal
Attainment
Claire Buchanan (ICPRB)
TMAW meeting October 5, 2006

PIBI Goal
• Living Resources Subcommittee (LRSC) approved a PIBI interim goal of 4.0 on a 1.0 - 5.0 scale at its January 26, 2006 meeting
– high level of biological integrity is certain– very low risk of harmful algal blooms– assoc. WQ meets SAV habitat requirements– commensurate with Ches Bay water clarity and
DO criteria attainment
• LRSC did not establish how attainment of a PIBI goal of 4.0 should be measured

PIBI Goal
Currently exploring options for measuring attainment of PIBI Goal
Objectives:1. Attainment of the PIBI goal should
reflect attainment of a restored Bay and the WQ criteria
2. “Apples to apples” goals for Benthic, SAV and Phytoplankton

single multi- multi-metric metric metric
The 2005 “Bay Health Index” (BHI)presently compares “apples to oranges”

Some Background
• PIBI > 4.0 are not uncommon – 435 (9.4%) of 4647 records from CBP
biomonitoring stations, 1984 - 2005
• Highest PIBI values are transient at this stage of Chesapeake Bay restoration– PIBIs in a segment can fluctuate two or more
scale units in a year– slight declining trend is evident…
• Highest PIBI are commensurate with water clarity and DO criteria attainment

Measuring Attainment of PIBI Goal
• Goal Option 1“(all) PIBI scores at a Chesapeake Bay biomonitoring station must be between 4.0 and 5.0 for the station to pass.”– comparable to approaches used for SAV & original
BIBI goals– PIBI > 4.0 more difficult to attain than BIBI > 3.0– attainment reflects a very superior phytoplankton
community and a fully restored Bay– each station (aka segment) passes or fails
individually
2005
all segments fail

Measuring Attainment of PIBI Goal
• Goal Option 2“the bay-wide area-weighted mean score must be > 4.0 for the entire Bay to pass.”– average the 6 monthly mean scores in each segment,
weight by segment’s proportional area, and sum to obtain the bay-wide mean
– annual bay-wide score is biased by largest segments– goal can be attained even when smaller segments
regularly fail
2005
Bay mean = 2.94, or Fair

Measuring Attainment of PIBI Goal• Goal Option 3
“the area-weighted frequency of PIBI values between 4.0 and 5.0 must be greater than some predetermined percentage for the entire Bay to pass.”– uses frequency rather than mean– weight each segment’s attainment frequency (n = 6-12)
by segment’s proportional area, sum to obtain bay-wide attainment frequency
– Bay score is biased by largest segments method used in 2005 Health and Restoration Assessment
because a single Bay # was requested
2005
Bay freq. of attain. = 9.8%

Measuring Attainment of PIBI Goal• Goal Option 4
“the mean annual score of the station or stations within a CBP segment must be > 4.0 for the segment to pass."– uses mean rather than frequency– each segment passes or fails individually– removes area-weighting bias in annual score– more in line with how WQ criteria and SAV & BIBI
goal attainment are measured
2005
…CB5 mean = 3.75

Measuring Attainment of PIBI Goal• Goal Options 1 – 4
– propose either a threshold (1, 3) or a mean (2, 4) for evaluating PIBI values
• Chesapeake Bay Aquatic Life Uses– sample values are compared to reference distributions
(CFDs) or historic benchmarks to assess attainment
• Phyto. reference communities (1984-2005)– PIBI distributions for least-impaired WQ conditions
currently found in Chesapeake Bay, not PIBI distributions in fully restored Bay with long uninterrupted periods of good WQ & robust grazer populations
– mean PIBI ≈ 3.4

Measuring Attainment of PIBI Goal• Six segment-years in 1984-2005 phytoplankton
monitoring data have segment annual mean of PIBI > 4.0 (Option 4)
– N=39 – lowest PIBI was 3.0– No sig. diff. betw. MH and PH
Could be areference curve,or baseline

Measuring Attainment of PIBI Goal
• Goal Option 5
“a segment passes if at least two of three criteria are met: – annual average of monthly mean PIBI scores is > 4.0, – none (or only one) of monthly mean PIBI scores is
below 3.0, or – PIBI sample distribution is not significantly different
from the baseline PIBI distribution (Kolmogorov-Smirnov test, p > 0.10).”
2005
17.6% of goal attained
(CB5 is 17.6% of sampled segments)

____Option 3 (avg. = 14.3%) in 2005 Report
____Option 5 (avg. = 25.6%)
Percent Attainment of PIBI Goal
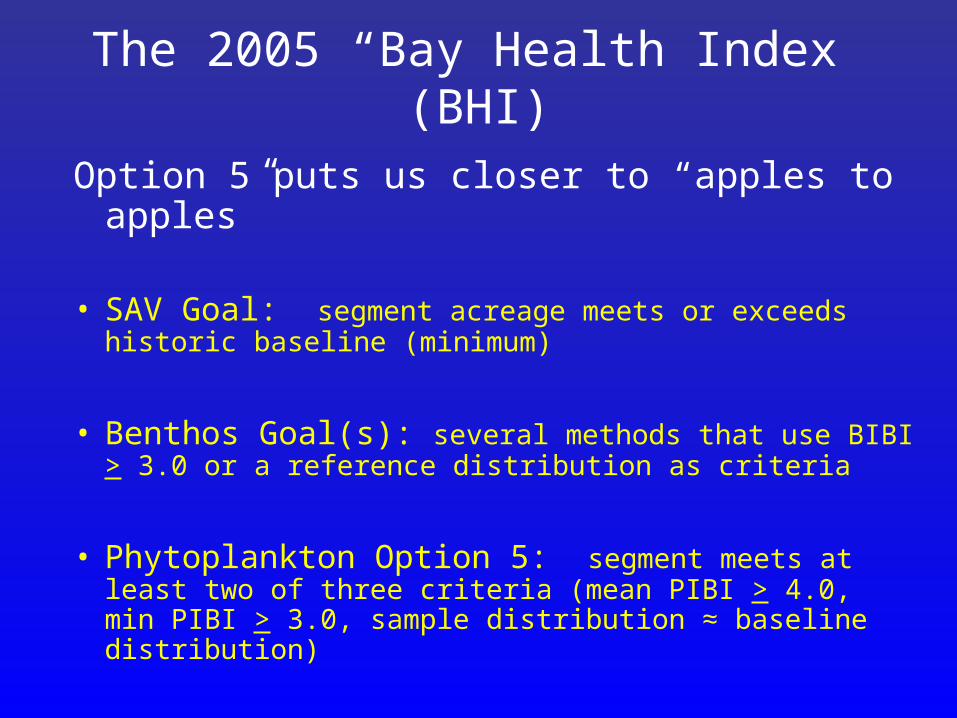
The 2005 “Bay Health Index” (BHI)
Option 5 puts us closer to “apples to apples”
• SAV Goal: segment acreage meets or exceeds historic baseline (minimum)
• Benthos Goal(s): several methods that use BIBI > 3.0 or a reference distribution as criteria
• Phytoplankton Option 5: segment meets at least two of three criteria (mean PIBI > 4.0, min PIBI > 3.0, sample distribution ≈ baseline distribution)

single multi- multi- metric metric metric
The 2005 “Bay Health Index” (BHI)
water clarity DO Chl a
Option 5
Option 3
DO?
“Degraded Area Method” (303d)?(Llanso & Volstad 2006)
?
waterclarity

only one or no mean ProportionSystem Segment KS p-value PIBI < 3.0 PIBI > 4.0 Of AreaBay mainstem CB2OH 0.0001 no 2.75 3.29%Bay mainstem CB3MH 0 no 2.13 4.32%Bay mainstem CB4MH 0 no 2.75 10.87%Bay mainstem CB5MH 0.1042 yes 3.75 17.63%Bay mainstem CB6PH 0.0002 no 3.09 8.89%Bay mainstem CB7PH 0.0017 no 3.16 18.18%Bay mainstem CB8PH 0.0062 no 3.26 4.93%Choptank CHOMH2 0 no 1.80 0.89%Choptank CHOOH 0 no 1.93 0.18%James JMSOH 0 no 2.02 1.53%James JMSPH 0 no 3.03 0.92%James JMSTF 0 no 1.60 1.14%York-MobjackBay MOBPH 0.0001 no 2.90 4.10%Patapsco PATMH 0 no 1.87 1.12%Patuxent PAXMH 0 no 1.91 1.29%Patuxent PAXOH 0 no 2.08 0.17%Patuxent PAXTF 0 no 2.14 0.05%York-Pamunkey PMKTF 0.0001 no 2.72 0.19%Potomac POTMH 0 no 2.53 10.62%Potomac POTOH 0 no 2.11 2.57%Potomac POTTF 0 no 2.27 1.80%Rappahannock RPPMH 0 no 2.78 3.87%Rappahannock RPPOH 0 no 2.13 0.23%Elizabeth SBEMH 0.0001 no 2.66 0.10%York YRKMH 0 no 1.83 1.13%
2005