Update of Emission Factors for EURO 4, EURO 5 and EURO 6 ... · This report must be published in...
31
INSTITUTE FOR INTERNAL COMBUSTION ENGINES AND THERMODYNAMICS Inffeldgasse 19, A-8010 Graz, Austria [email protected] Tel.: +43 (316) 873-30001 Fax: +43 (316) 873-30002 http://ivt.tugraz.at HEAD: Univ.-Prof. Dipl.-Ing. Dr. Helmut EICHLSEDER Inffeldgasse 19, A-8010 Graz, Austria Tel.: +43 (316) 873-30001 • Fax: +43 (316) 873-30002 http://ivt.tugraz.at ISO 9001 zertifiziert Update of Emission Factors for EURO 4, EURO 5 and EURO 6 Diesel Passenger Cars for the HBEFA Version 3.3 Final Report Report No. I-09/17/ CM EM 16/26/679 from 22.05.2017 This report must be published in its entirety without any additions or modifications. No extracts may be published or reprinted without the written consent of the author.
Transcript of Update of Emission Factors for EURO 4, EURO 5 and EURO 6 ... · This report must be published in...

INSTITUTE FOR INTERNAL COMBUSTION ENGINES AND THERMODYNAMICS
Inffeldgasse 19, A-8010 Graz, Austria [email protected]
Tel.: +43 (316) 873-30001 Fax: +43 (316) 873-30002 http://ivt.tugraz.at
HEAD: Univ. -Prof . Dip l. - Ing. Dr. Helmut EICHLSEDER
Inffeldgasse 19, A-8010 Graz, Austria
Tel.: +43 (316) 873-30001 • Fax: +43 (316) 873-30002
http://ivt.tugraz.at
ISO 9001 zertifiziert
Update of Emission Factors
for EURO 4, EURO 5 and EURO 6 Diesel Passenger
Cars for the HBEFA Version 3.3
Final Report
Report No. I-09/17/ CM EM 16/26/679 from 22.05.2017
This report must be published in its entirety without any additions or modifications.
No extracts may be published or reprinted without the written consent of the author.

page 2 of 31
Written by: ao. Univ. Prof. Dr. Stefan Hausberger
Dipl.-Ing. Claus Matzer
Update of Emission Factors for
EURO 4, EURO 5 and EURO 6 Diesel Passenger Cars
for the HBEFA Version 3.3
Final Report

page 3 of 31
Content
Abbreviations ...................................................................................................................... 4
1. Scope of work .......................................................................................................... 5
2. Methodology............................................................................................................. 6
3. Emission factors for diesel passenger cars........................................................... 9
3.1. Available emission data for EURO 6 diesel passenger cars ...................................................... 9
3.1.1. Test cycles .................................................................................................................................. 9
3.1.2. Overview on the sample of measured vehicles ......................................................................... 10
3.1.3. Details of measured vehicles .................................................................................................... 11
3.2. Elaboration of the PHEM engine emission maps for EURO 6 ................................................. 12
3.2.1. Calculation of the average base EURO 6 emission map .......................................................... 14
3.2.2. Calibration of the average EURO 6 emission map .................................................................... 14
3.2.3. Validation of the EURO 6 diesel car NOx simulation results ..................................................... 16
3.3. Assessment of the EURO 6d-Temp and EURO 6d diesel vehicles ......................................... 18
3.4. Readjustment of the PHEM engine emission maps for EURO 4 ............................................. 22
3.5. Calculation of HBEFA 3.3 emission factors .............................................................................. 23
3.6. Effects of ambient temperature on NOx emissions .................................................................. 25
4. Conclusions and Outlook .......................................................................................29
5. Acknowledgements ................................................................................................30
6. References ..............................................................................................................31

page 4 of 31
Abbreviations
ADAC .......... Allgemeiner Deutscher Automobil-Club
CADC .......... Common ARTEMIS Driving Cycle (Urban, Rural, MW = Motorway)
CF ............... Conformity factor
DB ............... Database
DPF ............. Diesel Particulate Filter
EGR ............ Exhaust Gas Recirculation
EMPA .......... Swiss Federal Laboratories for Materials Science and Technology
ERMES ....... European Research group on Mobile Emission Sources
EU ............... European Union
FC ............... Fuel consumption
HBEFA ........ Handbook Emission Factors for Road Transport
HDV ............ Heavy Duty Vehicles
LDV ............. Light Duty Vehicles
RDE ............ Real Drive Emissions
RS ............... Remote Sensing
RWC ........... Real world cycle
PEMS .......... Portable Emission Measurement System
PHEM .......... Passenger car and Heavy duty Emission Model
SCR ............ Selective Catalytic Reduction
TAP ............. International Transport und Air Pollution Conference
TNO ............ Netherlands Organisation for Applied Scientific Research
TUG ............ Graz University of Technology
UBA ............. Umweltbundesamt (Federal Environmental Protection Agency)
WLTC .......... Worldwide harmonized Light-duty vehicles Test Cycle

page 5 of 31
1. Scope of work
The last HBEFA update (Handbook Emission Factors for Road Transport) was published in
July 2014. This update included already the EURO 6 emission classes for diesel and petrol
cars based on measurements at 5 passenger cars, which were available at that time. It was
noted, that especially NOx emissions from the measured sample may not be representative
for EURO 6 diesel car fleet. To check and to update the EURO 6 emission factors with all
vehicle emission tests at EURO 6 diesel cars collected around Europe since HBEFA 3.2, the
HEBFA 3.3 has been produced. In course of the work a first assessment of temperature de-
pendency of the hot NOx emission factors was made. A similar dependency was also found
for EURO 4 and EURO 5 diesel cars which lead to an update of emission data for these cate-
gories in the HBEFA 3.3 as well.
HBEFA 3.3 is a so-called “quick update”, because only the NOx emission factors for diesel
passenger cars have been revised. An update for all exhaust gas components is planned for
HBEFA 4.1. Following adaptations from HEBFA 3.2 to 3.3 have been performed
New emission factors of EURO 6, EURO 6d-Temp and EURO 6d replace the previous
emission factors of EURO 6 and EURO 6c in HBEFA 3.2.
New NOx emissions factors of EURO 4 diesel cars replace the old ones in HBEFA 3.2.
A correction function for the influence of ambient temperature on NOx emissions for
EURO 4, EURO 5 and EURO 6 diesel cars has been introduced.
The update is based on RDE (Real Drive Emissions) and dynamometer measurements. For
the effect of ambient temperature on NOx emissions, also remote sensing measurement data
have been used.
page 6 of 31
2. Methodology
The emission factors are based on the simulation of a huge number of driving situations and
vehicle categories. The simulations have been done using the simulation tool PHEM (Passen-
ger car and Heavy duty vehicle Emission Model). The simulation tool was already described
in the HBEFA 3.2 final report (Rexeis M. et. al. 2013). The basic methods are unchanged but
the software PHEM was updated in the meantime (improved interpolation routines, gear shift
logics and other details). In addition, PHEM was extended to handle On-Board emission test
data as input for engine emission maps (chapter 3.2).
A short description about PHEM is given in the following. PHEM is an emission map based
instantaneous emission model, which has been developed by TUG (Graz University of Tech-
nology) since the late 1990's. It calculates fuel consumption and emissions of road vehicles in
1 Hz time resolution for a given driving cycle based on the vehicle longitudinal dynamics and
emission maps. The model has already been presented in several publications, e.g. (Haus-
berger S. et al. 2009), (Zallinger M., 2010), (Rexeis M. et. al. 2009). PHEM simulates the en-
gine power necessary to overcome the driving resistances, losses in the drive train and to run
basic auxiliaries in 1 Hz over any driving cycle. The engine speed is simulated by the trans-
mission ratios and a driver gear shift model. Then basic emissions are interpolated from the
engine emission maps. Depending on the vehicle technology, the status of the exhaust gas
after treatment systems and dynamic effects are considered in addition. With this approach,
realistic and consistent emission factors can be simulated for any driving condition since the
main physical relations are taken into consideration. E.g. variations in road gradients and in
vehicle loading influence the engine power demand and the gear shift behaviour and thus lead
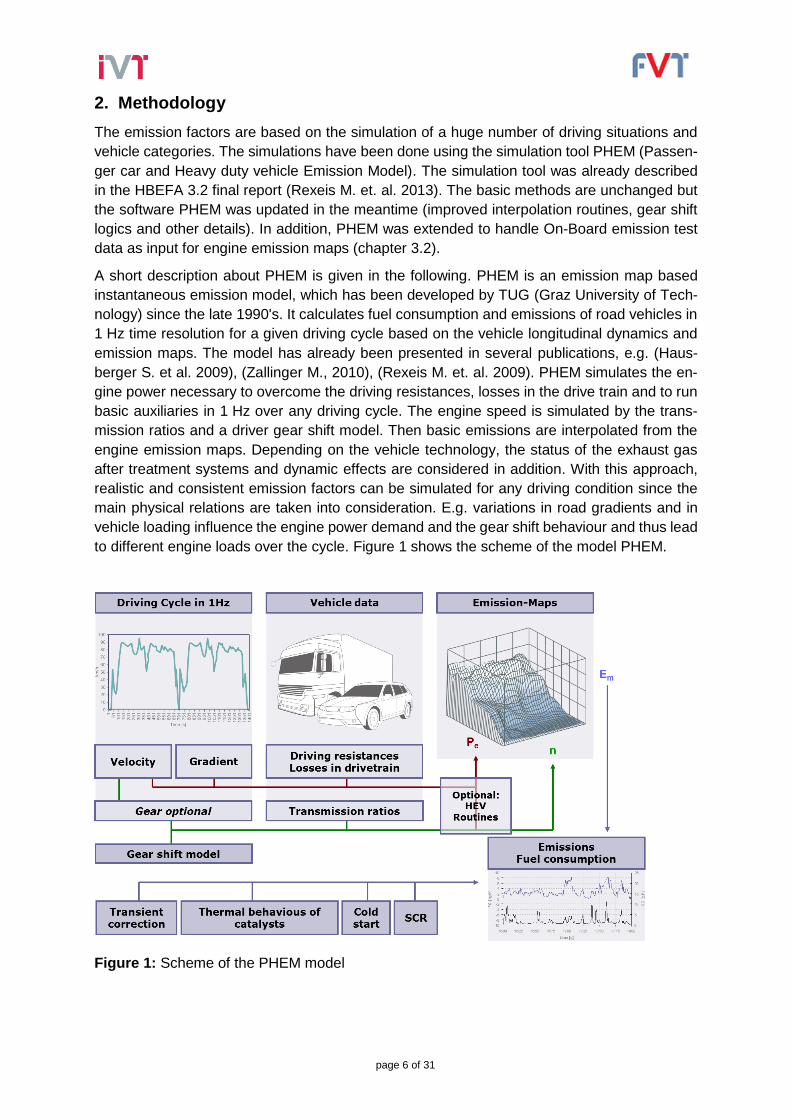
to different engine loads over the cycle. Figure 1 shows the scheme of the model PHEM.
Figure 1: Scheme of the PHEM model

page 7 of 31
To simulate representative fleet average emissions per vehicle class, representative engine
maps are necessary. PHEM produces emission maps by sorting the instantaneously meas-
ured emissions into standardised maps according to the actual engine speed and power.
To produce representative engine maps from vehicle tests, many vehicles should be included
and realistic driving situations should be considered. Consequently, the inclusion of PEMS
(Portable Emission Measurement System) data by the newly developed methodology in addi-
tion to the dynamometer data was very beneficial for a broader vehicle sample for the PHEM
simulation.
The new method resolves the typical issue from PEMS tests, where most often no reliable
torque signal is available. PHEM offers now the new option to calculate the engine power from
the measured CO2 mass flow (or fuel flow) and engine speed based on generic engine effi-
ciency maps (Figure 2). Thus, only the measured engine speed and the emissions are neces-
sary to compile engine emission maps. This method, also called “CO2 interpolation method”,
was already presented at the International Transport und Air Pollution Conference in Lyon
2016 (Matzer C. et al. 2016).
Figure 2: Example for interpolation of engine power from a generic CO2 map
The accuracy of the method can be tested by comparing measurement results for cycles driven
on the dynamometer with simulation results based on the generic fuel maps for these cycles.
When the test mass and road load values from the dynamometer setting are used as input for
the PHEM simulation, the difference to the measured fuel consumption results from:
Deviations of the vehicle specific fuel map to the generic map.
Differences in the generic model for losses in the gear box and the axle.
Differences in the real auxiliary power demand to the generic data used in PHEM.
The share of these generic values in the total uncertainty is open yet.
By calibrating the PHEM model data to meet the measured fuel consumption values, a more
representative generic data set can be established in future.

page 8 of 31
For the quick update HBEFA 3.3 only a few results from dynamometer tests were analysed as
outlined above. These showed an uncertainty of the generic diesel EURO 6 data between
approximately 5 % and 20 %. A detailed analysis is planned for HBEFA 4.1.

page 9 of 31
3. Emission factors for diesel passenger cars
The following subchapters give a documentation about the work for the HBEFA 3.3 quick up-
date.
3.1. Available emission data for EURO 6 diesel passenger cars
3.1.1. Test cycles
In principle, every cycle from dynamometer or RDE-trips with instantaneously measured emis-
sions and engine speed can be used for engine emission map creation by the CO2 interpola-
tion method in PHEM. For representative engine maps, the coverage of all relevant engine
load and engine speed situations is necessary. Therefore, measurement data with included
high-load operating points are suitable. Cycles with such operating points for example are the
CADC or the ERMES cycle.
To avoid mixing effects of emissions behaviour due to cold and hot starts, only measurement
data with hot starts have been used to create the hot emission maps. Hot start means, that the
engine is already in the operating temperature range at cycle start. The additional emissions
due to cold start are considered by a separate calculation step in the HBEFA. For the quick
update measurement data of following cycles from the dynamometer have been used:
CADC:
CADC stands for Common Artemis Driving Cycle and consists of the 3 phases urban,
road and motorway. By averaging the emissions from the subcycles a representative
emission level for real world driving can be calculated (described as CADC 1/3 Mix in
this report). The motorway part is available with 130 km/h and 150 km/h maximum
velocity.
ERMES:
This cycle from the European Research group on Mobile Emission Sources is similar
to the CADC but shorter.
WLTC:
The WLTC stands for Worldwide harmonized Light-duty vehicles Test Cycle and is from
1st of September 2017 on the new test cycle for homologation.
RWC:
RWC means Real World Cycle and is an extract of a real world trip with road gradients
and activated auxiliaries for the dynamometer. The RWC is a vehicle specific cycle.
Additional to the dynamometer measurements also RDE-trips have been used for the HBEFA
3.3 update. RDE-trips cover high-load operating points even better than measurements on the
dynamometer. The real drive emissions are measured with a PEMS. In past it was difficult to
work with data from RDE measurements, because on the one hand such data were rare and
on the other hand a power signal was not available or was too inaccurate for the engine map
creation. With the new CO2 interpolation method, also data from RDE-trips without power sig-
nal can be successful considered for the map creation.
The measurements on the dynamometer are performed with constant ambient temperature
between 20 °C and 30 °C. The ambient temperature of RDE-trips can fluctuate more than the
mentioned range and influence the emission behaviour. Due to this problem and to be con-
sistent with the dynamometer data of EURO 0 to EURO 5 only measured data between 15 °C

page 10 of 31
and 30 °C ambient temperature have been used for map creation1. The limit of 15 °C for in-
cluding measurements into the data for the base engine emission maps was selected, since
several PEMS tests were in a range of 15 °C to 20 °C. The temperature effect in this range
was assumed to be small so the advantage of the larger vehicle sample seemed to be more
important than to have the data separation exactly at 20 °C as it is standard on dynamometer
tests. More detailed analysis and further measurements on temperature effects are suggested
for HBEFA 4.1. The influence of the mentioned ambient temperature on NOx emissions are
considered by a post-processing work based on the simulated data.
3.1.2. Overview on the sample of measured vehicles
As mentioned, only instantaneously measured data from real world cycles and RDE-trips as
described in 3.1.1 are used as representative data source for the emission model PHEM. The
following table gives an overview on the number of the available measurements on EURO 6
diesel cars, which fulfil these demands. In total, the measurement data of 25 vehicles have
been used provided by the emission labs all-over Europe. ADAC (Germany) provided data of
2, EMPA (Switzerland) of 12, TNO (Netherlands) of 2 and TUG (Austria) of 9 vehicles. Table
1 shows also the number of vehicles measured on the different cycles. For example, EMPA
measured the CADC with 12 vehicles, the ERMES cycle with 5 vehicles.
Table 1: Available EURO 6 diesel cars
Lab
# vehicles tested in # total mea-
sured ve-
hicles CADC hot ERMES
hot WLTC hot RWC hot RDE hot
ADAC 1 2 - - - 2
EMPA 12 5 - - - 12
TNO - - - - 2 2
TUG 6 6 3 2 2 9
Total 19 13 3 2 4 25
Table 2: Available cycles measured with EURO 6 diesel cars
Lab/ cycle # CADC
hot
# ERMES
hot
# WLTC
hot # RWC hot # RDE hot Total
ADAC 1 2 - - - 3
EMPA 12 5 - - - 17
TNO - - - - 3 3
TUG 12 10 4 3 9 38
Total 25 17 4 3 12 61
1 The data available for EURO 0 to EURO 5 emission factors so far are results from dynamometer tests
between 20 °C and 30 °C. The analysis for temperature effects on the hot emission factors (chapter 3.6)
suggests testing in future also at lower temperature levels to cover European temperature levels.

page 11 of 31
3.1.3. Details of measured vehicles
Following table gives an overview on the main specifications of the vehicles used and the
source where the measured data are from. The registration number refers to the number of
new registrations of the particular vehicle from 2013 to 2015 according to the EU-28 CO2
monitoring database. This is the timeframe where mainly the EURO 6 cars have been intro-
duced. Registrations in 2016 were not considered since no data during the work on the update
of the PHEM model was available. For double tests of the same vehicle models the corre-
sponding registration number was split up (unweighted). The registration number is the basis
for the weighting of the engine maps for the average engine emission maps for PHEM. The
sample of measured vehicle covers 18 % of the passenger car diesel models registered 2013
to 2015.
Table 3: Specifications of EURO 6 diesel cars used in the engine emission map for PHEM and
new registrations of the vehicles in EU-28
Lab Make Model Prated
[kW]
nrated
[U/min]
New regist-
rations [#]
TUG BMW X5 180 4000 79756
TUG BMW 530d 180 4000 11851
TUG Audi A4 Allroad 180 4000 306698
TUG Mazda CX-5 110 4500 49514
TUG BMW 320d 120 4000 103691
TUG Kia Carens 104 4000 40461
TUG Audi Q7 160 4000 37221
TUG VW Sharan 110 3500 88353
TUG Peugeot 508 SW 88 3500 122878
EMPA VW Golf VII 81 3200 855277
EMPA Mazda CX-5 110 4500 49514
EMPA BMW 530d 190 4000 11851
EMPA Mercedes-Benz GLK 220 125 3200 48060
EMPA VW Passat 103 4200 459372
EMPA Renault Senic 96 4000 278320
EMPA Mini Cooper 85 4000 18994
EMPA Mercedes-Benz A220 125 3400 17357
EMPA BMW X3 140 4000 95544
EMPA Mercedes-Benz ML 350 190 3600 34730
EMPA Porsche Macan 190 4000 25615
EMPA Peugeot 208 SW 110 3750 340831
ADAC BMW 118d 110 4000 103691

page 12 of 31
Lab Make Model Prated
[kW]
nrated
[U/min]
New regist-
rations [#]
ADAC BMW 320d 140 4000 103691
TNO Ford Focus 70 3600 326974
TNO Mercedes-Benz C220 125 3000 57407
3.2. Elaboration of the PHEM engine emission maps for EURO 6
To produce the engine emission maps with PHEM the measured emissions – typically in 1 Hz
resolution – are processed to be correctly time aligned to the engine speed signal in a first
step. Then the emissions are sorted by PHEM into the engine map according to the actual
engine speed and power values. Then average values per node in the map are calculated.
Finally from the single normalised engine maps per vehicle the average normalised engine
map is calculated as weighted average. The single steps are described blow.
Step 1: Preparation of the available modal measurement data
As described in chapter 3.1.2 in total 61 measurement data sets from 25 vehicles are available
for the engine map creation. These data sets from dynamometer and RDE-tests had to be
processed to be applicable for PHEM. The pre-processing of the data ensures that:
The correct time shift between emissions and load signal is given. To date only a con-
stant time shift has been used for most data sets (exception: RDE-trips from TUG are
variable time shifted). Variable time shift means, that the instantaneous emission sig-
nals are time shifted for the transport time based on the exhaust gas mass flow rates.
That improves the emission signal especially for dynamometer measurements (Weller
K. et. al. 2016).
Cold start is excluded from the measurement data. According to the RDE legislation
for RDE-trips with cold start the first 5 minutes from the recorded data have been re-
moved.
Only cycles and trips have been processed for the base emission maps, where the
average ambient temperature was between 15 °C and 30 °C. Test data at lower tem-
peratures was used to analyse the influences of ambient temperature.
Due to no information on possible DPF regenerations especially on RDE-trips, the measure-
ment data is not corrected regarding the different emissions during regeneration. As a conse-
quence no correction factor for considering the DPF regeneration in simulation data has been
used since the regenerations are already included in the measurement data.
Step 2: Engine map creation with measurement data of each vehicle
The described CO2 interpolation method for map creation requires the measured emission
and engine speed in an appropriate temporal resolution, the FC or CO2 engine map (FC cor-
relates with CO2) and full load plus drag curve of each vehicle. In most of the cases, no engine
specific engine fuel flow map is available. Therefore a so-called generic CO2 map is used.

page 13 of 31
Figure 3: Generic CO2 map for 2013 engine technology
Figure 3 shows one example for a generic CO2 map. This map is derived from a steady state
engine map for a 2002 engine considering the CO2 savings of different engine technologies
introduced from 2002 up to now. The CO2 savings depending on engine technologies have
been acquired in a project together with Ricardo-AEA for the European Commission (Hill N.
et. al. 2015). With the introduction of different technology levels based on the generic base fuel
map different technology levels are covered in a systematic way. For the HBEFA update 2
generic maps for model years 2012-2014 and 2015-2016 have been generated.
As mentioned before, also individual full load and drag curves are necessary as input for
PHEM. For cases where the literature review was not successful, default data has been used.
PHEM calculates with the given engine speed and CO2 the engine power in each time step,
P = f (n, CO2) and creates the emission map by sorting the instantaneous emissions like NOx,
CO, etc. in the generic engine map. In order to get consistent maps the CO2 interpolation
method was also used for map creation with measurement data of dynamometer tests where
a wheel power signal is in most of the cases available2.
An average emission map from all tests is obtained by averaging the single maps in normalised
formats. The normalisation procedure in PHEM is basis for averaging single engine maps of
engines with different rated power and speed ranges and reads as follows:
Pe_norm = Pengine / Prated
nnorm = (nengine – nidle) / (nrated – nidle)
FCnorm = FC / Prated (similar for CO2)
2 In the past the engine power was calculated from the dynamometer tests based on the road load and
test mass settings of the vehicle on the dynamometer with assumptions on transmission losses and
auxiliary power demand. Due to inaccurate time alignment between power signals and emission signals,
the resulting fuel maps had various qualities depending on the data sources. This issue should be elim-
inated by calculating the power signal from the CO2 value. The time alignment to the engine speed
signal is still relevant for the CO2 based method.

page 14 of 31
Pe_norm… ... normalised engine power in [-]
Pengine… .... actual effective engine power in [kW]
Prated… ...... rated engine power in [kW]
nnorm… ...... normalised engine speed in [-]
nengine… ..... actual engine speed in [rpm]
nidle… ........ idling speed in [rpm]
nrated… ...... speed at rated power in [rpm]
FCnorm… ... normalised fuel consumption in [g/kWh]
FC… ......... fuel consumption in [g/h]
3.2.1. Calculation of the average base EURO 6 emission map
The base NOx emission map for the EURO 6 diesel cars was produced by building the
weighted average from all single engine maps from the vehicles listed in Table 3. As weighting
factor the shares of the single models in the total registration number of all vehicles in Table 3
was used. The average map consists of the weighted average of each node point in the nor-
malised map format.
3.2.2. Calibration of the average EURO 6 emission map
The calibration shall align the simulated emission levels with the measured levels. For the
creation of the final EURO 6 engine map several calibration steps were performed. The cali-
bration has the target to calibrate the PHEM model which is based on a limited sample of
vehicle tests to the broader sample of bag results stored in the ERMES DB (ERMES database).
In the past the instantaneous data available for PHEM engine emission maps was a subset of
the ERMES DB, thus the calibration routine was one single step, (Rexeis M. et. al. 2013).
In the actual calibration for HBEFA 3.3 many tests in the vehicle sample with instantaneous
data for PHEM had no suitable bag data from chassis tests in the ERMES DB (e.g. the vehicles
with PEMS tests only). Vice versa also bag data without suitable instantaneous data from
chassis tests are available in the ERMES DB (e.g. cycles without measurement of engine
speed).
Consequently a more sophisticated method for the calibration was elaborated which is de-
scribed below.
As basis for the calibration the CADC test results available in the ERMES DB have been re-
calculated with PHEM. Since in the basis EURO 6 map several vehicles are included for which
no CADC test result is available, a direct calibration of the base map to the ERMES DB CADC
results seemed not to be appropriate. Such a calibration would have eliminated the broader
data from PEMS tests in the base engine map.
Consequently an extra EURO 6 engine map was produced, which consisted only of those
vehicles, for which both, instantaneous emission data and CADC test results in the ERMES
DB were available. In the PHEM simulation with this sub-sample engine map also the vehicle
data from these vehicles were used as input (weighted according to the shares listed in Table
4). The known values from the tested vehicles were the rated power, idling speed, rated engine
speed and the test mass. All other values used the generic values of EURO 6 diesel cars as
already elaborated for HBEFA 3.2 (air and rolling resistance coefficients, transmission losses

page 15 of 31
and auxiliary power demand). Thus the calibration adjusts these generic data to meet the
measured emissions of the sub-sample.
Table 4 shows the sub-sample of vehicles used for the calibration. A weighted average map
has been calculated with the 17 engine maps. The weighting factors are based on the number
of vehicle registrations listed in Table 4.
Table 4: Vehicles for model validation and calibration with the ERMES DB (vehicles where
instantaneous emission data and CADC test results are available)
Lab Make Model Prated [kW] nrated
[U/min]
Weighting
Factor
TUG BMW 530d 180 4000 0.5%
TUG Audi A4 Allroad 180 4000 12.4%
TUG Mazda CX-5 110 4500 0.8%
TUG VW Sharan 110 3500 3.6%
EMPA VW Golf VII 81 3200 34.6%
EMPA Mazda CX-5 110 4500 0.8%
EMPA BMW 530d 190 4000 0.5%
EMPA Mercedes-Benz GLK 220 125 3200 1.9%
EMPA VW Passat 103 4200 9.3%
EMPA Renault Senic 96 4000 11.3%
EMPA Mini Cooper 85 4000 0.8%
EMPA Mercedes-Benz A220 125 3400 0.7%
EMPA BMW X3 140 4000 3.9%
EMPA Mercedes-Benz ML 350 190 3600 1.4%
EMPA Porsche Macan 190 4000 1.0%
EMPA Peugeot 208 SW 110 3750 13.8%
ADAC BMW 320d 140 4000 2.8%
For the validation run the CADC has been chosen as reference cycle since this cycle repre-
sents roughly real world driving and since the CADC had the highest number of available tests.
The simulation run showed that the simulated NOx were approximately 10 % higher than the
bag data from the ERMES DB. Hence, the NOx in the average map were corrected by division
with a factor of 1.1. Figure 4 shows the results of the second simulation run for the CADC
urban, road, motorway and the 1/3 Mix. The grey bars (simulated) fit to the orange bars (meas-
ured, values also weighted). The blue bars are the unweighted measured values. The motor-
way part is weighted with the appropriate shares of measured cycles with 130 km/h and 150
km/h maximum velocity.

page 16 of 31
Figure 4: Simulation results for EURO 6 diesel cars sub-sample after model calibration
In a second step, the weighted base average emission map described in chapter 3.2.1 from
all vehicles was adjusted with the calibration factor described before (i.e. division by 1.1). The
NOx map in [g/kWh] created in this step is shown in Figure 5.
Figure 5: Calibrated EURO 6 NOx map for diesel cars
3.2.3. Validation of the EURO 6 diesel car NOx simulation results
Figure 6 shows the validation of the EURO 6 diesel car for the CADC. The blue bars are the
weighted measured CADC values from all vehicles in the ERMES DB. The yellow bars de-
scribe the simulation result with the calibrated engine map from the full sample and the
weighted vehicle data from the full sample as listed in Table 3. The higher NOx values com-
pared to the simulation results with the sub-sample (Figure 4) result from the additional data
in the map (broader sample of vehicles) and from different vehicle properties.

page 17 of 31
The final EURO 6 diesel car for the HBEFA shall be representative for the average European
EURO 6 diesel car. Consequently the vehicle data for PHEM simulation was adjusted to power
and mass from the vehicles registered from 2013 to 2015 according to the EU-28 CO2 moni-
toring database. The green bars present the corresponding simulation results. The EU average
EURO 6 car shows even higher NOx due to a lower rated engine power of the EU average
vehicle compared to the average vehicle in the engine emission map. This leads to more time
shares in engine map areas with higher specific NOx emissions.
As mentioned before, the ERMES DB data on CADC results and the tests used for engine
emission map creation are samples from the total fleet where it is unknown, which sample is
more representative for the total fleet. Since the engine map sample includes additional PEMS
tests, it was decided to trust more in the engine map data and not to calibrate the PHEM
simulation results to the ERMES DB CADC values3.
The last settings (green bars) are thus the settings used for the simulation of the HBEFA driving
cycles.
Figure 6: Simulation results for EURO 6 diesel in the CADC using different vehicle settings
Table 5 shows the main specifications for the average EURO 6 diesel car used for the HBEFA
update.
Table 5: Specifications for average EURO 6 diesel car
Total vehicle mass [kg] Prated [kW] nrated [U/min]
1651 99 3672
3 The step from yellow to green bars due to the lower rated engine power on EU average results from
more time shares near to full load where the specific NOx emissions [g/kWh] usually are increasing.
This effect seems to be reasonable for the fleet average and thus was considered in the average EURO
6 diesel car in PHEM by simply using the EU average rated power for EURO 6 diesel cars.
page 18 of 31
3.3. Assessment of the EURO 6d-Temp and EURO 6d diesel vehicles
The implementation of EURO 6d-Temp and EURO 6d is planned in future, hence no vehicles
with such certification are available. Due to these conditions an estimation based on the RDE
legislation was made. The RDE legislation introduces CFs (conformity factors) for the new
EURO classes to describe the emission limits for RDE-trips based on the emission limits for
the dynamometer test cycle. E.g. the CF for NOx EURO 6d-Temp is 2.1, for NOx EURO 6d
1.5. Thus, the NOx limit for RDE-trips is 168 mg/km for EURO 6d-Temp and 120 mg/km for
EURO 6d. The EURO 6d map has been created by selecting engine maps of those vehicles
listed in Table 3, which already fulfil the EURO 6d legislation according to the measured NOx
emissions. The criterion was to reach the RDE limit with the simulated NOx on CADC consid-
ering a correction factor for different dynamic driving style between RDE-trip and CADC.
The trip dynamics are defined in the RDE legislation with the parameters vehicle velocity and
positive vehicle acceleration (> 0.1 m/s²), also known as v*apos0.1. According to the RDE legis-
lation, the v*apos0.1 calculation is done for each second of a trip and the 95 % percentile of
v*apos0.1 is calculated4. The 95 % percentile (v*apos0.1) is one relevant kinematic RDE-trip pa-
rameter and is used as criterion whether a RDE-trip is valid or invalid. Figure 7 shows the
average 95 % percentile (v*apos0.1) of 11 vehicles in 32 RDE-trips for urban, road and motorway
parts of the trips. In addition the maximal allowed 95 % percentile (v*apos0.1) for valid trips and
the 95 % percentile (v*apos0.1) of the CADCs with maximum speed of 130 km/h and 150 km/h
are plotted. From the figure it can be derived that the dynamics of the CADC are on average
approximately 50 % lower than the maximum 95 % percentile of the v*apos0.1 value. The NOx
emissions of actual vehicles on average increase by 30 % to 60 % between trips with average
95 % percentile (v*apos0.1) compared to trips with maximum allowed 95 % percentile (v*apos0.1).
For future EURO 6d compliant vehicles less sensitivity against dynamic load changes is as-
sumed or a better adjustment to the actual NOx level (e.g. control function to remain in any
driving situation with a safety margin below the CF limit). It was assumed that the CADC should
give 20 % lower NOx emissions than a worst case RDE test. Since measurement data for
these selected vehicles are not available for the CADC, the CADC NOx emissions are based
on simulations.
Therefore, a vehicle should have NOx values below 100 mg/km to be capable of meeting the
120 mg/km maximum allowed 95 % percentile (v*apos0.1) to fulfil EURO 6d provisions. Conse-
quently, only these vehicles were selected to compute the EURO 6d engine maps for PHEM.
4 The 95 % percentile is the value where 95 % of the total v*apos0.1 values are below.

page 19 of 31
Figure 7: Trip dynamics of RDE-trips and CADCs
Table 6 shows the selected vehicle from Table 3.
Table 6: Vehicles for EURO 6d map creation
Lab Marke Modell P_rated
[kW]
n_idle
[U/min]
n_rated
[U/min]
TUG VW Sharan 110 830 3500
EMPA BMW 530d 190 700 4000
EMPA Mercedes-Benz GLK220 125 750 3200
EMPA Mini Cooper 85 900 4000
ADAC BMW 118d 110 750 4000
TNO Mercedes-Benz C220 125 750 3000
Due to missing information about future registrations the average EURO 6d map has been
created without weighting. Since the driving styles and ambient conditions for RDE compliant
testing are not covering 100 % of the real world conditions, real world average emissions may
be slightly higher in future than average emissions from RDE testing. To consider this effect a
factor of 1.2 for NOx has been applied for the EURO 6d map for PHEM. This factor is an
assumption based on actual experiences at TUG with RDE testing. Certainly the emission
values produced for EURO 6d are a technology assessment and need to be validated with
measurements of future EURO 6d compliant cars. Figure 8 shows the EURO 6d NOx map.

page 20 of 31
Figure 8: EURO 6d NOx map for diesel cars
The vehicle characteristics for EURO 6d simulation is similar to the EURO 6 one, only the
rolling resistances have been reduced by 15 %. Furthermore, the aerodynamic resistance has
been reduced by 10 %. These assumptions are based on the project with Ricardo-AEA (Hill
N. et. al. 2015).
The map for EURO 6d-Temp (Figure 9) has been derived from the EURO 6 and EURO 6d
map. As reference cycle also the CADC was used. Considering correction methods like men-
tioned before the EURO 6 map was weighted with 19 % and the EURO 6d map with 81 %.
The same weighting factors have been used for the vehicle characteristics.
Figure 9: EURO 6d-Temp NOx map for diesel cars
Figure 10 and Figure 11 show the simulation results for EURO 6, EURO 6d-Temp and EURO
6d average diesel car in the CADC with 130 km/h and 150 km/h maximum velocity. In addition
the NOx emissions of EURO 5 average diesel car in the CADC are shown for comparison
page 21 of 31
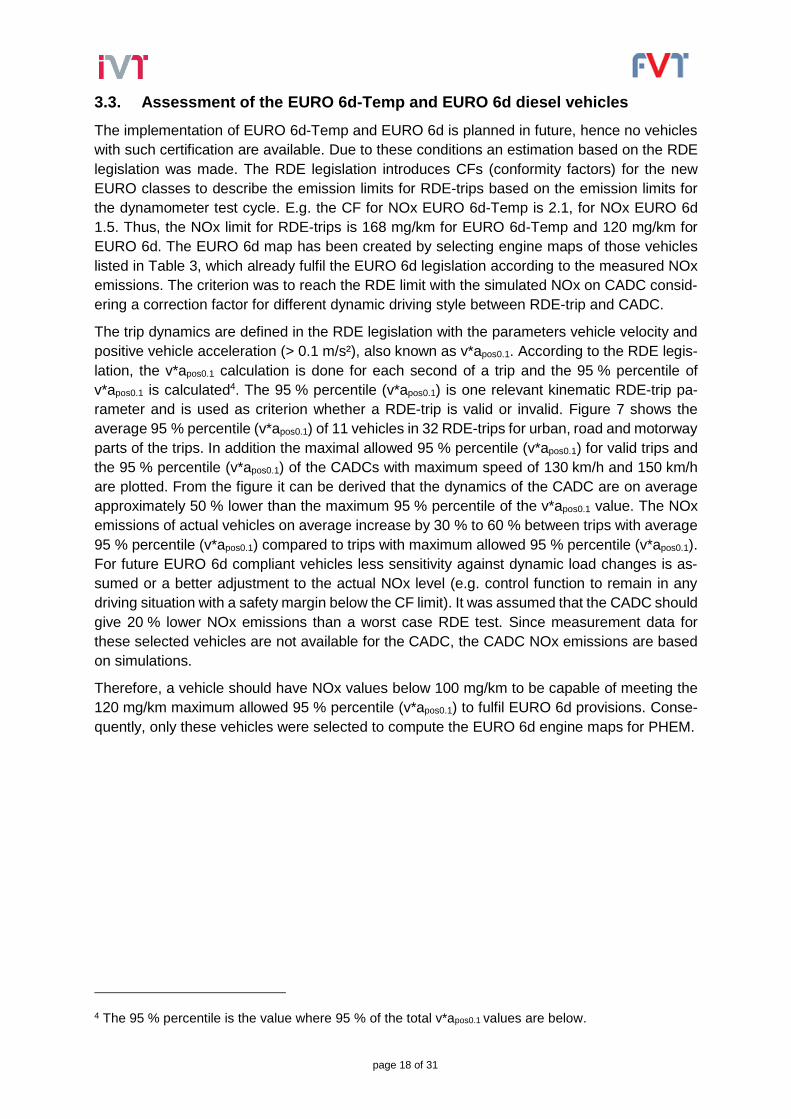
between the different EURO classes. The values of the EURO 5 car are unchanged between
HBEFA 3.2 and 3.3.
Figure 10: Simulation results for EURO 5, EURO 6, EURO 6d-Temp and EURO 6d diesel cars
in the CADC with 130 km/h maximum velocity
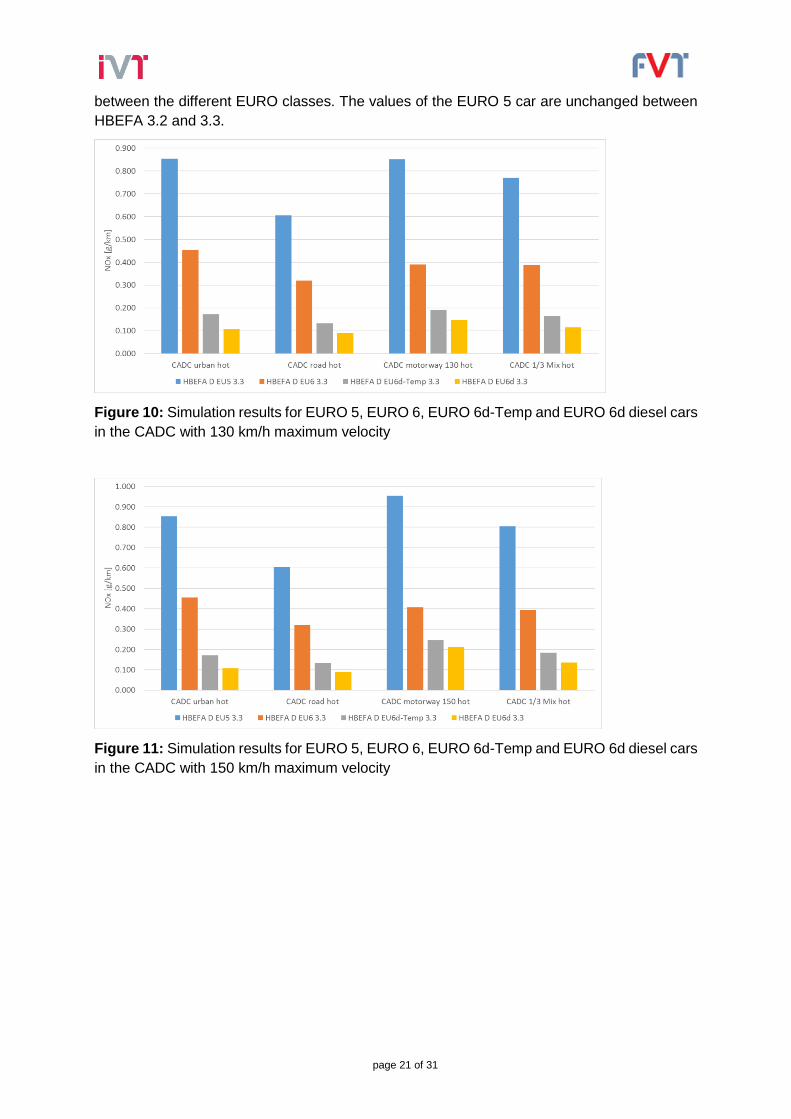
Figure 11: Simulation results for EURO 5, EURO 6, EURO 6d-Temp and EURO 6d diesel cars
in the CADC with 150 km/h maximum velocity

page 22 of 31
3.4. Readjustment of the PHEM engine emission maps for EURO 4
Due to the availability of new measurement data of EURO 4 diesel vehicles in the ERMES DB
a readjustment of the EURO 4 emission map has been performed.
The first step was the simulation of the CADC with the EURO 4 emission map and EURO 4
vehicle from HBEFA 3.2. The simulation run with the “old” engine map is shown in Figure 12
and Figure 13 (grey bar). In the motorway phase the simulation underestimates the average
measured value from the ERMES DB.
Due to the underestimation especially in the motorway part, the readjustment of the emission
map has been done only for data points in the high load and speed area of the engine map.
The NOx correction in the data points of the map starts at engine speed = 0.42 and engine
power = 0.44 (both values normalised). Iteration processes determined the level and correction
area of the factor. The blue bar in Figure 12 and Figure 13 shows the simulation result with the
adapted NOx emission map. The CADC 1/3 Mix comparison between simulation and meas-
urement shows a smaller deviation after the re-calibration.
The average NOx emissions according to the ERMES DB however, are still underestimated
for the highway part of the CADC by the model PHEM. A calibration for a better agreement for
the highway 130 km/h parts lead to a worse agreement in the urban, road and highway 150
km/h parts and was thus not used for HBEFA 3.3.
Figure 12: Simulation results for EURO 4 diesel cars after readjustment (CADC 130 km/h)

page 23 of 31
Figure 13: Simulation results for EURO 4 diesel cars after readjustment (CADC 150 km/h)
3.5. Calculation of HBEFA 3.3 emission factors
With the PHEM parameterisation for emission behaviour of EURO 4, EURO 6, EURO 6d-Temp
and EURO 6d diesel vehicles as described in the previous chapters, emission factors for the
full set of HBEFA driving cycles in combination with all road gradients (-6 %, -4 %, -2 %, +/-
0 %, +2 %, +4 %, +6 %) have been calculated.
Figure 14 and Figure 15 show the new NOx emissions results as function of the vehicle velocity
for the mentioned EURO classes for 0 % road gradient. In Figure 14 the old NOx emission
results of EURO 6 and EURO 6c from HBEFA 3.2 are also plotted. Figure 15 shows the old
and new NOx emission factors of EURO 4. In both charts the NOx emissions of EURO 5 for
comparisons between the different EURO classes are plotted. As mentioned, for this segment
the values are unchanged between HBEFA 3.2 and 3.3.

page 24 of 31
Figure 14: Old (HBEFA 3.2) and new (HBEFA 3.3) NOx emission factors for EURO 5 and
EURO 6 diesel cars
Figure 15: Old (HBEFA 3.2) and new (HBEFA 3.3) NOx emission factors for EURO 4 and
EURO 5 diesel cars

page 25 of 31
3.6. Effects of ambient temperature on NOx emissions
The NOx formation can be described with the Zeldovich mechanism, e.g. (Hausberger S.,
Sams T. 2016) and depends on the temperature and the oxygen concentration at the flame
front in the combustion chamber. Higher temperature and sufficient oxygen concentration re-
sult in higher NOx emissions if all other conditions are unchanged. Both parameters can be
influenced by different NOx reduction technologies, e.g. the EGR (exhaust gas recirculation).
The EGR uses the properties of inert gas to reduce temperature and oxygen with the recircu-
lation of (cooled) exhaust gas.
For conservative technologies lower ambient temperatures result in lower temperature at the
flame front and as a consequence in a lower NOx formation.
Due to the recirculation of combustion products, the water vapour concentration in the exhaust
gas is increasing with the EGR rate. Consequently, lower ambient temperatures are more crit-
ical in terms of condensation effects in the EGR path at higher EGR rates. Condensation of
water with particles and hydrocarbons in the distillate can cause severe problems, such as
interlocking of the cooler or the intake system due to coking. Therefore, the EGR can be re-
duced or deactivated to save components in the EGR path. If the EGR rate is reduced at lower
ambient temperatures, this results in more NOx at lower ambient temperature. The EGR is in
most of the cases optimised for an ambient temperature range of 20 °C to 30 °C. The effect of
higher NOx at lower temperatures was not considered in the emission factors in HBEFA 3.2 or
older since almost all vehicle tests were conducted at standard conditions around 25 °C at the
dynamometer. In the meantime a method to evaluate remote sensing data on temperature
effects was elaborated as outlined in the HBEFA report (Keller M. et. al. 2017) and the PEMS
test data provided measurements at different temperature levels for validation. HBEFA 3.3 now
considers temperature effects.
For the investigations based on vehicle testing, measurement data of RDE and dynamometer
tests from 7 different diesel EURO 6 vehicles driven at different ambient temperatures have
been used to produce vehicle and ambient temperature specific engine maps by PHEM. To
compare only the effect of the ambient temperature a simulation run for all vehicles on a com-
mon cycle was necessary. The vehicles with the appropriate engine maps have been simu-
lated on the CADC, the simulation results for diesel cars are shown in Figure 16. The NOx are
plotted as function of the ambient temperature. The trend with higher NOx at lower ambient
temperatures could be verified.

page 26 of 31
Figure 16: Effects of ambient temperature on NOx emissions for EURO 6 diesel cars
The simulated data can also provide a generic correction function, shown in Figure 17 (same
simulated data as in Figure 16).
Figure 17: Example for NOx correction function for EURO 6 diesel cars
To check the NOx temperature behaviour also remote sensing measurement data from Swe-
den have been analysed. The following chart shows effects for EURO 4, EURO 5 and EURO
6 diesel cars. In addition the TUG data are plotted (red rhombi with blue edging), which fit the
remote sensing data very well. As mentioned before, the EGR is optimised for a temperature

page 27 of 31
range > 20 °C, therefore only data points are plotted below this threshold. Furthermore, all
trend lines are described by linear equations.
Figure 18: Preliminary NOx correction functions for EURO 4, EURO 5 and EURO 6 diesel
cars based on vehicle tests and on Remote Sensing data from Sweden
These linear equations from remote sensing measurement data were used as basis for the
correction in the HBEFA but have been further adjusted to remote sensing data provided from
tests in Switzerland. The final correction functions were elaborated for the following boundary
conditions:
Ambient temperature effect on NOx emissions occurs only below 20 °C for EURO 4,
EURO 5 and EURO 6.
Ambient temperature effect on NOx emissions for EURO 6d-Temp and for EURO 6d
are limited by the boundary conditions defined in the RDE regulation (limits have to be
met down to 3 °C for EURO 6d-Temp and down to -3 °C for EURO 6d). Temperature
effects are relevant only below these temperature thresholds for future vehicles.
NOx does not further increase below 0 °C. The available data do not cover lower tem-
peratures, thus no statement on the real behaviour is possible at the moment. It is
assumed, that EGR is on fleet average already reduced down to almost zero percent
at 0 °C, so that no further effect on NOx occurs.
With the additional remote sensing data from Switzerland the NOx correction functions shown
in Figure 19 were elaborated. To produce the average correction functions the NOx emissions
at temperatures below 20 °C were divided by the average NOx emissions between 20 °C and
30 °C for all single sources and from the relative NOx changes the regression lines were cal-
culated.

page 28 of 31
Figure 19: NOx correction functions for EURO 4, EURO 5 and EURO 6 diesel cars based on
all available data and implemented in HBEFA 3.3
More details about the implementation of the temperature function are described in the final
report for the HBEFA 3.3 (Keller M. et. al. 2017).

page 29 of 31
4. Conclusions and Outlook
The HBEFA 3.3 is a so-called quick update, because only the NOx emission factors for EURO
4 to EURO 6 diesel passenger cars have been revised. EURO 6c diesel was replaced by
EURO 6d-Temp und EURO 6d to reflect the actual RDE legislation which was not known at
the time when HBEFA 3.2 was elaborated.
In total measurements on 25 vehicles with 61 emission tests have been used for the EURO 6
NOx emission factors calculation. 12 of the 61 emission tests were RDE-measurements of 4
different vehicles.
For each map creation in HEBFA 3.3, the CO2 interpolation method has been used. The
method calculates the engine power based on a generic map from the measured CO2 flow
and the engine speed. This is especially necessary for RDE-trips, because in most of the cases
the power signal is not known or too inaccurate for the engine map creation. Thus – apart from
NOx, PN, HC, CO etc. – also engine speed and CO2 are essential for map creation. The CO2
interpolation method is already implemented in the simulation tool PHEM.
The emission maps created by the CO2 interpolation method have been used for the average
EURO 6 diesel vehicle model creation. The weighting of the vehicle specific maps for the av-
erage emission map is based on the European vehicle registration numbers. The maps for
EURO 6d and EURO 6d-Temp have been derived from the measurement data under estima-
tion of the NOx conformity factor for RDE legislation.
Due to new measurement data in the ERMES DB, also the EURO 4 diesel map for cars has
been readjusted. The modifications for EURO 4 are minimal, only the NOx emissions are a
little bit higher for higher velocities.
For the diesel vehicles, an effect of ambient temperatures on NOx emissions was observed
and is now considered in the HBEFA 3.3 by post-processing. The appropriate correction func-
tions for EURO 4, EURO 5 and EURO 6 diesel vehicles have been derived from remote sens-
ing data.
The analysis of the temperature effects showed an unexpected high effect on the NOx emis-
sions. Having typical European temperature levels in mind, which are mainly between -5 °C to
25 °C, the temperature sensitivity of the NOx emissions leads to NOx increases compared to
test conditions between 20 °C and 30 °C of more than 30 %. Since the data used for the elab-
oration of the temperature correction factors is limited, a more comprehensive study on the
temperature effects is suggested. The study should investigate on more vehicles and should
also analyse if the simple relative adjustment of base emission factors is a correct approach
for all traffic situations. Such a study could also consider possibilities to reduce the temperature
sensitivities by retrofitting control software of EURO 6 vehicles.
The next HBEFA update is planned for 2018/2019 and should include:
A complete update of passenger cars emission data (including also other exhaust gas
components and further test data which are expected to be produced in 2017 and 2018)
Update for emission factors for 2-wheelers
Update of the LDV and HDV emissions factors based on new RDE and dynamometer
measurement data

page 30 of 31
5. Acknowledgements
The HBEFA 3.3 quick update would not have been possible without the support from vehicle
emission labs: EMPA (Switzerland), TNO (Netherlands) and ADAC (Germany) provided im-
portant dynamometer and RDE measurement data. Sweden and Switzerland also provided
remote sensing data to consider the ambient temperature effects on NOx emissions. The au-
thors would like to thank Mario Keller (INFRAS / MK Consulting, Switzerland) for the ERMES
DB management and for processing of the simulated emission factors.
Finally the work would not have been possible without the funding from UBA Germany and
UBA Austria, who set up well organised projects as basis for the HBEFA quick update.

page 31 of 31
6. References
Hausberger S., Rexeis M., Zallinger M., Luz R.: Emission Factors from the Model PHEM for
the HBEFA Version 3. Report Nr. I-20/2009 Haus-Em 33/08/679 from 07. December 2009
Hausberger S., Sams T.: Schadstoffbildung und Emissionsminimierung bei Kfz Teil I und II,
Skriptum IVT TU Graz, Graz, 2016
Hill N., Windisch E., Hausberger S., Matzer C., Skinner I., et.al.: Improving understanding of
technology and costs for CO2 reductions from cars and LCVs in the period to 2030 and de-
velopment of cost curves; Service Request 4 to LDV Emissions Framework Contract; Final
Report for DG Climate Action; Ref. CLIMA.C.2/FRA/2012/0006; Ricardo AEA, UK, 2015
Keller M., Hausberger S., Matzer C., Wüthrich P., Notter B.: HBEFA Version 3.3, Background
documentation, Berne, 12. April 2017
Luz R., Hausberger S.: User Guide for the Model PHEM, Version 10; Institute for Internal
Combustion Engines and Thermodynamics TU Graz, Graz, 2009
Matzer C., Hausberger S., Lipp S., Rexeis M.: A new approach for systematic use of PEMS
data in emission simulation, 21st International Transport and Air Pollution Conference, Lyon
24. – 26. May 2016
Rexeis M., Hausberger S., Kühlwein J., Luz R.: Update of Emission Factors for EURO 5 and
EURO 6 vehicles for the HBEFA Version 3.2. Final report No. I-31/2013/ Rex EM-I
2011/20/679 from 06. December 2013.
Weller K., Rexeis M., Hausberger S., Zach B.: A comprehensive evaluation method for in-
stantaneous emission measurements, 21st International Transport and Air Pollution Confer-
ence, Lyon, 24. – 26. May 2016
Zallinger M.: Mikroskopische Simulation der Emissionen von Personenkraftfahrzeugen. Dis-
sertation, Institut für Verbrennungskraftmaschinen und Thermodynamik, TU Graz, Graz,
April 2010