Lawpro practice-advice-2012-UofT-internationally-trained-lawyers-program
Upload
ivan-zdravkovicCategory
view
34download
3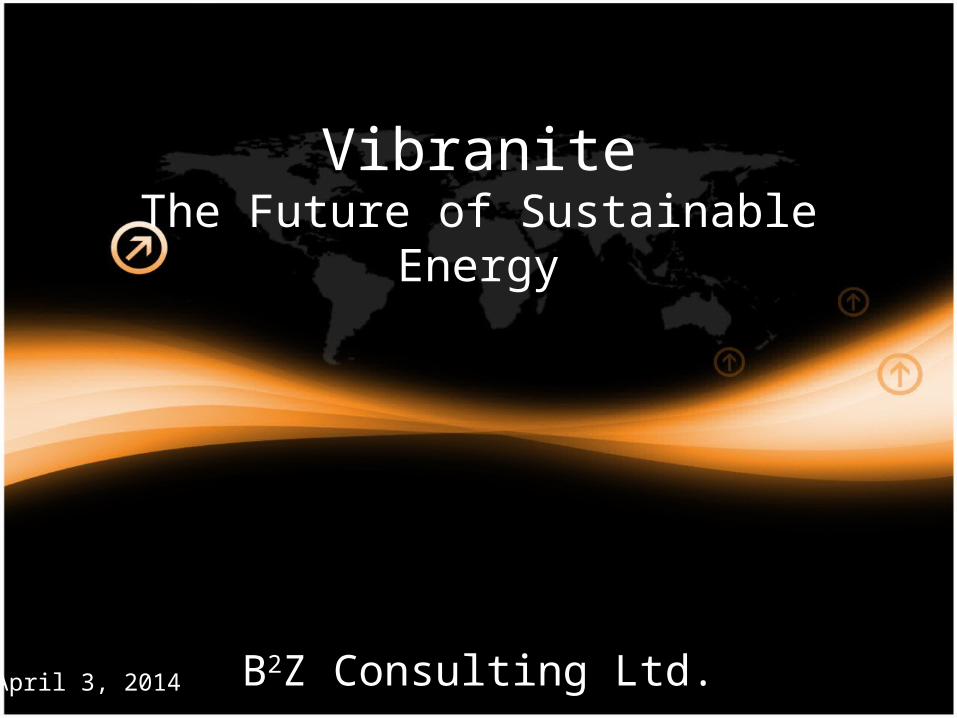
VibraniteThe Future of Sustainable Energy
B2Z Consulting Ltd.April 3, 2014
History
• ENSUS Exploration• Channa Mining Corp.
– US Government Support– 20 year Vibranite demand
• Miles City, Montana, USA
2
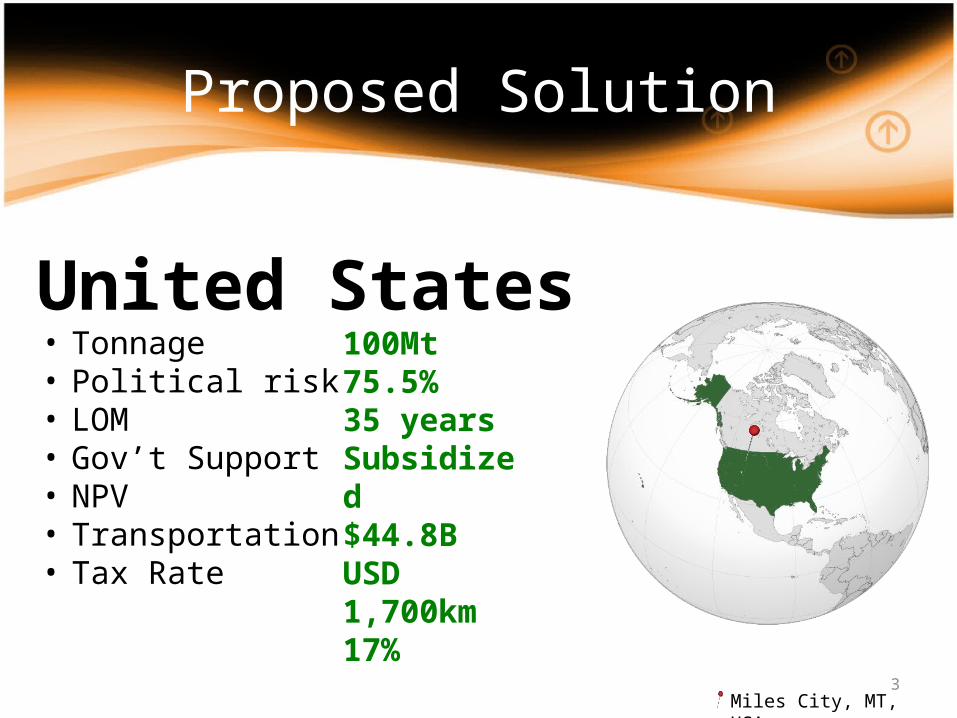
United States
Proposed Solution
• Tonnage• Political risk• LOM• Gov’t Support• NPV• Transportation• Tax Rate
Miles City, MT, USA
100Mt75.5%35 yearsSubsidized$44.8B USD1,700km17%
3
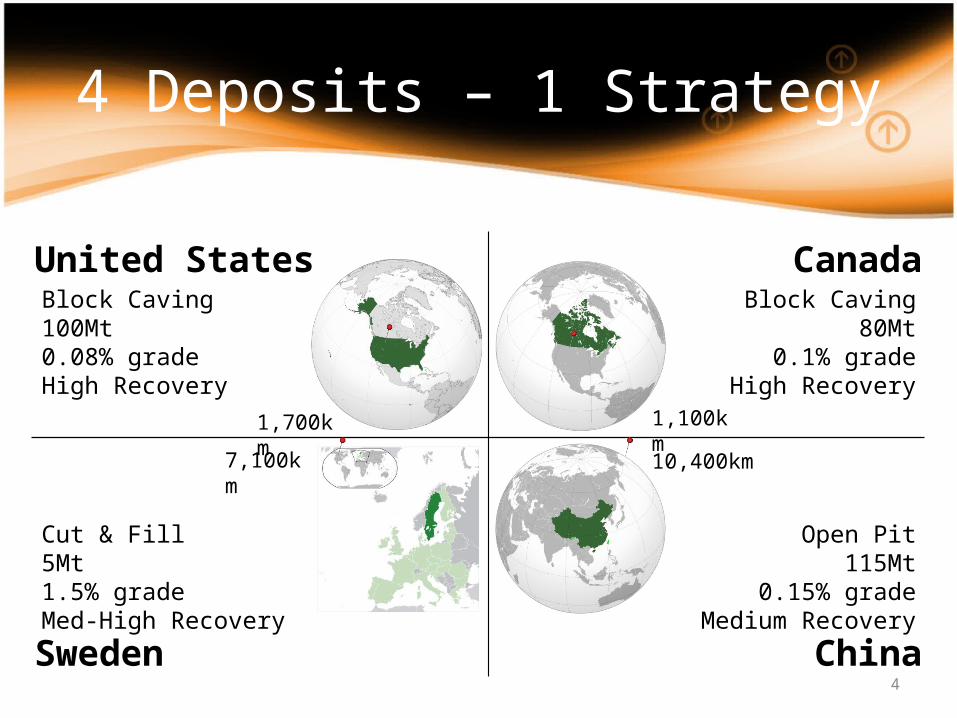
United States Canada
Sweden China
4 Deposits – 1 Strategy
Block Caving100Mt0.08% gradeHigh Recovery
Block Caving80Mt
0.1% gradeHigh Recovery
Cut & Fill5Mt1.5% gradeMed-High Recovery
Open Pit115Mt
0.15% gradeMedium Recovery
1,700km 1,100km
10,400km7,100km
4
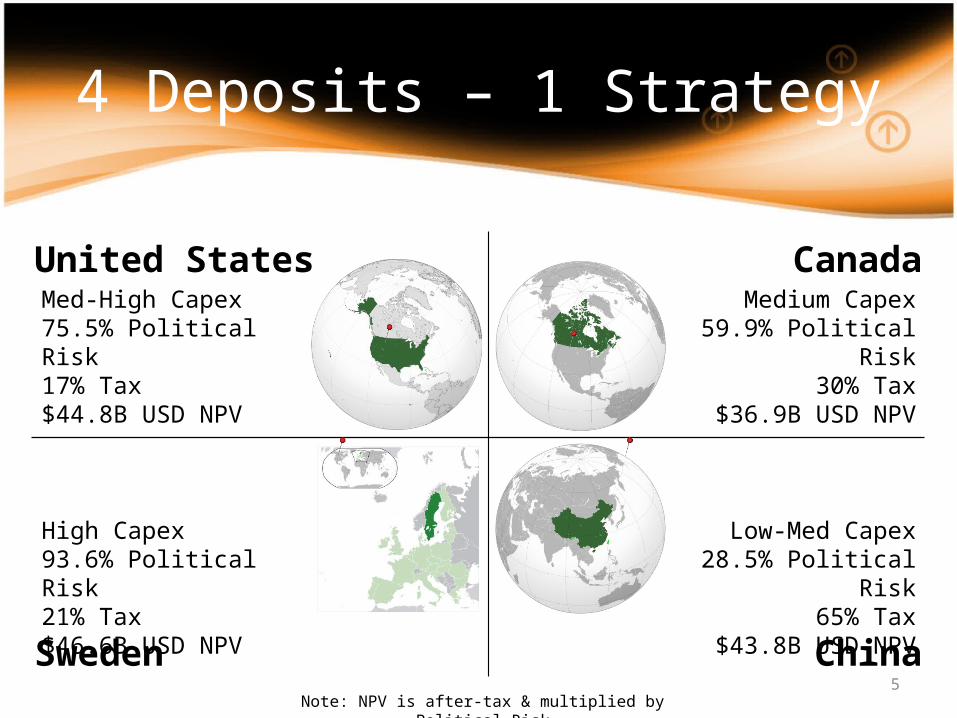
United States Canada
Sweden China
4 Deposits – 1 Strategy
Med-High Capex75.5% Political Risk17% Tax$44.8B USD NPV
High Capex93.6% Political Risk21% Tax$46.6B USD NPV
Low-Med Capex28.5% Political Risk
65% Tax$43.8B USD NPV
Medium Capex59.9% Political Risk
30% Tax$36.9B USD NPV
Note: NPV is after-tax & multiplied by Political Risk5
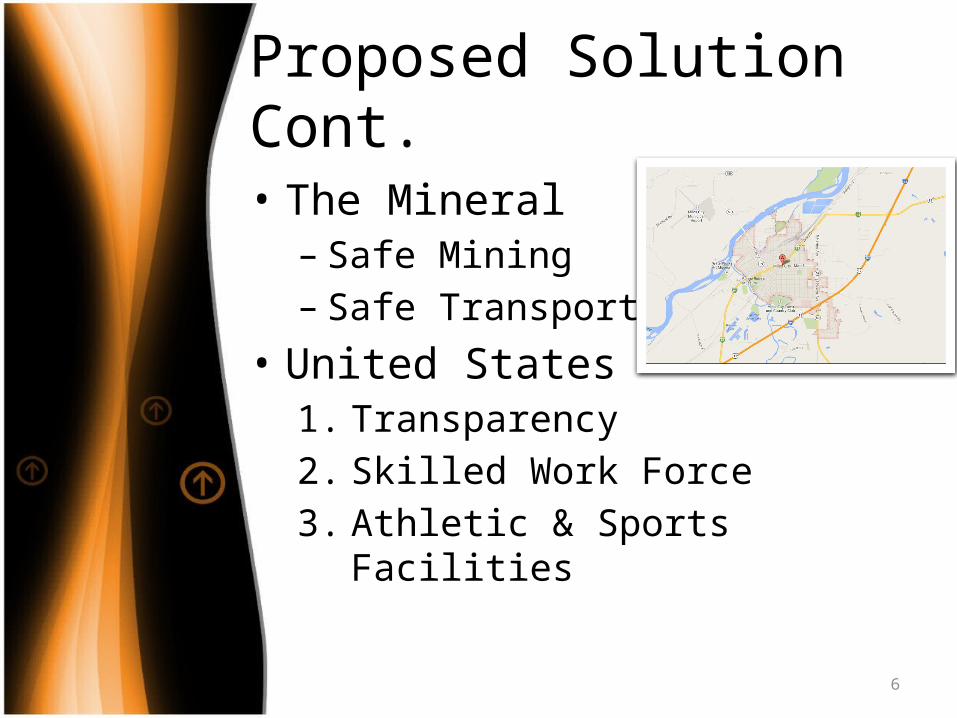
Proposed Solution Cont.
• The Mineral– Safe Mining– Safe Transportation
• United States1. Transparency2. Skilled Work Force3. Athletic & Sports Facilities
6

Proposed Solution Cont.
• Alternatives– Joint Venture with another
multinational company– Canada
7

Thank You
B2Z Consulting Ltd.
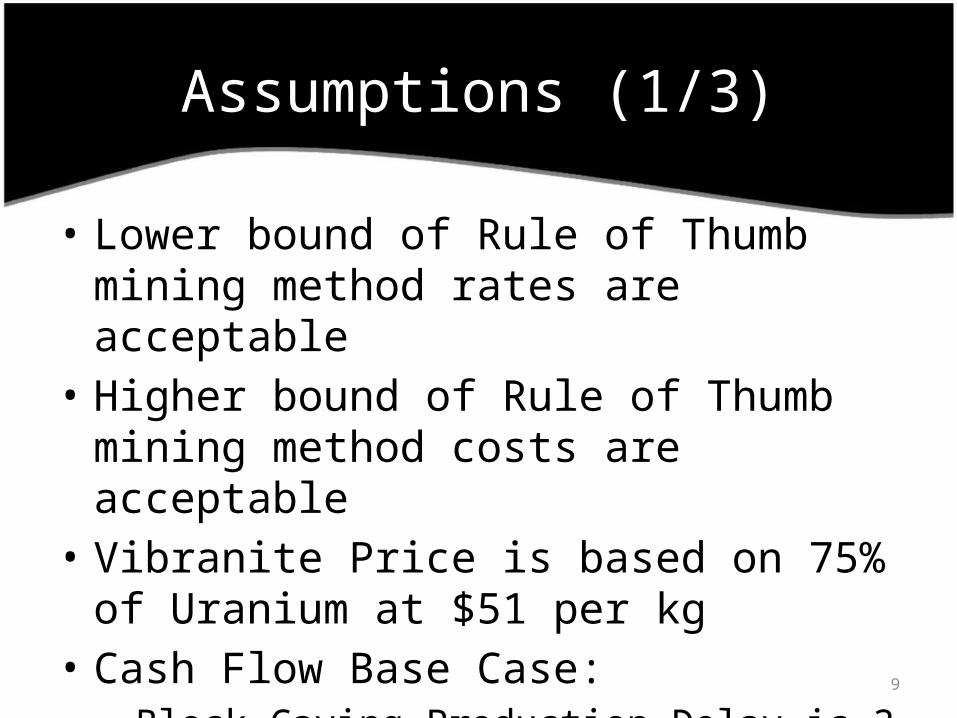
Assumptions (1/3)
• Lower bound of Rule of Thumb mining method rates are acceptable
• Higher bound of Rule of Thumb mining method costs are acceptable
• Vibranite Price is based on 75% of Uranium at $51 per kg
• Cash Flow Base Case:– Block Caving Production Delay is 3 years
9
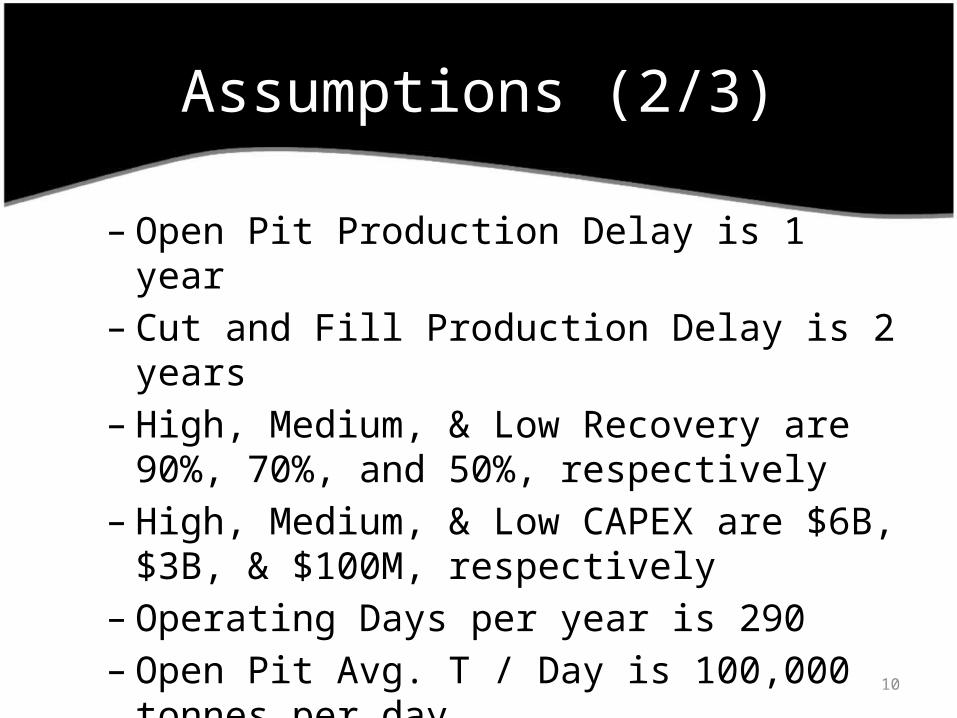
Assumptions (2/3)
– Open Pit Production Delay is 1 year– Cut and Fill Production Delay is 2 years– High, Medium, & Low Recovery are 90%, 70%, and
50%, respectively– High, Medium, & Low CAPEX are $6B, $3B, &
$100M, respectively– Operating Days per year is 290– Open Pit Avg. T / Day is 100,000 tonnes per day
10

Assumptions (3/3)
– Open Pit Cost per tonne is $5 per tonne• Mineral Processing Costs are the same for
each location
11

Cash Flow Analysis (1/2)
Deposit Location
Recommended Mining Method
Tonnage (Mt)
Average Grade (%)
Estimated Metallurgical Recovery
Canada Block Caving 80 0.1 High
China Open Pit 115 0.15 Medium
US Block Caving 100 0.08 High
Sweden Cut and Fill 5 1.5Medium to
High
CAPEX Tax RateAvg. T / Day Life of Mine
Cost per Tonne
Medium 30% 10,000 28 $ 2.50 Low to Medium 65% 100,000 4 $ 5.00 Medium to High 17% 10,000 35 $ 2.50
High 21% 500 35 $ 70.00 12
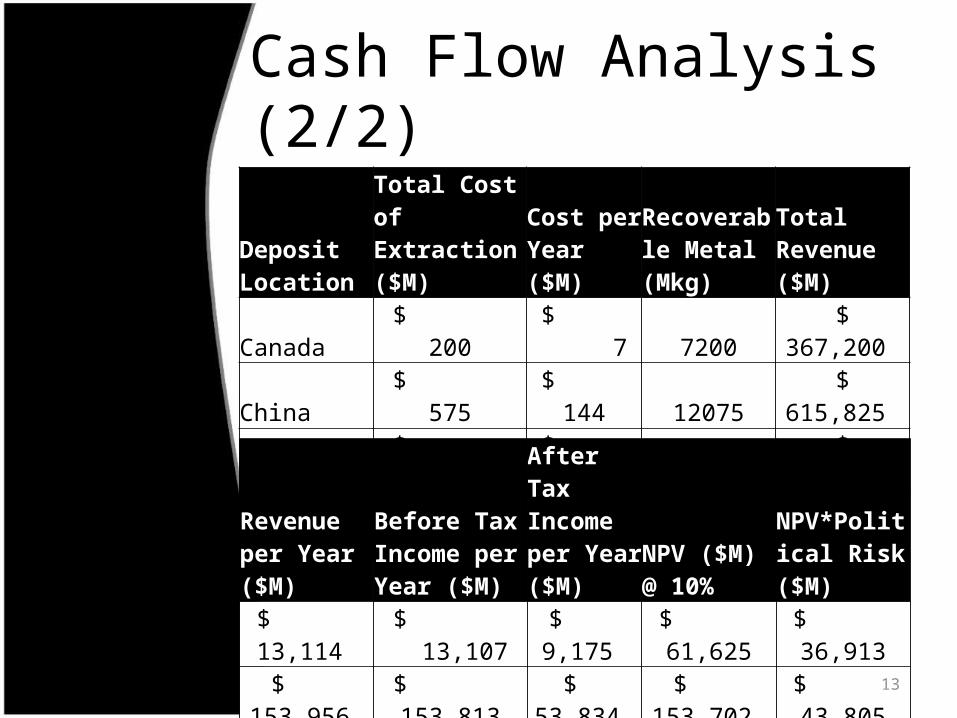
Cash Flow Analysis (2/2)
Deposit Location
Total Cost of Extraction ($M)
Cost per Year ($M)
Recoverable Metal (Mkg)
Total Revenue ($M)
Canada $ 200 $ 7 7200 $ 367,200
China $ 575 $ 144 12075 $ 615,825
US $ 250 $ 7 7200 $ 367,200
Sweden $ 350 $ 10 6000 $ 306,000
Revenue per Year ($M)
Before Tax Income per Year ($M)
After Tax Income per Year ($M)
NPV ($M) @ 10%
NPV*Political Risk ($M)
$ 13,114 $ 13,107 $ 9,175 $ 61,625 $ 36,913
$ 153,956 $ 153,813 $ 53,834 $ 153,702 $ 43,805
$ 10,491 $ 10,484 $ 8,702 $ 59,302 $ 44,773
$ 8,743 $ 8,733 $ 6,899 $ 49,781 $ 46,595 13
References
• http://www.femp.org/wp-content/uploads/2011/07/CAT-workshop-Rio-Tinto-Block-Caving.pdf
• https://maps.google.ca/maps?q=miles+city+montana&ie=UTF-8&ei=tM88U9SbAoSr7AbPtIDoCw&ved=0CAgQ_AUoAQ
14