Untangling syntactic and sensory processing: An …Poulin,Tillmann, Madurell,&D’Adamo,2003; Tekman...
15
Untangling syntactic and sensory processing: An ERP study of music perception STEFAN KOELSCH, a,b SEBASTIAN JENTSCHKE, a DANIELA SAMMLER, a and DANIEL MIETCHEN a a Independent Junior Research Group Neurocognition of Music, Max-Planck-Institute for Human Cognitive and Brain Sciences, Leipzig, Germany b Department of Psychology, University of Sussex, Brighton, United Kingdom Abstract The present study investigated music-syntactic processing with chord sequences that ended on either regular or irregular chord functions. Sequences were composed such that perceived differences in the cognitive processing between syn- tactically regular and irregular chords could not be due to the sensory processing of acoustic factors like pitch repetition, pitch commonality (the major component of ‘‘sensory dissonance’’), or roughness. Three experiments with indepen- dent groups of subjects were conducted: a behavioral experiment and two experiments using electroencephalography. Irregular chords elicited an early right anterior negativity (ERAN) in the event-related brain potentials (ERPs) under both task-relevant and task-irrelevant conditions. Behaviorally, participants detected around 75% of the irregular chords, indicating that these chords were only moderately salient. Nevertheless, the irregular chords reliably elicited clear ERP effects. Amateur musicians were slightly more sensitive to musical irregularities than nonmusicians, sup- porting previous studies demonstrating effects of musical training on music-syntactic processing. The findings indicate that the ERAN is an index of music-syntactic processing and that the ERAN can be elicited even when irregular chords are not detectable based on acoustical factors such as pitch repetition, sensory dissonance, or roughness. Descriptors: Auditory processing, Music, EEG, MMN, ERAN, EAN, N5 All types of music show an organization of perceptually discrete elements (such as tones, intervals, and chords) into sequences that are structured according to syntactic regularities (Koelsch, 2005; Patel, 2003; Riemann, 1877/1971; Tillmann, Bharucha, & Bigand, 2000). The human brain has the capability to effortlessly acquire knowledge about music-syntactic regularities and to process musical information fast and accurately according to this knowledge. Such processing is a prerequisite for the understand- ing of music, and the neural mechanisms underlying music-syn- tactic processing appear also to be important for language- syntactic processing, as well as for other cognitive operations such as sequencing of auditory information (e.g., Janata & Grafton, 2003; Janata, Tillmann, & Bharucha, 2002; Koelsch, 2005; Koelsch & Siebel, 2005; Patel, 2003; see also General Dis- cussion). The present study investigates neural correlates of music- syntactic processing using music-theoretically described regular- ities of major–minor (‘‘Western’’) tonal music. In major-minor tonal music, the temporal, or horizontal, aspect of harmonic structure is based on the progression of chord functions. Chord functions are, for example, chords built on the scale tones (Figure 1). The chord built on the first scale tone is denoted as the tonic, the chord built on the fifth scale tone is the dominant, and the chord built on the fourth scale tone is the subdominant. The arrangement of chord functions within a musical sequence follows regularities. For example, a dominant is often directly preceded by a subdominant, but rarely vice versa. Another instance of a musical regularity is the end of a harmonic progression being frequently marked by a domi- nant-tonic progression. In contrast, a tonic-dominant progres- sion is not acceptable as a marker of the end of a harmonic progression. Although nonmusicians usually do not have explicit knowledge about music theory, or of terms like ‘‘tonic’’ and ‘‘dominant,’’ they nevertheless have a sophisticated (implicit) knowledge of chord functions, harmonic relations be- tween chord functions, and the complex regularities of their arrangement (nonmusicians acquire this implicit knowledge presumably during listening experiences of everyday life; Bigand, Tillmann, Poulin, D’Adamo, & Madurell, 2001; Koelsch, Gunter, Friederici, & Schro¨ ger, 2000; Tillmann et al., 2000). We thank Richard Parncutt, Chris Darwin, and Marc Leman for helpful comments on an earlier version of this article. We thank Regine Asseburg, Clemens Maidhof, and Tobias Teichert for assistance in con- ducting and evaluating the experiments. Examples of the stimuli are available at http://www.stefan-koelsch.de/ERAN-ST-DD. Address reprint requests to: Stefan Koelsch, Max-Planck-Institute for Human Cognitive and Brain Sciences, Stephanstr. 1a, 04103 Leipzig, Germany. E-mail: [email protected] Psychophysiology, 44 (2007), 476–490. Blackwell Publishing Inc. Printed in the USA. Copyright r 2007 Society for Psychophysiological Research DOI: 10.1111/j.1469-8986.2007.00517.x 476
-
Upload
nguyenhuong -
Category
Documents
-
view
217 -
download
0
Transcript of Untangling syntactic and sensory processing: An …Poulin,Tillmann, Madurell,&D’Adamo,2003; Tekman...
Untangling syntactic and sensory processing:
An ERP study of music perception
STEFAN KOELSCH,a,b SEBASTIAN JENTSCHKE,a DANIELA SAMMLER,a andDANIEL MIETCHENa
aIndependent Junior Research Group Neurocognition of Music, Max-Planck-Institute for Human Cognitive and Brain Sciences,Leipzig, GermanybDepartment of Psychology, University of Sussex, Brighton, United Kingdom
Abstract
The present study investigatedmusic-syntactic processingwith chord sequences that ended on either regular or irregular
chord functions. Sequences were composed such that perceived differences in the cognitive processing between syn-
tactically regular and irregular chords could not be due to the sensory processing of acoustic factors like pitch repetition,
pitch commonality (the major component of ‘‘sensory dissonance’’), or roughness. Three experiments with indepen-
dent groups of subjects were conducted: a behavioral experiment and two experiments using electroencephalography.
Irregular chords elicited an early right anterior negativity (ERAN) in the event-related brain potentials (ERPs) under
both task-relevant and task-irrelevant conditions. Behaviorally, participants detected around 75% of the irregular
chords, indicating that these chords were only moderately salient. Nevertheless, the irregular chords reliably elicited
clear ERP effects. Amateur musicians were slightly more sensitive to musical irregularities than nonmusicians, sup-
porting previous studies demonstrating effects of musical training on music-syntactic processing. The findings indicate
that the ERAN is an index ofmusic-syntactic processing and that the ERAN can be elicited even when irregular chords
are not detectable based on acoustical factors such as pitch repetition, sensory dissonance, or roughness.
Descriptors: Auditory processing, Music, EEG, MMN, ERAN, EAN, N5
All types of music show an organization of perceptually discrete
elements (such as tones, intervals, and chords) into sequences
that are structured according to syntactic regularities (Koelsch,
2005; Patel, 2003; Riemann, 1877/1971; Tillmann, Bharucha, &
Bigand, 2000). The human brain has the capability to effortlessly
acquire knowledge about music-syntactic regularities and to
process musical information fast and accurately according to this
knowledge. Such processing is a prerequisite for the understand-
ing of music, and the neural mechanisms underlying music-syn-
tactic processing appear also to be important for language-
syntactic processing, as well as for other cognitive operations
such as sequencing of auditory information (e.g., Janata &
Grafton, 2003; Janata, Tillmann, & Bharucha, 2002; Koelsch,
2005; Koelsch & Siebel, 2005; Patel, 2003; see also General Dis-
cussion).
The present study investigates neural correlates of music-
syntactic processing using music-theoretically described regular-
ities of major–minor (‘‘Western’’) tonal music. In major-minor
tonal music, the temporal, or horizontal, aspect of harmonic
structure is based on the progression of chord functions.
Chord functions are, for example, chords built on the scale
tones (Figure 1). The chord built on the first scale tone is
denoted as the tonic, the chord built on the fifth scale tone is the
dominant, and the chord built on the fourth scale tone is the
subdominant. The arrangement of chord functions within a
musical sequence follows regularities. For example, a dominant
is often directly preceded by a subdominant, but rarely vice
versa. Another instance of a musical regularity is the end of a
harmonic progression being frequently marked by a domi-
nant-tonic progression. In contrast, a tonic-dominant progres-
sion is not acceptable as a marker of the end of a harmonic
progression.
Although nonmusicians usually do not have explicit
knowledge about music theory, or of terms like ‘‘tonic’’ and
‘‘dominant,’’ they nevertheless have a sophisticated
(implicit) knowledge of chord functions, harmonic relations be-
tween chord functions, and the complex regularities of their
arrangement (nonmusicians acquire this implicit knowledge
presumably during listening experiences of everyday life;
Bigand, Tillmann, Poulin, D’Adamo, & Madurell, 2001;
Koelsch, Gunter, Friederici, & Schroger, 2000; Tillmann et al.,
2000).
We thank Richard Parncutt, Chris Darwin, and Marc Leman for
helpful comments on an earlier version of this article. We thank Regine
Asseburg, Clemens Maidhof, and Tobias Teichert for assistance in con-
ducting and evaluating the experiments. Examples of the stimuli are
available at http://www.stefan-koelsch.de/ERAN-ST-DD.Address reprint requests to: Stefan Koelsch, Max-Planck-Institute
for Human Cognitive and Brain Sciences, Stephanstr. 1a, 04103 Leipzig,Germany. E-mail: [email protected]
Psychophysiology, 44 (2007), 476–490. Blackwell Publishing Inc. Printed in the USA.Copyright r 2007 Society for Psychophysiological ResearchDOI: 10.1111/j.1469-8986.2007.00517.x
476

The regularities of the arrangement of chord functions within
a harmonic sequence have been denoted as part of a musical
syntax (Koelsch, 2005; Riemann, 1877/1971), and particularly
the dominant-tonic succession is considered as a basic syntactic
structure of major–minor tonal music (see also Tillmann et al.,
2000). Previous studies examining neural mechanisms of pro-
cessing musical syntax using event-related brain potentials
(ERPs) indicated that processing of musical information is
reflected in a variety of ERP components such as the P300
(Janata, 1995), late positive component (LPC; Besson & Faita,
1995; Regnault, Bigand, & Besson, 2001), right anterior tempo-
ral negativity (Patel, Gibson, Ratner, Besson, & Holcomb,
1998), and closure positive shift (Knoesche et al., 2005; Neuhaus,
Knosche, & Friederici, 2006); the functional significance of these
components has been reviewed elsewhere (Besson & Schon,
2001; Koelsch & Siebel, 2005).
Investigations on the processing of musical structure, how-
ever, are confronted with the problem that, for the most part,
music-syntactic regularities co-occur with acoustic similarity.
For example, in a harmonic sequence in C major, a C# major
chord (that does not belong to C major) is music-syntactically
irregular, but the C# major chord is also acoustically less similar
to the C major context than any other chord belonging to C
major (because the C# major chord consists of tones that do not
belong to the C major scale). Thus, any experimental effects
evoked by such a C# major chord cannot simply be attributed to
music-syntactic processing. In fact, tonal hierarchies and music-
syntactic regularities of major–minor tonal music are largely
grounded on acoustic similarities (e.g., Leman, 2000). The aim to
disentangle the ‘‘cognitive’’ mechanisms (related to music-syn-
tactic processing) from the ‘‘sensory’’ mechanisms (related to the
processing of acoustic information) has a certain tradition in
music-psychological research (for overviews, see, e.g., the special
issue ofMusic Perception, 17[4], 2001), and several experimental
paradigms have been suggested to avoid the confound of music-
syntactic and acoustic regularity (Bharucha & Stoeckig, 1987;
Bigand, Poulin, Tillmann, Madurell, & D’Adamo, 2003; Tekman
& Bharucha, 1998).
The present study is a continuation of studies that investi-
gated processing of musical structure using Neapolitan sixth
chords as music-structural irregularities (Koelsch et al., 2000,
2001; Koelsch, Schmidt, & Kansok, 2002; Loui, Grent-’t Jong,
Torpey, & Woldorff, 2005; Maess, Koelsch, Gunter, & Frieder-
ici, 2001). The Neapolitan chords elicited an early right anterior
negativity (ERAN, maximal around 200 ms) in the ERPs of
listeners familiar with the harmonic regularities of major–minor
tonal music. Psychoacoustically, however, the use of Neapolitan
chords was problematic in at least two respects. First, the
Neapolitan chords had fewer pitches in commonwith the directly
preceding chord than final tonic chords had. That is, the
presentation of Neapolitans led to a higher degree of ‘‘sensory
dissonance’’ than the presentation of tonic chords1 (the term
‘‘sensory dissonance’’ is used here in the broader sense referring
to the relations between successive sounds, as in Parncutt, 1989).
The co-occurrence of music-syntactic irregularity and low
pitch commonality with the preceding chord made it difficult
to determine to what extent the ERAN was possibly over-
lapped by potentials related to the processing of sensory
dissonance.
Second, Neapolitan chords also represented frequency devi-
ants, because directly succeeding sequences were presented in the
same tonal key, and the Neapolitan chords introduced pitches
that occurred with a lower probability across sequences than the
pitches of the control chords. That is, because chord sequences
were usually presented in the same key, the auditory sensory
memory could have established a sensory memory trace for the
in-key scale tones. The Neapolitan chords introduced out-of-key
notes (in C major: d flat and a flat) that did not match with the
representation of tones stored in auditory sensory memory.
Thus, it was difficult to determine to what extent the ERAN was
possibly overlapped by a frequency mismatch negativity (MMN,
e.g., Schroger, 1998; theMMN is an ERP component that can be
evoked by acoustic changes in a repetitive auditory environ-
ment), orwhether an ERANcould be elicited at all in the absence
of a frequency deviance.
In the present study, we minimized acoustic differences be-
tween music-syntactically irregular and regular chords by taking
into account three acoustical factors: pitch repetition, pitch
commonality (the major component of sensory dissonance), and
roughness. The data show that music-syntactically irregular
chords still elicit an ERAN, arguing for syntactic rather than
merely sensory processing underlying the generation of this ERP
component.
EXPERIMENT 1
In the first experiment, two sequence types were composed, each
comprising five chords (Figure 2A, B). According to the theory
of harmony, the first four chords of the sequences were arranged
in such a fashion that a tonic at the fifth position was the most
regular chord function (e.g., Piston, 1948/1987; Schonberg,
1969). The regular sequences (Figure 2A) ended on a dominant-
tonic progression. The final chord of the irregular sequences
(Figure 2B) was a double dominant (DD; the DD is the major
chord built on the second scale tone; see also Figure 1).2
With respect to the first four chords, both DDs and final
tonics contained new pitches, that is, pitches that were not con-
tained in any of the previous chords: Tonic chords contained
two new pitches (in both the top voice and the base voice; see the
f# and the d indicated by the arrows in Figure 2A), and DDs
Untangling syntactic and sensory processing 477
double dominant
tonic
dominant
supertonic
II I III IV V VIIVI
[I V]
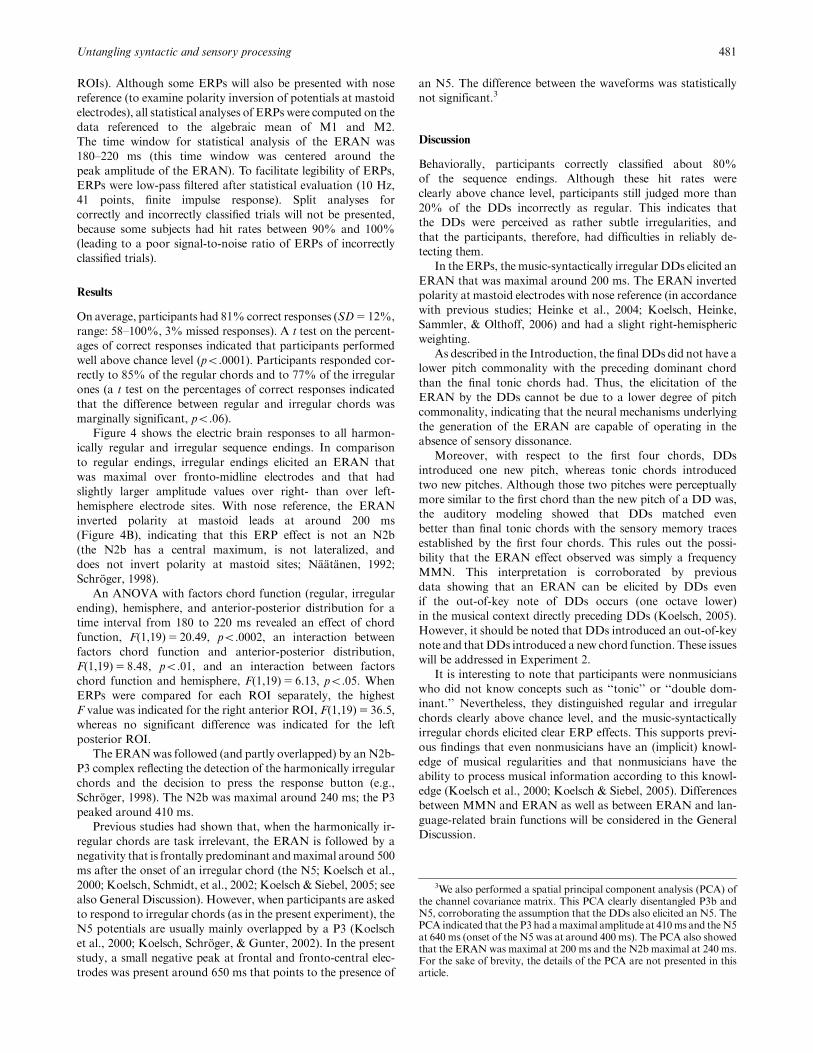
Figure 1. Examples of chord functions. The chord built on the first scale
tone is denoted as the tonic, the chord on the second scale tone as
the supertonic, and the chord on the fifth scale tone as the dominant. The
major chord on the second tone of a scale can be interpreted as the
dominant to the dominant (double dominant, see square brackets).
1This was mainly due to two dissonant semi-tone intervals between aNeapolitan (in C major f–a flat–d flat) and the dominant-seventh chord(in C major g–h–d–f) preceding the Neapolitan: the two semi-toneintervals between these chords are (in C major) g–a flat, and d–d flat.
2A double dominant (in major) is often also referred to as chromaticsupertonic.
contained one new pitch (in the top voice; see arrow in
Figure 2B). In contrast to DDs, the new pitches of tonic chords
had been presented either one octave lower or one octave higher
in the first chord. Thus, the new pitches of final tonics were
perceptually more similar to pitches of the first chord than
the new pitch of the DD was. However, because the octaves of
the two new pitches of final tonics were only contained once
in the very first chord of the sequence, these tones were masked
by the second, third, and fourth chords. Therefore, we assumed
that the new pitch of the DD would not represent a greater
frequency deviant for the auditory sensory memory than the two
new pitches of tonic chords.
To test this assumption, we modeled the acoustic congruency
of the final chords with auditory sensory memory traces estab-
lished by the first four chords using the IPEM toolbox (Leman,
2000; Leman, Lesaffre, & Tanghe, 2005). This auditorymodeling
estimates pitch images of the echoic memory: Acoustic informa-
tion decays, but is kept in the echoic memory for a certain time.
The aim of the modeling was to determine the correlation of the
pitch image of a final chord with the pitch image of the first four
chords stored in the echoic memory. The results of the modeling
are shown in Figure 3A (echo of local images: 0.1 s, echo of
global image: 1.5 s; see Leman, 2000; note that these values in-
dicate half decay values and thatFparticularly due to the use of
the 1.5-s gliding windowFinformation of all preceding four
chords affects the correlations between the last chord and the
preceding chords). The pitch images of the final DDs correlated
even higher than those of final tonic chords with the pitch images
established by the first four chords.
Moreover, chord sequences were constructed such that the
pitch commonality (calculated according to Parncutt, 1989) be-
tween the last two chords had even higher values for the music-
syntactically irregular ending (dominant-DD) than for the reg-
ular ending (dominant-tonic; see Figure 3B).
Thus, with respect to both (a) the pitch commonality between
final and penultimate chord and (b) the acoustic congruency be-
tween the final chord and the information of the first four chords
stored in the echoic memory, music-syntactically irregular end-
ings were acoustically even more similar to the previous chord(s)
than music-syntactically regular endings. This excludes the pos-
sibility that ERP effects elicited by music-syntactically irregular
final chords could be due to a higher degree of sensory dissonance
or a higher incongruency with the memory traces stored in au-
ditory sensory memory.
Note that the new pitch introduced byDDswas an out-of-key
note (the g# in the top voice of Figure 2B), that is, a note that did
not belong to the tonal key established by the preceding har-
monic context. Moreover, DDs represented a new chord func-
tion within the sequence (unlike final tonic chords, which
repeated the chord function of the first chord). Experiment 2
will investigate ERP effects elicited by music-syntactically irreg-
ular chords that do not introduce an out-of-key note and that
do not introduce a new chord function.
The tonal key changed from sequence to sequence (i.e., each
chord sequence was presented in a tonal key different from the
key of the preceding sequence; see Figure 2D), and both sequence
types occurred randomly with equal probability ( p5 0.5). Be-
cause the superposition of intervals was identical for both final
478 S. Koelsch et al.
A: Tonic B: DD C: ST
D: Experiment 1
E: Experiments 2 & 3, DD-block
F: Experiments 2 & 3, ST-block
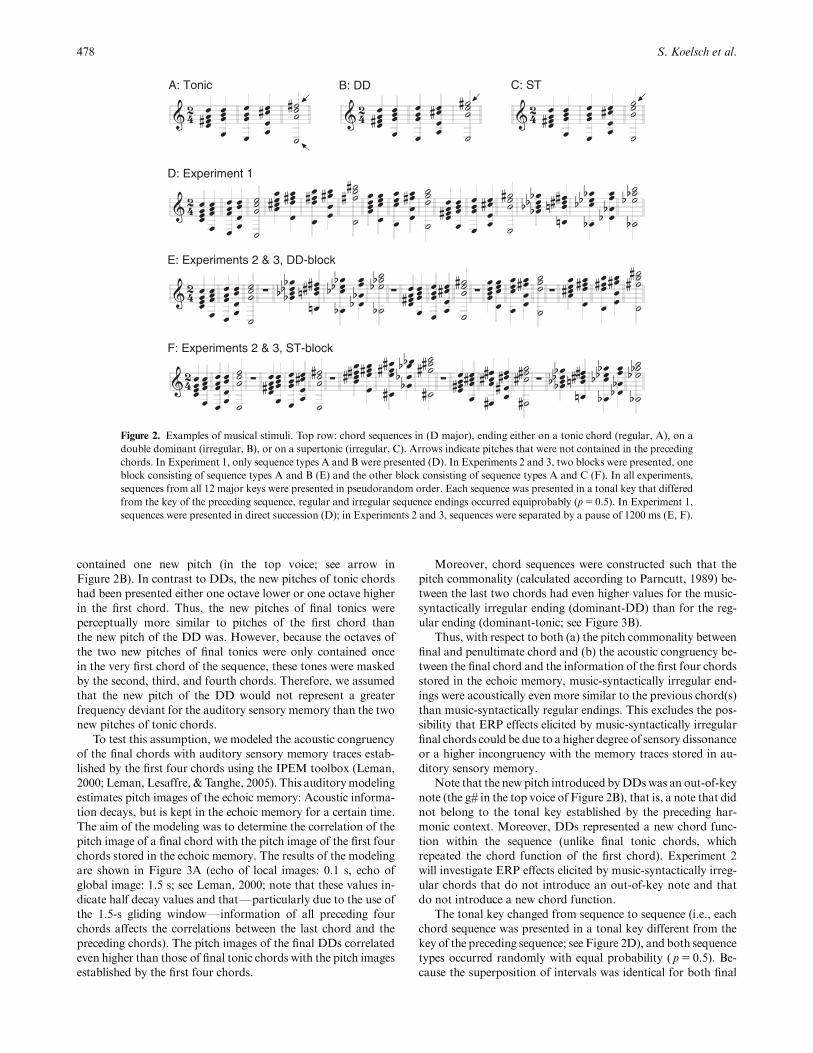
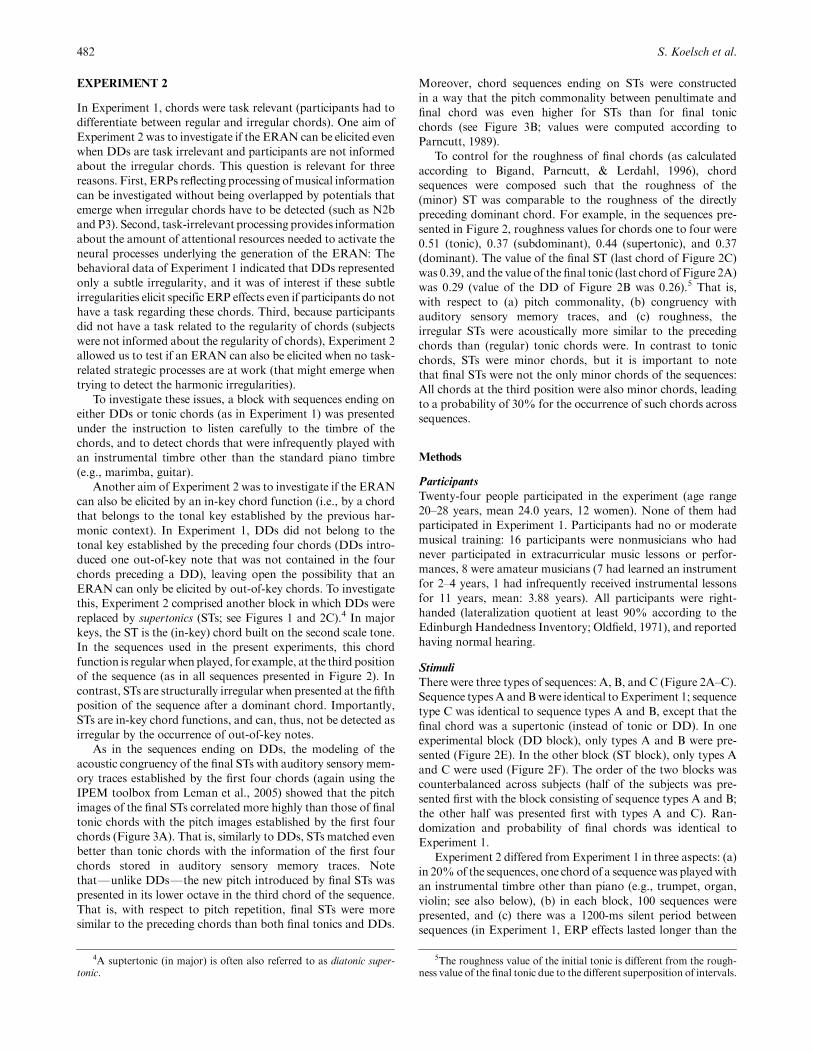
Figure 2. Examples of musical stimuli. Top row: chord sequences in (D major), ending either on a tonic chord (regular, A), on a
double dominant (irregular, B), or on a supertonic (irregular, C). Arrows indicate pitches that were not contained in the preceding
chords. In Experiment 1, only sequence types A and B were presented (D). In Experiments 2 and 3, two blocks were presented, one
block consisting of sequence types A and B (E) and the other block consisting of sequence types A and C (F). In all experiments,
sequences from all 12 major keys were presented in pseudorandom order. Each sequence was presented in a tonal key that differed
from the key of the preceding sequence, regular and irregular sequence endings occurred equiprobably (p5 0.5). In Experiment 1,
sequences were presented in direct succession (D); in Experiments 2 and 3, sequences were separated by a pause of 1200 ms (E, F).
tonics and DDs, physically identical chords were music-syntac-
tically regular in one sequence, but irregular in another (e.g., the
final tonic chord of Figure 2A was a DD of sequences starting in
C major, and the final DD of Figure 2B was a tonic in sequences
starting in E major). Therefore, any effect elicited by a DD could
not be due to the properties of the chord itself.
Participants of Experiment 1 were nonmusicians (thus obliv-
ious of concepts such as ‘‘double dominant,’’ or ‘‘tonic’’), who
listened to the sequences under the instruction to press one but-
ton for the regular chord sequence endings and another button
for the irregular ones. It was hypothesized that the irregular
endings (DDs) elicit an ERAN in comparison to the regular
endings (tonic chords). Because the present study focuses on the
ERAN, other ERP effects (such as N2b, P3, and N5) will be
reported, but only briefly discussed in the General Discussion.
Methods
Participants
Twenty people participated in the experiment (age range 18–30
years, mean 23.0 years, 10 women). Participants were nonmu-
sicians who had never participated in extracurricular music les-
sons or performances. All participants were right-handed
(lateralization quotient at least 90% according to the Edinburgh
Handedness Inventory; Oldfield, 1971) and reported having
normal hearing.
Stimuli
There were two sequences, A and B (Figure 2A, B) that were
transposed to the 12 major keys, resulting in 24 different se-
quences. Each sequence consisted of five chords, of which the
first four chord functions were identical: tonic, subdominant,
supertonic, dominant. The final chord function of type A was a
tonic and that of type B a double dominant. Using only two
sequences transposed to different keys gave us the maximum
acoustic control of the musical stimulus (for studies investigating
the ERAN with more naturalistic stimuli, see, e.g., Koelsch &
Mulder, 2002; Steinbeis, Koelsch, & Sloboda, 2006).
Sequences were presented in direct succession (Figure 2D);
there was no silent period between chords or sequences. Each
sequence type occurred with a probability of .5, and both se-
quence types were randomly intermixed. Moreover, each se-
quence was presented pseudorandomly in a tonal key different
from the key of the preceding sequence. Across the experiment,
each sequence type was presented six times in each of the 12
major keys, resulting in 120 sequences for the entire experiment.
The timing was identical to previous studies (e.g., Koelsch et al.,
2000): Presentation time of chords 1 to 4 was 600ms, chord 5 was
presented for 1200 ms. Block duration was approximately 7 min.
All chords had the same decay of loudness and were played with
a piano-sound (General Midi sound #2) under computerized
control on a synthesizer (ROLAND JV 8010; Roland Corpo-
ration, Hamamatsu, Japan).
Procedure
Participants were informed about the irregular chords and were
asked to press a response button for the last chord of each se-
quence. There were two response buttons: one button for the
regular chords and the other one for the irregular ones. Partic-
ipants were asked to respond as fast as possible. Half of the
subjects were instructed to press the left button for the regular
endings; the other half pressed the right button for these endings.
As examples, three sequences of type A and three sequences of
type B were presented. During the experimental session, partic-
ipants were instructed to look at a fixation cross.
Untangling syntactic and sensory processing 479
double dominantsupertonictonic
A
B 0.8
0.3
0.4
0.5
0.6
0.7
c c#d d# f# g g# a#e f a h
Tonal key
Pitc
h co
mm
onal
ity
0.9
0.6
0.8
1.0
0.5
0.7
1st 2nd 3rd 4th 5th
chord
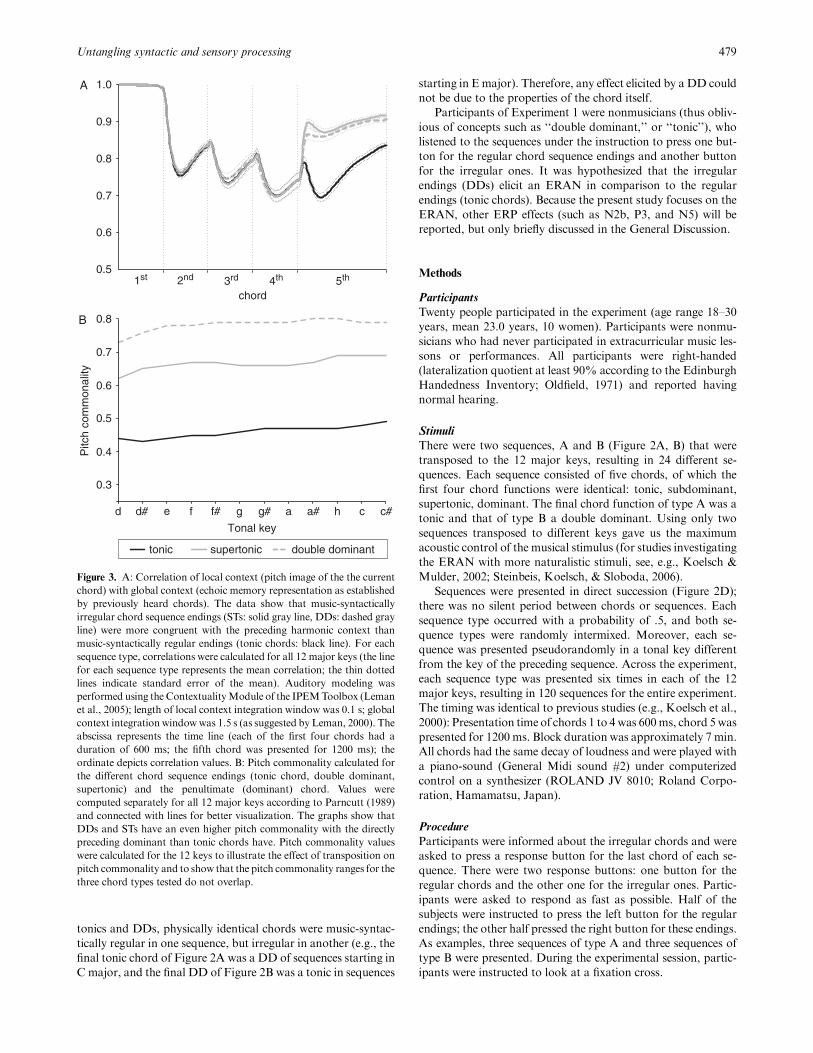
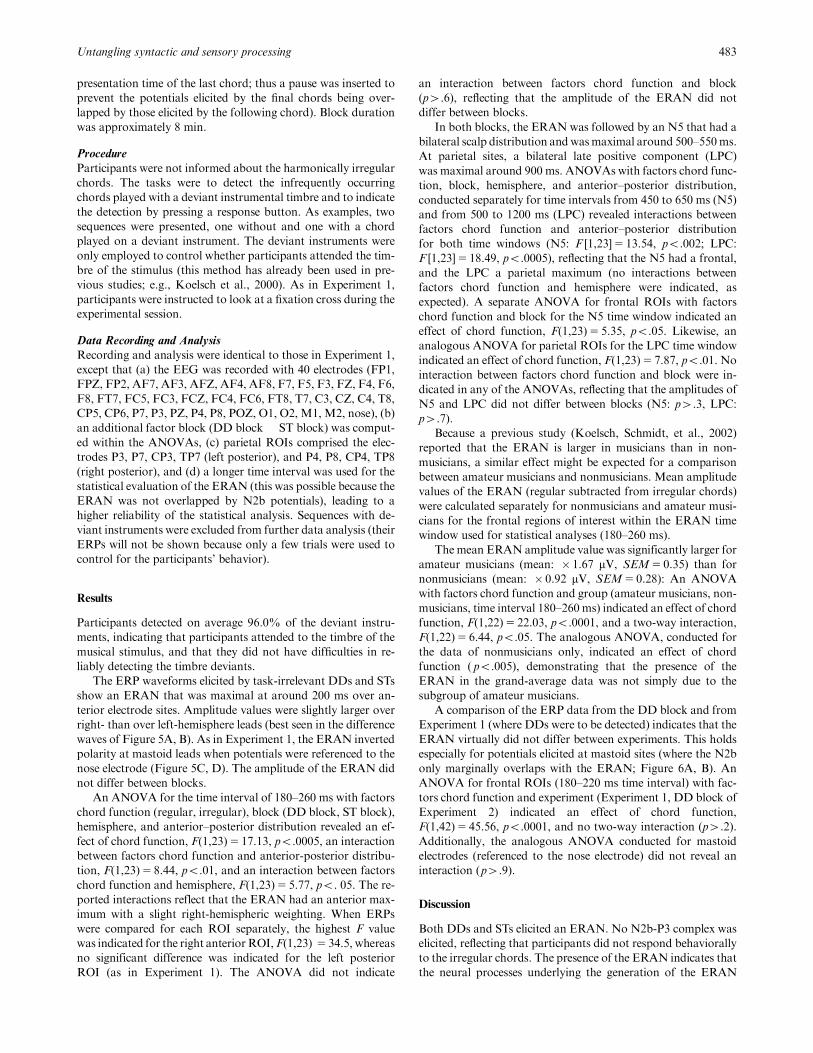
Figure 3. A: Correlation of local context (pitch image of the the current
chord) with global context (echoic memory representation as established
by previously heard chords). The data show that music-syntactically
irregular chord sequence endings (STs: solid gray line, DDs: dashed gray
line) were more congruent with the preceding harmonic context than
music-syntactically regular endings (tonic chords: black line). For each
sequence type, correlations were calculated for all 12 major keys (the line
for each sequence type represents the mean correlation; the thin dotted
lines indicate standard error of the mean). Auditory modeling was
performed using the ContextualityModule of the IPEMToolbox (Leman
et al., 2005); length of local context integration window was 0.1 s; global
context integrationwindowwas 1.5 s (as suggested by Leman, 2000). The
abscissa represents the time line (each of the first four chords had a
duration of 600 ms; the fifth chord was presented for 1200 ms); the
ordinate depicts correlation values. B: Pitch commonality calculated for
the different chord sequence endings (tonic chord, double dominant,
supertonic) and the penultimate (dominant) chord. Values were
computed separately for all 12 major keys according to Parncutt (1989)
and connected with lines for better visualization. The graphs show that
DDs and STs have an even higher pitch commonality with the directly
preceding dominant than tonic chords have. Pitch commonality values
were calculated for the 12 keys to illustrate the effect of transposition on
pitch commonality and to show that the pitch commonality ranges for the
three chord types tested do not overlap.
Data Recording and Analysis
The EEG was recorded from 27 electrodes of the 10–20 system
(FP1, FP2, F7, F3, FZ, F4, F8, FT7, FC3, FC4, FT8, T7, C3,
CZ, C4, T8, CP5, CP6, P7, P3, PZ, P4, P8, O1, O2, nose-tip, and
right mastoid), using an electrode placed on the left mastoid as
reference. Sampling rate was 250 Hz. After the measurement,
EEGdatawere re-referenced to the algebraicmean of the left and
right mastoid electrodes (to obtain a symmetric reference), and
filtered using a 0.25–25-Hz band-pass filter (1001 points, finite
impulse response) to reduce artifacts. Horizontal and vertical
electrooculograms (EOGs) were recorded bipolarly. For artifact
rejection, each sampling point was centered in a gliding window
and rejected if the standard deviation within the window ex-
ceeded a threshold value: Artifacts caused by drifts or body
movements were eliminated by rejecting sampling points when-
ever the standard deviation of a 200-ms or 800-ms gliding win-
dow exceeded 25 mV at any EEG electrode. Eye artifacts were
rejected whenever the standard deviation of a 200-ms gliding
window exceeded 25 mV at the vertical or the horizontal EOG
(rejections were controlled by the authors). ERPswere calculated
using a 200-ms prestimulus baseline.
For statistical analysis, mean amplitude values were comput-
ed for four regions of interest (ROIs; see also Figure 4C): left
anterior (F3, F7, FC3, FT7), right anterior (F4, F8, FC4, FT8),
left posterior (C3, T7, P3, P7), and right posterior (C4, T8, P4,
P8). To test if ERPs to regular and irregular chords differ from
each other and whether such differences are lateralized or differ
between anterior and posterior scalp regions, amplitude values
of ERPs were analyzed statistically by repeated measures
ANOVAs. ANOVAs were conducted with factors chord func-
tion (regular [tonic], irregular [DD]), hemisphere (left, right
ROIs), and anterior–posterior distribution (anterior, posterior
480 S. Koelsch et al.
irregular chords regular chords difference
B Experiment 1 (nose reference) C
A Experiment1
C3 Cz C4
P3 Pz P4M1
T7 T8M2
P7 P8
F3Fz
F4
FCzFC3 FC4
F7 F8
FT7 FT8
F7 F3 FZ F4 F8
FT7 FC3
5.0
0.5 1.0
sµV FC4 FT8
T7 C3 CZ C4 T8
P7 P3 PZ P4 P8
M1 FZ M2
ERANN5
P3a
P3b
−3.0
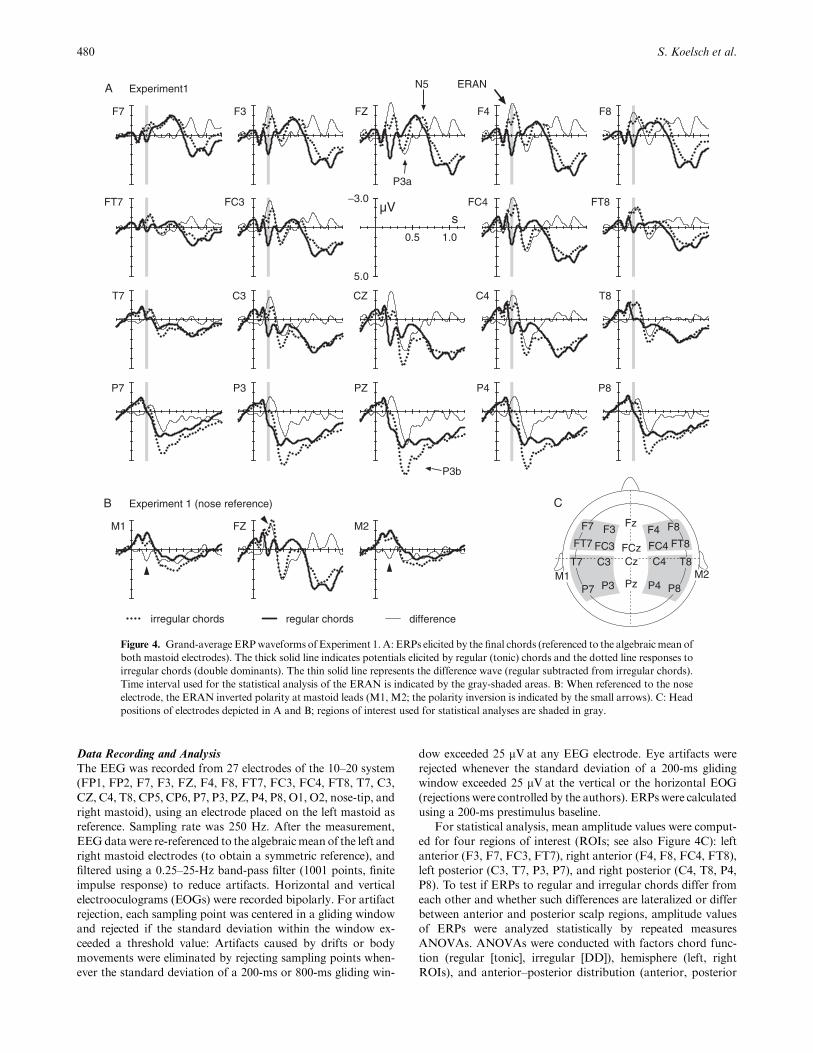
Figure 4. Grand-average ERPwaveforms of Experiment 1. A: ERPs elicited by the final chords (referenced to the algebraicmean of
both mastoid electrodes). The thick solid line indicates potentials elicited by regular (tonic) chords and the dotted line responses to
irregular chords (double dominants). The thin solid line represents the difference wave (regular subtracted from irregular chords).
Time interval used for the statistical analysis of the ERAN is indicated by the gray-shaded areas. B: When referenced to the nose
electrode, the ERAN inverted polarity at mastoid leads (M1, M2; the polarity inversion is indicated by the small arrows). C: Head
positions of electrodes depicted in A and B; regions of interest used for statistical analyses are shaded in gray.
ROIs). Although some ERPs will also be presented with nose
reference (to examine polarity inversion of potentials at mastoid
electrodes), all statistical analyses of ERPs were computed on the
data referenced to the algebraic mean of M1 and M2.
The time window for statistical analysis of the ERAN was
180–220 ms (this time window was centered around the
peak amplitude of the ERAN). To facilitate legibility of ERPs,
ERPs were low-pass filtered after statistical evaluation (10 Hz,
41 points, finite impulse response). Split analyses for
correctly and incorrectly classified trials will not be presented,
because some subjects had hit rates between 90% and 100%
(leading to a poor signal-to-noise ratio of ERPs of incorrectly
classified trials).
Results
On average, participants had 81% correct responses (SD5 12%,
range: 58–100%, 3% missed responses). A t test on the percent-
ages of correct responses indicated that participants performed
well above chance level (po.0001). Participants responded cor-
rectly to 85% of the regular chords and to 77% of the irregular
ones (a t test on the percentages of correct responses indicated
that the difference between regular and irregular chords was
marginally significant, po.06).
Figure 4 shows the electric brain responses to all harmon-
ically regular and irregular sequence endings. In comparison
to regular endings, irregular endings elicited an ERAN that
was maximal over fronto-midline electrodes and that had
slightly larger amplitude values over right- than over left-
hemisphere electrode sites. With nose reference, the ERAN
inverted polarity at mastoid leads at around 200 ms
(Figure 4B), indicating that this ERP effect is not an N2b
(the N2b has a central maximum, is not lateralized, and
does not invert polarity at mastoid sites; Naatanen, 1992;
Schroger, 1998).
An ANOVA with factors chord function (regular, irregular
ending), hemisphere, and anterior-posterior distribution for a
time interval from 180 to 220 ms revealed an effect of chord
function, F(1,19)5 20.49, po.0002, an interaction between
factors chord function and anterior-posterior distribution,
F(1,19)5 8.48, po.01, and an interaction between factors
chord function and hemisphere, F(1,19)5 6.13, po.05. When
ERPs were compared for each ROI separately, the highest
F value was indicated for the right anterior ROI, F(1,19)5 36.5,
whereas no significant difference was indicated for the left
posterior ROI.
The ERANwas followed (and partly overlapped) by an N2b-
P3 complex reflecting the detection of the harmonically irregular
chords and the decision to press the response button (e.g.,
Schroger, 1998). The N2b was maximal around 240 ms; the P3
peaked around 410 ms.
Previous studies had shown that, when the harmonically ir-
regular chords are task irrelevant, the ERAN is followed by a
negativity that is frontally predominant andmaximal around 500
ms after the onset of an irregular chord (the N5; Koelsch et al.,
2000; Koelsch, Schmidt, et al., 2002; Koelsch & Siebel, 2005; see
also General Discussion). However, when participants are asked
to respond to irregular chords (as in the present experiment), the
N5 potentials are usually mainly overlapped by a P3 (Koelsch
et al., 2000; Koelsch, Schroger, & Gunter, 2002). In the present
study, a small negative peak at frontal and fronto-central elec-
trodes was present around 650 ms that points to the presence of
an N5. The difference between the waveforms was statistically
not significant.3
Discussion
Behaviorally, participants correctly classified about 80%
of the sequence endings. Although these hit rates were
clearly above chance level, participants still judged more than
20% of the DDs incorrectly as regular. This indicates that
the DDs were perceived as rather subtle irregularities, and
that the participants, therefore, had difficulties in reliably de-
tecting them.
In the ERPs, the music-syntactically irregular DDs elicited an
ERAN that was maximal around 200 ms. The ERAN inverted
polarity at mastoid electrodes with nose reference (in accordance
with previous studies; Heinke et al., 2004; Koelsch, Heinke,
Sammler, & Olthoff, 2006) and had a slight right-hemispheric
weighting.
As described in the Introduction, the final DDs did not have a
lower pitch commonality with the preceding dominant chord
than the final tonic chords had. Thus, the elicitation of the
ERAN by the DDs cannot be due to a lower degree of pitch
commonality, indicating that the neural mechanisms underlying
the generation of the ERAN are capable of operating in the
absence of sensory dissonance.
Moreover, with respect to the first four chords, DDs
introduced one new pitch, whereas tonic chords introduced
two new pitches. Although those two pitches were perceptually
more similar to the first chord than the new pitch of a DD was,
the auditory modeling showed that DDs matched even
better than final tonic chords with the sensory memory traces
established by the first four chords. This rules out the possi-
bility that the ERAN effect observed was simply a frequency
MMN. This interpretation is corroborated by previous
data showing that an ERAN can be elicited by DDs even
if the out-of-key note of DDs occurs (one octave lower)
in the musical context directly preceding DDs (Koelsch, 2005).
However, it should be noted that DDs introduced an out-of-key
note and that DDs introduced a new chord function. These issues
will be addressed in Experiment 2.
It is interesting to note that participants were nonmusicians
who did not know concepts such as ‘‘tonic’’ or ‘‘double dom-
inant.’’ Nevertheless, they distinguished regular and irregular
chords clearly above chance level, and the music-syntactically
irregular chords elicited clear ERP effects. This supports previ-
ous findings that even nonmusicians have an (implicit) knowl-
edge of musical regularities and that nonmusicians have the
ability to process musical information according to this knowl-
edge (Koelsch et al., 2000; Koelsch & Siebel, 2005). Differences
between MMN and ERAN as well as between ERAN and lan-
guage-related brain functions will be considered in the General
Discussion.
Untangling syntactic and sensory processing 481
3We also performed a spatial principal component analysis (PCA) ofthe channel covariance matrix. This PCA clearly disentangled P3b andN5, corroborating the assumption that the DDs also elicited an N5. ThePCA indicated that the P3 had amaximal amplitude at 410ms and theN5at 640 ms (onset of the N5 was at around 400 ms). The PCA also showedthat the ERAN was maximal at 200 ms and the N2b maximal at 240 ms.For the sake of brevity, the details of the PCA are not presented in thisarticle.
EXPERIMENT 2
In Experiment 1, chords were task relevant (participants had to
differentiate between regular and irregular chords). One aim of
Experiment 2 was to investigate if the ERAN can be elicited even
when DDs are task irrelevant and participants are not informed
about the irregular chords. This question is relevant for three
reasons. First, ERPs reflecting processing ofmusical information
can be investigated without being overlapped by potentials that
emerge when irregular chords have to be detected (such as N2b
and P3). Second, task-irrelevant processing provides information
about the amount of attentional resources needed to activate the
neural processes underlying the generation of the ERAN: The
behavioral data of Experiment 1 indicated that DDs represented
only a subtle irregularity, and it was of interest if these subtle
irregularities elicit specific ERP effects even if participants do not
have a task regarding these chords. Third, because participants
did not have a task related to the regularity of chords (subjects
were not informed about the regularity of chords), Experiment 2
allowed us to test if an ERAN can also be elicited when no task-
related strategic processes are at work (that might emerge when
trying to detect the harmonic irregularities).
To investigate these issues, a block with sequences ending on
either DDs or tonic chords (as in Experiment 1) was presented
under the instruction to listen carefully to the timbre of the
chords, and to detect chords that were infrequently played with
an instrumental timbre other than the standard piano timbre
(e.g., marimba, guitar).
Another aim of Experiment 2 was to investigate if the ERAN
can also be elicited by an in-key chord function (i.e., by a chord
that belongs to the tonal key established by the previous har-
monic context). In Experiment 1, DDs did not belong to the
tonal key established by the preceding four chords (DDs intro-
duced one out-of-key note that was not contained in the four
chords preceding a DD), leaving open the possibility that an
ERAN can only be elicited by out-of-key chords. To investigate
this, Experiment 2 comprised another block in which DDs were
replaced by supertonics (STs; see Figures 1 and 2C).4 In major
keys, the ST is the (in-key) chord built on the second scale tone.
In the sequences used in the present experiments, this chord
function is regular when played, for example, at the third position
of the sequence (as in all sequences presented in Figure 2). In
contrast, STs are structurally irregular when presented at the fifth
position of the sequence after a dominant chord. Importantly,
STs are in-key chord functions, and can, thus, not be detected as
irregular by the occurrence of out-of-key notes.
As in the sequences ending on DDs, the modeling of the
acoustic congruency of the final STs with auditory sensory mem-
ory traces established by the first four chords (again using the
IPEM toolbox from Leman et al., 2005) showed that the pitch
images of the final STs correlated more highly than those of final
tonic chords with the pitch images established by the first four
chords (Figure 3A). That is, similarly to DDs, STs matched even
better than tonic chords with the information of the first four
chords stored in auditory sensory memory traces. Note
thatFunlike DDsFthe new pitch introduced by final STs was
presented in its lower octave in the third chord of the sequence.
That is, with respect to pitch repetition, final STs were more
similar to the preceding chords than both final tonics and DDs.
Moreover, chord sequences ending on STs were constructed
in a way that the pitch commonality between penultimate and
final chord was even higher for STs than for final tonic
chords (see Figure 3B; values were computed according to
Parncutt, 1989).
To control for the roughness of final chords (as calculated
according to Bigand, Parncutt, & Lerdahl, 1996), chord
sequences were composed such that the roughness of the
(minor) ST was comparable to the roughness of the directly
preceding dominant chord. For example, in the sequences pre-
sented in Figure 2, roughness values for chords one to four were
0.51 (tonic), 0.37 (subdominant), 0.44 (supertonic), and 0.37
(dominant). The value of the final ST (last chord of Figure 2C)
was 0.39, and the value of the final tonic (last chord of Figure 2A)
was 0.29 (value of the DD of Figure 2B was 0.26).5 That is,
with respect to (a) pitch commonality, (b) congruency with
auditory sensory memory traces, and (c) roughness, the
irregular STs were acoustically more similar to the preceding
chords than (regular) tonic chords were. In contrast to tonic
chords, STs were minor chords, but it is important to note
that final STs were not the only minor chords of the sequences:
All chords at the third position were also minor chords, leading
to a probability of 30% for the occurrence of such chords across
sequences.
Methods
Participants
Twenty-four people participated in the experiment (age range
20–28 years, mean 24.0 years, 12 women). None of them had
participated in Experiment 1. Participants had no or moderate
musical training: 16 participants were nonmusicians who had
never participated in extracurricular music lessons or perfor-
mances, 8 were amateur musicians (7 had learned an instrument
for 2–4 years, 1 had infrequently received instrumental lessons
for 11 years, mean: 3.88 years). All participants were right-
handed (lateralization quotient at least 90% according to the
Edinburgh Handedness Inventory; Oldfield, 1971), and reported
having normal hearing.
Stimuli
There were three types of sequences: A, B, and C (Figure 2A–C).
Sequence typesA andBwere identical to Experiment 1; sequence
type C was identical to sequence types A and B, except that the
final chord was a supertonic (instead of tonic or DD). In one
experimental block (DD block), only types A and B were pre-
sented (Figure 2E). In the other block (ST block), only types A
and C were used (Figure 2F). The order of the two blocks was
counterbalanced across subjects (half of the subjects was pre-
sented first with the block consisting of sequence types A and B;
the other half was presented first with types A and C). Ran-
domization and probability of final chords was identical to
Experiment 1.
Experiment 2 differed from Experiment 1 in three aspects: (a)
in 20%of the sequences, one chord of a sequencewas playedwith
an instrumental timbre other than piano (e.g., trumpet, organ,
violin; see also below), (b) in each block, 100 sequences were
presented, and (c) there was a 1200-ms silent period between
sequences (in Experiment 1, ERP effects lasted longer than the
482 S. Koelsch et al.
4A suptertonic (in major) is often also referred to as diatonic super-tonic.
5The roughness value of the initial tonic is different from the rough-ness value of the final tonic due to the different superposition of intervals.
presentation time of the last chord; thus a pause was inserted to
prevent the potentials elicited by the final chords being over-
lapped by those elicited by the following chord). Block duration
was approximately 8 min.
Procedure
Participants were not informed about the harmonically irregular
chords. The tasks were to detect the infrequently occurring
chords played with a deviant instrumental timbre and to indicate
the detection by pressing a response button. As examples, two
sequences were presented, one without and one with a chord
played on a deviant instrument. The deviant instruments were
only employed to control whether participants attended the tim-
bre of the stimulus (this method has already been used in pre-
vious studies; e.g., Koelsch et al., 2000). As in Experiment 1,
participants were instructed to look at a fixation cross during the
experimental session.
Data Recording and Analysis
Recording and analysis were identical to those in Experiment 1,
except that (a) the EEG was recorded with 40 electrodes (FP1,
FPZ, FP2, AF7, AF3, AFZ, AF4, AF8, F7, F5, F3, FZ, F4, F6,
F8, FT7, FC5, FC3, FCZ, FC4, FC6, FT8, T7, C3, CZ, C4, T8,
CP5, CP6, P7, P3, PZ, P4, P8, POZ, O1, O2, M1, M2, nose), (b)
an additional factor block (DD block � ST block) was comput-
ed within the ANOVAs, (c) parietal ROIs comprised the elec-
trodes P3, P7, CP3, TP7 (left posterior), and P4, P8, CP4, TP8
(right posterior), and (d) a longer time interval was used for the
statistical evaluation of the ERAN (this was possible because the
ERAN was not overlapped by N2b potentials), leading to a
higher reliability of the statistical analysis. Sequences with de-
viant instruments were excluded from further data analysis (their
ERPs will not be shown because only a few trials were used to
control for the participants’ behavior).
Results
Participants detected on average 96.0% of the deviant instru-
ments, indicating that participants attended to the timbre of the
musical stimulus, and that they did not have difficulties in re-
liably detecting the timbre deviants.
The ERP waveforms elicited by task-irrelevant DDs and STs
show an ERAN that was maximal at around 200 ms over an-
terior electrode sites. Amplitude values were slightly larger over
right- than over left-hemisphere leads (best seen in the difference
waves of Figure 5A, B). As in Experiment 1, the ERAN inverted
polarity at mastoid leads when potentials were referenced to the
nose electrode (Figure 5C, D). The amplitude of the ERAN did
not differ between blocks.
An ANOVA for the time interval of 180–260 ms with factors
chord function (regular, irregular), block (DD block, ST block),
hemisphere, and anterior–posterior distribution revealed an ef-
fect of chord function, F(1,23)5 17.13, po.0005, an interaction
between factors chord function and anterior-posterior distribu-
tion, F(1,23)5 8.44, po.01, and an interaction between factors
chord function and hemisphere, F(1,23)5 5.77, po. 05. The re-
ported interactions reflect that the ERAN had an anterior max-
imum with a slight right-hemispheric weighting. When ERPs
were compared for each ROI separately, the highest F value
was indicated for the right anteriorROI,F(1,23) 5 34.5, whereas
no significant difference was indicated for the left posterior
ROI (as in Experiment 1). The ANOVA did not indicate
an interaction between factors chord function and block
(p4.6), reflecting that the amplitude of the ERAN did not
differ between blocks.
In both blocks, the ERAN was followed by an N5 that had a
bilateral scalp distribution andwasmaximal around 500–550ms.
At parietal sites, a bilateral late positive component (LPC)
was maximal around 900 ms. ANOVAs with factors chord func-
tion, block, hemisphere, and anterior–posterior distribution,
conducted separately for time intervals from 450 to 650 ms (N5)
and from 500 to 1200 ms (LPC) revealed interactions between
factors chord function and anterior–posterior distribution
for both time windows (N5: F [1,23]5 13.54, po.002; LPC:
F [1,23]5 18.49, po.0005), reflecting that the N5 had a frontal,
and the LPC a parietal maximum (no interactions between
factors chord function and hemisphere were indicated, as
expected). A separate ANOVA for frontal ROIs with factors
chord function and block for the N5 time window indicated an
effect of chord function, F(1,23)5 5.35, po.05. Likewise, an
analogous ANOVA for parietal ROIs for the LPC time window
indicated an effect of chord function, F(1,23)5 7.87, po.01. No
interaction between factors chord function and block were in-
dicated in any of the ANOVAs, reflecting that the amplitudes of
N5 and LPC did not differ between blocks (N5: p4.3, LPC:
p4.7).
Because a previous study (Koelsch, Schmidt, et al., 2002)
reported that the ERAN is larger in musicians than in non-
musicians, a similar effect might be expected for a comparison
between amateur musicians and nonmusicians. Mean amplitude
values of the ERAN (regular subtracted from irregular chords)
were calculated separately for nonmusicians and amateur musi-
cians for the frontal regions of interest within the ERAN time
window used for statistical analyses (180–260 ms).
The mean ERAN amplitude value was significantly larger for
amateur musicians (mean: � 1.67 mV, SEM5 0.35) than for
nonmusicians (mean: � 0.92 mV, SEM5 0.28): An ANOVA
with factors chord function and group (amateur musicians, non-
musicians, time interval 180–260 ms) indicated an effect of chord
function, F(1,22)5 22.03, po.0001, and a two-way interaction,
F(1,22)5 6.44, po.05. The analogous ANOVA, conducted for
the data of nonmusicians only, indicated an effect of chord
function ( po.005), demonstrating that the presence of the
ERAN in the grand-average data was not simply due to the
subgroup of amateur musicians.
A comparison of the ERP data from the DD block and from
Experiment 1 (where DDs were to be detected) indicates that the
ERAN virtually did not differ between experiments. This holds
especially for potentials elicited at mastoid sites (where the N2b
only marginally overlaps with the ERAN; Figure 6A, B). An
ANOVA for frontal ROIs (180–220 ms time interval) with fac-
tors chord function and experiment (Experiment 1, DD block of
Experiment 2) indicated an effect of chord function,
F(1,42)5 45.56, po.0001, and no two-way interaction (p4.2).
Additionally, the analogous ANOVA conducted for mastoid
electrodes (referenced to the nose electrode) did not reveal an
interaction (p4.9).
Discussion
Both DDs and STs elicited an ERAN. No N2b-P3 complex was
elicited, reflecting that participants did not respond behaviorally
to the irregular chords. The presence of the ERAN indicates that
the neural processes underlying the generation of the ERAN
Untangling syntactic and sensory processing 483
484 S. Koelsch et al.
A Experiment 2, DD-block
B Experiment 2, ST-block
C Exp. 2, DD-block (nose reference)
D Exp. 2, ST-block (nose reference)
F3 Fz F4
P3 Pz P4
FCzFC3 FC4
F7 F8
FT7 FT8
M1 M2
P7 P8
CP4CP3 TP8TP7 CPz
E
F7 F3 FZ F4 F8
FT7 FC3
5.0
−3.0
−3.0
0.5 1.0s
µV FC4 FT8
TP7 CP3 CPZ CP4 TP8
P7 P3 PZ P4 P8
F7 F3 FZ F4 F8
FT7 FC3
5.0
0.5 1.0s
µV FC4 FT8
TP7 CP3 CPZ CP4 TP8
P7 P3 PZ P4 P8
irregular chords regular chords difference
M1 FZ M2
M1 FZ M2
ERAN
ERANN5
N5
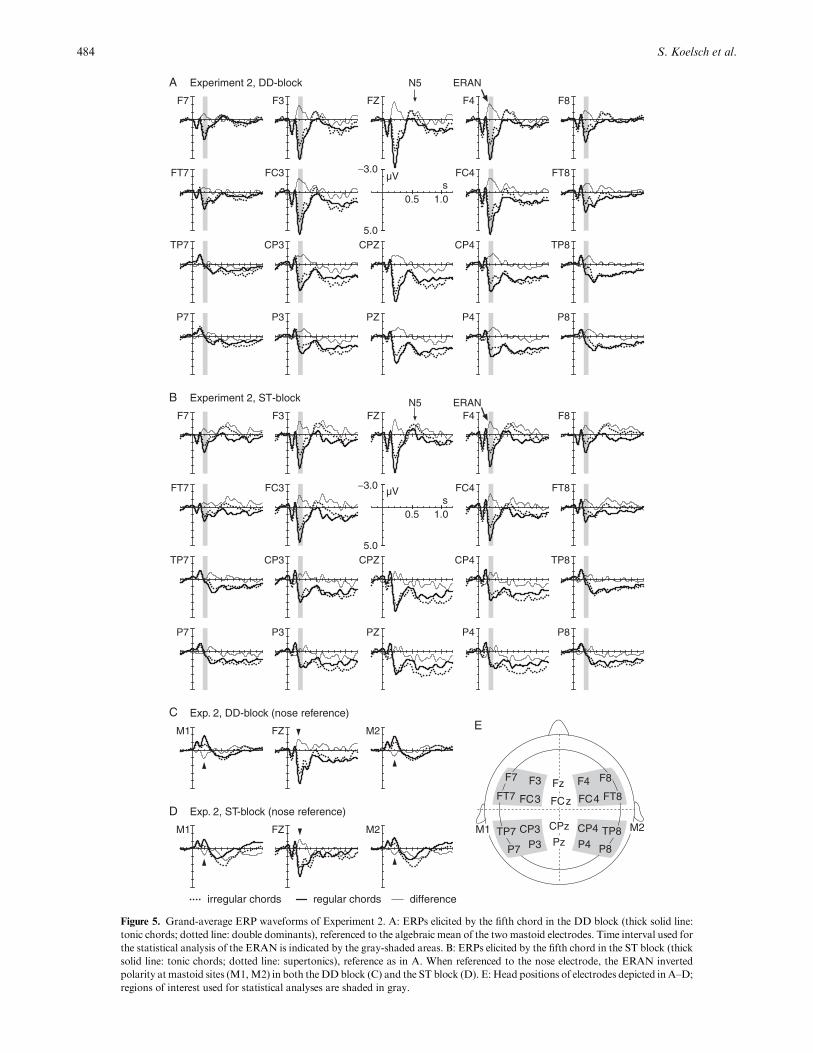
Figure 5. Grand-average ERP waveforms of Experiment 2. A: ERPs elicited by the fifth chord in the DD block (thick solid line:
tonic chords; dotted line: double dominants), referenced to the algebraic mean of the two mastoid electrodes. Time interval used for
the statistical analysis of the ERAN is indicated by the gray-shaded areas. B: ERPs elicited by the fifth chord in the ST block (thick
solid line: tonic chords; dotted line: supertonics), reference as in A. When referenced to the nose electrode, the ERAN inverted
polarity at mastoid sites (M1,M2) in both the DDblock (C) and the ST block (D). E: Head positions of electrodes depicted in A–D;
regions of interest used for statistical analyses are shaded in gray.
operate even when chords are not task relevant, consistent with
other studies in which an ERAN was elicited while participants
were reading a book (Koelsch, Schroger, et al., 2002), playing a
video game (Koelsch et al., 2001), or performing a reading com-
prehension task (Loui et al., 2005).
The ERAN elicited by DDs virtually did not differ between
experiments. The small difference at frontal sites appears to be
due to the overlap of ERAN and N2b in Experiment 1: When
using a nose reference, the ERAN potentials were identical for
both experiments at mastoid leads (where the N2b is only mar-
ginally observable). This result indicates that the amplitude of the
ERAN is not substantially influenced by the task relevancy of
chords (but see also General Discussion).
In contrast to DDs, all pitches of the STs, or their lower
octaves, had been presented by the chords preceding the STs.
Thus, the pitches of the final STs matched with the sensory
memory trace at least as well as the pitches of the final tonic
chords, and it is therefore not possible that STs were detected
simply based on a frequency-MMN mechanism. Note that, un-
like DDs, STs did not introduce a new chord function (chords at
the third position of the sequences were also STs). These results
additionally indicate that the ERAN can also be elicited by chord
functions that repeat a previous chord function of a harmonic
sequence (in other words, the ERAN can not only be elicited by
new chord functions). Moreover, STs were in-key chord func-
tions (i.e., all notes of the STs belonged to the tonal key estab-
lished by the chords preceding the STs). Results thus also show
that an ERAN can be elicited by in-key chords, that is, without
the presence of an out-of-key note, and in the absence of a tonal
irregularity.
As mentioned earlier, STs were minor chords (in contrast to
tonic chords, which were major chords). However, because final
STs were not the only minor chords of the sequences (chords at
the third position were also minor chords), the global probability
for the occurrence of a minor chord was 30%, which is too high
to elicit an MMN response (in auditory oddball paradigms,
deviants occurring with a probability of more than 20–25%
hardly elicit any deviance-related negativity; e.g., Schroger,
1998). Recent data from our laboratory (Koelsch, Jentschke, &
Sammler, 2007) moreover indicate that, in contrast to final STs,
the STs presented at the third position of the sequences (which
also occurred with a probability of 30%) do not elicit an ERAN.
The elicitation of the ERAN by final STs can thus not be due to
the probability of 30% for minor chords. Note that, with respect
to their roughness, STs were even more similar to the preceding
chords than tonic chords were, despite the fact that they
were minor chords (see Introduction). Hence, the generation of
the ERAN could not simply be due to any systematic difference
in roughness values between STs and the chords preceding
the STs.
The ERAN was followed by an N5 and by a late positive
component (LPC); these effects, as well as differences between
nonmusicians and amateur musicians, will be discussed in the
General Discussion.
EXPERIMENT 3
In Experiment 2, the musical syntax was task irrelevant (partic-
ipants detected the infrequently occurring deviant instrumental
timbres). Thus, no behavioral data were obtained that indexed
how well nonmusicians and amateur musicians are able to detect
the STs. To investigate this issue, a behavioral study was con-
ducted in which the musical stimulus used in Experiment 2 was
presented to nonmusicians and amateur musicians under the in-
struction to press one button for the regular sequence endings
and another button for the irregular ones. Because the ERAN
amplitude did not differ between STs and DDs in Experiment 2,
it was expected that the behavioral results would also not differ
between these two chord types.
Methods
Participants
Twenty-two people participated in the experiment (age range
21–26 years, mean 23.0 years, 10 women). None of the
Untangling syntactic and sensory processing 485
FZ CZ PZ
M1 FZ M2
5.0
−3.0
0.5 1.0
sµV
Experiment 1
Experiment 2 (DD-block)
B Exp. 1 vs. Exp. 2, DD-block (nose reference)
A .Experiment 1 vs Experiment 2, DD-block
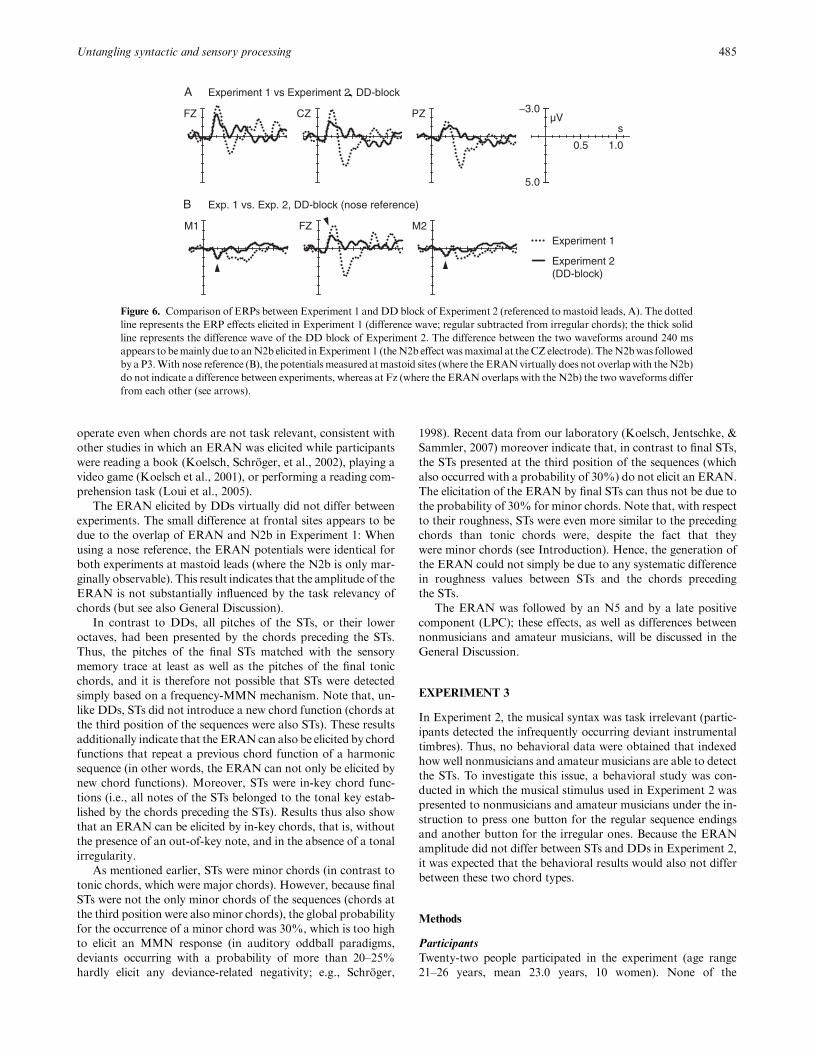
Figure 6. Comparison of ERPs between Experiment 1 and DD block of Experiment 2 (referenced to mastoid leads, A). The dotted
line represents the ERP effects elicited in Experiment 1 (difference wave; regular subtracted from irregular chords); the thick solid
line represents the difference wave of the DD block of Experiment 2. The difference between the two waveforms around 240 ms
appears to bemainly due to anN2b elicited inExperiment 1 (theN2b effectwasmaximal at theCZ electrode). TheN2bwas followed
by a P3.With nose reference (B), the potentials measured atmastoid sites (where the ERANvirtually does not overlapwith theN2b)
do not indicate a difference between experiments, whereas at Fz (where the ERAN overlaps with the N2b) the two waveforms differ
from each other (see arrows).
individuals had participated in Experiment 1 or 2. Sixteen par-
ticipants were nonmusicians (10 of them had never participated
in any extracurricular music lessons or performances, 6 of them
had less than 1 year of instrumental lessons), and 6 participants
were amateur musicians who had received instrumental lessons
for 1.5–8 years (mean 2.8 years). All participants were right-
handed (lateralization quotient at least 90% according to the
Edinburgh Handedness Inventory; Oldfield, 1971), and reported
having normal hearing.
Stimuli and Procedure
Stimulus material was identical to that of Experiment 2. As in
Experiment 2, the order of blocks (DD block and ST block) was
counterbalanced across subjects. In contrast to Experiment 2,
participants were informed about the harmonically irregular se-
quence endings. Before each of the two blocks, six sequenceswere
presented as examples, three ending on the (regular) tonic and
three ending on the (irregular) DD or ST. The task for both
experimental blocks was to press as fast as possible one button
for the regular sequence endings, and one for the irregular ones
(left–right buttons for regular and irregular endings were coun-
terbalanced across subjects). The instruction regarding which
button to press for the (ir)regular sequence endings remained on
a computer screen during the entire experimental session. If par-
ticipants did not press a button during the presentation of the last
chord, they were instructed via the computer monitor to respond
faster. Participants were asked to ignore the chords played with
deviant instrumental timbres. Sequences containing chords with
deviant instrumental timbres were excluded from further data
evaluation.
Results
Across both blocks, participants had on average 81% correct
responses (SD5 14, range: 58%–100%; there were less than 1%
missed responses in each block). Percentages of correct responses
virtually did not differ between blocks (DD block: 80%, ST
block: 81%). Participants detected the regular endings better
than the irregular endings (correct responses for tonic chords
in DD block: 91%, tonic chords in ST block: 90%, DDs: 71%,
STs: 72%).
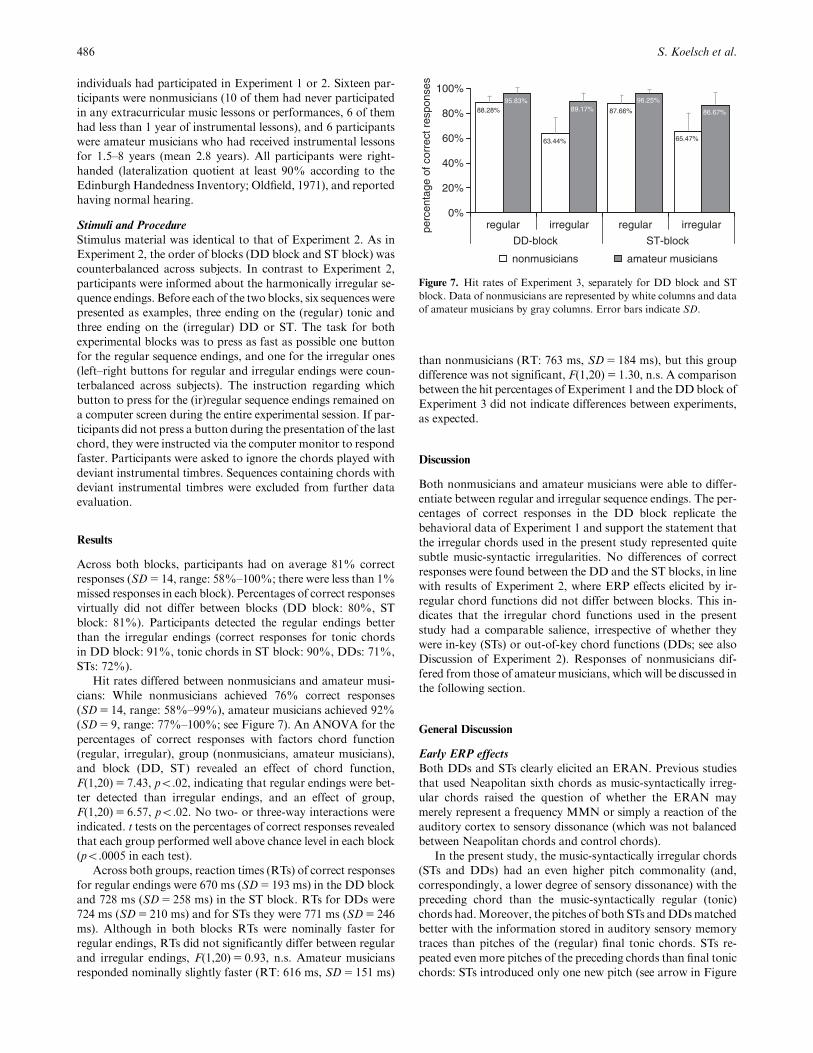
Hit rates differed between nonmusicians and amateur musi-
cians: While nonmusicians achieved 76% correct responses
(SD5 14, range: 58%–99%), amateur musicians achieved 92%
(SD5 9, range: 77%–100%; see Figure 7). An ANOVA for the
percentages of correct responses with factors chord function
(regular, irregular), group (nonmusicians, amateur musicians),
and block (DD, ST) revealed an effect of chord function,
F(1,20)5 7.43, po.02, indicating that regular endings were bet-
ter detected than irregular endings, and an effect of group,
F(1,20)5 6.57, po.02. No two- or three-way interactions were
indicated. t tests on the percentages of correct responses revealed
that each group performed well above chance level in each block
(po.0005 in each test).
Across both groups, reaction times (RTs) of correct responses
for regular endings were 670 ms (SD5 193 ms) in the DD block
and 728 ms (SD5 258 ms) in the ST block. RTs for DDs were
724 ms (SD5 210 ms) and for STs they were 771 ms (SD5 246
ms). Although in both blocks RTs were nominally faster for
regular endings, RTs did not significantly differ between regular
and irregular endings, F(1,20)5 0.93, n.s. Amateur musicians
responded nominally slightly faster (RT: 616 ms, SD5 151 ms)
than nonmusicians (RT: 763 ms, SD5 184 ms), but this group
difference was not significant, F(1,20)5 1.30, n.s. A comparison
between the hit percentages of Experiment 1 and theDDblock of
Experiment 3 did not indicate differences between experiments,
as expected.
Discussion
Both nonmusicians and amateur musicians were able to differ-
entiate between regular and irregular sequence endings. The per-
centages of correct responses in the DD block replicate the
behavioral data of Experiment 1 and support the statement that
the irregular chords used in the present study represented quite
subtle music-syntactic irregularities. No differences of correct
responses were found between the DD and the ST blocks, in line
with results of Experiment 2, where ERP effects elicited by ir-
regular chord functions did not differ between blocks. This in-
dicates that the irregular chord functions used in the present
study had a comparable salience, irrespective of whether they
were in-key (STs) or out-of-key chord functions (DDs; see also
Discussion of Experiment 2). Responses of nonmusicians dif-
fered from those of amateurmusicians, which will be discussed in
the following section.
General Discussion
Early ERP effects
Both DDs and STs clearly elicited an ERAN. Previous studies
that used Neapolitan sixth chords as music-syntactically irreg-
ular chords raised the question of whether the ERAN may
merely represent a frequency MMN or simply a reaction of the
auditory cortex to sensory dissonance (which was not balanced
between Neapolitan chords and control chords).
In the present study, the music-syntactically irregular chords
(STs and DDs) had an even higher pitch commonality (and,
correspondingly, a lower degree of sensory dissonance) with the
preceding chord than the music-syntactically regular (tonic)
chords had.Moreover, the pitches of both STs andDDsmatched
better with the information stored in auditory sensory memory
traces than pitches of the (regular) final tonic chords. STs re-
peated even more pitches of the preceding chords than final tonic
chords: STs introduced only one new pitch (see arrow in Figure
486 S. Koelsch et al.
0%
20%
40%
60%
80%
100%
regular irregular regular irregular
DD-block ST-block
perc
enta
ge o
f cor
rect
res
pons
es
nonmusicians amateur musicians
Figure 7. Hit rates of Experiment 3, separately for DD block and ST
block. Data of nonmusicians are represented by white columns and data
of amateur musicians by gray columns. Error bars indicate SD.
2C), whereas final tonics introduced two new pitches (indicated
by the two arrows in Figure 2A). Thus, it is not possible that STs
were detected as deviants simply based on a frequency-MMN
mechanism. DDs introduced only one new pitch (see arrow in
Figure 2B), but because this pitch was an out-of-key note that
was not contained in any of the previous chords, this new pitch
was perceptually less similar to pitches of the first chord than the
new pitches of final tonics (that were contained either one octave
lower or one octave higher in the first chord). However, this
octave relation of the two new pitches of final tonics was masked
by the second, third, and fourth chord, and a previous
study using an auditory oddball paradigm showed that frequen-
cy deviants separated from standard tones by one octave elicit
even larger MMN potentials than frequency deviants separated
from standards by a mistuned fourth (although the latter deviant
is perceptually less similar to standards than the former one;
Opitz, Rinne, Mecklinger, von Cramon, & Schroger, 2002,
p. 170). Our assumption that not only STs but also DDs
represented even smaller frequency deviants than final tonic
chords was clearly supported by the auditory modeling, which
showed that pitch images of both STs and DDs had a higher
congruency with the pitch images of auditory sensory memory
traces established by the preceding chords than pitch images of
final tonic chords.
Thus, whereas STs and DDs were music-syntactically irreg-
ular, they did not represent greater frequency deviants than
(music-syntactically regular) tonics, and they did not have a
lower pitch commonality with the preceding chord than final
tonics. Consequently, neither frequency deviance nor sensory
dissonance can account for the ERAN observed in Experiments
1 and 2. AlthoughDDs introduced an out-of-key note and a new
chord function within the sequence (unlike final tonics), STs
were matched with tonic chords in these respects (because STs
were also presented at the third position of each sequence). Thus,
the data of Experiment 2 also show that the ERAN can be elic-
ited by a chord function that had already been presented within
the preceding chord sequence.
Taken together, the present data allow us to exclude the
possibility that the ERAN elicited by DDs and STs is simply an
enhanced N1 related to the processing of sensory dissonance
or a frequency MMN elicited by the processing of frequency
deviants. The present results thus indicate that the neural
operations reflected in the ERAN are related to music-
syntactic processing. It remains to be determined, though,
whether the stimuli used in the present experiments contain
further acoustic cues (other than pitch commonality, pitch rep-
etition, and roughness) that could also elicit deviance-related
negative potentials.
Previous studies using behavioral measures showed harmonic
priming effects that were not based on previously activated sen-
sory memory traces but on higher order knowledge about mu-
sical structure (see Bharucha & Stoeckig, 1987; Bigand et al.,
2003; Tekman & Bharucha, 1998). It is likely that the very first
chords of each sequence activated representations of a tonal
schema that entails representations of the in-key tones of a scale
and a ‘‘hierarchy of stability’’ of chord functions (Bharucha &
Krumhansl, 1983). Such representations may exert top-down
influences on the processing of pitches on the level of auditory
sensory memory, but this possibility remains to be specified (no-
tably, recent data from our laboratory also showed an ERAN
response in sequences that did not begin with a tonic chord;
Koelsch, 2005).
In a previous study investigating ERP effects of harmonically
related chords (tonic chords) and harmonically less related
chords (subdominants), no ERAN was observed in response to
harmonically less related chords (Regnault et al., 2001). This
difference between studies is presumably due to differences in the
degree of irregularity: TheDDs and STs used in the present study
had a higher degree of music-syntactic irregularity than the sub-
dominant chords used in the study fromRegnault et al. Although
the subdominants used in the latter study were less regular than
tonic chords, the low degree of irregularity represented by those
subdominants was presumably too small to elicit a clear ERAN
(unpublished data fromour laboratory suggest that experimental
paradigms using considerably more trials, leading to a higher
SNR, reveal a small ERAN even to such subdominant chords
when subjects attend the stimuli).
Processing of Syntactic Information
Brain mechanisms that process sequential (auditory) informa-
tion according to complex, syntactic regularities are obviously
not only relevant for the processing of music, but also important
for the processing of language. A variety of studies showed that
processing of (syntactic) phrase-structure violations in language
may be reflected in an early left anterior negativity (ELAN;
Friederici, 2002). Interestingly, the ERAN strongly resembles
the ELAN: Both components have a similar time course, invert
polarity at mastoid leads with nose reference, rely on at least
partly the same generators, and are sensitive to the violation of an
expected structure (for overviews, see Koelsch, 2005; Koelsch &
Siebel, 2005). It appears that the mechanisms underlying the
generation of syntax-related mismatch negativities (such as
ERAN and ELAN) are not specific for auditorily presented in-
formation: Previous studies suggest that visually inducedmusical
expectancy violations may also elicit an ERAN (Gunter,
Schmidt, & Besson, 2003; Schon & Besson, 2005) and that the
ELAN can also be elicited with visually presented stimuli
(Gunter, Friederici, & Hahne, 1999).
Interactions between music-syntactic and language-syntactic
processing have also been shown in a recent study (Koelsch,
Gunter, Wittfoth, & Sammler, 2005) in which the ERAN, but
not the (frequency) MMN, interacted with the left anterior neg-
ativity (LAN; the LAN was elicited by morpho-syntactic viola-
tions). This finding suggests that the ERAN consumes neural
resources related to syntactic processing (as evidenced by the
interaction with the LAN), whereas the frequency MMN does
not appear to consume such resources.
Automaticity of the ERAN
The comparison of Experiments 1 and 2 suggests that the ERAN
can be elicited under both task-relevant and task-irrelevant con-
ditions, even when music-syntactic irregularities are only subtle.
This finding is consistent with previous studies showing that the
ERAN can be evoked when subjects read a book (Koelsch,
Schroger, et al., 2002), play a video game (Koelsch et al., 2001),
or perform a reading comprehension task (Loui et al., 2005).
However, the recent study from Loui et al. showed that the
mechanisms underlying the generation of the ERAN can be in-
fluenced by attention, especially when attention is strongly cap-
tured by competing tasks.
Lateralization of the ERAN
The lateralization of the ERAN was only weak in the present
study and even absent in some previous studies investigating
Untangling syntactic and sensory processing 487
music-syntactic processing with the ERAN (Loui et al., 2005;
Steinbeis et al., 2006). Likewise, some recent data from our own
laboratory do not show a pronounced lateralization of the
ERAN, and a previous study suggested differences in lateral-
ization betweenmales and females (Koelsch,Maess,Grossmann,
& Friederici, 2003). Our current notion is that the lateralization
of the ERAN becomes weaker when musical irregularities
become less salient, but this issue needs further investigation.
Because the term ERAN falls short as a descriptor for an effect
that is not lateralized, Loui et al. simply termed the effect EAN
instead of ERAN. However, for the time being, we prefer the
term ERAN, because some previous literature has established
this term as a label for its functional significance, rather than for
its scalp topography.
Late ERP Effects
In Experiment 2, the ERANwas followed by an N5 that showed
a bilateral scalp distribution and was maximal around 500–550
ms. It appears that an N5 was also elicited in Experiment 1, but
overlapped by a P3. As mentioned in the Introduction, the N5 is
taken to reflect processes of harmonic integration: The first four
chords of the sequences built up a harmonic context toward the
end of the sequence. The harmonic context buildup has been
shown to correlate with an amplitude decrease of the N5 elicited
by in-key chords (Koelsch et al., 2000). Regular final chords can
easily be integrated into the established musical context, whereas
irregular chords require a larger amount of harmonic integration
(because they do not easily fit into the harmonic fabric estab-
lished by the first four chords), presumably leading to a larger
amplitude of the N5. The processes of harmonic integration ap-
pear to resemble processes of semantic integration during the
perception of language (reflected in the N400; e.g., Kutas &
Federmeier, 2000) and might at least partly reflect processing of
musical meaning (irregular chord functions and deceptive ca-
dences are prominent elements of major–minor tonal music that
are used by composers as a means of expression; Koelsch et al.,
2004; Koelsch & Siebel, 2005). The exact relation between N5
and processing of musical meaning, however, remains to be
specified.
In Experiment 2, irregular chords also elicited a late positive
component (LPC; e.g., Besson & Faita, 1995; Patel et al., 1998).
This finding was unexpected, because the harmonies were task
irrelevant, and other studies with an experimental design similar
to that of Experiment 2 did not show an LPC (Koelsch et al.,
2000, 2001; Koelsch, Schroger, et al., 2002). Previous studies of
musical perception using the LPC suggest that the LPC reflects
processes of structural integration and possibly processes of
structural repair (Besson& Schon, 2001; Koelsch& Siebel, 2005;
Patel et al., 1998). These processes usually follow the detection of
a structural irregularity, and they seem to be most pronounced
when participants have a task connected to the irregular chords
(similarly to the P600; Patel et al., 1998). That is, whereas the N5
is probably related to the processing of meaning information, the
LPC might reflect processes related to structural integration and
repair (Koelsch & Siebel, 2005).
Effects of Musical Training
In Experiment 2, the ERAN amplitude elicited in amateur mu-
sicians was slightly larger than the ERAN of nonmusicians (no
amateur musicians were investigated in Experiment 1). In Ex-
periment 3, amateur musicians classified the sequence endings
with significantly higher accuracy than nonmusicians, corrobo-
rating results of Experiment 2. These results are in line with a
previous ERP study showing that musical training influences
processes of music-syntactic analysis (Koelsch, Schmidt, et al.,
2002). In that study, the ERAN was larger in musicians than in
nonmusicians. The present results show that small differences
can already be observed between nonmusicians and amateur
musicians. It is likely that musical training leads to more specific
representations of musical regularities and, thus, to a better dif-
ferentiation between regular and irregular musical events. Im-
portantly, the ERAN elicited in Experiment 2 was significant
when analyzing the data of nonmusicians only, ruling out the
possibility that effects were simply due to the subgroup of am-
ateur musicians.
It is interesting to note that effects were elicited in nonmu-
sicians by quite subtle musical irregularities, supporting the no-
tion that even nonmusicians have a sophisticated representation
of musical regularities (e.g., Bigand, Madurell, Tillmann, & Pin-
eau, 1999; Bigand & Pineau, 1997; Koelsch et al., 2000) and that
they process musical information fast and quite automatic ac-
cording to these representations. Nonmusicians most presum-
ably acquire implicit knowledge about musical regularities by
listening to music in everyday life (Koelsch & Siebel, 2005;
Tillmann et al., 2000).
Conclusions
The present results show that the ERAN is not simply an ERP
effect elicited by the processing of acoustical features such as
pitch commonality and roughness and that the generation of the
ERAN does not result from differences in pitch repetition be-
tween regular and irregular chords.
This is of particular importance because inmajor–minor tonal
music, syntactic regularities on the one hand and acoustic factors
on the other are closely intertwined (music-syntactically irregular
chords usually also being acoustically deviant). For an adequate
understanding of the neural correlates of music perception, it is,
thus, relevant to determine which neural processes are due to
acoustic factors andwhich are due tomusic-syntactic processing.
Previous studies have shown that acoustic factors (such as pitch,
timbre, intensity, and roughness) modulate earlier ERP
components (especially P1 and N1) and that automatic change
detection of acoustic factors is reflected in the MMN (for ref-
erences, see Koelsch & Siebel, 2005). Our data show that music-
syntactic irregularities elicit an ERAN, even in the absence of
acoustic factors that would otherwise lead to modulation of P1
and N1 potentials, or to the elicitation of a ‘‘classical’’ MMN.
Because acoustical factors weremore thoroughly controlled than
in some previous ERP studies, the present study represents a step
toward untangling music-syntactic and sensory processing of
harmonies.
Experiments 1 and 3 showed that even nonmusicians can de-
tect the irregular chords used in the present study well above
chance level. These chords were not very salient for nonmusi-
cians, as indicated by a hit rate of only around 75% for the
irregular chords. Nevertheless, these chords elicited reliable ef-
fects in the ERPs. The difference in behavioral discrimination
performance, as well as in the ERAN amplitude between am-
ateur musicians and nonmusicians, supports the notion that the
ERAN is sensitive to long-term (musical) training. These results
also show that even moderate musical training can lead to
changes in the neural mechanisms underlying music-syntactic
488 S. Koelsch et al.
processing. Because effects were also elicited in subjects without
formal musical training, the present findings underscore the no-
tion that the ability to acquire knowledge about complex musical
regularities and the ability to process musical information quick-
ly and automatically according to this knowledge are general
abilities of the human brain.
REFERENCES
Besson, M., & Faita, F. (1995). An event-related potential (ERP) studyof musical expectancy: Comparison of musicians with nonmusicians.Journal of Experimental Psychology. Human Perception and Perfor-mance, 21, 1278–1296.
Besson, M., & Schon, D. (2001). Comparison between Languageand Music. In R. J. Zatorre & I. Peretz (Eds.), The biologicalfoundations of music (Annals of the New York Academy of Sciences,Vol. 930, pp. 232–258). New York: The New York Academy ofSciences.
Bharucha, J., & Krumhansl, C. (1983). The representation of harmonicstructure in music: Hierarchies of stability as a function of context.Cognition, 13, 63–102.
Bharucha, J., & Stoeckig, K. (1987). Priming of chords: Spreading ac-tivation or overlapping frequency spectra? Perception and Psycho-physics, 41, 519–524.
Bigand, E., Madurell, F., Tillmann, B., & Pineau, M. (1999). Effect ofglobal structure and temporal organization on chord processing.Journal of Experimental Psychology. Human Perception and Perfor-mance, 25, 184–197.
Bigand, E., Parncutt, R., & Lerdahl, J. (1996). Perception of musicaltension in short chord sequences: The influence of harmonic function,sensory dissonance, horizontal motion, and musical training. Per-ception and Psychophysics, 58, 125–141.
Bigand, E., & Pineau, M. (1997). Global context effects on musical ex-pectancy. Perception and Psychophysics, 59, 1098–1107.
Bigand, E., Poulin, B., Tillmann, B., Madurell, F., & D’Adamo, D. A.(2003). Sensory versus cognitive components in harmonic priming.Journal of Experimental Psychology. Human Perception and Perfor-mance, 29, 159–171.
Bigand, E., Tillmann, B., Poulin, B., D’Adamo, D. A., & Madurell, F.(2001). The effect of harmonic context on phoneme monitoring invocal music. Cognition, 81, B11–B20.
Friederici, A. D. (2002). Towards a neural basis of auditory sentenceprocessing. Trends in Cognitive Science, 6, 78–84.
Gunter, T. C., Friederici, A. D., & Hahne, A. (1999). Brain responsesduring sentence reading: Visual input affects central processes. Ne-uroReport, 10, 3175–3178.
Gunter, T. C., Schmidt, B. H., & Besson,M. (2003). Let’s face the music:A behavioral and electrophysiological exploration of score reading.Psychophysiology, 40, 742–751.
Heinke, W., Kenntner, R., Gunter, T. C., Sammler, D., Olthoff, D., &Koelsch, S. (2004). Differential effects of increasing propofol sedationon frontal and temporal cortices: An ERP study.Anesthesiology, 100,617–625.
Janata, P. (1995). ERPmeasures assay the degree of expectancy violationof harmonic contexts in music. Journal of Cognitive Neuroscience, 7,153–164.
Janata, P., & Grafton, S. T. (2003). Swinging in the brain: Shared neuralsubstrates for behaviors related to sequencing and music. Nature Ne-uroscience, 6, 682–687.
Janata, P., Tillmann, B., & Bharucha, J. (2002). Listening to polyphonicmusic recruits domain-general attention and working memorycircuits.Cognitive, Affective and Behavioral Neuroscience, 2, 121–140.
Knoesche, T., Neuhaus, C., Haueisen, J., Alter, K., Maess, B., & Witte,O. W. (2005). Perception of phrase structure in music. Human BrainMapping, 24, 259–273.
Koelsch, S. (2005). Neural substrates of processing syntax and semanticsin music. Current Opinion in Neurobiology, 15, 1–6.
Koelsch, S., Gunter, T. C., Friederici, A. D., & Schroger, E. (2000).Brain indices of music processing: ‘‘Non-musicians’’ are musical.Journal of Cognitive Neuroscience, 12, 520–541.
Koelsch, S., Gunter, T. C., Schroger, E., Tervaniemi,M., Sammler,D., &Friederici, A. D. (2001). Differentiating ERANandMMN:An ERP-study. NeuroReport, 12, 1385–1389.
Koelsch, S., Gunter, T. C., Wittfoth, M., & Sammler, D. (2005). Inter-action between syntax processing in language and in music: An ERPStudy. Journal of Cognitive Neuroscience, 17, 1565–1579.
Koelsch, S., Heinke, W., Sammler, D., & Olthoff, D. (2006).Auditory processing during deep propofol sedation andrecovery from unconsciousness. Clinical Neurophysiology, 117, 1746–1759.
Koelsch, S., Jentschke, S., & Sammler, D. (2007) Short-term effects ofprocessing musical syntax. Manuscript submitted for publication.
Koelsch, S., Kasper, E., Sammler, D., Schulze, K., Gunter, T. C., &Friederici, A. D. (2004). Music, language, and meaning: Brainsignatures of semantic processing. Nature Neuroscience, 7, 302–307.
Koelsch, S., Maess, B., Grossmann, T., & Friederici, A. D. (2003).Electric brain responses reveal gender differences in music processing.NeuroReport, 14, 709–713.
Koelsch, S., & Mulder, J. (2002). Electric brain responses to inappro-priate harmonies during listening to expressive music. Clinical Ne-urophysiology, 113, 862–869.
Koelsch, S., Schmidt, B. H., & Kansok, J. (2002). Influences of musicalexpertise on the ERAN: An ERP-study. Psychophysiology, 39,657–663.
Koelsch, S., Schroger, E., & Gunter, T. C. (2002). Music matters:Preattentive musicality of the human brain. Psychophysiology, 39,1–11.
Koelsch, S., & Siebel, W. (2005). Towards a neural basis of music per-ception. Trends in Cognitive Science, 9, 578–584.
Kutas, M., & Federmeier, K. (2000). Electrophysiology reveals semanticmemory use in language comprehension. Trends in Cognitive Science,4, 463–470.
Leman, M. (2000). An auditory model of the role of short-term memoryin probe-tone ratings. Music Perception, 17, 481–509.
Leman, M., Lesaffre, M., & Tanghe, K. (2005). IPEM toolbox for per-ception-based music analysis (version 1.02). Available at: http://www.ipem.ugent.be/Toolbox/index.html.
Loui, P., Grent-’t Jong, T., Torpey, D., &Woldorff,M. (2005). Effects ofattention on the neural processing of harmonic syntax in Westernmusic. Cognitive Brain Research, 25, 589–998.
Maess, B., Koelsch, S., Gunter, T. C., & Friederici, A. D. (2001). ‘‘Mu-sical syntax’’ is processed in the area of Broca: An MEG study.Nature Neuroscience, 4, 540–545.
Naatanen, R. (1992). Attention and brain function. Hillsdale, NJ:Erlbaum.
Neuhaus, C., Knosche, T., & Friederici, A. (2006). Effects of musicalexpertise and boundary markers on phrase perception in music. Jour-nal of Cognitive Neuroscience, 18, 472–493.
Oldfield, R. C. (1971). The assessment and analysis of handedness: TheEdinburgh Inventory. Neuropsychology, 9, 97–113.
Opitz, B., Rinne, T., Mecklinger, A., von Cramon, D. Y., & Schroger, E.(2002). Differential contribution of frontal and temporal cortices toauditory chenage detection: fMRI and ERP results. NeuroImage, 15,167–174.
Parncutt, R. (1989). Harmony: A psychoacoustical approach. Berlin:Springer.
Patel, A. D. (2003). Language, music, syntax and the brain. Nature Ne-uroscience, 6, 674–681.
Patel, A. D., Gibson, E., Ratner, J., Besson, M., & Holcomb, P. (1998).Processing syntactic relations in language and music: An event-related potential study. Journal of Cognitive Neuroscience, 10,717–733.
Piston, W. (1948/1987). Harmony. New York: Norton.Regnault, P., Bigand, E., & Besson, M. (2001). Different brain mech-
anisms mediate sensitivity to sensory consonance and harmonic con-text: Evidence fromauditory event-related brain potentials. Journal ofCognitive Neuroscience, 13, 241–255.
Riemann, H. (1877/1971). Musikalische Syntaxis: Grundriss einer harm-onischen Satzbildungslehre. Niederwalluf: Sandig.
Schon, D., & Besson,M. (2005). Visually induced auditory expectancy inmusic reading: A behavioural and electrophysiological study. Journalof Cognitive Neuroscience, 17, 694–705.
Untangling syntactic and sensory processing 489

Schonberg, A. (1969). Structural functions of harmony (rev. ed). NewYork: Norton.
Schroger, E. (1998). Measurement and interpretation of the mismatchnegativity (MMN). Behavior Research Methods, Instruments, andComputers, 30, 131–145.
Steinbeis, N., Koelsch, S., & Sloboda, J. (2006). The role of harmonicexpectancy violations in musical emotions: Evidence from subjective,physiological, and neural responses. Journal of Cognitive Neurosci-ence, 18, 1380–1393.
Tekman, H. G., & Bharucha, J. J. (1998). Implicit knowledge versuspsychoacoustic similarity in priming of chords. Journal of Experi-mental Psychology. Human Perception and Performance, 24, 252–260.
Tillmann, B., Bharucha, J., & Bigand, E. (2000). Implicit learning ofTonality: A Self-Organized Approach. Psychological Review, 107,885–913.
(Received August 11, 2006; Accepted January 2, 2007)
490 S. Koelsch et al.


![Université - home [Music Representations Team]repmus.ircam.fr/_media/moreno/flyer_cycle-musique_antony.pdfFrançois MADURELL, musicologue, professeur à l’Université Paris-Sorbonne](https://static.fdocuments.net/doc/165x107/5b2b50847f8b9afc358b7579/universite-home-music-representations-team-ois-madurell-musicologue-professeur.jpg)