Unsettled Issues in the Rise of American Inequality
37
Unsettled Issues in Unsettled Issues in the Rise of American the Rise of American Inequality Inequality Robert J. Gordon and Ian Dew- Robert J. Gordon and Ian Dew- Becker Becker Presented at Brookings Panel, Presented at Brookings Panel, September 7, 2007 September 7, 2007
-
Upload
jacob-byers -
Category
Documents
-
view
52 -
download
1
description
Unsettled Issues in the Rise of American Inequality. Robert J. Gordon and Ian Dew-Becker Presented at Brookings Panel, September 7, 2007. Survey Paper on Rising Inequality in the U. S. - PowerPoint PPT Presentation
Transcript of Unsettled Issues in the Rise of American Inequality

Unsettled Issues in the Unsettled Issues in the Rise of American Rise of American
InequalityInequality
Robert J. Gordon and Ian Dew-Becker Robert J. Gordon and Ian Dew-Becker
Presented at Brookings Panel,Presented at Brookings Panel,September 7, 2007September 7, 2007

22
Survey Paper on Rising Survey Paper on Rising Inequality in the U. S.Inequality in the U. S. Comprehensive Scope: Labor’s Share, Comprehensive Scope: Labor’s Share,
Inequality at the bottom, at the top, Inequality at the bottom, at the top, consumption inequality, and consumption inequality, and international differencesinternational differences
Overlaps the territory of Autor-Katz Overlaps the territory of Autor-Katz about the bottom and Piketty-Saez about about the bottom and Piketty-Saez about the topthe top
Excluded: college wage premium, Excluded: college wage premium, transmission of inequality through race, transmission of inequality through race, gender, inherited human capitalgender, inherited human capital
33
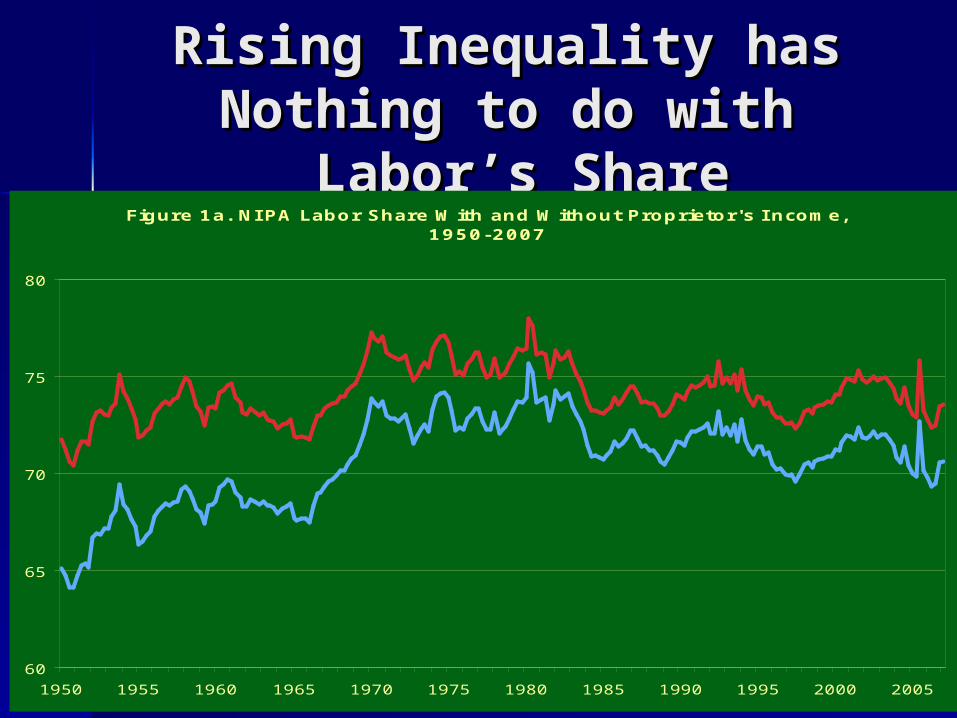
Rising Inequality hasRising Inequality hasNothing to do withNothing to do with
Labor’s Share Labor’s ShareFigure 1a. NI PA Labor Share With and Without Proprietor's I ncome,
1950-2007
60
65
70
75
80
1950 1955 1960 1965 1970 1975 1980 1985 1990 1995 2000 2005
Compensation
Compensation with Labor Component of Proprietor's Income

44
Lack of Connection Lack of Connection betweenbetweenLabor’s Share and Labor’s Share and InequalityInequality Incomes were much more equal in Incomes were much more equal in
1950s but labor’s share was the same 1950s but labor’s share was the same (or lower for the narrow measure)(or lower for the narrow measure)
Much of the rise in inequality > 90Much of the rise in inequality > 90thth percentile occurs in labor income, not percentile occurs in labor income, not capital incomecapital income
The main story is increased skewness The main story is increased skewness within labor income, not a shift from within labor income, not a shift from labor to capital incomelabor to capital income

55
The Bottom vs. the The Bottom vs. the TopTop
CPS conventionally used to study CPS conventionally used to study “bottom 90” but top-coding makes “bottom 90” but top-coding makes it useless to look inside the top it useless to look inside the top 10%10%
IRS tax data is oversampled at the IRS tax data is oversampled at the top, allows distinction between top top, allows distinction between top 1%, 0.1%, 0.01%1%, 0.1%, 0.01%
We use both to assess hypothesesWe use both to assess hypotheses Let’s look first at the bottom 90Let’s look first at the bottom 90
66
Point of Departure:Point of Departure:Goldin-Margo Goldin-Margo
“Great Compression”“Great Compression” Path of inequality U-shapedPath of inequality U-shaped
– High before 1930High before 1930– Low 1940-1970Low 1940-1970– Rising after 1970 back to 1920s levelsRising after 1970 back to 1920s levels
Three factors compressed and reversedThree factors compressed and reversed– Rise and fall of unions (decline fast 1980-86)Rise and fall of unions (decline fast 1980-86)– Fall and rise of importsFall and rise of imports– Fall and rise of immigrationFall and rise of immigration
Fourth factor prominent in literature, Fourth factor prominent in literature, decline in real minimum wage, esp. decline in real minimum wage, esp. 1980-861980-86

77
CPS Ratios for Men, CPS Ratios for Men, 1973-20051973-2005
Figure 3. CPS Income Ratios by Percentile for Men Only
-10
0
10
20
30
40
50
1973 1978 1983 1988 1993 1998 2003
Perc
en
t lo
g i
nd
ex,
1979=
0
50-10
90-50
90-10

88
CPS Ratios for Women,CPS Ratios for Women,1973-20051973-2005
Figure 4. CPS Income Ratios by Percentile for Women Only
-10
0
10
20
30
40
50
1973 1978 1983 1988 1993 1998 2003
Perc
en
t lo
g i
nd
ex,
1979=
0
50-10
90-50
90-10
99
Summary of Summary of DifferencesDifferences
90-50 ratio rises steadily, reaches +25 90-50 ratio rises steadily, reaches +25 percent for men, +21 percent for percent for men, +21 percent for womenwomen
50-10 ratio behaves very differently50-10 ratio behaves very differently– Both rise 1980-88Both rise 1980-88– Men rises 1979-86 to +11, then declines Men rises 1979-86 to +11, then declines
back to 1979 levelback to 1979 level– Women rises 1979-88 to +26, Women rises 1979-88 to +26, still at +24 still at +24
in 2005in 2005

1010
ExplanationsExplanationsin the Literaturein the Literature
Decline in unionization mainly impacts Decline in unionization mainly impacts men, explains no more than 15% of men, explains no more than 15% of increased inequalityincreased inequality– Affects 50Affects 50thth percentile more than 10 percentile more than 10thth
percentile, timing wrong in early 1980spercentile, timing wrong in early 1980s Imports, little research or evidenceImports, little research or evidence Immigration, contentious literatureImmigration, contentious literature
– Minimal effect on native Americans on averageMinimal effect on native Americans on average– Bigger effect on college drop-outsBigger effect on college drop-outs– Perhaps biggest effect on previous cohorts of Perhaps biggest effect on previous cohorts of
immigrants who cluster in particular immigrants who cluster in particular occupationsoccupations
1111
Closest Match of Closest Match of Hypothesis with Data: Hypothesis with Data:
Real Minimum WageReal Minimum Wage Twice as many women as men are Twice as many women as men are
paid the minimum wagepaid the minimum wage Sharp increase 50-10 ratio for women Sharp increase 50-10 ratio for women
in 1980-88 coincides with timing of in 1980-88 coincides with timing of drop in real minimum wagedrop in real minimum wage
Problem: Real min wage increased Problem: Real min wage increased from $5.10 in 1989 to $6.25 in 1997, from $5.10 in 1989 to $6.25 in 1997, then back to $5.15 in 2005then back to $5.15 in 2005
But no response of 50-10 ratio for But no response of 50-10 ratio for women, which was stable 1988-2005women, which was stable 1988-2005

1212
Increased Inequality Increased Inequality vs. Earnings Mobilityvs. Earnings Mobility
We were properly chastised by LK for using We were properly chastised by LK for using the term “labor mobility” when we should the term “labor mobility” when we should have used “earnings mobility”have used “earnings mobility”
Labor economists like Katz use “labor Labor economists like Katz use “labor mobility” to describe people moving from mobility” to describe people moving from Michigan to Texas in 1982Michigan to Texas in 1982
If there were constant churning, with people If there were constant churning, with people moving from bottom to top and vice versa, moving from bottom to top and vice versa, rising earnings inequality would not be a rising earnings inequality would not be a concernconcern
But literature on earnings mobility shows no But literature on earnings mobility shows no increase in mobility, if anything a decreaseincrease in mobility, if anything a decrease

1313
Stylized Facts onStylized Facts onEarnings MobilityEarnings Mobility
Over a decade, roughly 3% move from Over a decade, roughly 3% move from bottom quintile to top or v.v.bottom quintile to top or v.v.
Over a decade, roughly 50% of people Over a decade, roughly 50% of people stay in bottom quintile or top quintilestay in bottom quintile or top quintile
Churning is limited to the middle three Churning is limited to the middle three quintiles, income percentiles 20 to 80quintiles, income percentiles 20 to 80
Another study over a decade: the top Another study over a decade: the top 1% come 35% from the top 1% ten 1% come 35% from the top 1% ten years earlier, 35% from 95-99, and years earlier, 35% from 95-99, and only 10% from 0-80.only 10% from 0-80.

1414
IntergenerationalIntergenerationalMobilityMobility
Stark Racial DifferenceStark Racial Difference Born into the bottom 20%, what is Born into the bottom 20%, what is
your chance of being in the bottom your chance of being in the bottom 20% as an adult?20% as an adult?– For whites, 17%For whites, 17%– For blacks, 42%For blacks, 42%
No change in mobility over time to No change in mobility over time to offset the observed increases of offset the observed increases of inequality at the bottom and at the topinequality at the bottom and at the top

1515
Skill-biased Skill-biased Technical ChangeTechnical Change
Matters at the bottom and the topMatters at the bottom and the top Steady increase of 90-50 ratio for both Steady increase of 90-50 ratio for both
men and women consistent with SBTCmen and women consistent with SBTC Originally developed as a two-Originally developed as a two-
dimensional processdimensional process– Skilled vs. UnskilledSkilled vs. Unskilled– Increased supply of Skilled, but increased Increased supply of Skilled, but increased
relative wagerelative wage– Therefore must have been a biased Therefore must have been a biased
increase in the demand for the skilledincrease in the demand for the skilled
1616
Problem with the Problem with the Two-Dimensional Two-Dimensional version of SBTCversion of SBTC
It does not match the It does not match the occupational distribution of wage occupational distribution of wage increasesincreases
Real earnings increases in 1979-Real earnings increases in 1979-97 for engineers and computer 97 for engineers and computer programmers were negligibleprogrammers were negligible
Fully half of increase 1979-97 of Fully half of increase 1979-97 of college wage premium due to one college wage premium due to one occupational group, “managers”occupational group, “managers”

1717
More Subtle VersionsMore Subtle Versionsof SBTC Have Emergedof SBTC Have Emerged
A-K-K 2005 a five-dimensional division A-K-K 2005 a five-dimensional division of skillsof skills
A-K-K 2006 a three-dimensional split, A-K-K 2006 a three-dimensional split, which is enoughwhich is enough
We endorse their “polarization We endorse their “polarization hypothesis”hypothesis”– Middle routine skills can be outsourcedMiddle routine skills can be outsourced– Top and bottom skills are interactive, but big Top and bottom skills are interactive, but big
increase in relative demand for top increase in relative demand for top interactive skillsinteractive skills
Augmented by slowdown in growth of Augmented by slowdown in growth of relative supply of college graduatesrelative supply of college graduates

1818
The Top, Here’s the The Top, Here’s the CoreCore
of the Controversyof the Controversy 1966-2001 in our IRS data1966-2001 in our IRS data
– AAGR real labor income per taxpayer:AAGR real labor income per taxpayer:
Median 0.30 %Median 0.30 %
9090thth 1.30% 1.30%
9999thth 2.26% 2.26%
99.999.9thth 3.46% 3.46%
99.9999.99thth 5.63% 5.63%
Baseball players (1988-2005) 8.9%Baseball players (1988-2005) 8.9%

1919
Key Distinction at the Key Distinction at the Top:Top:
Superstars vs. CEOsSuperstars vs. CEOs Pay of superstars chosen by the market vs. Pay of superstars chosen by the market vs.
pay of CEOs chosen by their peerspay of CEOs chosen by their peers Two varieties of superstarsTwo varieties of superstars
– Rosen’s entertainers and sports starsRosen’s entertainers and sports stars– Sharp skewness of demand (hearing ten mediocre Sharp skewness of demand (hearing ten mediocre
performances does not match hearing one really performances does not match hearing one really good performance)good performance)
– Magnification of supply. Same effort can be Magnification of supply. Same effort can be witnessed by one person or ten millionwitnessed by one person or ten million
Intermediate group: lawyers and investment Intermediate group: lawyers and investment bankers, paid by the market without bankers, paid by the market without audience magnificationaudience magnification

2020
Can Superstars and Can Superstars and CEOs explain that top CEOs explain that top
income?income? This topic juxtaposes two complementary This topic juxtaposes two complementary
papers, Kaplan-Rauh vs. our first BPEA papers, Kaplan-Rauh vs. our first BPEA effort in 2005effort in 2005
The question is: how much does The question is: how much does superstar and CEO income explain of the superstar and CEO income explain of the top 0.01 percent?top 0.01 percent?
Think of this as numerator and Think of this as numerator and denominator. How much of the denominator. How much of the denominator can the numerator explain? denominator can the numerator explain?
2121
Developing a Developing a ConsensusConsensus
What we learned from Kaplan-What we learned from Kaplan-RauhRauh– There is a lot of income out there There is a lot of income out there
that is not entertainment or sports that is not entertainment or sports superstars and not CEOssuperstars and not CEOs
– Wall St investment bankersWall St investment bankers– Hedge fund managersHedge fund managers– lawyerslawyers
2222
What They learned What They learned from Usfrom Us
The denominator makes a big difference; The denominator makes a big difference; dividing by AGI (as they did) rather than dividing by AGI (as they did) rather than W-2 income (as we did) reduces the share W-2 income (as we did) reduces the share by a factor of 4by a factor of 4
Lawyers are complicated because they Lawyers are complicated because they earn partnership income, not W-2 incomeearn partnership income, not W-2 income
Overall, we conclude that the incomes Overall, we conclude that the incomes identified by Kaplan-Rauh account for at identified by Kaplan-Rauh account for at least 50% of the top 0.01%least 50% of the top 0.01%
2323
Does CEO Pay RespondDoes CEO Pay Respondto Profits or Stock to Profits or Stock
Prices?Prices? Do Huge Increases in CEO pay reflect a Do Huge Increases in CEO pay reflect a
response to profits or market cap?response to profits or market cap? Bebchuk-Grinstein say share of top Bebchuk-Grinstein say share of top
executive earnings in corporate profits executive earnings in corporate profits doubled 1993-2003.doubled 1993-2003.
P/E ratio 1993-2003 increased only P/E ratio 1993-2003 increased only marginallymarginally
Makes sense that increased P/E would Makes sense that increased P/E would spill over to exec comp via stock spill over to exec comp via stock optionsoptions
Time periods matter a lotTime periods matter a lot

2424
The Famous Gabaix-The Famous Gabaix-Landier ModelLandier Model
Basic result: Elasticity of CEO pay Basic result: Elasticity of CEO pay to market cap is always and to market cap is always and everywhere 1.0. Sixfold increase everywhere 1.0. Sixfold increase of both 1980-2003.of both 1980-2003.– Their model is not just empirical but Their model is not just empirical but
theoretical: superstar effect in theoretical: superstar effect in which a small differential in CEO which a small differential in CEO talent generates huge pay talent generates huge pay differencesdifferences

2525
Flaws in the GabaixFlaws in the GabaixEvidenceEvidence
1970-2000, exec compensation increased 1970-2000, exec compensation increased by a factor of 22 while market cap by a factor of 22 while market cap increased by a factor of about 8.increased by a factor of about 8.– This is consistent with Bebchuk-GrinsteinThis is consistent with Bebchuk-Grinstein
Frydman-Saks go back to 1936 and Frydman-Saks go back to 1936 and overturn all of G-L’s resultsoverturn all of G-L’s results– Cross-section elasticity of about 0.3Cross-section elasticity of about 0.3– Time-series elasticity varies wildly from 0.16 Time-series elasticity varies wildly from 0.16
in 1946-75 vs. 2.65 in 1976-2005in 1946-75 vs. 2.65 in 1976-2005 We conclude that something else is We conclude that something else is
pushing up CEO pay relative to market pushing up CEO pay relative to market capcap

2626
Replicating the G-L Replicating the G-L Result with Rolling 20-yr Result with Rolling 20-yr Regressions, 1970-2005Regressions, 1970-2005
Figure 5. 20-Year Rolling Regressions of CEO Compensation on Firm Size as in Gabaix and Landier's Table II
-1
-0.5
0
0.5
1
1.5
2
2.5
3
1990 1991 1992 1993 1994 1995 1996 1997 1998 1999 2000 2001 2002 2003 2004
± 2 S.E. Bands
Coefficient
Note: The x-axis lists the final year of the regression; standard errors reported are robust.

2727
Summary: G-L Unitary Summary: G-L Unitary Elasticity is not Elasticity is not
supported for any time supported for any time periodperiod
Two Possible Conclusions from Two Possible Conclusions from Lack of Stability of CEO to Market Lack of Stability of CEO to Market Cap Relationship over TimeCap Relationship over Time
(1) There may be no connection(1) There may be no connection (2) There is a connection, but (2) There is a connection, but
their model is wrong and yields their model is wrong and yields the wrong elasticitythe wrong elasticity
2828
What’s Wrong withWhat’s Wrong withthe G-L Modelthe G-L Model
Particular model structure of G-L implies that Particular model structure of G-L implies that as firms grow in size, they will be able to as firms grow in size, they will be able to afford a more talented CEOafford a more talented CEO
Increasing returns in model implying that all Increasing returns in model implying that all firms will merge into a single firm under a firms will merge into a single firm under a single CEO. single CEO.
Stock option literature – firms want to reward Stock option literature – firms want to reward performance, so why do they reward performance, so why do they reward nominalnominal stock price appreciation compared to stock price appreciation compared to relativerelative appreciation vs. peer firmsappreciation vs. peer firms
Why do firms choose option grants which are Why do firms choose option grants which are less visible and “hide” CEO pay?less visible and “hide” CEO pay?
2929
Firm-Level ModelsFirm-Level Modelsof CEO Payof CEO Pay
Classic principal-agent model in which Classic principal-agent model in which shareholders control directors and hence shareholders control directors and hence firms was overturned by Berle-Means firms was overturned by Berle-Means (1932) and RA Gordon (1945)(1932) and RA Gordon (1945)
Instead, managers control boards and Instead, managers control boards and stockholdersstockholders
Bebchuk-Fried alternative hypothesis that Bebchuk-Fried alternative hypothesis that CEOs have control over their own pay CEOs have control over their own pay subject only to an “outrage” constraintsubject only to an “outrage” constraint
3030
Bebchuk-Fried Bebchuk-Fried EvidenceEvidence
CEOs often sell their options as soon as they CEOs often sell their options as soon as they are vested, eliminating any incentive effectsare vested, eliminating any incentive effects
Option incentives reward execs for aggregate Option incentives reward execs for aggregate market and macro events, not just their own market and macro events, not just their own performance in their firmperformance in their firm
Firms work hard to disguise incentive payFirms work hard to disguise incentive pay– Public statements ignore deferred compensationPublic statements ignore deferred compensation– Ignore perks, retirement medical care and othersIgnore perks, retirement medical care and others

3131
Overall, the CEO Overall, the CEO Debate Debate
Raises Many IssuesRaises Many Issues Was Increased Use of Stock Options in Was Increased Use of Stock Options in
1990s due to Pay-Performance 1990s due to Pay-Performance Incentives or Desire to Disguise Incentives or Desire to Disguise Compensation?Compensation?
How Does Managerial Control over How Does Managerial Control over Stockholders Square with the Efficient Stockholders Square with the Efficient Markets Hypothesis?Markets Hypothesis?
Where do Accounting Irregularities and Where do Accounting Irregularities and Stock Option Back-dating Fit in?Stock Option Back-dating Fit in?
3232
Conclusion on Conclusion on Inequality Inequality at the Topat the Top
SBTC is relevant not only to steady rise SBTC is relevant not only to steady rise of 90-50 ratio but also to skewness at of 90-50 ratio but also to skewness at the very topthe very top
Electronic media have increased rewards Electronic media have increased rewards to sports and entertainment superstarsto sports and entertainment superstars
Technology has clearly increased trade Technology has clearly increased trade volumes on Wall St by an order of volumes on Wall St by an order of magnitude and made possible very high magnitude and made possible very high incomes thereincomes there

3333
Why Distinguish Why Distinguish Sources of High Sources of High
Incomes?Incomes? Back to basics: superstars are paid by Back to basics: superstars are paid by
the market, CEOs paid by each other the market, CEOs paid by each other through interlocking compensation through interlocking compensation committeescommittees
Arbitrary component, amply documented Arbitrary component, amply documented by backdating of stock optionsby backdating of stock options
The new vocabulary, e.g., “repricing” The new vocabulary, e.g., “repricing” and “spring loading” and “exercise and “spring loading” and “exercise backdating”backdating”

3434
Consumption Consumption InequalityInequality
Studies Based on CEX, with two Studies Based on CEX, with two sources of data, interview and diarysources of data, interview and diary
CEX numbers are inconsistent, CEX numbers are inconsistent, interview vs. diary vs. NIPA data on interview vs. diary vs. NIPA data on consumptionconsumption
We conclude that the literature on We conclude that the literature on consumption inequality is not consumption inequality is not interesting because the data are so interesting because the data are so poorpoor

3535
International International Comparison: the top Comparison: the top
1%1%Figure 6. Share of top 1 percent in Total Income (Labor, Business, and Capital Income,
excluding Capital Gains), for U. S., U. K., Canada, France, and Japan, 1920-2000
0
0.01
0.02
0.03
0.04
0.05
0.06
0.07
0.08
0.09
0.1
1920 1925 1930 1935 1940 1945 1950 1955 1960 1965 1970 1975 1980 1985 1990 1995 2000
U.S.
Canada
U.K.
Japan
France

3636
Why the International Why the International Differences?Differences?
Institutional: America Has a Different Institutional: America Has a Different Economic System?Economic System?– This ignores vast differences in the This ignores vast differences in the
evolution of inequality across OECD evolution of inequality across OECD outside the USoutside the US
Institutional Elements: Privatization in Institutional Elements: Privatization in UK, “consensus” model in NL, IR, GEUK, “consensus” model in NL, IR, GE
GE union reps on boards of directors GE union reps on boards of directors restrained management excessesrestrained management excesses

3737
Our Blend of Our Blend of ExplanationsExplanations
Institutions, including the above Institutions, including the above plus much earlier US adoption of plus much earlier US adoption of stock optionsstock options– Institutions and regulations matter, Institutions and regulations matter,
stock options were illegal in Japan stock options were illegal in Japan until 1997until 1997
But the market also matters:But the market also matters:– Given US early adoption of stock Given US early adoption of stock
options, rising P/E ratios in 1990s options, rising P/E ratios in 1990s spilled over to exec compspilled over to exec comp