Unsafe and Unsound - Massachusetts Institute of … and Unsound Cryptoanalysis of Leaky Acoustic...
19
Unsafe and Unsound Cryptoanalysis of Leaky Acoustic Signals Aakriti Shroff, Jennifer Hu, Tiffany Tang May 15, 2014 Abstract Acoustic Crytoanalysis is a side channel attack in which the attacker listens in on the sounds that are emitted from a laptop. These sounds come from the vibration of electrical components in the CPU’s voltage regulation circuit. In our experiment, using a Lenovo Thinkpad T20 and an iPhone 5s, we attempted to distinguish between CPU operations and extract RSA keys by listening in on the acoustic noise that was being leaked by the laptop during RSA decryption. 1
Transcript of Unsafe and Unsound - Massachusetts Institute of … and Unsound Cryptoanalysis of Leaky Acoustic...

Unsafe and UnsoundCryptoanalysis of Leaky Acoustic Signals
Aakriti Shroff, Jennifer Hu, Tiffany Tang
May 15, 2014
Abstract
Acoustic Crytoanalysis is a side channel attack in which the attackerlistens in on the sounds that are emitted from a laptop. These soundscome from the vibration of electrical components in the CPU’s voltageregulation circuit. In our experiment, using a Lenovo Thinkpad T20 andan iPhone 5s, we attempted to distinguish between CPU operations andextract RSA keys by listening in on the acoustic noise that was beingleaked by the laptop during RSA decryption.
1
1 Introduction
1.1 Background Information
Electrical components in a CPU’s voltage regulation circuit vibrate as theystruggle to supply constant voltage to the CPU despite fluctuations in powerconsumption caused by different operations. These electronic components in aCPU’s circuit vibrate to produce a high-pitched noise during operation. Theacoustic signals vary according to the CPU’s workload, and can leak valuableinformation regarding the kinds of computations running.
A 2013 paper by Daniel Genkin, Adi Shamir, and Eran Tromer showed thatit was possible to extract a 4096-bit RSA key from a laptop computer by an-alyzing the audible whine it emits during operation [1]. Their experiment wassuccessful using rudimentary equipment. In one scenario, a cell phone was usedto record sounds coming from the laptop.
1.2 Motivation and Objectives
Originally we had planned to extend the cryptoanalysis work done by Genkin,Shamir, and Tromer. After further contemplation, we felt that it would be adifficult and interesting enough project to implement the paper’s design andcarry out an RSA key extraction attack using the equipment and software wehad. By running such an experiment, we hoped to gain a better understandingof acoustic cryptoanalysis and make a conclusion on the feasibility of such anattack in real-world settings.
1.3 Related Work
Acoustic cryptoanalysis is only one of many side-channel attacks. Other exam-ples include timing attacks to extract RSA keys. Timing attacks use the ideathat depending on the inputs, certain operations will vary in time. This is usu-ally done by sending multiple requests to the server and timing the responsesto fine-tune the adversary’s guess on the private key. Another example that iscloser to acoustic cryptoanalysis is being able to eavesdrop on someone typingon their keyboard. [3]
1.4 GnuPG implementation
We focus on GnuPG’s RSA decryption operations and how the operations areidentified by their acoustic frequency spectrum. This can allow secret keys to bedistinguished by the sound that is made when they are used. We use GnuPG’smodular exponentiation routine which is based on the Chinese Remainder The-orem and improves the efficient of RSA decryption by a factor of about 4. Weused version 1.4.15.
1.5 Distinguishing RSA keys
The acoustic signature of modular integer exponentiation depends on the modu-lus involved, therefore we should expect different keys to cause different sounds.
2

Using GnuPG to sign a fixed message using different RSA keys randomly ge-neatured, we can distinguish keys of interest.
1.6 Paper Outline
We will organize the paper as follows. First we start by introducing our experi-mental setup in section 2, which includes the recording devices and the laptopswe used, and which ones gave successful results. We also describe our proce-dure to distinguish between different CPU operations. In section 3, we showhow acoustic leakage easily allows differentiation between different RSA keys.We also present our approach for extracting RSA keys. Lastly, we disuss thesuccessfulness of the experiment and the feasibiility in section 4.
2 Setup and Preliminary Analysis
In this section, we describe the methods and approaches we used in our attemptto carry out an attack. We first describe our experimental set-up and our ratio-nale behind choosing our equipment. We then describe the initial diagnosticsperformed to determine whether or not a laptop was suitable for our acousticsattack. Finally, we describe potential problems that arise from the occurrenceof other signals.
2.1 Experimental Setup
The experiment required three main components (1) a microphone to recordacoustic leakage, (2) a method to perform elementary signal processing, and (3)a suitable laptop to function as the attacked computer.
Microphone
We tried recording acoustic leakage with three different microphones.
– Samsung Galaxy S3 running AndroidThe first microphone we used was an Android Samsung Galaxy S3. Thesampling rate was not available on the phone’s official website, but basedon online discussions and spectrograms produced by the phone, we esti-mated that the phone had a sampling rate of 48,000 kHz, which is thestandard sampling rate for many microphones. By the Nyquist-Shannonsampling theorem, this means that the phone can capture frequencies upto 24,000 kHz. Howevever, the Android phone was only able to capturefrequencies up to 22,000 kHz. This is most likely due to the other hard-ware inside the Android phone and the fact that Android phone is notintended to be used as a high-end recorder.
– Apple iPhone 5s with a Dayton iDevice Microphone:The second recording device, which became our main recording device formost of the project, was an iPhone 5s with a Dayton iDevice Microphone.
3

The iPhone 5s had the same sampling rate of 48,000kHz as the Androidphone. We found that there was less distortion of signals on the spec-togram when using the iPhone instead of the Android phone. The DaytoniDevice Microphone gave us more flexibility in choosing where to put ourmicrophone, which is very important for our set-up. The Android’s phone,on the otherhand, had its microphone on the back, which made recordingin certain positions difficult.
– h4n Zoom Recorder:The third recording device we used was a Zoom Recorder, which had asampling rate of 96,000kHz. Using this recording device, we were ableto view up to frequencies of 48,000kHz on our spectograms. The ZoomRecorder essentially has double the sampling rate than both the Androidand iPhone. We found that the graphs concerning the RSA algorithmwere not much clearer when using this microphone. However, we ulti-mately used the Apple iPhone for our final recordings because we feltmore comfortable with the device.
Signal Processing
After obtaining recording samples from our microphone, we used a signal ana-lyzer to convert the data to readable format, like a spectogram. For the earlierstages of our project, we used signal analyzing programs from the phone. How-ever, these signal analyzing allowed us at most to only take screenshots of thecurrent screen. To get better graphs and results, we instead recorded the soundsand then did post-processing on a seperate computer. For our final program,we used Baudline, which is a signal anaylzer that provides spectrum analysisdata visualization. Most of the graphs from our write-up were created usingbaudline.
Laptop/Attacked Computer
The most difficult part in our search for equipment was looking for a suitablelaptop to run as the attacked computer. We were using our phones in the initialstages and due to a limited budget decided against purchasing better equipment.Most of the acoustic signals we wanted to see were at too high a frequency forthe phones to record. Thus, we needed an older laptop. The reasoning behindfinding an older laptop was that the processor would be much slower than sayan i7 Intel Processor and that the capacitors would more likely be worn out andthus leak out more acoustic noise. We did, however, initially test to see if ourcurrent laptops would be suitable for the experiment.
We tried using a 13-Inch Macbook Pro and a Lenovo IdeaPad Y510p 15.6-Inch Laptop. The processors on both laptops were an i5 Intel Processor and i7Intel Processor respectively. We were not able to capture acoustic signals onboth laptops. We then borrowed a laptop from MIT class 6.01. The laptopwas running on Athena Ubuntu with an i3 Processor. We were also not ableto capture any acoustic signal on this laptop as well. We borrowed a fellowMIT student’s laptop, a Lenovo Thinkpad r61i. This laptop was running onWindows XP SP2 with an Intel Core Duo Processor (1.5GHz). This laptop wasalso not suitable for two important reasons. The processor was running CPU
4

instructions at too high a rate for our phones to actually record any acousticsignal. Secondly. we discovered that the capacitors in this laptop were very”deep” into the laptop. This made recording very difficult because we were notable to take apart the laptop, due to the fact that we were borrowing it andhad to return it without tampering with the laptop in any way. Our next stepwas to find an even older laptop. We wanted to obtain a Lenovo Thinkpad T23,which according to the authors of the original paper, had very strong acousticleakage that would be capturable by a phone’s microphone. We were, however,not able to obtain one. Instead, we managed to obtain a Lenovo Thinkpad T20.It was running on Windows XP S2 with an Intel Pentium III processor (650MHz). Compared to the other laptops, the processor is much much slower, sowe had a higher chance of actually seeing something relevant in our recordings.
We used this laptop in our final setup, so we will briefly describe how we foundthe ideal setup for this laptop.
Figure 1: This is the Lenovo Thinkpad T20. The circled regions are wherewe placed our microphone in order to find the best position to record acousticleakage. All of these provide a good signal, but we found a better place to putour microphone later.
Figure 2: This is the back of the Lenovo Thinkpad T20.
The back of the Lenovo Thinkpad T20 included most of the connections thatwould be seen on a laptop today. For example, the USB drive, the printer, andthe monitor output, and the power supply was all located on the back of thelaptop. We tried recording close to each of these connections, but did not findthis to be ideal. We were also using a USB wireless mouse because it was nearlyimpossible to use the laptop otherwise, which may or may not have interferredwith the signal.
5

Figure 3: This is the right side of the Lenovo Thinkpad T20.
The right side of the laptop was not very useful in providing acoustic leakage.This may have been due to the fact that there were not a lot of openings here.
Figure 4: This is the left side of the Lenovo Thinkpad T20.
Unlike the right side, the left side proved to be more promising. Therewere stronger acoustic signals on this side overall. The strongest came from thePCMCIA card slot. Below is a figure of our final setup.
Figure 5: Our final setup is as shown. The green circle indiates where theDayton Microphone was inserted (in the PCMCIA card slot, which was usefulbecause there were a couple of capacitors close to it).
2.2 Acoustic Signals and CPU Operations
In order to determine whether or not we can extract RSA keys from a laptop, wehad to first run a diagnostics test on the laptop to see if we could differentiatebetween different CPU operations. Despite limitations in our equipment, wewere able to see interesting patterns that allowed us to recognize certain CPUinstructions. For our diagnonstics, we used HLT, MEM (L1 cache miss), andMUL (multiplication CPU instruction). We will now describe our procedure.It should be noted that we recorded these sounds when the power settings weremaximized and the power supply was plugged in. The original paper statedthat doing these two things would ensure a better reading. By maximizingthe power settings, we could be sure that the CPU was not being
6

underclocked. Here are the steps that we took, in order.
1. Obtain a spectrogram of the laptop under normal conditions.2. Obtain a spectrogram of the laptop while running the HLT command in
1 sec loops.3. Obtain a spectrogram of the laptop while running the HLT and MUL
command in 1 sec loops.4. Obtain a spectrogram of the laptop while running the HLT, MUL, and
MEM command in 1 sec loops.5. Obtain a spectrogram of the laptop while running several CPU in 1 sec
loops and slowly decrease the time of the loops in subsequent iterations.
The first step is to obtain a regular reading of the laptop under normal cir-cumstances, during which we did nothing to the laptop. This enabled us to seewhat the laptop’s spectogram looked like while nothing was being run. This isimportant to be able to differentiate when we actually run CPU instructions onthe laptop.
The second step was then to record what HLT looked like. We ran HLT for1 sec in an infinite loop for this step. HLT is a special command that is im-portant for our anaylsis. It is a kernal command and halts the CPU completelyuntil the next interrupt is signaled. As will be shown in the graphs, HLT is oneof the most distinguishable operations. If we are able to see a difference be-tween when the laptop is running under normal conditions and when the laptopis running with the HLT command, we continue on with the diagnostics.
In the third step, we ran both the HLT and MUL command in 1 sec loops.The purpose of this step is to be able to see what MUL looks like. Because weknow what HLT looks like, if we are indeed able to see CPU operations, MULwill be easily identifiable.
After successfully determining whether or not we can differentiate between HLTand MUL, we move on to the next step. The fourth step involves running threeinstructions: HLT, MUL, and MEM in 1 second loops. From the previous step,we know how HLT and MUL look like. We can then try to see if we can deter-mine where MEM is.
Finally, if the fourth step can be completed, we know that we are able to seeand distinguish between some CPU operations. The fifth step is to see howwell we can see different CPU operations. For this step, we run a program thatexecutes several different instructions, such as NOP, HLT, MUL, FMUL, andMEM. It first runs all the instructions in 1 second. Then it runs the same setof instructions faster (ie: 0.8 seconds) in the next iteration.
7

Figure 6: A spectrogram obtained from step four. The CPU instructions havebeen highlighted.
Using the Thinkpad T20, we were able to differentiate between the HLT,MUL, and MEM instructions. As shown in the graph in figure 6, the CPUinstructions were quite distinct on our graphs. At first sight, the graphs maybe a bit difficult to read. Spectrograms record frequency versus time. Each row(in this particular example, each highlighted row) represents a different CPUinstruction. The rows that are very bright green are the HLTs. We highlightedMUL and MEM as well. As one can see, the pattern repeats in the graph,implying that we are able to capture different CPU instructions consistently.
Figure 7: A spectrogram obtained from step five.
8
Unfortunately, with our limitations in equipment, we were not able to suc-cessfully complete step five. We were able to recognize the HLT instructions,but were not able to identify most of the other instructions. This is to be ex-pected. Most of the key distinguishing characteristics of these other operationsare at a higher frequency. 1 As it turns out, however, successfully completingstep five was not necessary for RSA key extraction.
2.3 Obstables during Recording
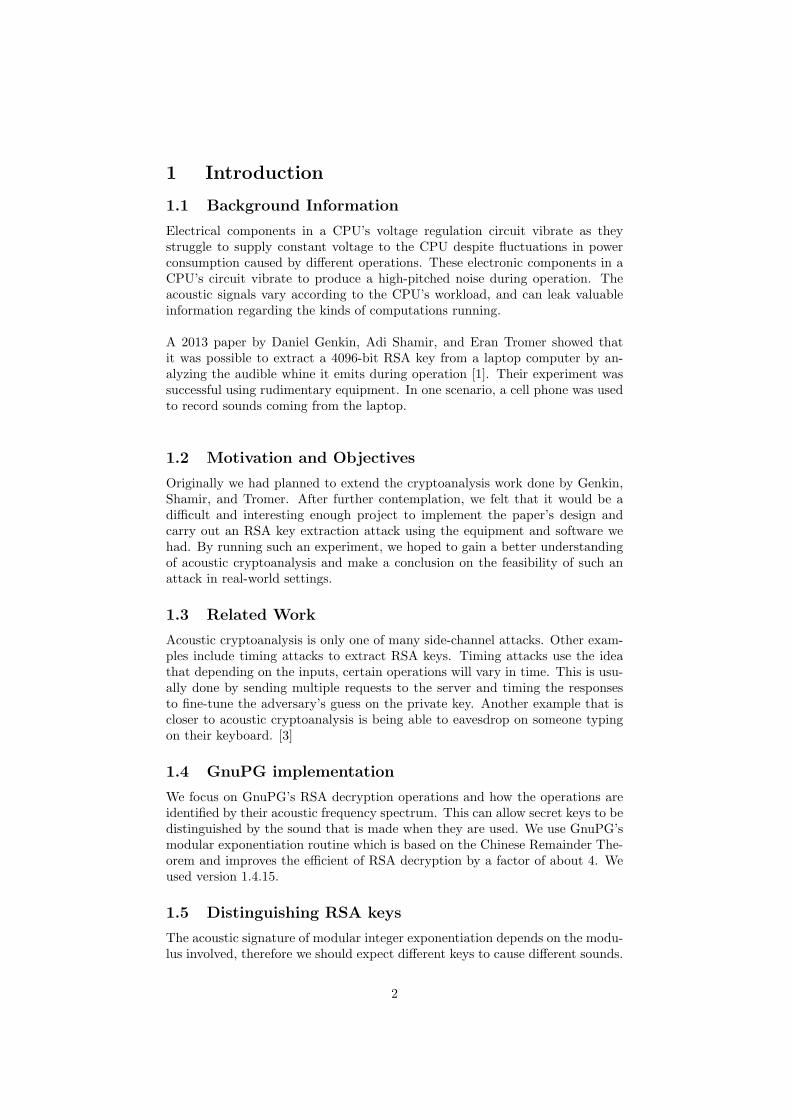
During our experiment, we encountered obstables. This is to be expected as weare running this experiment in a real-world setting. The obvious obstable, asmentioned in the experiment setup, was our microphone, which was limited inthe frequencies it could capture. To compensate for our recording device, wechose an old laptop. The other obstacle was not as obvious and something wediscovered when we ran the diagnostics test on several laptops. It also occurredin a lot of the laptops we tested against. We found a destructive signal thatleaked at around 21kHz. It also distorted the rest of the spectogram. We laterdiscovered that it was an electro-magnetic wave coming from the fan, whichturned on whenever the computer was too hot. We worked around this problemby letting the laptop idle. When the laptop was cool enough, the fan wouldturn off by itself.
Figure 8: A spectogram of the EM wave from the fan. The blue highlightswhere the wave is. As we can see, the EM wave distorts the graph at otherfrequencies as well.
3 GnuPG RSA Key Extraction
The results of the previous section demonstrate that using our set-up, it ispossible to distinguish between CPU operations running on the laptop. Our
1With better equipment, the orignal authors were able to distinguish between a lot moreinstructions.
9

preliminary analysis confirms that acoustic signals emanating from a targetlaptop leak information about the underlying code. In this section, we discussthe specifics of our side-channel attack on GnuPG RSA and summarize our keyextraction experiment as well as present our findings.
The authors of [1] identified a common RSA implementation, GnuPG, specifi-cally GnuPG 1.x series, as vulnerable to an acoustic side-channel attack. Throughpreliminary analysis, we decided to target GnuPG 1.4.15 compiled with MinGWgcc version 4.6.2 compiler on a Thinkpad T20 running Windows XP.
We briefly describe the weakness in GnuPG’s RSA implementation that makesit vulnerable to our side-channel attack. 2.
3.1 GnuPG RSA
The ciphertext that we pass to GnuPG’s decryption algorithm is directly passedto it’s underlying modular exponentiation routine along with the secret key dand the integers p and q. Within the routine, the ciphertext is first reducedmodulus the integers, and the reduced ciphertext is used in a multiplicationroutine that is repeated 2048 times. The repetition amplifies the acoustic leak-age over several cycles, and we can observe any differences in the patterns moreeasily.
Recall that GnuPG RSA’s decryption algorithm uses CRT as an optimiza-tion. As a result, the modular exponentiation first operates modulo p, andthen switches over to operating in modulo q. The acoustic leakage created ineach case is distinct, and is discernible on the spectrogram. We present ouranalysis of RSA’s acoustic leakage in Section 3.2.
We implement the adaptive chosen-ciphertext attack described in [1] to ex-tract individual bits of the exponent. Once either exponent p, q is extracted,extracting the secret key d is trivial. Let the binary representation of integer qbe qn, qn−1, ..., q1. Assume that we have already extracted the high i− 1 bits ofq, and let ci,1 be the 2048 bit ciphertext whose high i−1 bits are equal to thoseof q, whose ith bit is 0, and remaining bits are 1. Consider decrypting usingciphertext ci,1. This ciphertext is first reduced with exponent q in a bit-by-bitmanner. Depending on the value of q, two things happen:
– qi = 1 Then ci,1 < q and is not reduced. Our structured ciphertext ispassed into the multiplication routine 2048 times.
– qi = 0 Then qci,1 ≥ q and is reduced. A random-looking c that is shorterthan 2048 bits is passed into the multiplication routine 2048 times.
In section 2, we established that CPU operations like multiplications couldbe distinguished by analyzing acoustic leakage. We extend the results to dis-tinguishing multiplication operations with structured 2048-bit binary numbers
2The focus of this section is our experience implementing the attack, and for a more in-depth understanding of the attack, please refer to [1]
10

from that of multiplication operations with shorter,random-looking binary num-bers. This is central to our attack and our analysis of the chosen-ciphertextdecryption is presented in Section 3.3.
3.2 RSA Key Distinguishability
Our analysis required us to first identify what the acoustic leakage of a GnuPGRSA decryption looked like. From our preliminary analysis, we discovered thatHLT’s acoustic leakage generates a good visual marker in the spectrogram. Weran five identical decryptions on a fixed GnuPG message using the same secretkey interleaved with HLT messages. The spectrogram produced a clear acousticsignature for the RSA decryption as seen in figure 9.
Figure 9: A spectrogram obtained from decrypting a fixed gnuPG message fivetimes. The HLT instructions have been darkened.
Moreover, the spectrogram captured the acoustic leakage that occurred dur-ing the transition between modulo p and modulo q operations as seen in figure10. This is important to our attack as the spectral signature during this transi-tion serves as a signature for the key in general; i.e. different keys have diffferentspectral signatures, and this difference is specially noticeable during the transi-tion between p and q.
11

Figure 10: A spectrogram obtained from decrypting a fixed gnuPG message fivetimes. The HLT instructions have been darkened. Transition between p andq has been marked using white arrows. Within each decryption, the blue rowrefers to modulo p operations, and yellow row to modulo q operations.
Finally, we encrypted a fixed message using five different RSA keys, and ranthe decryption algorithm on each of them i.e. fixed message, different keys. Wecreated a program that calls an infinite loop of these five decryption invoca-tions as seen in figure 11. We analyzed the transition between p and q on thespectrogram, and confirmed that different keys could be distinguished based ontheir transitions (figure 12).
The ability to identify keys can prove to be extremely advantageous in otherattacks as well where the acoustic traffic is monitored and the identification ofrarely-used keys can reveal something about the situation.
12

Figure 11: A spectrogram representing acousting leakage of five decryptions,each decrypting the same fixed message but with different keys. The spectro-gram shows 3 iterations of the infinite loop each decrypting five times (blueblocks). The white circle encloses p-q transitions of five different keys and isenlarged in figure 12
Figure 12: Enlarged cross-section of spectrogram in figure 11. The clarity ofthe p-q transitions is only limited by our equipment. Even using our elementaryset-up, we are able to see the unique signature for each of the 5 keys as seenwithin each circle.
13

3.3 RSA Key Extraction
Because different keys cause different sounds, we were able to use GnuPG to helpdistinguish between RSA secret keys. To extract the secret key, it is sufficientthat we extract either p or q. We implement an adaptive chosen-ciphertextattack that exposes the RSA exponent bit-by-bit as explained in Section 3.1.
Creating chosen-ciphertext ci,1
The chosen ciphertext ci,1 is structured as the 2048 bit ciphertext whose highi − 1 bits are equal to those of q, whose ith bit is 0, and remaining bits are 1,where q RSA exponent q be qn, qn−1, ..., q1. While the paper [1] brushes overcreating the ciphertext, and invoking RSA decryption on the created GnuPGmessage, we found this part of the experiment quite challenging.
Encryptions using GnuPG RSA generate a GnuPG file which is formatted ac-cording to the OpenPGP Message Format found at [4]. Our goal is to create avalid GnuPG file containing the chosen-ciphertext that is correctly processed byGnuPG. To do so, we first tried to manually create a GnuPG file from scratchcontaining our ciphertext. We had to understand the steps involved duringGnuPG RSA encryption, and because of the lack of documentation regardingGnuPG’s src directory, this was not easy. Instead we implemented a shortcutusing the following steps:
1. During RSA encryption, GnuPG invokes a public(MPI output, RSA-public-key*pkey) method to carry out the exponentiation. 3
2. We modified the method so that it doesn’t perform any of the regular RSAencryption steps, but simply returns our chosen-ciphertext. See AppendixA for clarification.
3. Our hope was that a decryption call would fetch the ciphertext, our ci,1,from the GnuPG file and decrypt succesfully.
When we try invoking GNuPG --decrypt <ciphertext>, our call failed.However, this doesn’t effect the success of our attack. This is because GnuPGuses a hybrid cryptosystem to optimize for speed and security in which GnuPGcreates a one-time secret key from a random number. This session key is usedwhile encrypting the plaintext using a symmetric algorithm (eg. AS256). Oncethe data is encrypted, the session key is then encrypted to the recipient’s publickey. This public key-encrypted session key is transmitted along with the cipher-text to the recipient. When we decrypt using RSA, the private key is used todecrypt the secret session key used, which in turn decrypts the ciphertext.
It is important to note that the value of the decrypted ciphertext does noteffect our analysis, only that our ciphertext, ci,1, was used during encryp-tion/decryption with the correct exponent q. After carefully analyzing whereour decryption failed, we realized that while GnuPG RSA was correctly de-crypting the session key, but the session key used to encrypt the plaintext was
3MPI refers to Multi Precision Integers. GnuPG uses MPIs to represent large integers asbig-endian 8-bit octets.
14

now invalid (because we have changed the underlying ciphertext). Subsequently,our RSA decryption was happening as intended and we should observe acousticleakage that exposed bit qi even though we did not find out the value of thedecrypted ciphertext.
While we understand that this is not a realistic attack scenario, we believe thatthis shortcut preseves the experiment’s objectives– analyzing acoustic leakageduring RSA decryption to extract secret key.
Extracting bit qi
We decrypted the ciphertext using the same key five times interleaved withHLT operations and recorded the acoustic leakage emanating from the laptop.During the first run, we set the ciphertext, ci,1, to be the 2048 binary number0b10111..111, implying that we are extracting the second bit, q2047. The spec-trogram highlighted the transition between modulo p and modulo q as seen infigure 13. The attack described in [1] discusses steps to create templates thatthe generated spectrograms can be compared against. We use the ones in thepaper as our template and deduced that the attacked bit is q2047 = 1.
We extracted the next bit using the ciphertext 0b110111..111. Continuingthis attack two more times resulted in similar spectrograms, and we deducedthat the attacked bits were all 1. While attacking q2044, we encountered ourfirst qi = 0 bit. Our analysis confirmed this as the spectrogram generated wasunlike the ones generated for qi = 1 bits. Comparing it to the [1], we concludedthat bit q2044 = 0 and produces a unique acoustic signature as seen in figure14.
15

Figure 13: Attacked bit is one
Figure 14: Attacked bit is zero
16

4 Discussion
Our goal was to carry out the experiement that Genkin, Shamir, and Tromercarried out, specifically to be able to distinguish between CPU operations, dis-tinguishing between RSA secret keys, and extracting a few bits from RSA keys.Overall, we were successful, despite early struggles in attempting to find equip-ment, laptops and recording devices, that would provide us any results. Themost difficult area was extracting the bits from the RSA keys.
We began our analysis by attempting to distinguish various operations per-formed by the CPU of the laptop, and were able to detect certain patternsthat allowed us to recognize HLT,MEM, and MUL instructions. The reasoningbehind our procedure is as follows - being able to know what a certain CPUoperation looks like on our spectrogram allows us to identify other operationsby running an extra operation each time until we were able to see all.
Next, after gaining comfirmation that acoustic signals do leak information aboutunderlying code, we tried to distinguish different keys based on their differentspectral signatures, and were able to identify them by looking at the transitionsbetween p and q on the spectrograms. The ability to determine such could beeven clearer if we were to have better equipment.Lastly, we focused on con-structing a chosen ciphertext attack needed to extract RSA keys.
Looking at our results, we felt that our project was successful in meeting itsaims. We managed to extract RSA key bits, which was our initial goal. We didnot expect to be able to extract keys, given our long search for an appriopriatecomputer, and were quite pleased when we managed to do so. In terms of whatwent well, we felt that the analysis part of the project – where we tested po-tential laptops, differentiated CPU operations, differentiated between differentRSA keys, and RSA key extraction went well. This was because we understoodthe mechanics of acoustic cryptoanalysis very well through research and discus-sion.
We felt, however, that the search for equipment did not go as well. The high-end microphones that were able to capture high frequencies were very costlyand well beyond the budget of our group. Because we were not able to acquirea decent microphone, we had to make sure we chose a very old laptop to ensurethat we would be able to capture signals. This part, we felt, was very much outof our hands.
If we could do things differently, we may have considered looking at older laptopsbeforehand. It took a lot of time for us to find the Thinkpad T20. Most ofthe time, we were testing out laptops that were outputting frequencies muchhigher than we could capture. We felt that while this was a valuable learningexperience, we could have saved more time if we had used an older laptop inthe first place.
17

5 Conclusion
Although we have sucessfully implemented the experiment, there are many nextsteps to attempt. Executing such experiments on laptops other than the LenovoThinkpad T20 as well as various models and/or various operating systems andother version of GnuPG, could help emphasize such results as well as providea whole new area to research. It is suggested the signal quality and effectiveattack distance cary according to the computer’s age. In addition, to distinguishkeys of interest in many applications, it may be possible to distinguish betweenalgorithms, different implementations of an algorithm, or different computersrunning the same algorithm.
For other groups interested in carrying out this attack, we recommend usinga very old laptop with an old processor, because that increases the chance ofthe microphone being able to listen in on the computer. We also recommendthe group to carry out our initial diagnostics on each computer they attemptthis on to see whether or not it is feasible to carry out the actual attack.
In terms of feasibility in a realistic setting, acoustics cryptoanalysis is all verydependent on the equipment of the attacker and the laptop being attacked. Inorder to successfully extract RSA keys, the attack must have a powerful enoughmicrophone to be able to capture high frequencies. The laptop must also beleaking acoustic signals at a low enough rate for the microphone to be able tocapture it. So, while the attack is very possible, the attacker may not have alot of freedom in choosing whoose keys to extract.
6 Acknowledgements
We would like to thank the 6.857 staff, especially Professor Rivest and our T.A.Justin Holmgren, for their guidance throughout the project. We are gratefulto Kyle Fisher for helpring us acquire the attacked laptop we used for ourexperiments. Lastly, we’d like to thank the authors of [1] for invaluable adviceprovided to us during our correspondence with them.
7 Appendix
For the RSA key extraction, we chose our ciphertext by using the modifiedpublic function in cipher/rsa.c:
static void public(MPI output, MPI input, RSA public key *pkey ){const char *str = "CHOSEN CIPHERTEXT HERE";mpifromstr(output, str);}
18

8 Reference
[1] Daniel Genkin, Adi Shamir, Eran Tromer RSA Key Extraction via Low-Bandwidth Acoustic Cryptanalysis 2013.
[2] Eran Tromer Hardware-based Cryptanalysis 161-170 2007
[3] Dmitri Asonov, Rakesh Agrawal Keyboard Acoustic Emanations 2004
[4] J. Callas, L. Donnerhacke, H. Finney, D. Shaw, and R. Thayer OpenPGPMessage Format. RFC 4880 2007
19