
UNPACKING THE STANDARDS FOR … · Grade 8 Mathematics QUARTER: Second Quarter STRAND: Algebra...
102
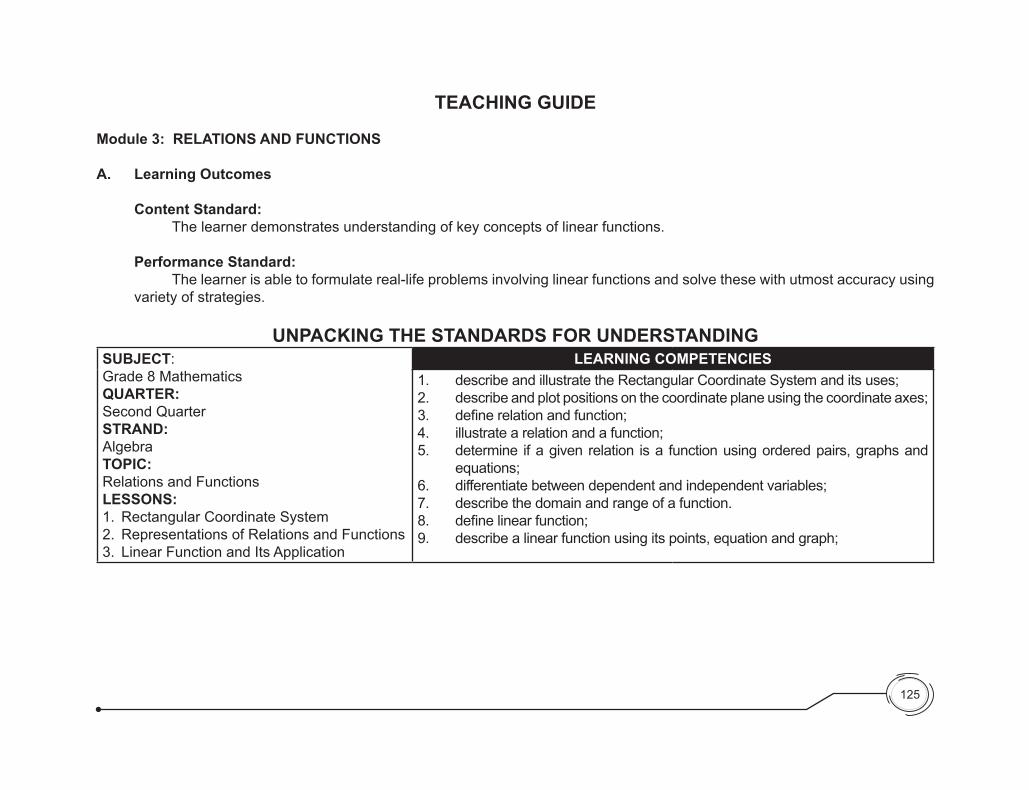
TEACHING GUIDE Module 3: RELATIONS AND FUNCTIONS A. Learning Outcomes Content Standard: The learner demonstrates understanding of key concepts of linear functions. Performance Standard: The learner is able to formulate real-life problems involving linear functions and solve these with utmost accuracy using variety of strategies. UNPACKING THE STANDARDS FOR UNDERSTANDING SUBJECT: Grade 8 Mathematics QUARTER: Second Quarter STRAND: Algebra TOPIC: Relations and Functions LESSONS: 1. Rectangular Coordinate System 2. Representations of Relations and Functions 3. Linear Function and Its Application LEARNING COMPETENCIES 1. describe and illustrate the Rectangular Coordinate System and its uses; 2. describe and plot positions on the coordinate plane using the coordinate axes; 3. define relation and function; 4. illustrate a relation and a function; 5. determine if a given relation is a function using ordered pairs, graphs and equations; 6. differentiate between dependent and independent variables; 7. describe the domain and range of a function. 8. define linear function; 9. describe a linear function using its points, equation and graph; 125
Transcript of UNPACKING THE STANDARDS FOR … · Grade 8 Mathematics QUARTER: Second Quarter STRAND: Algebra...
TEACHING GUIDE
Module 3: RELATIONS AND FUNCTIONS
A. Learning Outcomes
Content Standard: The learner demonstrates understanding of key concepts of linear functions.
Performance Standard: The learner is able to formulate real-life problems involving linear functions and solve these with utmost accuracy using variety of strategies.
UNPACKING THE STANDARDS FOR UNDERSTANDINGSUBJECT: Grade 8 MathematicsQUARTER: Second QuarterSTRAND: AlgebraTOPIC: Relations and FunctionsLESSONS:1. Rectangular Coordinate System2. Representations of Relations and Functions3. Linear Function and Its Application
LEARNING COMPETENCIES1. describe and illustrate the Rectangular Coordinate System and its uses; 2. describe and plot positions on the coordinate plane using the coordinate axes;3. definerelationandfunction;4. illustrate a relation and a function;5. determine if a given relation is a function using ordered pairs, graphs and
equations;6. differentiate between dependent and independent variables; 7. describe the domain and range of a function.8. definelinearfunction;9. describe a linear function using its points, equation and graph;
125
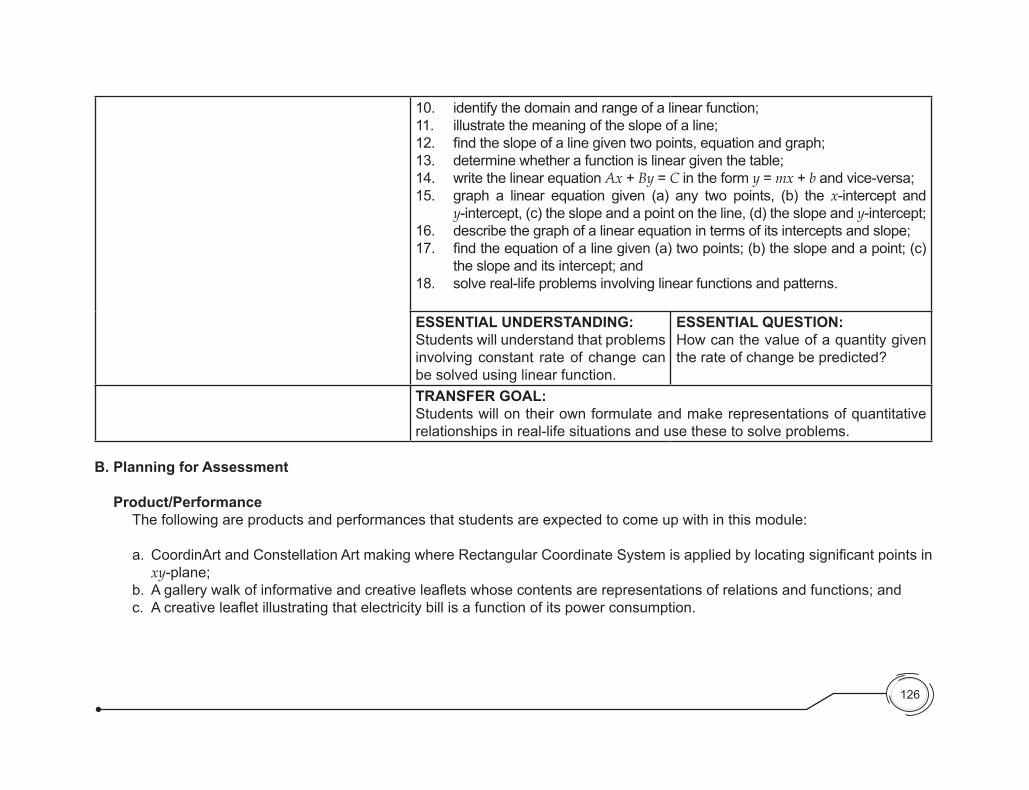
10. identify the domain and range of a linear function;11. illustrate the meaning of the slope of a line;12. findtheslopeofalinegiventwopoints,equationandgraph;13. determine whether a function is linear given the table;14. write the linear equation Ax + By = C in the form y = mx + b and vice-versa;15. graph a linear equation given (a) any two points, (b) the x-intercept and
y-intercept, (c) the slope and a point on the line, (d) the slope and y-intercept;16. describe the graph of a linear equation in terms of its intercepts and slope;17. findtheequationofalinegiven(a)twopoints;(b)theslopeandapoint;(c)
the slope and its intercept; and18. solve real-life problems involving linear functions and patterns.
ESSENTIAL UNDERSTANDING:Students will understand that problems involving constant rate of change can be solved using linear function.
ESSENTIAL QUESTION:How can the value of a quantity given the rate of change be predicted?
TRANSFER GOAL:Students will on their own formulate and make representations of quantitative relationships in real-life situations and use these to solve problems.
B. Planning for Assessment
Product/Performance The following are products and performances that students are expected to come up with in this module:
a. CoordinArtandConstellationArtmakingwhereRectangularCoordinateSystemisappliedbylocatingsignificantpointsinxy-plane;
b. Agallerywalkofinformativeandcreativeleafletswhosecontentsarerepresentationsofrelationsandfunctions;andc. Acreativeleafletillustratingthatelectricitybillisafunctionofitspowerconsumption.
126
127
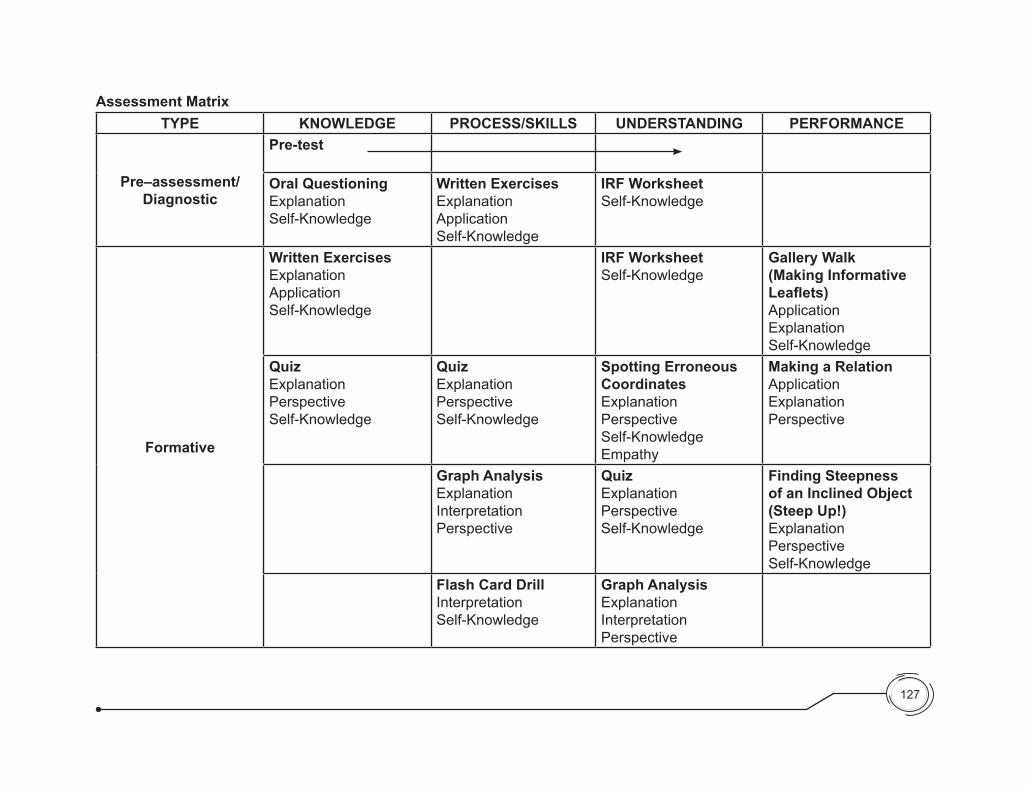
Assessment MatrixTYPE KNOWLEDGE PROCESS/SKILLS UNDERSTANDING PERFORMANCE
Pre–assessment/ Diagnostic
Pre-test
Oral QuestioningExplanationSelf-Knowledge
Written Exercises ExplanationApplicationSelf-Knowledge
IRF Worksheet Self-Knowledge
Formative
Written Exercises ExplanationApplicationSelf-Knowledge
IRF Worksheet Self-Knowledge
Gallery Walk(Making Informative Leaflets)ApplicationExplanationSelf-Knowledge
QuizExplanationPerspectiveSelf-Knowledge
QuizExplanationPerspectiveSelf-Knowledge
Spotting Erroneous CoordinatesExplanationPerspective Self-KnowledgeEmpathy
Making a RelationApplicationExplanationPerspective
Graph AnalysisExplanationInterpretationPerspective
QuizExplanationPerspectiveSelf-Knowledge
Finding Steepness of an Inclined Object (Steep Up!)ExplanationPerspectiveSelf-Knowledge
Flash Card DrillInterpretationSelf-Knowledge
Graph AnalysisExplanationInterpretationPerspective
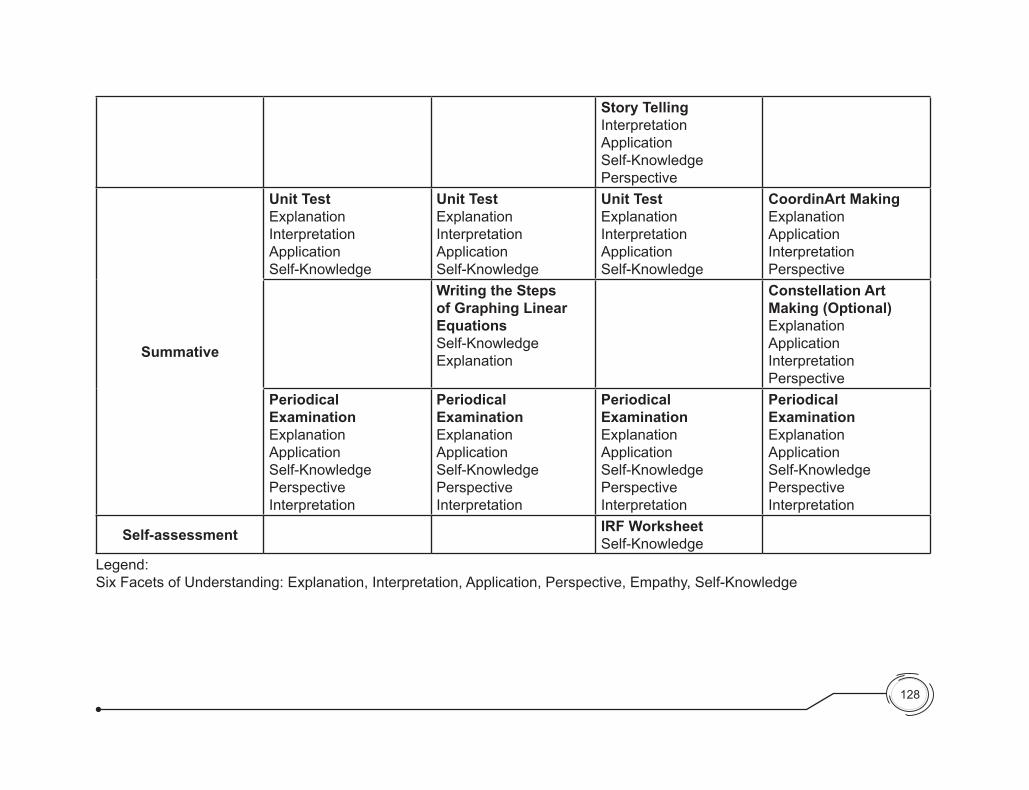
Story TellingInterpretationApplicationSelf-KnowledgePerspective
Summative
Unit TestExplanationInterpretationApplicationSelf-Knowledge
Unit TestExplanationInterpretationApplicationSelf-Knowledge
Unit TestExplanationInterpretationApplicationSelf-Knowledge
CoordinArt MakingExplanationApplicationInterpretationPerspective
Writing the Steps of Graphing Linear EquationsSelf-KnowledgeExplanation
Constellation Art Making (Optional)ExplanationApplicationInterpretationPerspective
Periodical ExaminationExplanationApplicationSelf-KnowledgePerspectiveInterpretation
Periodical ExaminationExplanationApplicationSelf-KnowledgePerspectiveInterpretation
Periodical ExaminationExplanationApplicationSelf-KnowledgePerspectiveInterpretation
Periodical ExaminationExplanationApplicationSelf-KnowledgePerspectiveInterpretation
Self-assessment IRF WorksheetSelf-Knowledge
Legend:Six Facets of Understanding: Explanation, Interpretation, Application, Perspective, Empathy, Self-Knowledge
128
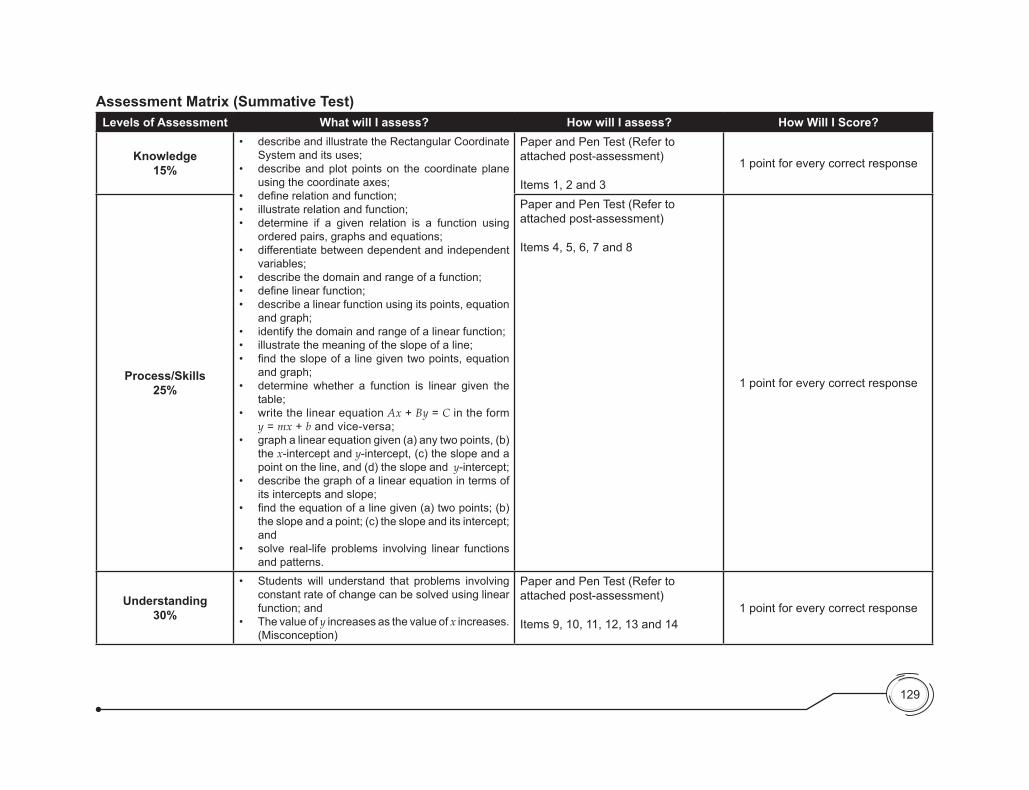
Assessment Matrix (Summative Test)Levels of Assessment What will I assess? How will I assess? How Will I Score?
Knowledge15%
• describeandillustratetheRectangularCoordinateSystem and its uses;
• describeandplot pointson the coordinateplaneusing the coordinate axes;
• definerelationandfunction;• illustraterelationandfunction;• determine if a given relation is a function using
ordered pairs, graphs and equations;• differentiatebetweendependentandindependent
variables;• describethedomainandrangeofafunction;• definelinearfunction;• describealinearfunctionusingitspoints,equation
and graph;• identifythedomainandrangeofalinearfunction;• illustratethemeaningoftheslopeofaline;• findtheslopeofalinegiventwopoints,equation
and graph;• determine whether a function is linear given the
table;• writethelinearequationAx + By = C in the form
y = mx + b and vice-versa;• graphalinearequationgiven(a)anytwopoints,(b)
the x-intercept and y-intercept, (c) the slope and a point on the line, and (d) the slope and y-intercept;
• describethegraphofalinearequationintermsofits intercepts and slope;
• findtheequationofalinegiven(a)twopoints;(b)the slope and a point; (c) the slope and its intercept; and
• solve real-life problems involving linear functionsand patterns.
Paper and Pen Test (Refer to attached post-assessment)
Items 1, 2 and 3
1 point for every correct response
Process/Skills25%
Paper and Pen Test (Refer to attached post-assessment)
Items 4, 5, 6, 7 and 8
1 point for every correct response
Understanding30%
• Students will understand that problems involvingconstant rate of change can be solved using linear function; and
• Thevalueofy increases as the value of x increases. (Misconception)
Paper and Pen Test (Refer to attached post-assessment)
Items 9, 10, 11, 12, 13 and 141 point for every correct response
129
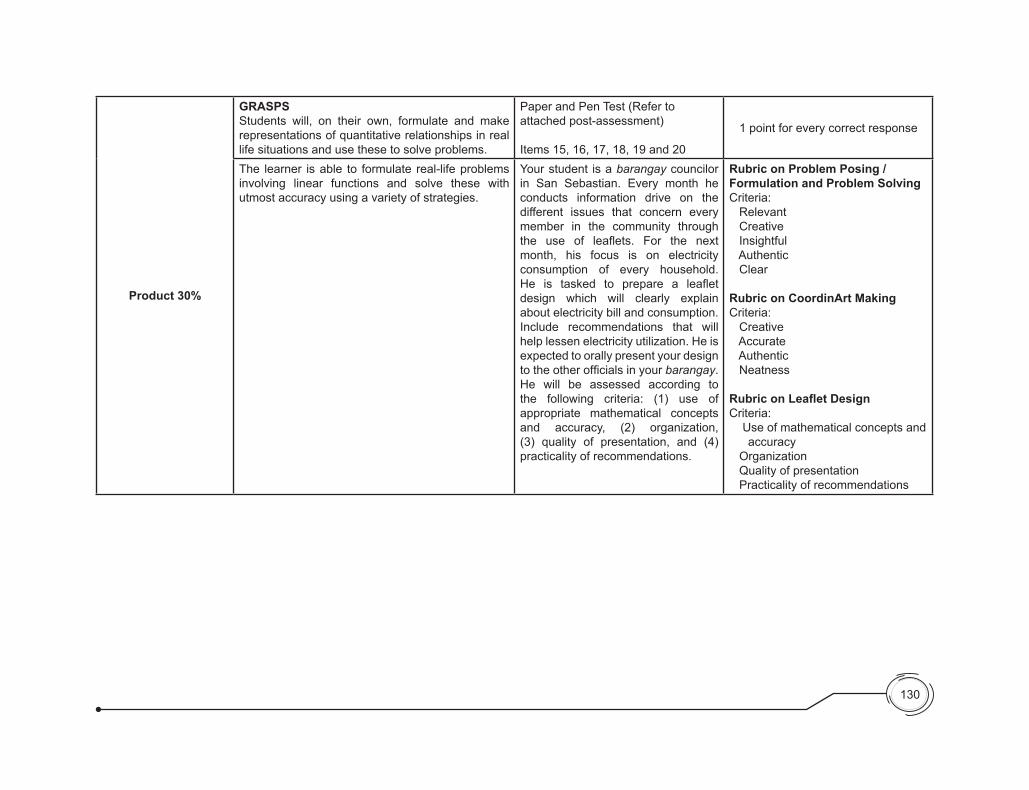
Product 30%
GRASPS Students will, on their own, formulate and make representations of quantitative relationships in real life situations and use these to solve problems.
Paper and Pen Test (Refer to attached post-assessment)
Items 15, 16, 17, 18, 19 and 20
1 point for every correct response
The learner is able to formulate real-life problems involving linear functions and solve these with utmost accuracy using a variety of strategies.
Your student is a barangay councilor in San Sebastian. Every month he conducts information drive on the different issues that concern every member in the community through the use of leaflets. For the nextmonth, his focus is on electricity consumption of every household. He is tasked to prepare a leafletdesign which will clearly explain about electricity bill and consumption. Include recommendations that will help lessen electricity utilization. He is expected to orally present your design totheotherofficialsinyourbarangay. He will be assessed according to the following criteria: (1) use of appropriate mathematical concepts and accuracy, (2) organization, (3) quality of presentation, and (4) practicality of recommendations.
Rubric on Problem Posing / Formulation and Problem SolvingCriteria: Relevant Creative Insightful Authentic Clear
Rubric on CoordinArt MakingCriteria: Creative Accurate Authentic Neatness
Rubric on Leaflet DesignCriteria: Use of mathematical concepts and
accuracy Organization Quality of presentation Practicality of recommendations
130
131
C. Planning for Teaching-Learning
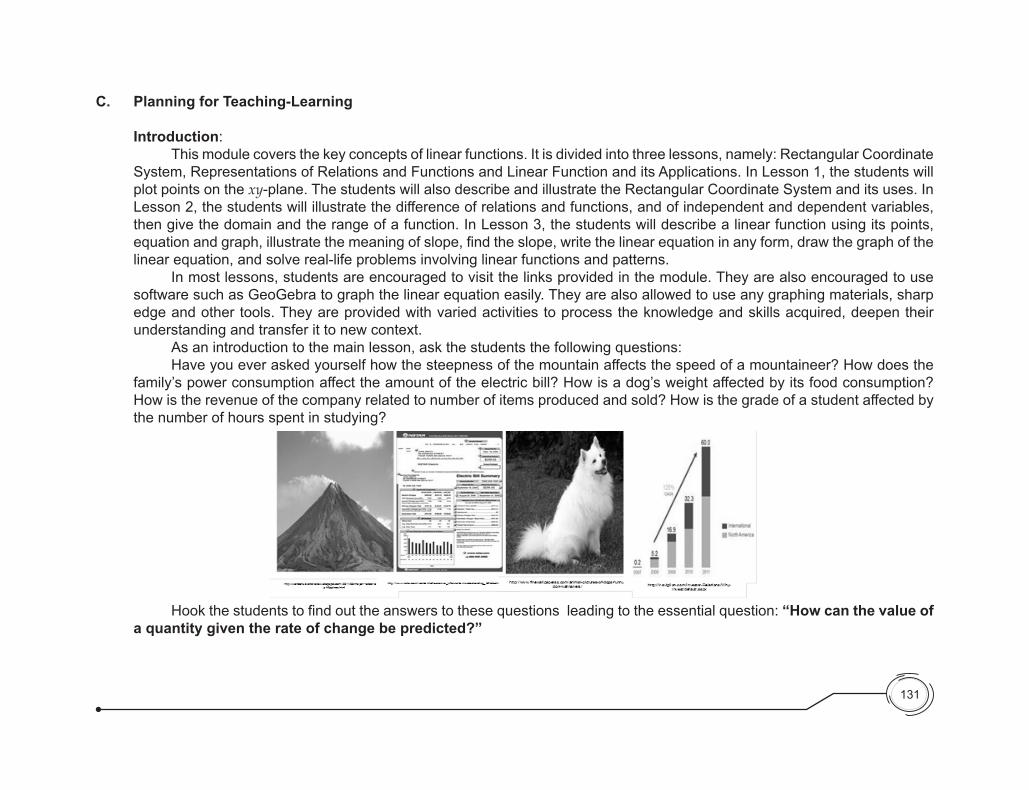
Introduction: This module covers the key concepts of linear functions. It is divided into three lessons, namely: Rectangular Coordinate System, Representations of Relations and Functions and Linear Function and its Applications. In Lesson 1, the students will plot points on the xy-plane. The students will also describe and illustrate the Rectangular Coordinate System and its uses. In Lesson 2, the students will illustrate the difference of relations and functions, and of independent and dependent variables, then give the domain and the range of a function. In Lesson 3, the students will describe a linear function using its points, equationandgraph,illustratethemeaningofslope,findtheslope,writethelinearequationinanyform,drawthegraphofthelinear equation, and solve real-life problems involving linear functions and patterns. In most lessons, students are encouraged to visit the links provided in the module. They are also encouraged to use software such as GeoGebra to graph the linear equation easily. They are also allowed to use any graphing materials, sharp edge and other tools. They are provided with varied activities to process the knowledge and skills acquired, deepen their understanding and transfer it to new context. As an introduction to the main lesson, ask the students the following questions: Have you ever asked yourself how the steepness of the mountain affects the speed of a mountaineer? How does the family’s power consumption affect the amount of the electric bill? How is a dog’s weight affected by its food consumption? How is the revenue of the company related to number of items produced and sold? How is the grade of a student affected by the number of hours spent in studying?
Hookthestudentstofindouttheanswerstothesequestionsleadingtotheessentialquestion:“How can the value of a quantity given the rate of change be predicted?”
132
Objectives:
After the learners have gone through the lessons contained in this module, they are expected to:
1. describe and illustrate the Rectangular Coordinate System and its uses; 2. describe and plot positions on the coordinate plane using the coordinate axes;3. definerelationandfunction;4. illustrate a relation and a function;5. determine if a given relation is a function using ordered pairs, graphs and equations;6. differentiate between dependent and independent variables; 7. describe the domain and range of a function.8. definelinearfunction;9. describe a linear function using its points, equation and graph;10. identify the domain and range of a linear function;11. illustrate the meaning of the slope of a line;12. findtheslopeofalinegiventwopoints,equationandgraph;13. determine whether a function is linear given the table;14. write the linear equation Ax + By = C in the form y = mx + b and vice-versa;15. graph a linear equation given (a) any two points, (b) the x-intercept and y-intercept, (c) the slope and a point on the line,
(d) the slope and y-intercept;16. describe the graph of a linear equation in terms of its intercepts and slope;17. findtheequationofalinegiven(a)twopoints;(b)theslopeandapoint;(c)theslopeanditsintercept;and18. solve real-life problems involving linear functions and patterns.

133
Pre–test
Direction: Read the questions carefully. Write the letter that corresponds to your answer on a separate sheet of paper.
1. What is the Rectangular Coordinate System? a. It is used for naming points in a plane. b. It is a plane used for graphing linear functions. c. It is used to determine the location of a point by using a single number. d. It is a two-dimensional plane which is divided by the axes into four regions called quadrants. Answer: D
2. Which of the following is true about the points in Figure 1? a. J is located in Quadrant III. b. C is located in Quadant II. c. B is located in Quadrant IV. d. G is located in Quadrant III. Answer: D
3. WhichofthefollowingsetsoforderedpairsdoesNOTdefineafunction? a. {(3, 2), (-3, 6), (3, -2), (-3, -6)} b. {(1, 2), (2, 6), (3, -2), (4, -6)} c. {(2, 2), (2, 3), (2, 4), (2, -9)} d. {(4, 4), (-3, 4), (4, -4), (-3, -4)} Answer: B
4. What is the domain of the relation shown in Figure 2? a. {x|x ∈ ℜ} c. {x|x > -2} b. {x|x≥ 0} d. {x|x≥ -2} Answer: D
G
B
D F
CH
y
x
J
Figure 1
Figure 2

134
5. Determine the slope of the line 3x + y = 7.
a. 3 c. 13
b. -3 d. - 13 Answer: B
6. Rewrite 2x + 5y = 10 in the slope-intercept form.
a. y = 25 x + 2 c. y = 2
5 x + 10
b. y = 25 x + 2 d. y = 2
5 x + 10
Answer: A
7. Find the equation of the line with the slope -2 and passing through (5, 4). a. y = 2x + 1 c. y = 2x + 14 b. y = -2x + 1 d. y = -2x + 14 Answer: D
8. Which line passes through the points (3, 4) and (8, -1)? a. y = -x + 7 c. y = x + 7 b. y = -x−1 d. y = x−1 Answer: A
9. Jonathan has a job mowing lawns in his neighborhood. He works up to 10 hours per week and gets paid Php 25 per hour. Identify the independent variable.
a. the job c. the lawn mowing b. the total pay d. the number of hours worked Answer: D
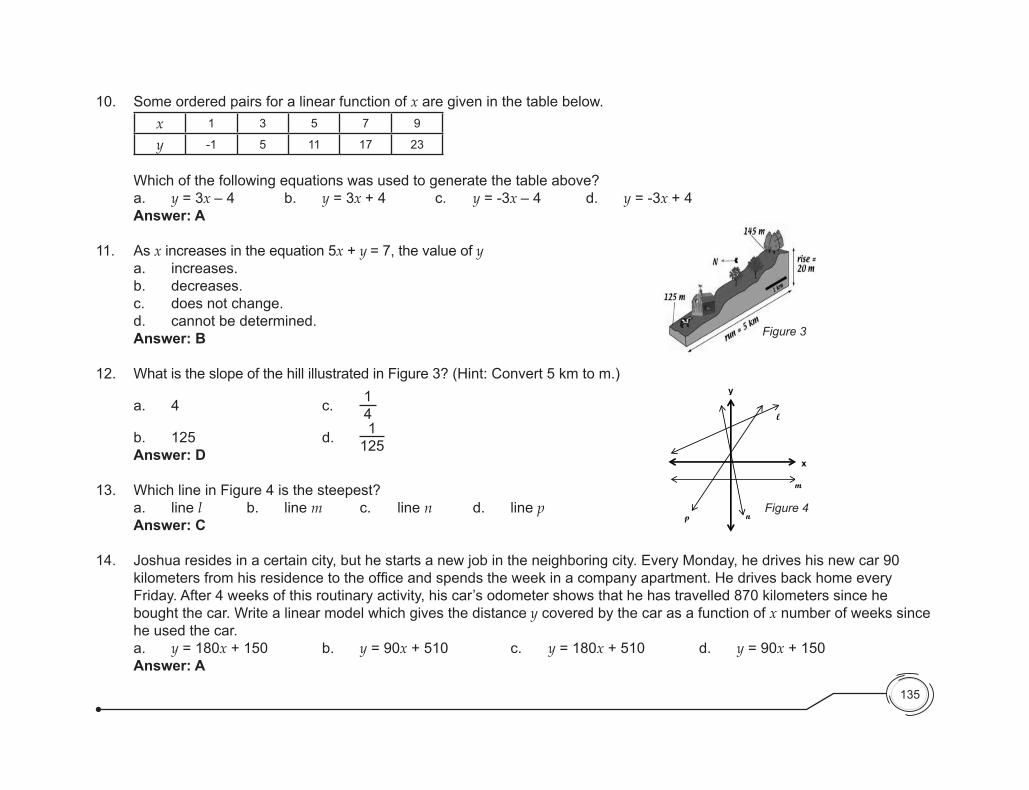
10. Some ordered pairs for a linear function of x are given in the table below.x 1 3 5 7 9
y -1 5 11 17 23
Which of the following equations was used to generate the table above? a. y = 3x – 4 b. y = 3x + 4 c. y = -3x – 4 d. y = -3x + 4 Answer: A
11. As x increases in the equation 5x + y = 7, the value of y a. increases. b. decreases. c. does not change. d. cannot be determined. Answer: B
12. What is the slope of the hill illustrated in Figure 3? (Hint: Convert 5 km to m.)
a. 4 c. 14
b. 125 d. 1125 Answer: D
13. Which line in Figure 4 is the steepest? a. line l b. line m c. line n d. line p Answer: C
14. Joshua resides in a certain city, but he starts a new job in the neighboring city. Every Monday, he drives his new car 90 kilometersfromhisresidencetotheofficeandspendstheweekinacompanyapartment.HedrivesbackhomeeveryFriday. After 4 weeks of this routinary activity, his car’s odometer shows that he has travelled 870 kilometers since he bought the car. Write a linear model which gives the distance y covered by the car as a function of x number of weeks since he used the car.
a. y = 180x + 150 b. y = 90x + 510 c. y = 180x + 510 d. y = 90x + 150 Answer: A
135
Figure 3
Figure 4n p
m
x
l
y
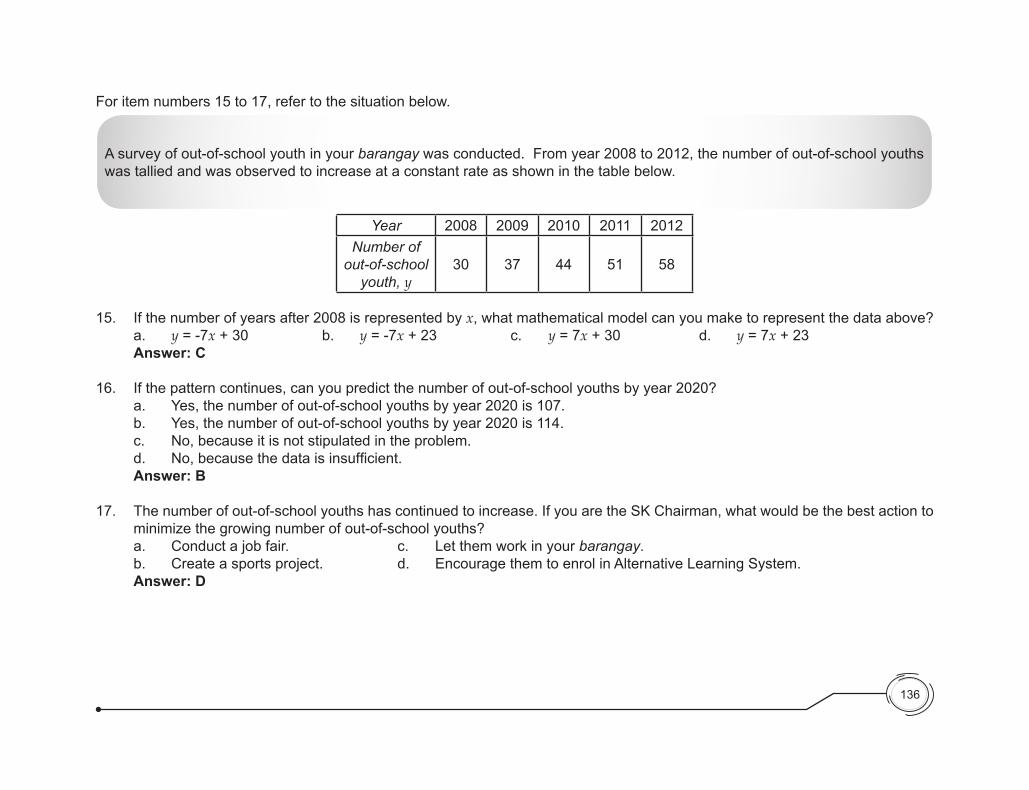
For item numbers 15 to 17, refer to the situation below.
Year 2008 2009 2010 2011 2012Number of
out-of-school youth, y
30 37 44 51 58
15. If the number of years after 2008 is represented by x, what mathematical model can you make to represent the data above? a. y = -7x + 30 b. y = -7x + 23 c. y = 7x + 30 d. y = 7x + 23 Answer: C
16. If the pattern continues, can you predict the number of out-of-school youths by year 2020? a. Yes, the number of out-of-school youths by year 2020 is 107. b. Yes, the number of out-of-school youths by year 2020 is 114. c. No, because it is not stipulated in the problem. d. No,becausethedataisinsufficient. Answer: B
17. The number of out-of-school youths has continued to increase. If you are the SK Chairman, what would be the best action to minimize the growing number of out-of-school youths?
a. Conduct a job fair. c. Let them work in your barangay. b. Create a sports project. d. Encourage them to enrol in Alternative Learning System. Answer: D
136
A survey of out-of-school youth in your barangay was conducted. From year 2008 to 2012, the number of out-of-school youths was tallied and was observed to increase at a constant rate as shown in the table below.
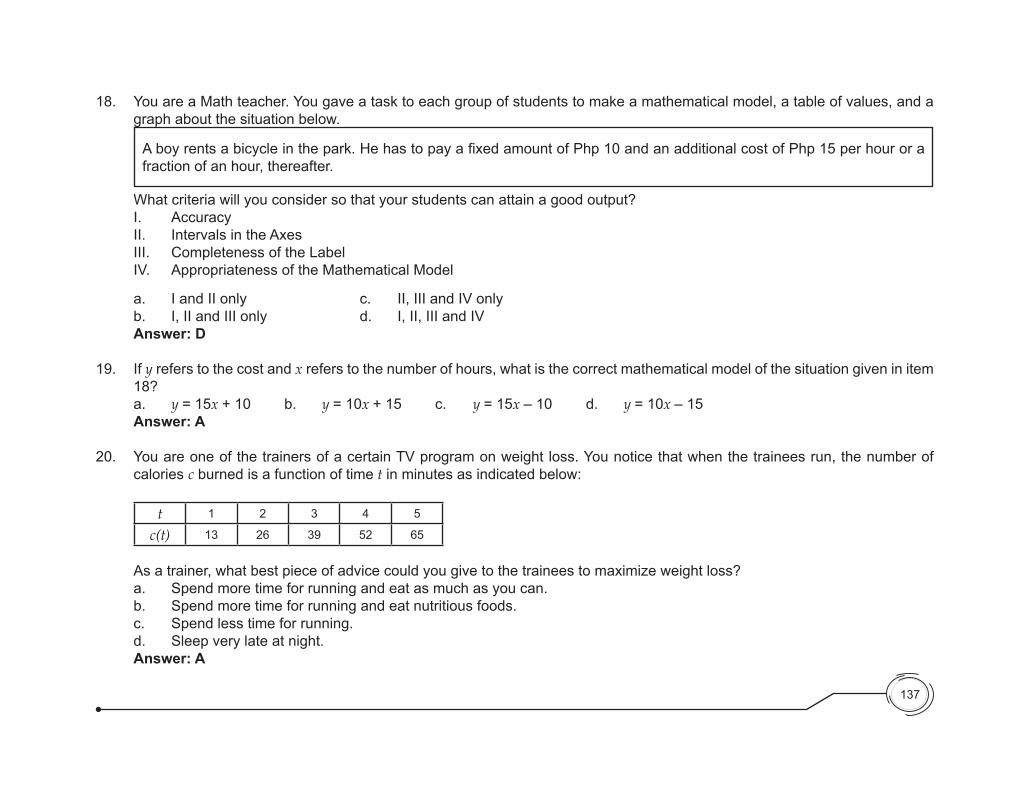
18. You are a Math teacher. You gave a task to each group of students to make a mathematical model, a table of values, and a graph about the situation below.
Aboyrentsabicycleinthepark.HehastopayafixedamountofPhp10andanadditionalcostofPhp15perhourorafraction of an hour, thereafter.
What criteria will you consider so that your students can attain a good output? I. Accuracy II. Intervals in the Axes III. Completeness of the Label IV. Appropriateness of the Mathematical Model
a. I and II only c. II, III and IV only b. I, II and III only d. I, II, III and IV Answer: D
19. If y refers to the cost and x refers to the number of hours, what is the correct mathematical model of the situation given in item 18?
a. y = 15x + 10 b. y = 10x + 15 c. y = 15x – 10 d. y = 10x – 15 Answer: A
20. You are one of the trainers of a certain TV program on weight loss. You notice that when the trainees run, the number of calories c burned is a function of time t in minutes as indicated below:
t 1 2 3 4 5
c(t) 13 26 39 52 65
As a trainer, what best piece of advice could you give to the trainees to maximize weight loss? a. Spend more time for running and eat as much as you can. b. Spend more time for running and eat nutritious foods. c. Spend less time for running. d. Sleep very late at night. Answer: A
137

138
What to KnowWhat to Know
Provide students the opportunity to recall the binary operations and the cardinality of sets as well as the number line. Ask them to perform Activities 1 and 2. In Activity 1, you may use colorful chips, cartolinas, or any tangible objects to represent colors of each set. This is an opening activity so allow them to be motivated for them to be eager to learn more in this module. You may modify the activity based on the availability of materials. As you go through with the activities, let them realize the importance of Rectangular Coordinate System in real life. Pose the topical Essential Question: How can the Rectangular Coordinate System be used in real life?
Answers Key
Activity 11. A ∪ B = {red, blue, orange, violet, white}
2. A ∩ B = {red}
3. A ∪ A ∪ C = {red, blue, orange, violet, white, black}
4. n(A ∪ A) = 5
5. n(A ∩ B) = 1
6. A ∩ C = {blue}
7. A ∩ B ∩ C = { }
8. A ∩ (B ∪ C) = {red, blue}
9. n(A∩(B∪C)) = 2
Lesson 11 Rectangular Coordinate System
What to KnowWhat to Know
Let’s start this module by reviewing the important lessons on “Sets.” As you go through this part, keep on thinking about this question: How can the Rectangular Coordinate System be used in real life?
RECALLING SETSActivity 1
Description: This activity will help you recall the concept of sets and the basic operations on sets.
Direction: Let A = {red, blue, orange}, B = {red, violet, white} and C = {black, blue}. Find the following.
1. A ∪ B 4. n(A ∪ B) 7. A ∩ B ∩ C 2. A ∩ B 5. n(A ∩ B) 8. A ∩(B ∪ C) 3. A ∪ B ∪ C 6. A ∩ C 9. n(A ∩ (B ∪ C))
QU
ESTIONS? Haveyouencountereddifficultyinthislesson?Ifyes,whatisit?
BOWOWOW!Activity 2
Description: This activity is in the form of a game which will help you recall the concept of number line.
Direction: Do as directed the given tasks.1. Group yourselves into 9 or 11 members. 2. Form a line facing your classmates. 3. Assign integers which are arranged from least to greatest to each
group member from left to right. 4. Assign zero to the group member at the middle. 5. Recite the number assigned to you.
Teacher’s Note and RemindersDon’tForget!
139
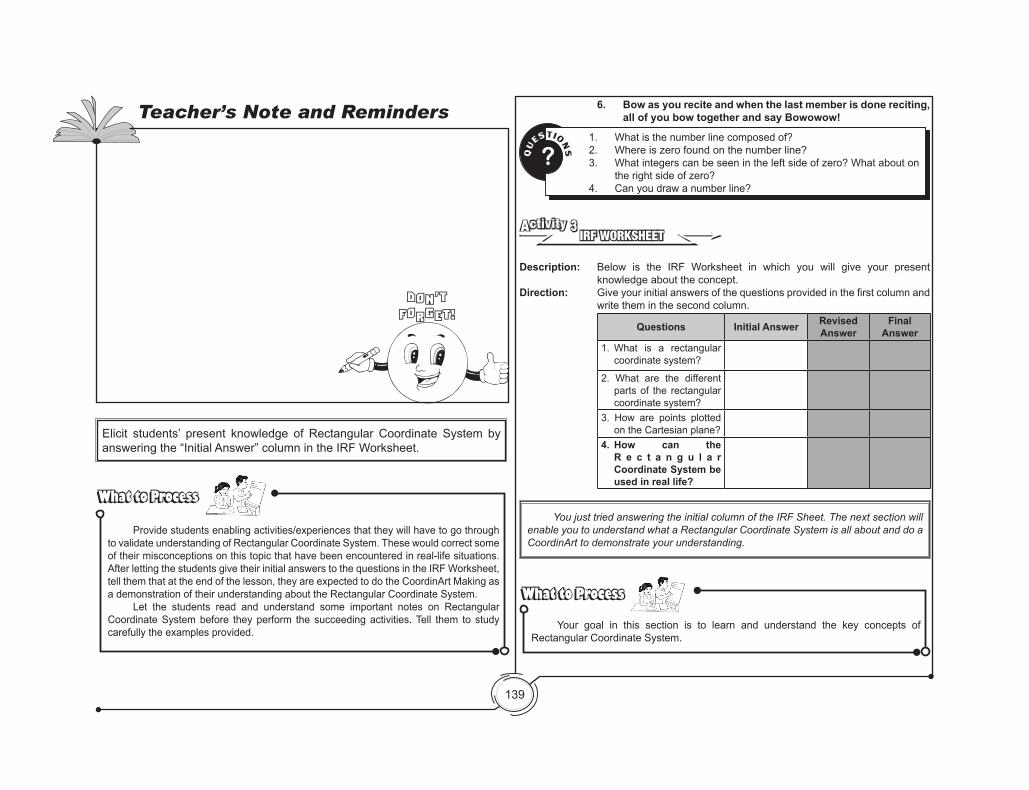
Elicit students’ present knowledge of Rectangular Coordinate System by answering the “Initial Answer” column in the IRF Worksheet.
6. Bow as you recite and when the last member is done reciting, all of you bow together and say Bowowow!
QU
ESTIONS?
1. What is the number line composed of?2. Where is zero found on the number line?3. What integers can be seen in the left side of zero? What about on
the right side of zero?4. Can you draw a number line?
IRF WORKSHEET Activity 3
Description: Below is the IRF Worksheet in which you will give your present knowledge about the concept.
Direction: Giveyourinitialanswersofthequestionsprovidedinthefirstcolumnandwrite them in the second column.
Questions Initial Answer Revised Answer
Final Answer
1. What is a rectangular coordinate system?
2. What are the different parts of the rectangular coordinate system?
3. How are points plotted on the Cartesian plane?
4. How can the R e c t a n g u l a r Coordinate System be used in real life?
You just tried answering the initial column of the IRF Sheet. The next section will enable you to understand what a Rectangular Coordinate System is all about and do a CoordinArt to demonstrate your understanding.
Your goal in this section is to learn and understand the key concepts of Rectangular Coordinate System.
What to ProcessWhat to Process
Teacher’s Note and Reminders
Don’tForget!
What to ProcessWhat to Process
Provide students enabling activities/experiences that they will have to go through to validate understanding of Rectangular Coordinate System. These would correct some of their misconceptions on this topic that have been encountered in real-life situations. After letting the students give their initial answers to the questions in the IRF Worksheet, tell them that at the end of the lesson, they are expected to do the CoordinArt Making as a demonstration of their understanding about the Rectangular Coordinate System. Let the students read and understand some important notes on Rectangular Coordinate System before they perform the succeeding activities. Tell them to study carefully the examples provided.
140
Rectangular Coordinate System is introduced using the concept of sets. You have learned the binary operations of sets: union and intersection. Recall that A ∪ B and A∩B aredefinedasfollows:
A ∪ B = {x│x ∈ A or x ∈ B} A∩B = {x│x ∈ A and x ∈ B} The product set or Cartesian product of nonempty sets A and B, written as A × B and read “A cross B,” is the set of all ordered pairs (a, b) such that a ∈ A and b ∈ B. In symbols, .Illustrative Examples:
Let A = {2, 3, 5} and B = {0, 5}. Find (a) A × B and (b) B × A.
Solution:
A × B = {(2, 0), (2, 5), (3, 0), (3, 5), (5, 0), (5, 5)} B × A = {(0, 2), (5, 2), (0, 3), (5, 3), (0, 5), (5, 5)}
The cardinality of set A is 3, symbolized as n(A) = 3. The cardinality of a set is the number of elements in the set. The cardinality of A × B, written as n(A × B), can be determined by multiplying the cardinality of A and the cardinality of B. That is,
n(A × B) = n(A)•n(B)
Illustrative Examples:
Let A = {2, 3, 5} and B = {0, 5}. Find (a) n(A × B), and (b) n(B × A).
Questions:
Is n(A × B) = n(B × A)? Why?
Answers to the Questions:
Yes, n(A × B) = n(B × A).
It is because n(A × B) = n(B × A)implies n(A)•n(B) = n(B)•n(A) and it holds by Multiplication Property of Equality.
Solution:
n(A × B) = 3 ∙ 2 = 6 n(B × A) = 2 ∙ 3 = 6
QU
ESTIONS? What can you conclude?
Teacher’s Note and Reminders
Don’tForget!
141
Answers to the Exercises:
Exercise 1. Given that A = {4, 7, 8} and B = {5, 6}, find the following:1. A × B = {(4, 5), (4, 6), (7, 5), (7, 6), (8, 5), (8, 6)} 2. B × A = {(5, 4), (6, 4), (5, 7), (6, 7), (5, 8), (6, 8)} 3. n(A × B) = 64. n(B × A) = 6Exercise 2. Find (a) X × Y, (b) Y × X, (c) n(X × Y), and (d) n(Y × X) given the following sets X and Y:1. X = {2, 3} and Y = {8, 3} (a) X × Y = {(2, 8), {2, 3), (3, 8), (3, 3)} (b) Y × X = {(8, 2), {3, 2), (8, 3), (3, 3)} (c) n(X × Y) = 4 (d) n(Y × X) = 42. X = {1, 3, 6} and Y = {1, 5} (a) X × Y = {(1, 1), {1, 5), (3, 1), (3, 5), (6, 1), (6, 5)} (b) Y × X = {(1, 1), {5, 1), (1, 3), (5, 3), (1, 6), (5, 6)} (c) n(X × Y) = 6 (d) n(Y × X) = 63. X = {2, 5, 8, 9} and Y = {0, 8} (a) X × Y = {(2, 0), {2, 8), (5, 0), (5, 8), (8, 0), (8, 8), (9, 0), (9, 8)} (b) X × Y = {(0, 2), {8, 2), (0, 5), (8, 5), (0, 8), (8, 8), (0, 9), (8, 9)} (c) n(X × Y) = 8 (d) n(Y × X) = 84. X = {a, e, i, o, u} and Y = {y│y is a letter of the word paper}.
(a) X × Y = {(a, p), {a, a), (a, e), (a, r), (e, p), (e, a), (e, e), (e, r), (i, p), (i, a), (i, e), (i, r), (o, p), (o, a), (o, e), (o, r), (u, p), (u, a), (u, e), (u, r)}
(b) Y × X = {(p, a), {a, a), (e, a), (r, a), (p, e), (a, e), (e, e), (r, e), (p, i), (a, i), (e, i), (r, i), (p, o), (a, o), (e, o), (r, o), (p, u), (a, u), (e, u), (r, u)}
(c) n(X × Y) = 20 (d) n(Y × X) = 8
5. X = {x│1<x<10,x is a prime number} and Y = {y│y ∈ N,1<y<3} (a) X × Y = {(2, 2), {3, 2), (5, 2), (7, 2)} (b) X × Y = {(2, 2), {2, 3), (2, 5), (2, 7)} (c) n(X × Y) = 4 (d) n(Y × X) = 4
State your conclusions by competing the statements below using the correct relation symbol=or≠.
For any nonempty sets A and B, 1. n(A × B) ___ n(B × A).2. A × B ___ B × A.
Exercise 1 Given that A = {4, 7, 8} and B={5,6},findthefollowing: 1. A × B 3. n(A × B) 2. B × A 4. n(B × A)
Exercise 2 Find (a) X × Y, (b) Y × X, (c) n(X × Y), and (d) n(Y × X) given the following sets X and Y: 1. X = {2, 3} and Y = {8, 3} 2. X = {1, 3, 6} and Y = {1, 5} 3. X = {2, 5, 8, 9} and Y = {0, 8} 4. X = {a, e, i, o, u} and Y = {y│y is a letter of the word paper}. 5. X = {x│1<x<10,x is a prime number} and Y = {y│y ∈ N,1<y<3}
Let ℜ be the set of real numbers. The notation ℜ2 is the set of ordered pairs (x, y), where x and y ∈ ℜ; that is,
ℜ2 = ℜ × ℜ = {(x, y)│x ∈ ℜ, y ∈ ℜ}.
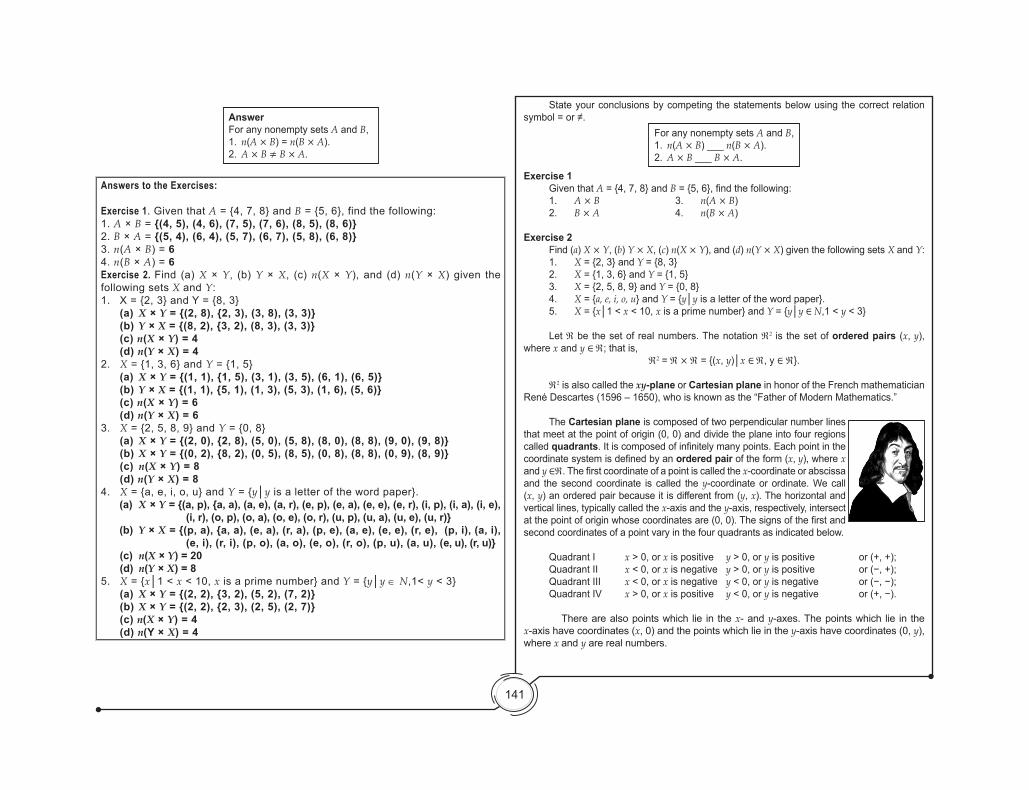
ℜ2 is also called the xy-plane or Cartesian plane in honor of the French mathematician René Descartes (1596 – 1650), who is known as the “Father of Modern Mathematics.”
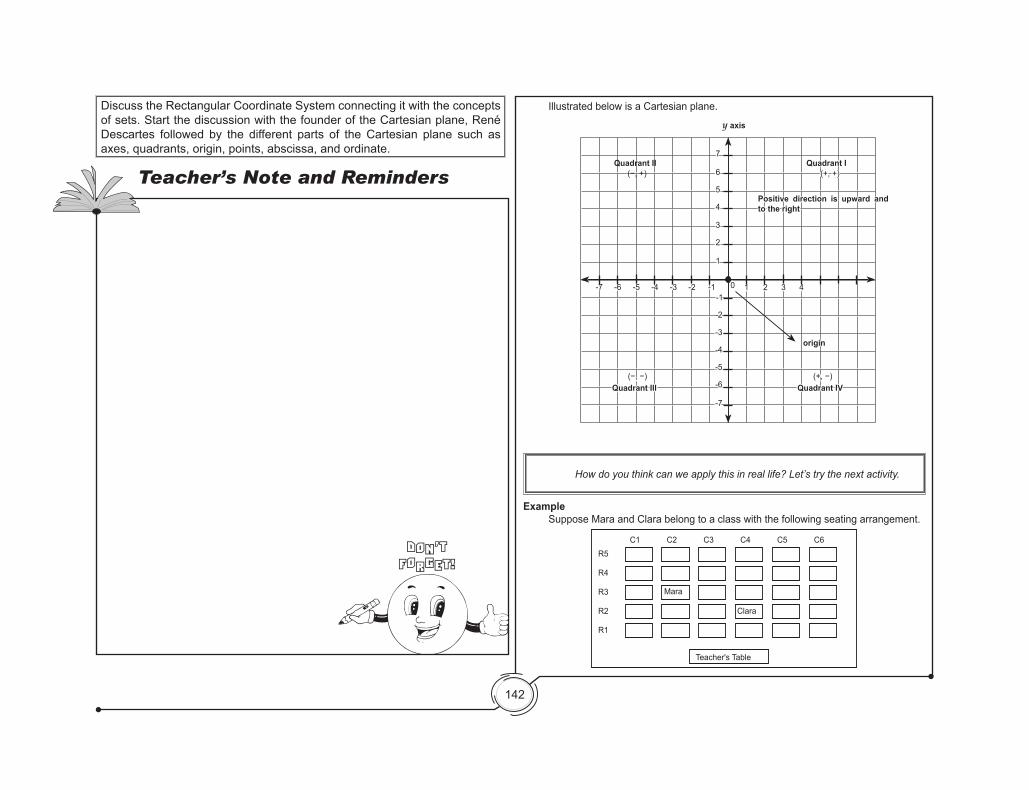
The Cartesian plane is composed of two perpendicular number lines that meet at the point of origin (0, 0) and divide the plane into four regions called quadrants.Itiscomposedofinfinitelymanypoints.Eachpointinthecoordinatesystemisdefinedbyanordered pair of the form (x, y), where x and y ∈ℜ.Thefirstcoordinateofapointiscalledthex-coordinate or abscissa and the second coordinate is called the y-coordinate or ordinate. We call (x, y) an ordered pair because it is different from (y, x). The horizontal and vertical lines, typically called the x-axis and the y-axis, respectively, intersect atthepointoforiginwhosecoordinatesare(0,0).Thesignsofthefirstandsecond coordinates of a point vary in the four quadrants as indicated below.
Quadrant I x > 0, or x is positive y > 0, or y is positive or (+, +); Quadrant II x<0,orx is negative y > 0, or yispositive or(−,+); Quadrant III x<0,orx is negative y<0,oryisnegative or(−,−); Quadrant IV x > 0, or x is positive y<0,oryisnegative or(+,−).
There are also points which lie in the x- and y-axes. The points which lie in the x-axis have coordinates (x, 0) and the points which lie in the y-axis have coordinates (0, y), where x and y are real numbers.
AnswerFor any nonempty sets A and B, 1. n(A × B) = n(B × A).2. A × B ≠ B × A.
142
Discuss the Rectangular Coordinate System connecting it with the concepts of sets. Start the discussion with the founder of the Cartesian plane, René Descartes followed by the different parts of the Cartesian plane such as axes, quadrants, origin, points, abscissa, and ordinate.
Teacher’s Note and Reminders
Don’tForget!
-4
-5
-1
-3
Illustrated below is a Cartesian plane.
1
2
3
4
5
6
7
-7
-6
-2
-1-2-3-4-5-6-7 0 1 2 3 4
origin
y axis
(+,−)Quadrant IV
(−,−)Quadrant III
(+, +)Quadrant I
(−,+)Quadrant II
Positive direction is upward and to the right
How do you think can we apply this in real life? Let’s try the next activity.
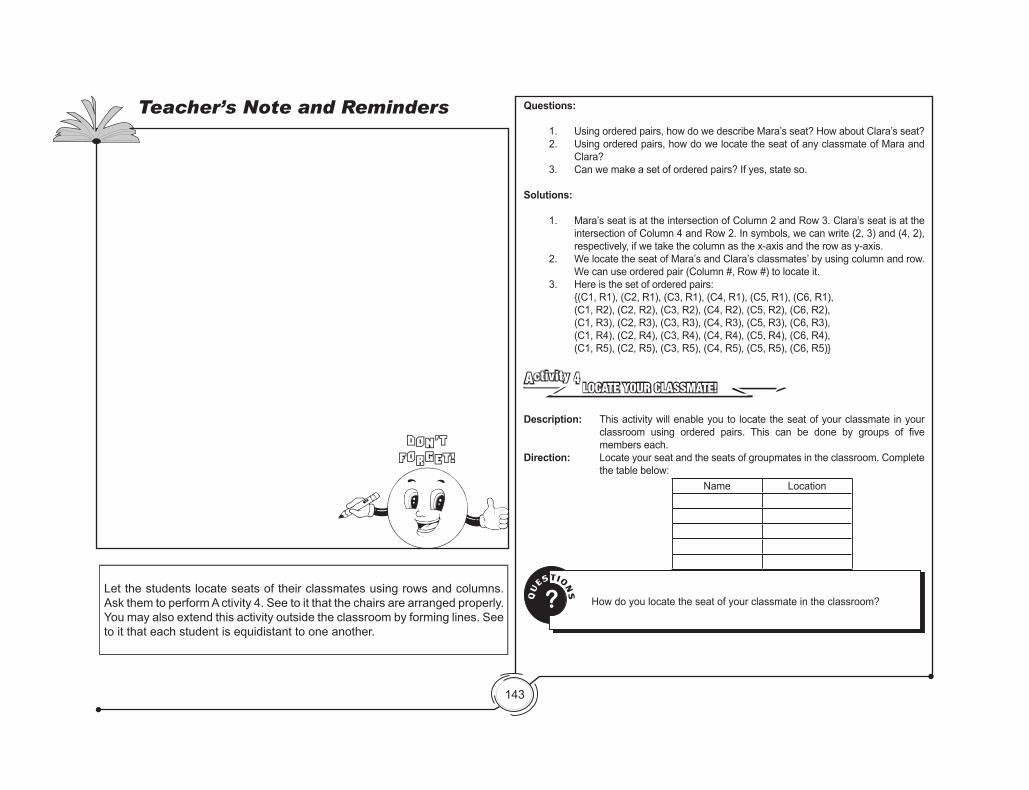
Example Suppose Mara and Clara belong to a class with the following seating arrangement.
Teacher's Table
C1
R1
R2
R3 Mara
Clara
R4
R5C2 C3 C4 C5 C6
143
Let the students locate seats of their classmates using rows and columns. Ask them to perform A ctivity 4. See to it that the chairs are arranged properly. You may also extend this activity outside the classroom by forming lines. See to it that each student is equidistant to one another.
Teacher’s Note and Reminders
Don’tForget!
Questions:
1. Using ordered pairs, how do we describe Mara’s seat? How about Clara’s seat?2. Using ordered pairs, how do we locate the seat of any classmate of Mara and
Clara?3. Can we make a set of ordered pairs? If yes, state so.
Solutions:
1. Mara’s seat is at the intersection of Column 2 and Row 3. Clara’s seat is at the intersection of Column 4 and Row 2. In symbols, we can write (2, 3) and (4, 2), respectively, if we take the column as the x-axis and the row as y-axis.
2. We locate the seat of Mara’s and Clara’s classmates’ by using column and row. We can use ordered pair (Column #, Row #) to locate it.
3. Here is the set of ordered pairs: {(C1, R1), (C2, R1), (C3, R1), (C4, R1), (C5, R1), (C6, R1), (C1, R2), (C2, R2), (C3, R2), (C4, R2), (C5, R2), (C6, R2), (C1, R3), (C2, R3), (C3, R3), (C4, R3), (C5, R3), (C6, R3), (C1, R4), (C2, R4), (C3, R4), (C4, R4), (C5, R4), (C6, R4), (C1, R5), (C2, R5), (C3, R5), (C4, R5), (C5, R5), (C6, R5)}
LOCATE YOUR CLASSMATE!Activity 4
Description: This activity will enable you to locate the seat of your classmate in your classroom using ordered pairs. This can be done by groups of fivemembers each.
Direction: Locate your seat and the seats of groupmates in the classroom. Complete the table below:
Name Location
QU
ESTIONS? How do you locate the seat of your classmate in the classroom?
144
Teacher’s Note and Reminders
Let the students experience decribing the coordinates of locations in real life by performing Activities 6 and 7.
Don’tForget!
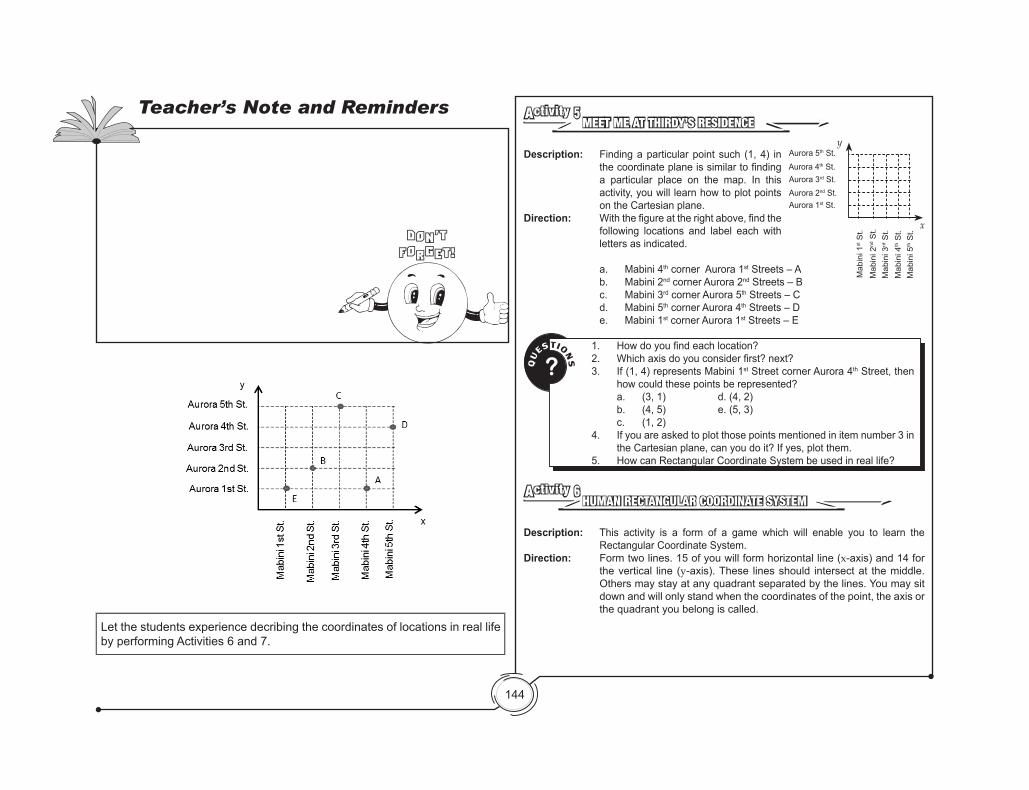
MEET ME AT THIRDY’S RESIDENCEActivity 5
Description: Finding a particular point such (1, 4) in thecoordinateplaneissimilartofindinga particular place on the map. In this activity, you will learn how to plot points on the Cartesian plane.
Direction: Withthefigureattherightabove,findthefollowing locations and label each with letters as indicated.
a. Mabini 4th corner Aurora 1st Streets – A b. Mabini 2nd corner Aurora 2nd Streets – B c. Mabini 3rd corner Aurora 5th Streets – C d. Mabini 5th corner Aurora 4th Streets – D e. Mabini 1st corner Aurora 1st Streets – E
yAurora 5th St.Aurora 4th St.Aurora 3rd St.Aurora 2nd St.Aurora 1st St.
Mab
ini 1
st S
t.M
abin
i 2nd
St.
Mab
ini 3
rd S
t.M
abin
i 4th S
t.M
abin
i 5th S
t.
x
QU
ESTIONS?
1. Howdoyoufindeachlocation?2. Whichaxisdoyouconsiderfirst?next?3. If (1, 4) represents Mabini 1st Street corner Aurora 4th Street, then
how could these points be represented? a. (3, 1) d. (4, 2) b. (4, 5) e. (5, 3) c. (1, 2)4. If you are asked to plot those points mentioned in item number 3 in
the Cartesian plane, can you do it? If yes, plot them.5. How can Rectangular Coordinate System be used in real life?
HUMAN RECTANGULAR COORDINATE SYSTEMActivity 6
Description: This activity is a form of a game which will enable you to learn the Rectangular Coordinate System.
Direction: Form two lines. 15 of you will form horizontal line (x-axis) and 14 for the vertical line (y-axis). These lines should intersect at the middle. Others may stay at any quadrant separated by the lines. You may sit down and will only stand when the coordinates of the point, the axis or the quadrant you belong is called.

145
Teacher’s Note and Reminders
Don’tForget!
QU
ESTIONS?
1. What is the Rectangular Coordinate System composed of?2. Where do you see the origin?3. What are the signs of coordinates of the points in each quadrant? a. Quadrant I b. Quadrant II c. Quadrant III d. Quadrant IV
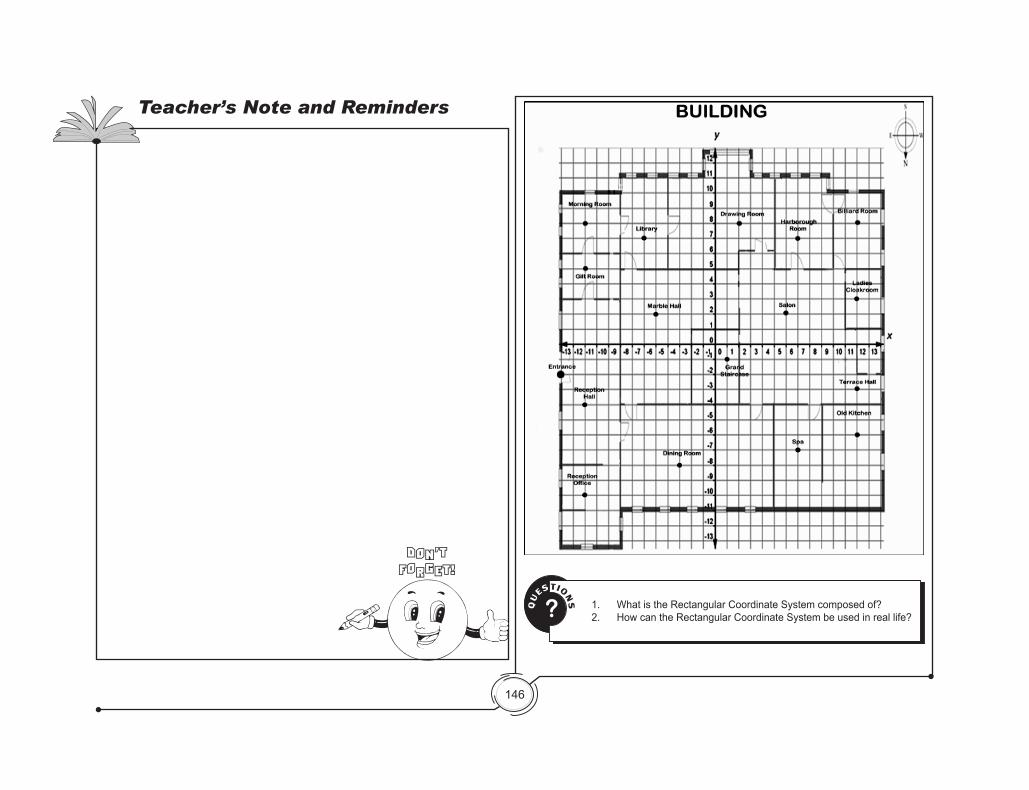
PARTS OF THE BUILDINGActivity 7
Description: This activity will enable you to give the coordinates of the part of building.Direction: Describe the location of each point below by completing the following
table. An example is done for. Note that the point indicates the center of the given part of the building.
Parts of the Building Coordinates Quadrant Parts of the
Building Coordinates Quadrant
Example: Morning Room (-11, 8) II
1. Gilt Room
8. Marble Hall
2. Terrace Hall
9. Reception Office
3. Old Kitchen
10. Drawing Room
4. Billiard Room 11. Entrance
5. Salon 12. library6. Reception Hall 13. Spa
7. Grand Staircase
14. Harborough Room
Parts of the Building Coordinates Quadrant Parts of the
Building Coordinates Quadrant
Example: Morning Room (-11, 8) II
1. Gilt Room (-11, 5) II 8. Marble
Hall (-5, 2) II
2. Terrace Hall (12, -3) IV 9. Reception
Office (-11, -10) III
3. Old Kitchen (12, -6) IV 10. Drawing
Room (2, 8) I
4. Billiard Room (12, 8) I 11. Entrance (-13, -2) III
5. Salon (6, 2) I 12. library (-6, 7) II6. Reception Hall (-11, -4) III 13. Spa (7, -7) IV
7. Grand Staircase (1, -1) IV 14. Harborough
Room (7, 7) I
146
Teacher’s Note and Reminders
Don’tForget!
QU
ESTIONS? 1. What is the Rectangular Coordinate System composed of?
2. How can the Rectangular Coordinate System be used in real life?
147
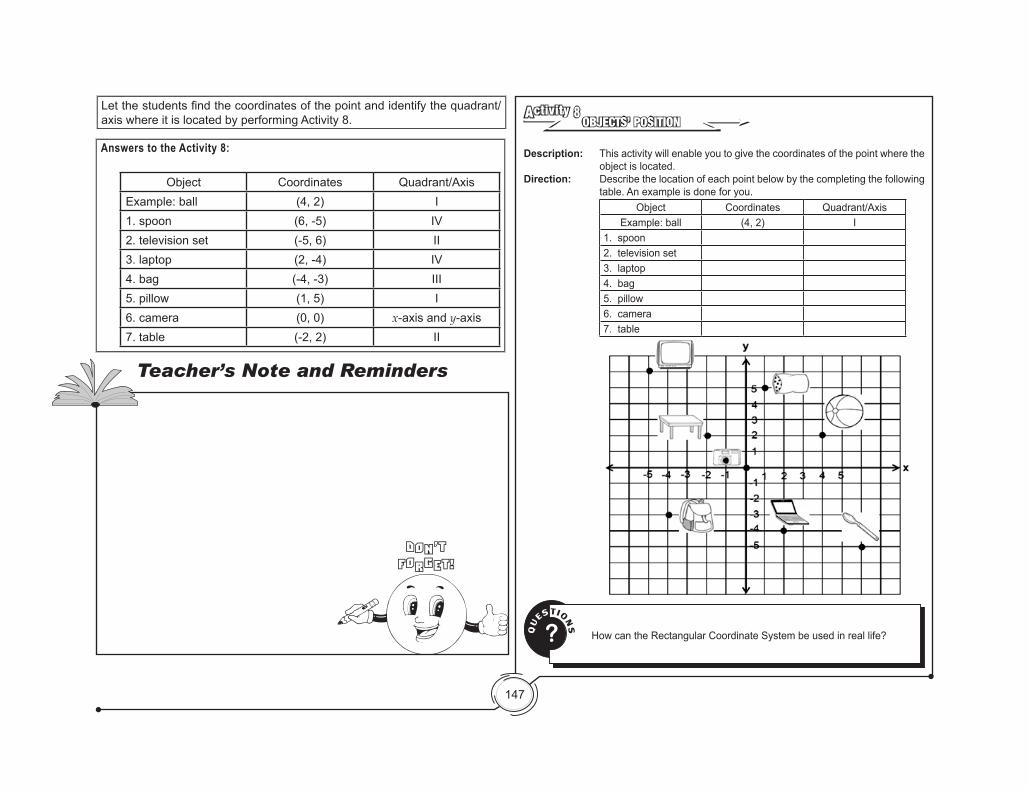
Letthestudentsfindthecoordinatesofthepointandidentifythequadrant/axis where it is located by performing Activity 8.
Teacher’s Note and Reminders
Don’tForget!
OBJECTS’ POSITIONActivity 8
Description: This activity will enable you to give the coordinates of the point where the object is located.
Direction: Describe the location of each point below by the completing the following table. An example is done for you.
Object Coordinates Quadrant/AxisExample: ball (4, 2) I
1. spoon2. television set3. laptop4. bag5. pillow6. camera7. table
QU
ESTIONS? How can the Rectangular Coordinate System be used in real life?
Answers to the Activity 8:
Object Coordinates Quadrant/AxisExample: ball (4, 2) I1. spoon (6, -5) IV2. television set (-5, 6) II3. laptop (2, -4) IV4. bag (-4, -3) III5. pillow (1, 5) I6. camera (0, 0) x-axis and y-axis7. table (-2, 2) II
148
Answer to Exercise 3
y
x-1
-2
-3
-4
-5
-6
-7
-8
-9
-10
-11
-12
-13
4
5
6
7
8
11
12
10
9
3
2
1
-1-3-4-5-6-7-8-9-10-11-12-13 -2 1 2 3 4 5 6 7 8 9 10 11 12 13
0
A
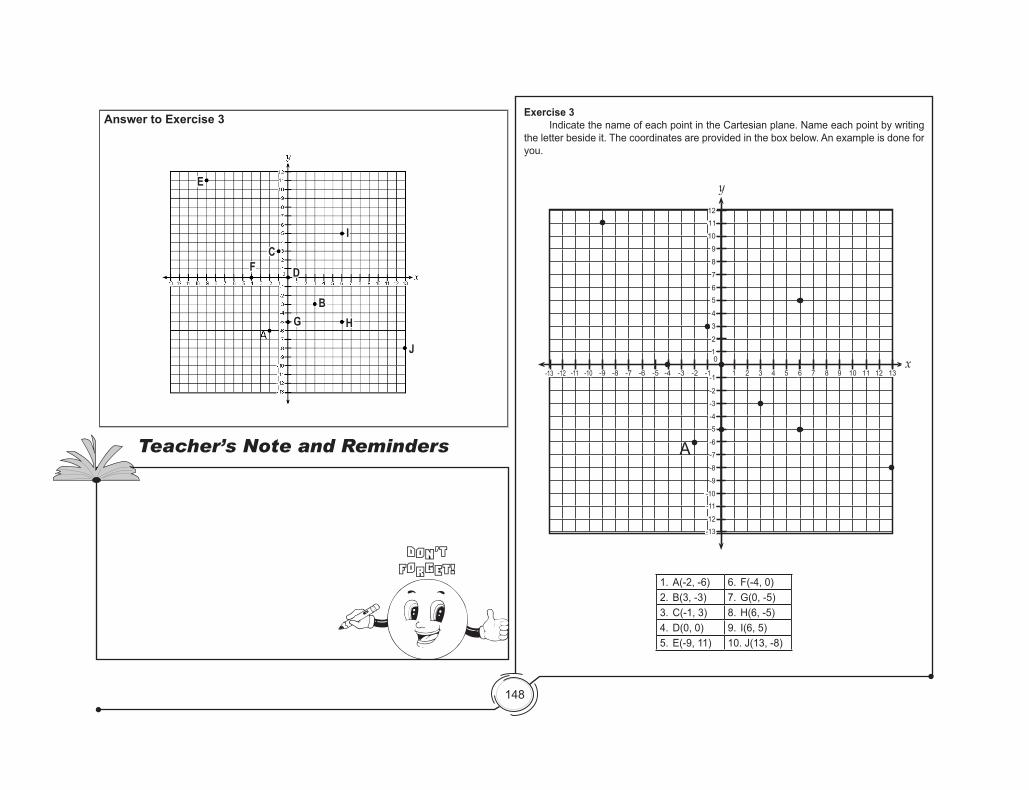
Exercise 3 Indicate the name of each point in the Cartesian plane. Name each point by writing the letter beside it. The coordinates are provided in the box below. An example is done for you.
1. A(-2, -6) 6. F(-4, 0)2. B(3, -3) 7. G(0, -5)3. C(-1, 3) 8. H(6, -5)4. D(0, 0) 9. I(6, 5)5. E(-9, 11) 10. J(13, -8)
E
CD
GB
H
J
I
F
Teacher’s Note and Reminders
Don’tForget!
149
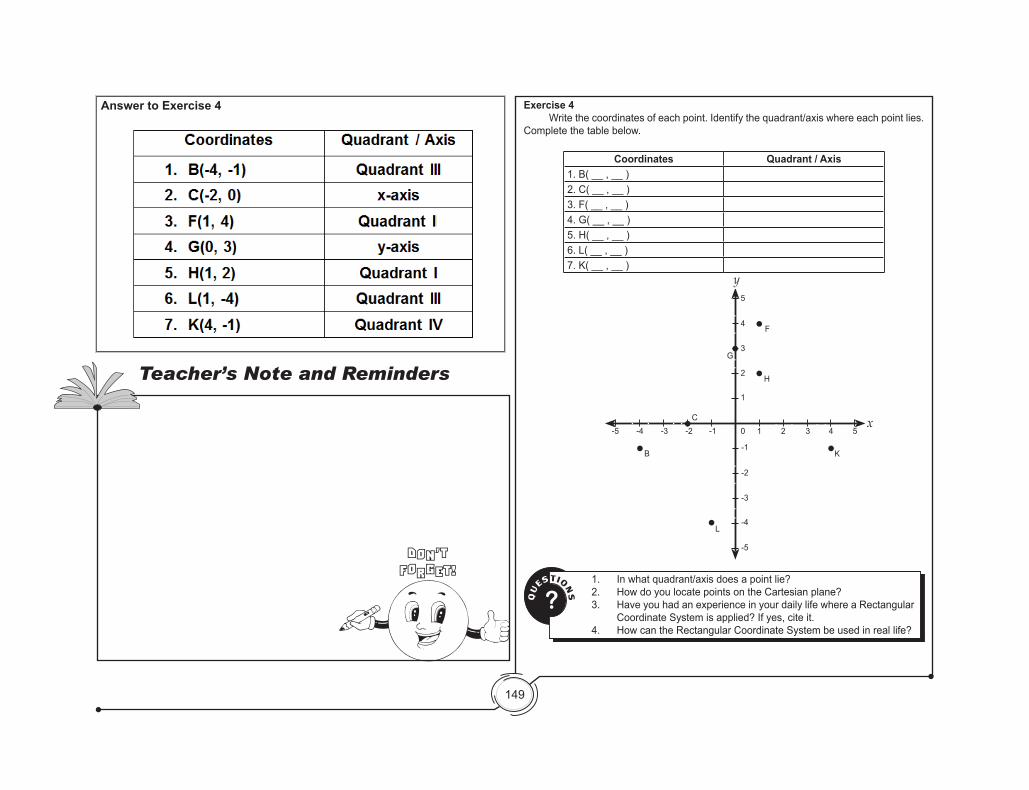
Answer to Exercise 4
Teacher’s Note and Reminders
Don’tForget!
QU
ESTIONS?
1. In what quadrant/axis does a point lie? 2. How do you locate points on the Cartesian plane?3. Have you had an experience in your daily life where a Rectangular
Coordinate System is applied? If yes, cite it.4. How can the Rectangular Coordinate System be used in real life?
Exercise 4 Write the coordinates of each point. Identify the quadrant/axis where each point lies. Complete the table below.
Coordinates Quadrant / Axis1. B( __ , __ )2. C( __ , __ )3. F( __ , __ )4. G( __ , __ )5. H( __ , __ )6. L( __ , __ )7. K( __ , __ )
2
2
3
3
4
5
4
K
51
1
-1
-1
-2
-2
-3
-3
-4
-4
-5
-5 0
F
G
H
C
B
L
y
x
150
Let the students perform Activity 9 by revisiting the IRF Worksheet. Consider this activity as part of a formative assessment. Compare their revised answers to their initial answers. Pose again the topical Essential Question: How can the Rectangular Coordinate System be used in real life?
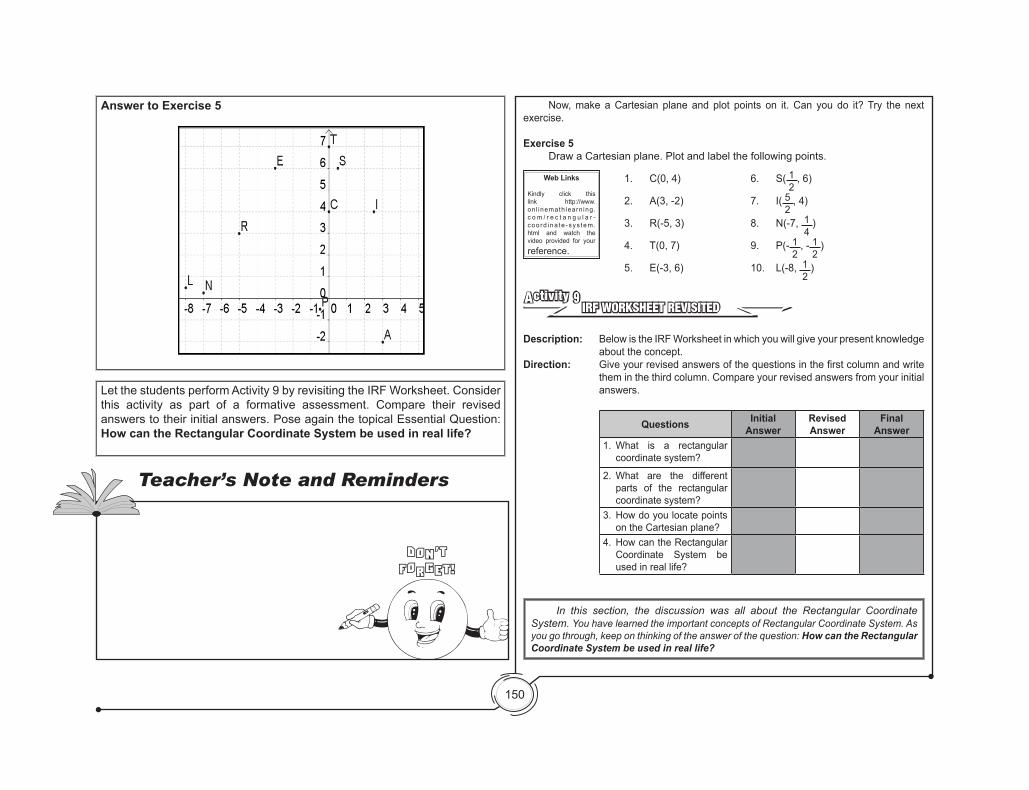
Now, make a Cartesian plane and plot points on it. Can you do it? Try the next exercise.
Exercise 5 Draw a Cartesian plane. Plot and label the following points.
1. C(0, 4) 6. S( 12
, 6)
2. A(3, -2) 7. I( 52
, 4)
3. R(-5, 3) 8. N(-7, 14
)
4. T(0, 7) 9. P(- 12
, - 12
)
5. E(-3, 6) 10. L(-8, 12
)
IRF WORKSHEET REVISITEDActivity 9
Description: Below is the IRF Worksheet in which you will give your present knowledge about the concept.
Direction: Giveyourrevisedanswersofthequestionsinthefirstcolumnandwritethem in the third column. Compare your revised answers from your initial answers.
Questions Initial Answer
Revised Answer
Final Answer
1. What is a rectangular coordinate system?
2. What are the different parts of the rectangular coordinate system?
3. How do you locate points on the Cartesian plane?
4. How can the Rectangular Coordinate System be used in real life?
Web Links
Kindly click this link http://www.on l inemath learn ing .c o m / r e c t a n g u l a r -c o o r d i n a t e - s y s t e m .html and watch the video provided for your
reference.
In this section, the discussion was all about the Rectangular Coordinate System. You have learned the important concepts of Rectangular Coordinate System. As you go through, keep on thinking of the answer of the question: How can the Rectangular Coordinate System be used in real life?
Answer to Exercise 5
Teacher’s Note and Reminders
Don’tForget!
151
Don’tForget!
What to UnderstandWhat to Understand Your goal in this section is to take a closer look at some aspects of the topic.
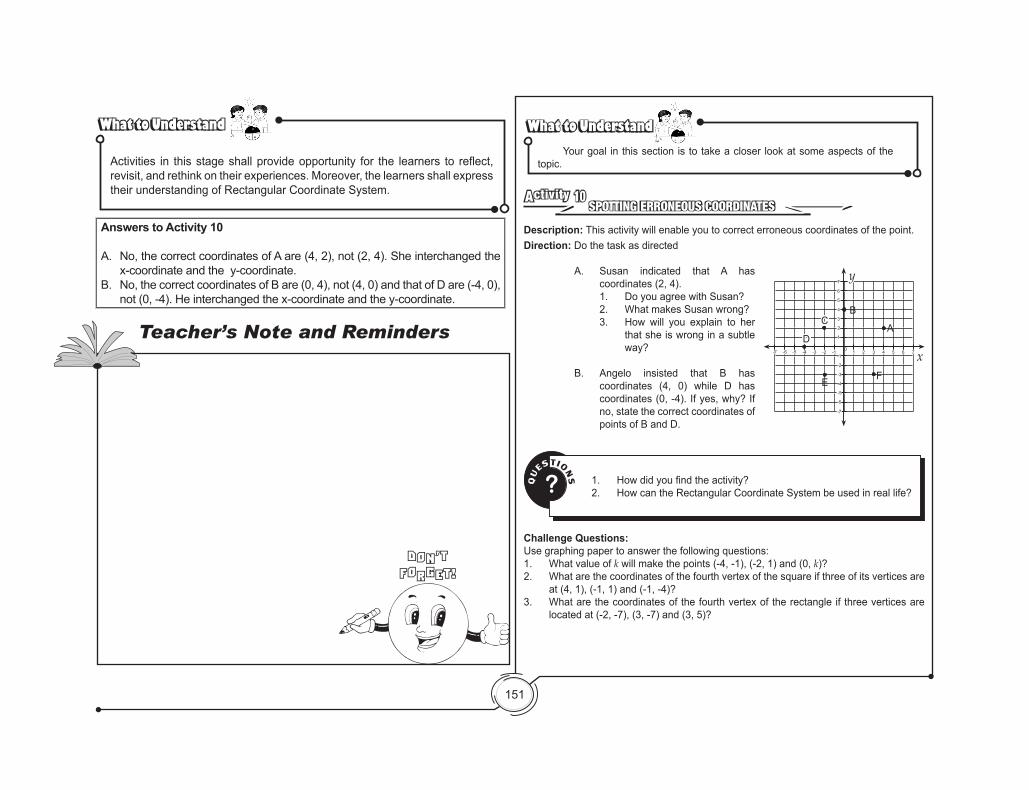
SPOTTING ERRONEOUS COORDINATESActivity 10
Direction: Do the task as directed
A. Susan indicated that A has coordinates (2, 4).
1. Do you agree with Susan? 2. What makes Susan wrong?
3. How will you explain to her that she is wrong in a subtle way?
B. Angelo insisted that B has coordinates (4, 0) while D has coordinates (0, -4). If yes, why? If no, state the correct coordinates of points of B and D.
Description: This activity will enable you to correct erroneous coordinates of the point.
x
y
-1-1
-3
-3
-4
-4
-5
-5
-6
-6
-2
-2
2
3
4
5
6
7
1
1 2 3 4 5 6 70
AC
D
E F
B
-7
-7
Answers to Activity 10
A. No, the correct coordinates of A are (4, 2), not (2, 4). She interchanged the x-coordinate and the y-coordinate.
B. No, the correct coordinates of B are (0, 4), not (4, 0) and that of D are (-4, 0), not (0, -4). He interchanged the x-coordinate and the y-coordinate.
What to UnderstandWhat to Understand
Activities in thisstageshallprovideopportunity for the learners to reflect,revisit, and rethink on their experiences. Moreover, the learners shall express their understanding of Rectangular Coordinate System.
Teacher’s Note and Reminders
QU
ESTIONS? 1. Howdidyoufindtheactivity?
2. How can the Rectangular Coordinate System be used in real life?
Challenge Questions:Use graphing paper to answer the following questions:1. What value of k will make the points (-4, -1), (-2, 1) and (0, k)?2. What are the coordinates of the fourth vertex of the square if three of its vertices are
at (4, 1), (-1, 1) and (-1, -4)? 3. What are the coordinates of the fourth vertex of the rectangle if three vertices are
located at (-2, -7), (3, -7) and (3, 5)?
152
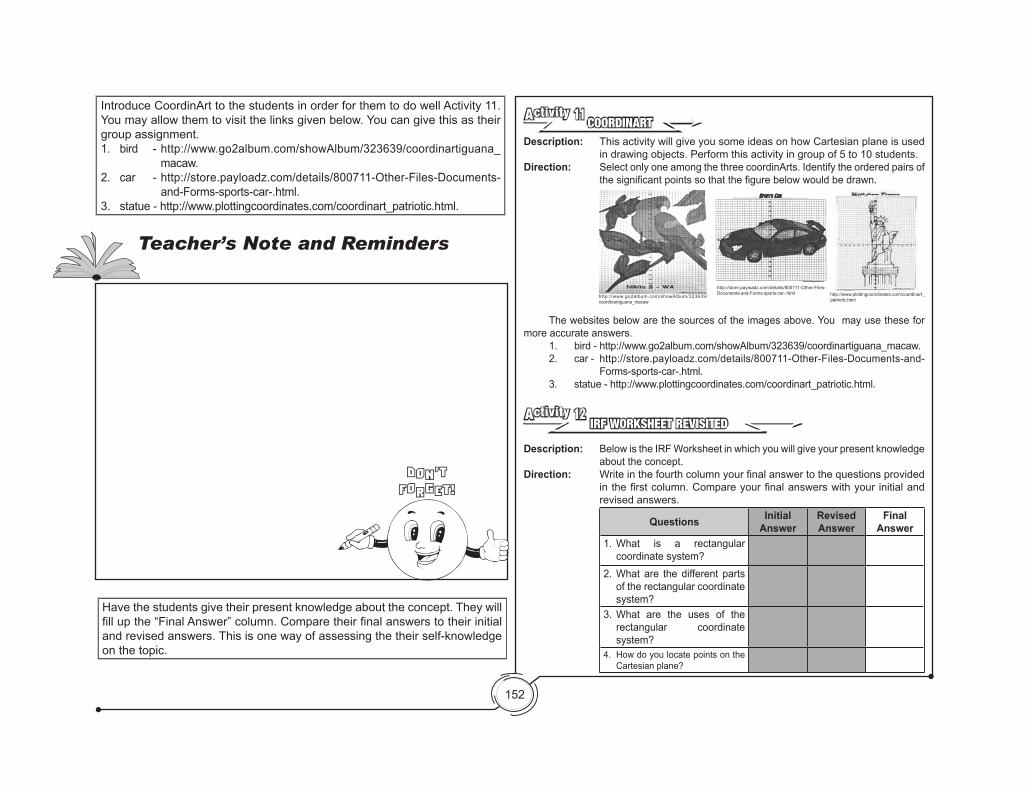
Introduce CoordinArt to the students in order for them to do well Activity 11. You may allow them to visit the links given below. You can give this as their group assignment.1. bird - http://www.go2album.com/showAlbum/323639/coordinartiguana_
macaw. 2. car - http://store.payloadz.com/details/800711-Other-Files-Documents-
and-Forms-sports-car-.html.3. statue - http://www.plottingcoordinates.com/coordinart_patriotic.html.
Have the students give their present knowledge about the concept. They will fillupthe“FinalAnswer”column.Comparetheirfinalanswerstotheirinitialand revised answers. This is one way of assessing the their self-knowledge on the topic.
Teacher’s Note and Reminders
Don’tForget!
COORDINARTActivity 11
Description: This activity will give you some ideas on how Cartesian plane is used in drawing objects. Perform this activity in group of 5 to 10 students.
Direction: Select only one among the three coordinArts. Identify the ordered pairs of thesignificantpointssothatthefigurebelowwouldbedrawn.
The websites below are the sources of the images above. You may use these for more accurate answers. 1. bird - http://www.go2album.com/showAlbum/323639/coordinartiguana_macaw.
2. car - http://store.payloadz.com/details/800711-Other-Files-Documents-and-Forms-sports-car-.html.
3. statue - http://www.plottingcoordinates.com/coordinart_patriotic.html.
IRF WORKSHEET REVISITEDActivity 12
Description: Below is the IRF Worksheet in which you will give your present knowledge about the concept.
Direction: Writeinthefourthcolumnyourfinalanswertothequestionsprovidedinthefirstcolumn.Compareyourfinalanswerswithyourinitialandrevised answers.
Questions Initial Answer
Revised Answer
Final Answer
1. What is a rectangular coordinate system?
2. What are the different parts of the rectangular coordinate system?
3. What are the uses of the rectangular coordinate system?
4. How do you locate points on the Cartesian plane?
http://store.payloadz.com/details/800711-Other-Files-Documents-and-Forms-sports-car-.html http://www.plottingcoordinates.com/coordinart_
patriotic.htmlhttp:/ /www.go2album.com/showAlbum/323639/coordinartiguana_macaw
153
Now that you have a deeper understanding of the topic, you are now ready to do the task in the next section.
QU
ESTIONS? 1. Whathaveyoulearnedaboutthefirstlessoninthismodule?
2. How meaningful is that learning to you?
What to TransferWhat to Transfer Give students the opportunity to demonstrate their understanding of representation of relations and functions by doing a practical task. Let them perform Activity 14. You can ask them to work in groups. Discuss to them the criteria to be used in evaluating their output.
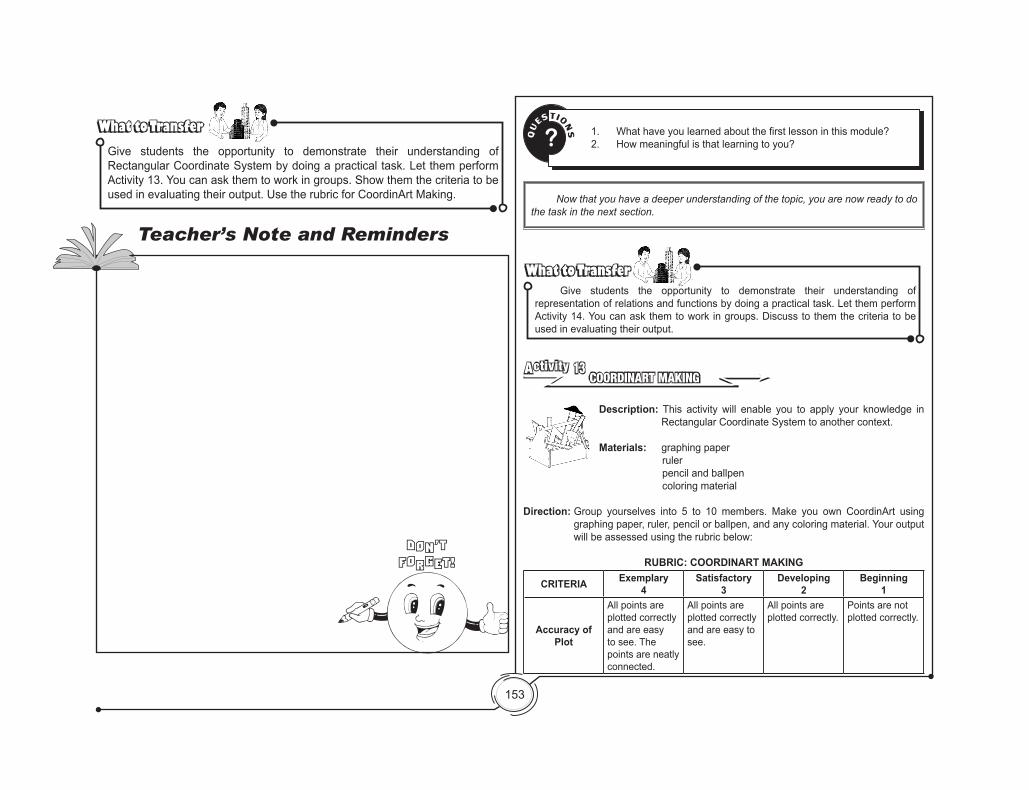
What to TransferWhat to TransferGive students the opportunity to demonstrate their understanding of Rectangular Coordinate System by doing a practical task. Let them perform Activity 13. You can ask them to work in groups. Show them the criteria to be used in evaluating their output. Use the rubric for CoordinArt Making.
COORDINART MAKINGActivity 13
Description: This activity will enable you to apply your knowledge in Rectangular Coordinate System to another context.
Materials: graphing paper ruler pencil and ballpen coloring material
Direction: Group yourselves into 5 to 10 members. Make you own CoordinArt using graphing paper, ruler, pencil or ballpen, and any coloring material. Your output will be assessed using the rubric below:
RUBRIC: COORDINART MAKING
CRITERIA Exemplary4
Satisfactory3
Developing2
Beginning1
Accuracy of Plot
All points are plotted correctly and are easy to see. The points are neatly connected.
All points are plotted correctly and are easy to see.
All points are plotted correctly.
Points are not plotted correctly.
Don’tForget!
Teacher’s Note and Reminders
154
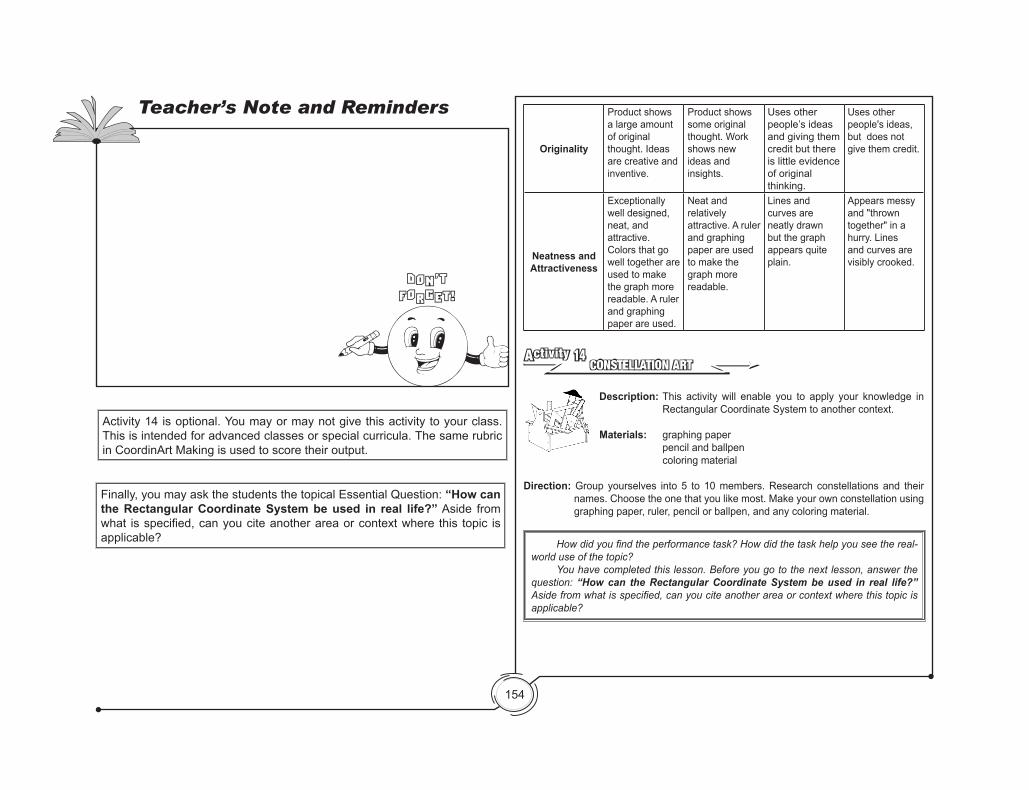
Activity 14 is optional. You may or may not give this activity to your class. This is intended for advanced classes or special curricula. The same rubric in CoordinArt Making is used to score their output.
Finally, you may ask the students the topical Essential Question: “How can the Rectangular Coordinate System be used in real life?” Aside from what isspecified,canyouciteanotherareaorcontextwhere this topic isapplicable?
Teacher’s Note and Reminders
Don’tForget!
Originality
Product shows a large amount of original thought. Ideas are creative and inventive.
Product shows some original thought. Work shows new ideas and insights.
Uses other people’s ideas and giving them credit but there is little evidence of original thinking.
Uses other people's ideas, but does not give them credit.
Neatness and Attractiveness
Exceptionally well designed, neat, and attractive. Colors that go well together are used to make the graph more readable. A ruler and graphing paper are used.
Neat and relatively attractive. A ruler and graphing paper are used to make the graph more readable.
Lines and curves are neatly drawn but the graph appears quite plain.
Appears messy and "thrown together" in a hurry. Lines and curves are visibly crooked.
CONSTELLATION ARTActivity 14
Description: This activity will enable you to apply your knowledge in Rectangular Coordinate System to another context.
Materials: graphing paper pencil and ballpen coloring material
Direction: Group yourselves into 5 to 10 members. Research constellations and their names. Choose the one that you like most. Make your own constellation using graphing paper, ruler, pencil or ballpen, and any coloring material.
Howdidyoufindtheperformancetask?Howdidthetaskhelpyouseethereal-world use of the topic? You have completed this lesson. Before you go to the next lesson, answer the question: “How can the Rectangular Coordinate System be used in real life?” Asidefromwhatisspecified,canyouciteanotherareaorcontextwherethistopicisapplicable?
155
Lesson 22Representations of
Relations and Functions
What to KnowWhat to Know
Let’s start this lesson by looking at the relationship between two things or quantities. As you go through, keep on thinking about this question: How are the quantities related to each other?
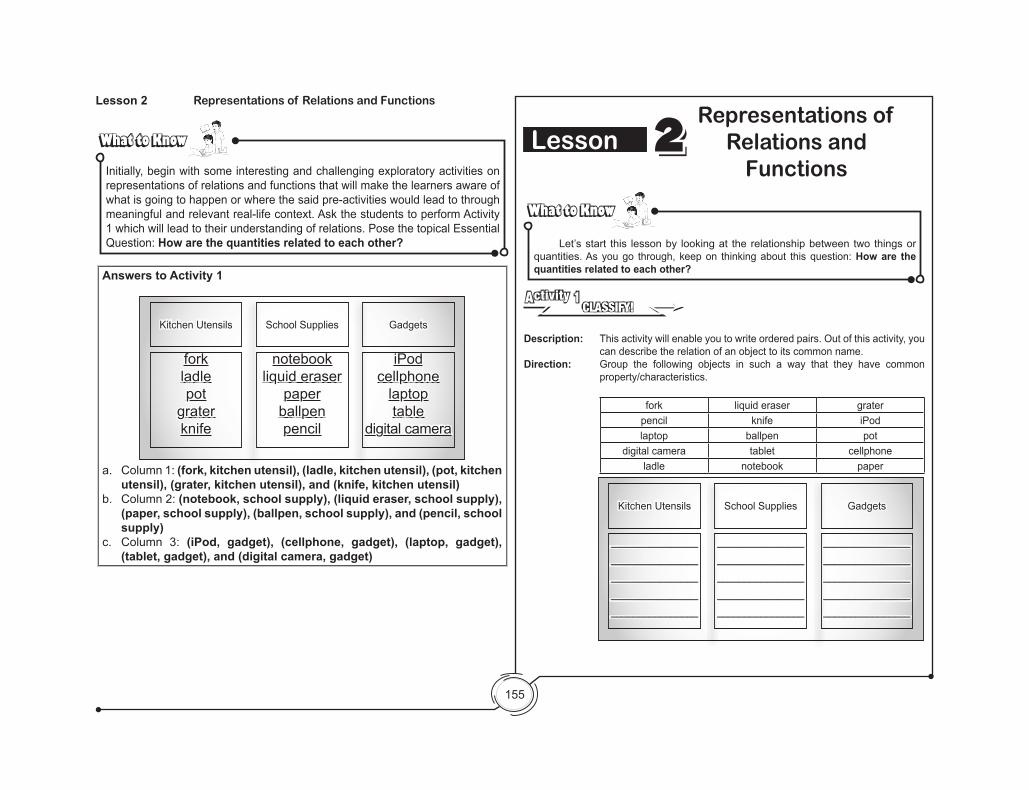
CLASSIFY!Activity 1
Description: This activity will enable you to write ordered pairs. Out of this activity, you can describe the relation of an object to its common name.
Direction: Group the following objects in such a way that they have common property/characteristics.
fork liquid eraser graterpencil knife iPodlaptop ballpen pot
digital camera tablet cellphoneladle notebook paper
Kitchen Utensils School Supplies Gadgets
________________________________________________________________________________
________________________________________________________________________________
________________________________________________________________________________
Lesson 2 Representations of Relations and Functions
What to KnowWhat to Know
Initially, begin with some interesting and challenging exploratory activities on representations of relations and functions that will make the learners aware of what is going to happen or where the said pre-activities would lead to through meaningful and relevant real-life context. Ask the students to perform Activity 1 which will lead to their understanding of relations. Pose the topical Essential Question: How are the quantities related to each other?
Answers to Activity 1
Kitchen Utensils School Supplies Gadgets
forkladlepot
graterknife
notebookliquid eraser
paperballpenpencil
iPodcellphone
laptoptable
digital camera
a. Column 1: (fork, kitchen utensil), (ladle, kitchen utensil), (pot, kitchen utensil), (grater, kitchen utensil), and (knife, kitchen utensil)
b. Column 2: (notebook, school supply), (liquid eraser, school supply), (paper, school supply), (ballpen, school supply), and (pencil, school supply)
c. Column 3: (iPod, gadget), (cellphone, gadget), (laptop, gadget), (tablet, gadget), and (digital camera, gadget)
156
Form some ordered pairs using the format: (object, common name).a. Column 1: _________________________________________b. Column 2: _________________________________________c. Column 3: _________________________________________
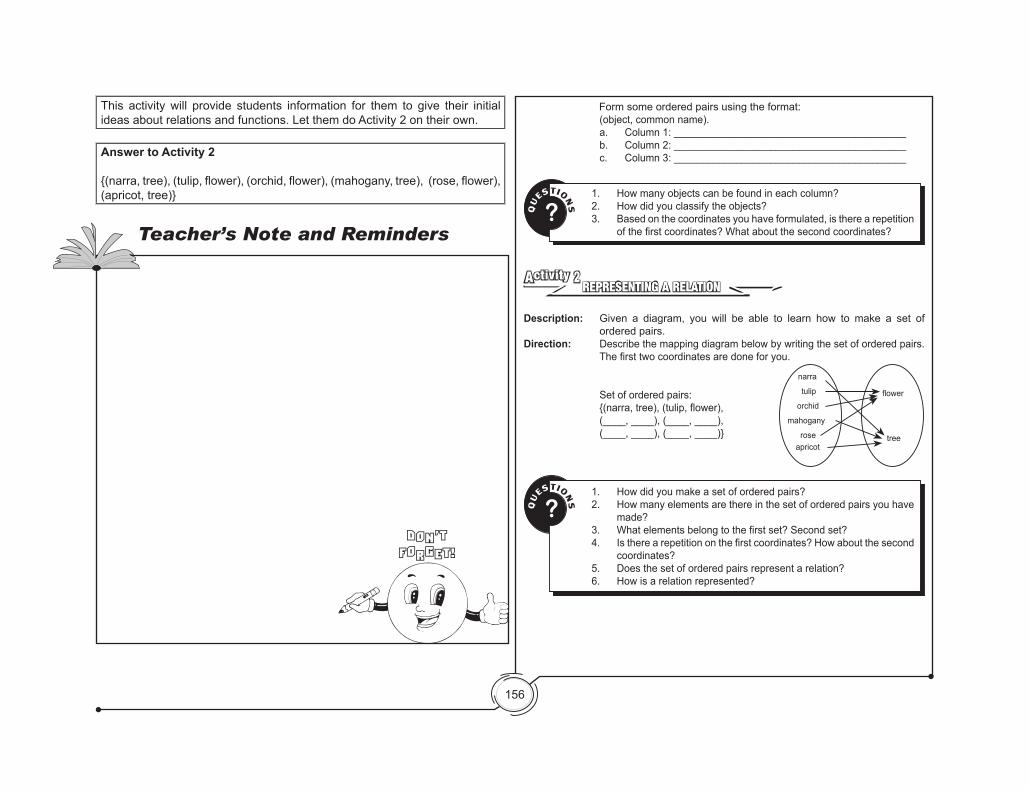
REPRESENTING A RELATIONActivity 2
Description: Given a diagram, you will be able to learn how to make a set of ordered pairs.
Direction: Describe the mapping diagram below by writing the set of ordered pairs. Thefirsttwocoordinatesaredoneforyou.
Set of ordered pairs:{(narra,tree),(tulip,flower),(____, ____), (____, ____), (____, ____), (____, ____)}
QU
ESTIONS?
1. How many objects can be found in each column?2. How did you classify the objects?3. Based on the coordinates you have formulated, is there a repetition
ofthefirstcoordinates?Whataboutthesecondcoordinates?
QU
ESTIONS?
1. How did you make a set of ordered pairs?2. How many elements are there in the set of ordered pairs you have
made?3. Whatelementsbelongtothefirstset?Secondset?4. Istherearepetitiononthefirstcoordinates?Howaboutthesecond
coordinates? 5. Does the set of ordered pairs represent a relation? 6. How is a relation represented?
flower
narra
tulip
orchid
mahogany
roseapricot
tree
This activity will provide students information for them to give their initial ideas about relations and functions. Let them do Activity 2 on their own.
Answer to Activity 2
{(narra,tree),(tulip,flower),(orchid,flower),(mahogany,tree),(rose,flower),(apricot, tree)}
Teacher’s Note and Reminders
Don’tForget!
157
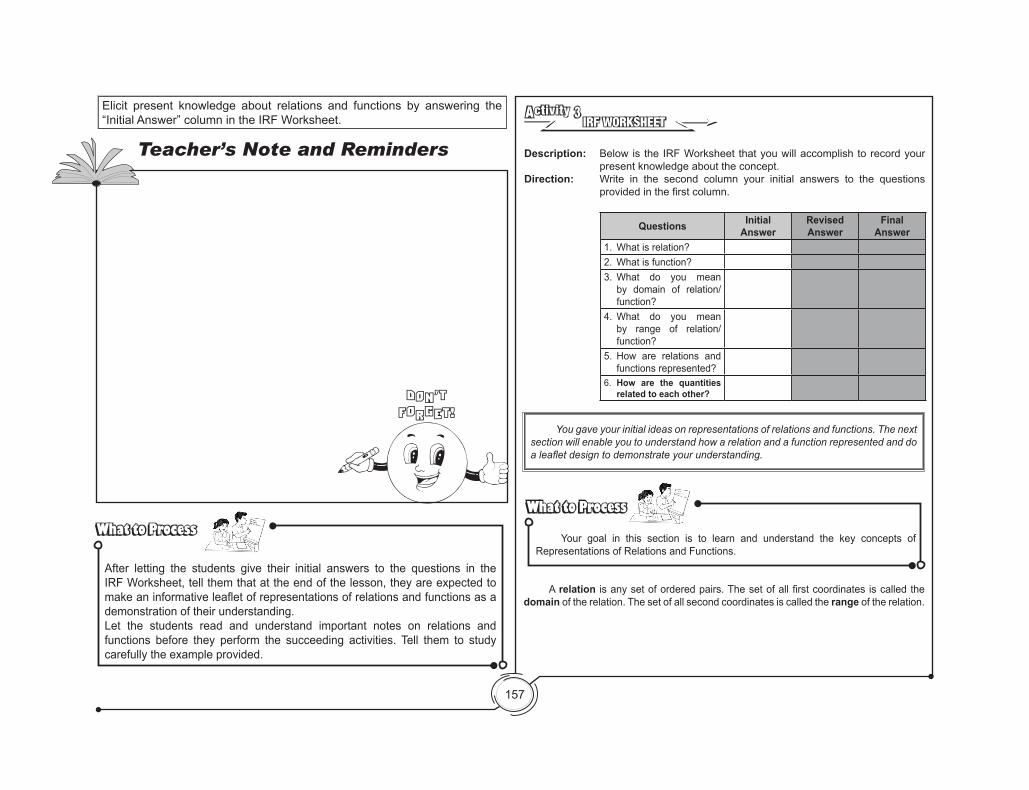
Elicit present knowledge about relations and functions by answering the “Initial Answer” column in the IRF Worksheet.
Teacher’s Note and Reminders
Don’tForget!
IRF WORKSHEETActivity 3
Description: Below is the IRF Worksheet that you will accomplish to record your present knowledge about the concept.
Direction: Write in the second column your initial answers to the questions providedinthefirstcolumn.
Questions Initial Answer
Revised Answer
Final Answer
1. What is relation?2. What is function?3. What do you mean
by domain of relation/function?
4. What do you mean by range of relation/function?
5. How are relations and functions represented?
6. How are the quantities related to each other?
You gave your initial ideas on representations of relations and functions. The next section will enable you to understand how a relation and a function represented and do aleafletdesigntodemonstrateyourunderstanding.
Your goal in this section is to learn and understand the key concepts of Representations of Relations and Functions.
What to ProcessWhat to Process
A relation isanysetoforderedpairs.Thesetofallfirstcoordinates iscalledthedomain of the relation. The set of all second coordinates is called the range of the relation.
What to ProcessWhat to Process
After letting the students give their initial answers to the questions in the IRF Worksheet, tell them that at the end of the lesson, they are expected to makeaninformativeleafletofrepresentationsofrelationsandfunctionsasademonstration of their understanding.Let the students read and understand important notes on relations and functions before they perform the succeeding activities. Tell them to study carefully the example provided.
158
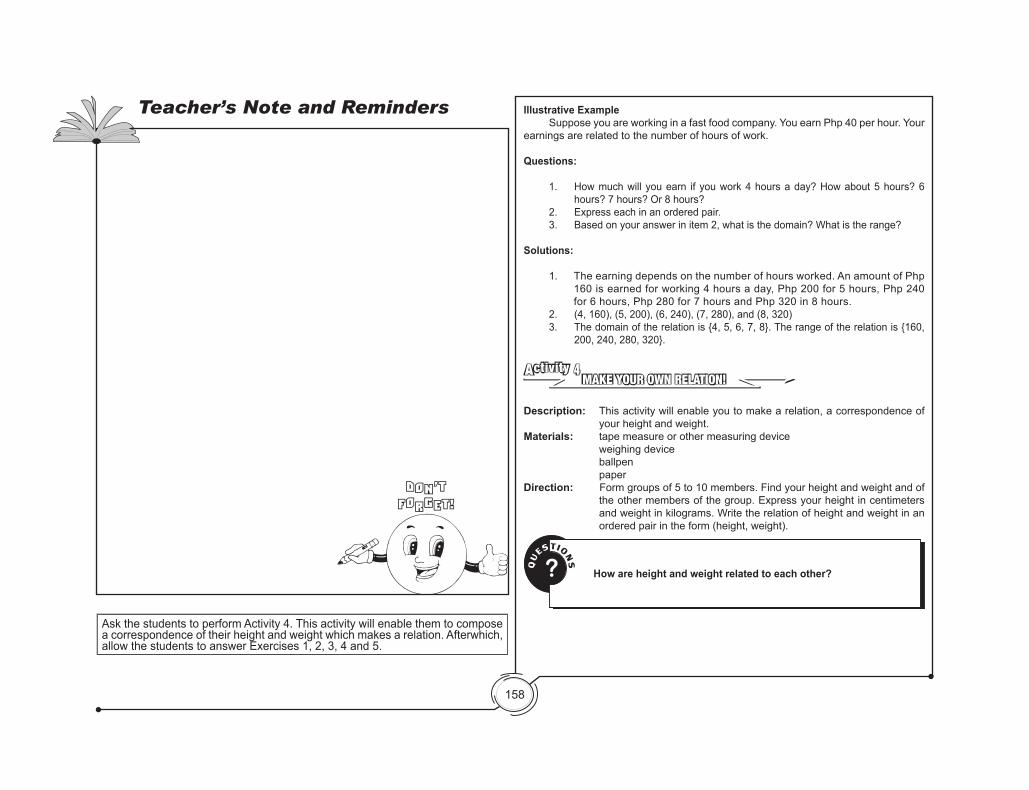
Ask the students to perform Activity 4. This activity will enable them to compose a correspondence of their height and weight which makes a relation. Afterwhich, allow the students to answer Exercises 1, 2, 3, 4 and 5.
Teacher’s Note and Reminders
Don’tForget!
Illustrative Example Suppose you are working in a fast food company. You earn Php 40 per hour. Your earnings are related to the number of hours of work.
Questions:
1. How much will you earn if you work 4 hours a day? How about 5 hours? 6 hours? 7 hours? Or 8 hours?
2. Express each in an ordered pair.3. Based on your answer in item 2, what is the domain? What is the range?
Solutions:
1. The earning depends on the number of hours worked. An amount of Php 160 is earned for working 4 hours a day, Php 200 for 5 hours, Php 240 for 6 hours, Php 280 for 7 hours and Php 320 in 8 hours.
2. (4, 160), (5, 200), (6, 240), (7, 280), and (8, 320)3. The domain of the relation is {4, 5, 6, 7, 8}. The range of the relation is {160,
200, 240, 280, 320}.
MAKE YOUR OWN RELATION!Activity 4
Description: This activity will enable you to make a relation, a correspondence of your height and weight.
Materials: tape measure or other measuring device weighing device ballpen paper Direction: Form groups of 5 to 10 members. Find your height and weight and of
the other members of the group. Express your height in centimeters and weight in kilograms. Write the relation of height and weight in an ordered pair in the form (height, weight).
QU
ESTIONS? How are height and weight related to each other?
159
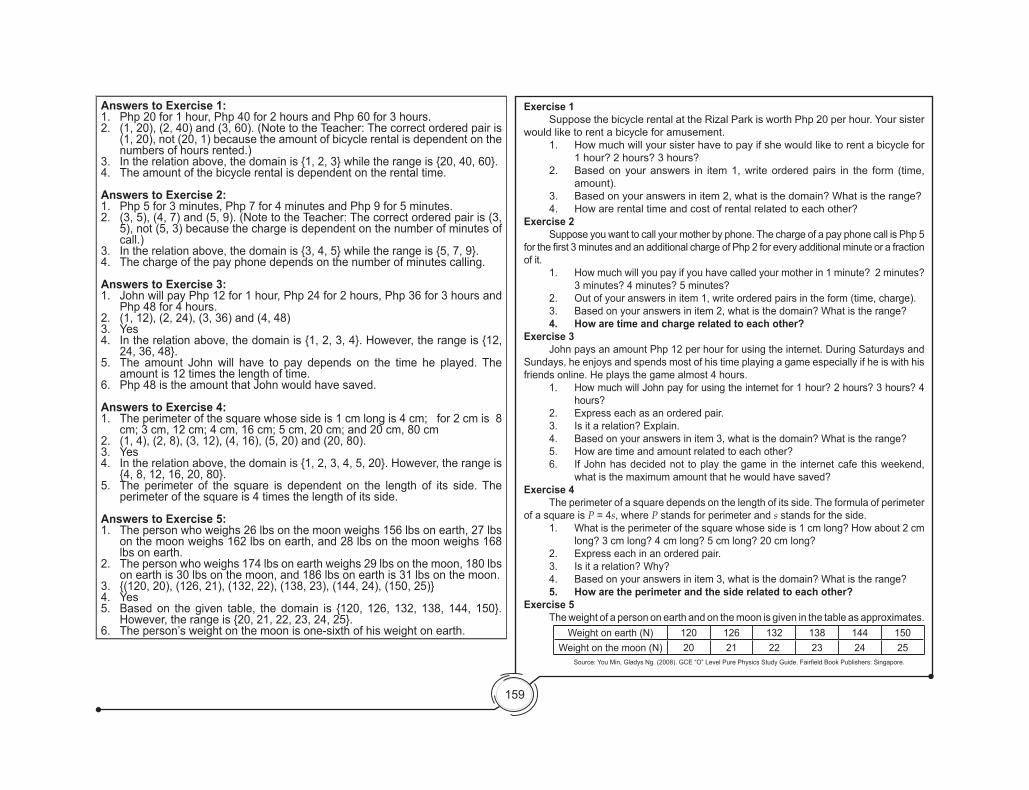
Answers to Exercise 1:1. Php 20 for 1 hour, Php 40 for 2 hours and Php 60 for 3 hours.2. (1, 20), (2, 40) and (3, 60). (Note to the Teacher: The correct ordered pair is
(1, 20), not (20, 1) because the amount of bicycle rental is dependent on the numbers of hours rented.)
3. In the relation above, the domain is {1, 2, 3} while the range is {20, 40, 60}. 4. The amount of the bicycle rental is dependent on the rental time.
Answers to Exercise 2:1. Php 5 for 3 minutes, Php 7 for 4 minutes and Php 9 for 5 minutes.2. (3, 5), (4, 7) and (5, 9). (Note to the Teacher: The correct ordered pair is (3,
5), not (5, 3) because the charge is dependent on the number of minutes of call.)
3. In the relation above, the domain is {3, 4, 5} while the range is {5, 7, 9}.4. The charge of the pay phone depends on the number of minutes calling.
Answers to Exercise 3:1. John will pay Php 12 for 1 hour, Php 24 for 2 hours, Php 36 for 3 hours and
Php 48 for 4 hours.2. (1, 12), (2, 24), (3, 36) and (4, 48)3. Yes4. In the relation above, the domain is {1, 2, 3, 4}. However, the range is {12,
24, 36, 48}.5. The amount John will have to pay depends on the time he played. The
amount is 12 times the length of time.6. Php 48 is the amount that John would have saved.
Answers to Exercise 4:1. The perimeter of the square whose side is 1 cm long is 4 cm; for 2 cm is 8
cm; 3 cm, 12 cm; 4 cm, 16 cm; 5 cm, 20 cm; and 20 cm, 80 cm2. (1, 4), (2, 8), (3, 12), (4, 16), (5, 20) and (20, 80).3. Yes4. In the relation above, the domain is {1, 2, 3, 4, 5, 20}. However, the range is
{4, 8, 12, 16, 20, 80}. 5. The perimeter of the square is dependent on the length of its side. The
perimeter of the square is 4 times the length of its side.
Answers to Exercise 5:1. The person who weighs 26 lbs on the moon weighs 156 lbs on earth, 27 lbs
on the moon weighs 162 lbs on earth, and 28 lbs on the moon weighs 168 lbs on earth.
2. The person who weighs 174 lbs on earth weighs 29 lbs on the moon, 180 lbs on earth is 30 lbs on the moon, and 186 lbs on earth is 31 lbs on the moon.
3. {(120, 20), (126, 21), (132, 22), (138, 23), (144, 24), (150, 25)}4. Yes5. Based on the given table, the domain is {120, 126, 132, 138, 144, 150}.
However, the range is {20, 21, 22, 23, 24, 25}.6. The person’s weight on the moon is one-sixth of his weight on earth.
Exercise 1 Suppose the bicycle rental at the Rizal Park is worth Php 20 per hour. Your sister would like to rent a bicycle for amusement.
1. How much will your sister have to pay if she would like to rent a bicycle for 1 hour? 2 hours? 3 hours?
2. Based on your answers in item 1, write ordered pairs in the form (time, amount).
3. Based on your answers in item 2, what is the domain? What is the range?4. How are rental time and cost of rental related to each other?
Exercise 2 Suppose you want to call your mother by phone. The charge of a pay phone call is Php 5 forthefirst3minutesandanadditionalchargeofPhp2foreveryadditionalminuteorafractionof it.
1. How much will you pay if you have called your mother in 1 minute? 2 minutes? 3 minutes? 4 minutes? 5 minutes?
2. Out of your answers in item 1, write ordered pairs in the form (time, charge).3. Based on your answers in item 2, what is the domain? What is the range?4. How are time and charge related to each other?
Exercise 3 John pays an amount Php 12 per hour for using the internet. During Saturdays and Sundays, he enjoys and spends most of his time playing a game especially if he is with his friends online. He plays the game almost 4 hours.
1. How much will John pay for using the internet for 1 hour? 2 hours? 3 hours? 4 hours?
2. Express each as an ordered pair.3. Is it a relation? Explain.4. Based on your answers in item 3, what is the domain? What is the range?5. How are time and amount related to each other?6. If John has decided not to play the game in the internet cafe this weekend,
what is the maximum amount that he would have saved?Exercise 4 The perimeter of a square depends on the length of its side. The formula of perimeter of a square is P = 4s, where P stands for perimeter and s stands for the side.
1. What is the perimeter of the square whose side is 1 cm long? How about 2 cm long? 3 cm long? 4 cm long? 5 cm long? 20 cm long?
2. Express each in an ordered pair.3. Is it a relation? Why?4. Based on your answers in item 3, what is the domain? What is the range?5. How are the perimeter and the side related to each other?
Exercise 5 The weight of a person on earth and on the moon is given in the table as approximates.
Weight on earth (N) 120 126 132 138 144 150Weight on the moon (N) 20 21 22 23 24 25
Source:YouMin,GladysNg.(2008).GCE“O”LevelPurePhysicsStudyGuide.FairfieldBookPublishers:Singapore.
160
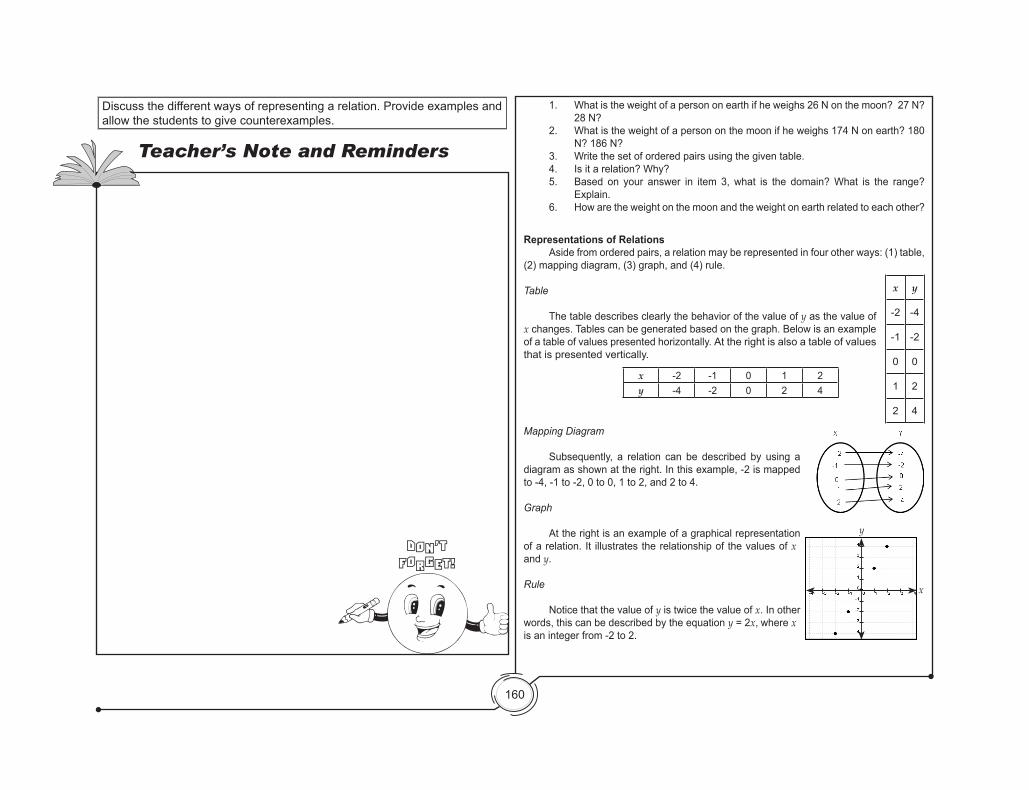
Discuss the different ways of representing a relation. Provide examples and allow the students to give counterexamples.
Teacher’s Note and Reminders
Don’tForget!
Representations of Relations Aside from ordered pairs, a relation may be represented in four other ways: (1) table, (2) mapping diagram, (3) graph, and (4) rule.
Table
The table describes clearly the behavior of the value of y as the value of x changes. Tables can be generated based on the graph. Below is an example of a table of values presented horizontally. At the right is also a table of values that is presented vertically.
Mapping Diagram
Subsequently, a relation can be described by using a diagram as shown at the right. In this example, -2 is mapped to -4, -1 to -2, 0 to 0, 1 to 2, and 2 to 4.
Graph
At the right is an example of a graphical representation of a relation. It illustrates the relationship of the values of x and y.
Rule
Notice that the value of y is twice the value of x. In other words, this can be described by the equation y = 2x, where x is an integer from -2 to 2.
x -2 -1 0 1 2y -4 -2 0 2 4
y
-4
-2
0
2
4
x
-2
-1
0
1
2
x
y
1. What is the weight of a person on earth if he weighs 26 N on the moon? 27 N? 28 N?
2. What is the weight of a person on the moon if he weighs 174 N on earth? 180 N? 186 N?
3. Write the set of ordered pairs using the given table.4. Is it a relation? Why?5. Based on your answer in item 3, what is the domain? What is the range?
Explain.6. How are the weight on the moon and the weight on earth related to each other?
161
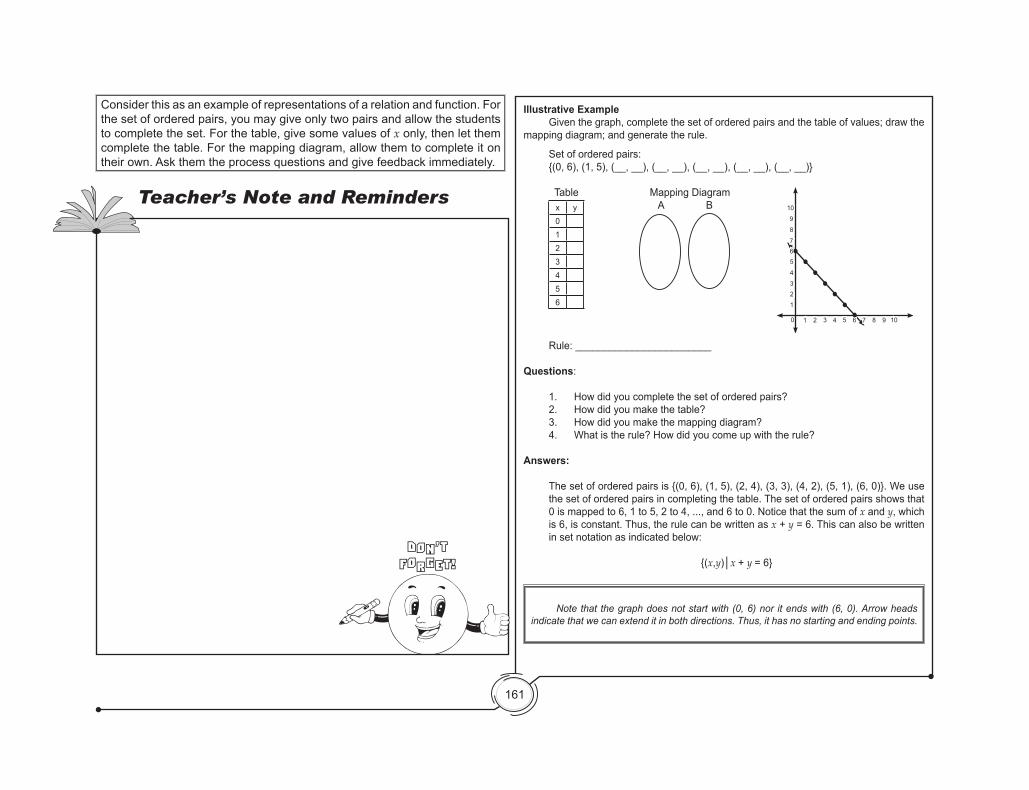
Consider this as an example of representations of a relation and function. For the set of ordered pairs, you may give only two pairs and allow the students to complete the set. For the table, give some values of x only, then let them complete the table. For the mapping diagram, allow them to complete it on their own. Ask them the process questions and give feedback immediately.
Teacher’s Note and Reminders
Don’tForget!
0
1
1 2 3 4 5 6 7 8 9 10
23
4
567
8
9
10
Illustrative Example Given the graph, complete the set of ordered pairs and the table of values; draw the mapping diagram; and generate the rule.
Set of ordered pairs: {(0, 6), (1, 5), (__, __), (__, __), (__, __), (__, __), (__, __)}
Table Mapping Diagram A B
Rule: ________________________
Questions:
1. How did you complete the set of ordered pairs? 2. How did you make the table? 3. How did you make the mapping diagram?4. What is the rule? How did you come up with the rule?
Answers:
The set of ordered pairs is {(0, 6), (1, 5), (2, 4), (3, 3), (4, 2), (5, 1), (6, 0)}. We use the set of ordered pairs in completing the table. The set of ordered pairs shows that 0 is mapped to 6, 1 to 5, 2 to 4, ..., and 6 to 0. Notice that the sum of x and y, which is 6, is constant. Thus, the rule can be written as x + y = 6. This can also be written in set notation as indicated below:
{(x,y)│x + y = 6}
x y0123456
Note that the graph does not start with (0, 6) nor it ends with (6, 0). Arrow heads indicate that we can extend it in both directions. Thus, it has no starting and ending points.
162
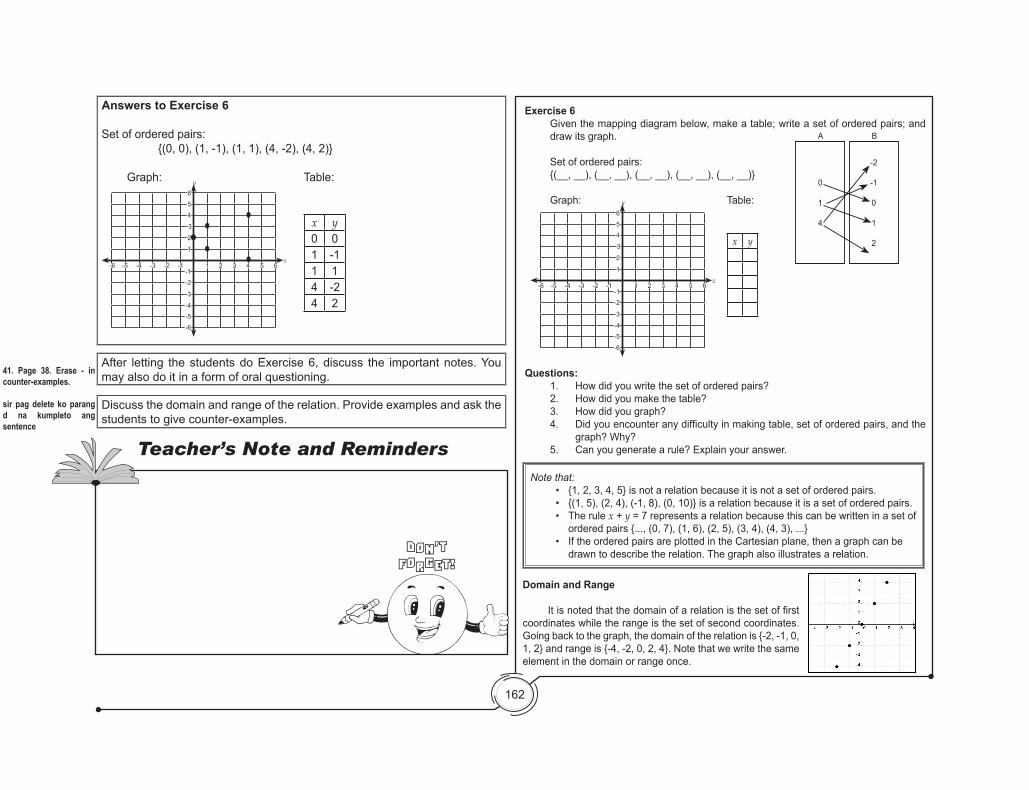
Answers to Exercise 6
Set of ordered pairs: {(0, 0), (1, -1), (1, 1), (4, -2), (4, 2)} Graph: Table:
x y0 01 -11 14 -24 2
Teacher’s Note and Reminders
Don’tForget!
y
x-6 -5 -4 -3
-3
-4
-5
-6
-2
-2
-1-1
1
1
2
2
3
3
4
4
5
5
6
6
Exercise 6Given the mapping diagram below, make a table; write a set of ordered pairs; and draw its graph.
Set of ordered pairs: {(__, __), (__, __), (__, __), (__, __), (__, __)}
Graph: Table:
x y
Questions:1. How did you write the set of ordered pairs? 2. How did you make the table? 3. How did you graph?4. Didyouencounteranydifficultyinmakingtable,setoforderedpairs,andthe
graph? Why?5. Can you generate a rule? Explain your answer.
0
1
4
-2
-1
0
1
2
A B
Note that:• {1,2,3,4,5}isnotarelationbecauseitisnotasetoforderedpairs.• {(1,5),(2,4),(-1,8),(0,10)}isarelationbecauseitisasetoforderedpairs.• Therulex + y = 7 represents a relation because this can be written in a set of
ordered pairs {..., (0, 7), (1, 6), (2, 5), (3, 4), (4, 3), ...}• IftheorderedpairsareplottedintheCartesianplane,thenagraphcanbe
drawn to describe the relation. The graph also illustrates a relation.
Domain and Range
Itisnotedthatthedomainofarelationisthesetoffirstcoordinates while the range is the set of second coordinates. Going back to the graph, the domain of the relation is {-2, -1, 0, 1, 2} and range is {-4, -2, 0, 2, 4}. Note that we write the same element in the domain or range once.
y
x-6 -5 -4 -3
-3
-4
-5
-6
-2
-2
-1-1
1
1
2
2
3
3
4
4
5
5
6
6
After letting the students do Exercise 6, discuss the important notes. You may also do it in a form of oral questioning.
Discuss the domain and range of the relation. Provide examples and ask the students to give counter-examples.
41. Page 38. Erase - in counter-examples.
sir pag delete ko parang d na kumpleto ang sentence
163
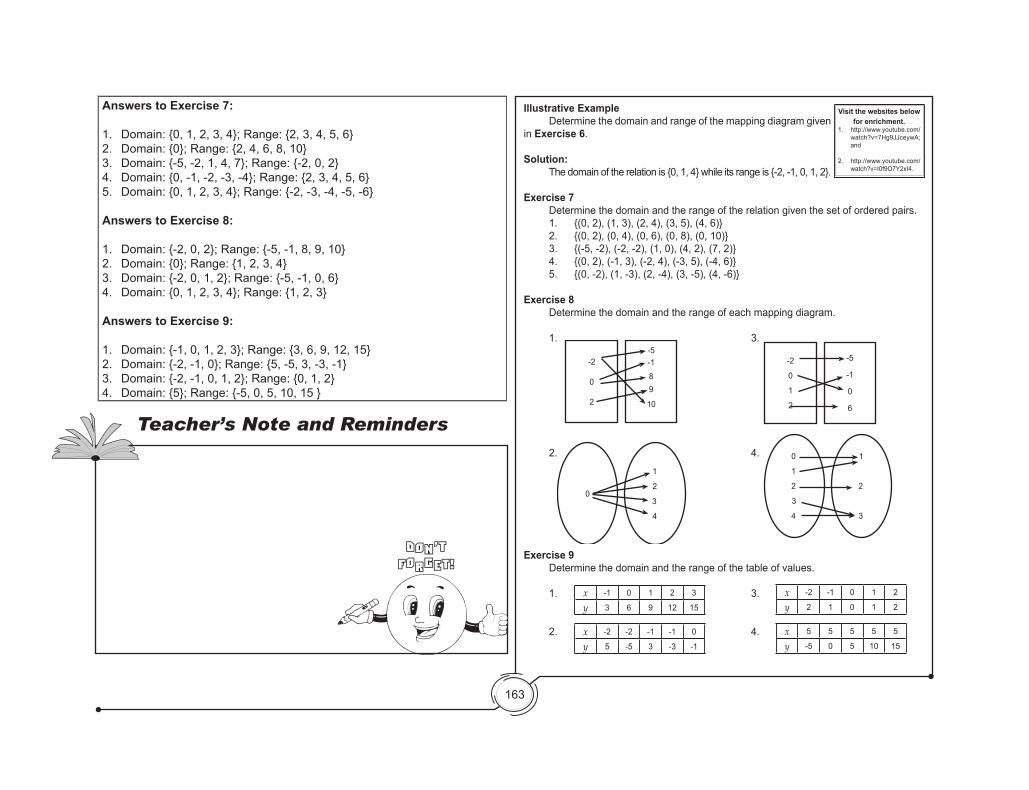
Answers to Exercise 7:
1. Domain: {0, 1, 2, 3, 4}; Range: {2, 3, 4, 5, 6}2. Domain: {0}; Range: {2, 4, 6, 8, 10}3. Domain: {-5, -2, 1, 4, 7}; Range: {-2, 0, 2}4. Domain: {0, -1, -2, -3, -4}; Range: {2, 3, 4, 5, 6}5. Domain: {0, 1, 2, 3, 4}; Range: {-2, -3, -4, -5, -6}
Answers to Exercise 8:
1. Domain: {-2, 0, 2}; Range: {-5, -1, 8, 9, 10}2. Domain: {0}; Range: {1, 2, 3, 4}3. Domain: {-2, 0, 1, 2}; Range: {-5, -1, 0, 6}4. Domain: {0, 1, 2, 3, 4}; Range: {1, 2, 3}
Answers to Exercise 9:
1. Domain: {-1, 0, 1, 2, 3}; Range: {3, 6, 9, 12, 15}2. Domain: {-2, -1, 0}; Range: {5, -5, 3, -3, -1}3. Domain: {-2, -1, 0, 1, 2}; Range: {0, 1, 2}4. Domain: {5}; Range: {-5, 0, 5, 10, 15 }
-2
0
2
-5-1
89
10
-2
0
1
2
-5
-1
0
6
0
1
2
3
4
0
1
2
3
4
1
2
3
Illustrative Example Determine the domain and range of the mapping diagram given in Exercise 6.
Solution: The domain of the relation is {0, 1, 4} while its range is {-2, -1, 0, 1, 2}.
Exercise 7 Determine the domain and the range of the relation given the set of ordered pairs.
1. {(0, 2), (1, 3), (2, 4), (3, 5), (4, 6)}2. {(0, 2), (0, 4), (0, 6), (0, 8), (0, 10)}3. {(-5, -2), (-2, -2), (1, 0), (4, 2), (7, 2)}4. {(0, 2), (-1, 3), (-2, 4), (-3, 5), (-4, 6)}5. {(0, -2), (1, -3), (2, -4), (3, -5), (4, -6)}
Exercise 8 Determine the domain and the range of each mapping diagram.
1. 3.
2. 4.
Exercise 9 Determine the domain and the range of the table of values.
1. 3.
2. 4.
Visit the websites below for enrichment.
1. http://www.youtube.com/watch?v=7Hg9JJceywA; and
2. http://www.youtube.com/watch?v=I0f9O7Y2xI4.
x -1 0 1 2 3
y 3 6 9 12 15
x -2 -1 0 1 2
y 2 1 0 1 2
x -2 -2 -1 -1 0
y 5 -5 3 -3 -1
x 5 5 5 5 5
y -5 0 5 10 15
Teacher’s Note and Reminders
Don’tForget!
164
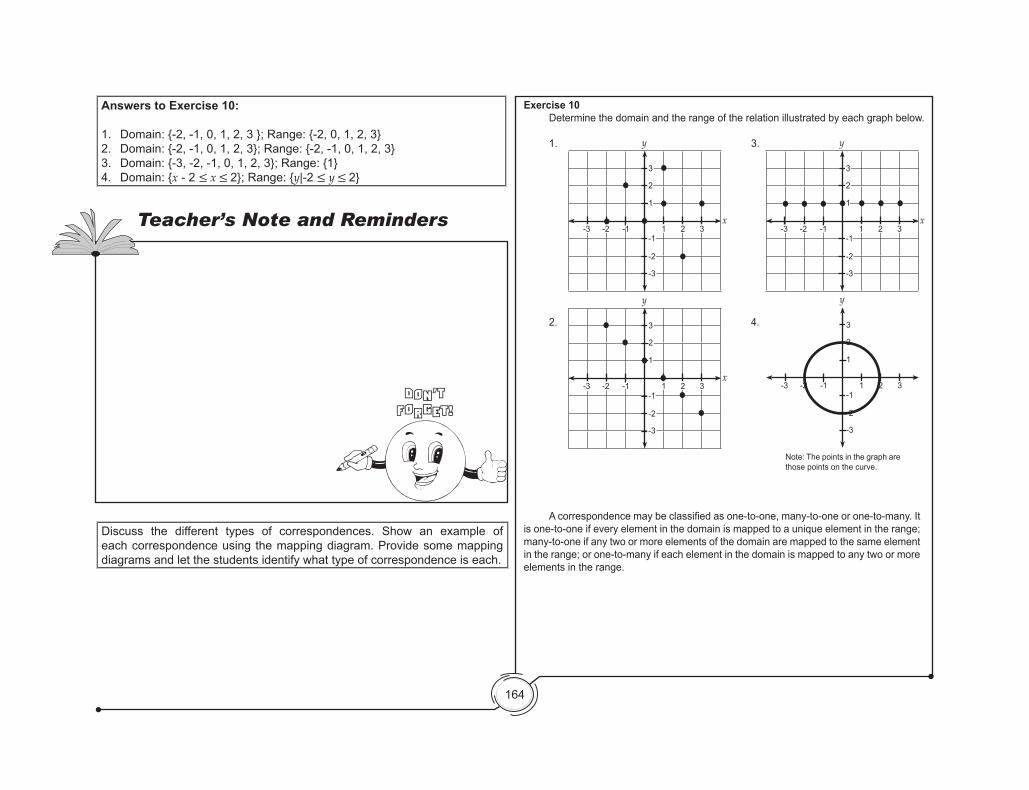
Answers to Exercise 10:
1. Domain: {-2, -1, 0, 1, 2, 3 }; Range: {-2, 0, 1, 2, 3}2. Domain: {-2, -1, 0, 1, 2, 3}; Range: {-2, -1, 0, 1, 2, 3}3. Domain: {-3, -2, -1, 0, 1, 2, 3}; Range: {1}4. Domain: {x - 2 ≤ x ≤ 2}; Range: {y|-2 ≤ y ≤ 2}
Discuss the different types of correspondences. Show an example of each correspondence using the mapping diagram. Provide some mapping diagrams and let the students identify what type of correspondence is each.
Teacher’s Note and Reminders
Don’tForget!
3
2
1
1-1
-1-2-3
-2
-3
2 3
y
x
3
2
1
1-1
-1-2-3
-2
-3
2 3
y
x
3
2
1
1-1
-1-2-3
-2
-3
2 3
y
x
3
2
1
1-1
-1-2-3
-2
-3
2 3
y
Exercise 10 Determine the domain and the range of the relation illustrated by each graph below.
1. 3.
2. 4.
Note: The points in the graph are those points on the curve.
Acorrespondencemaybeclassifiedasone-to-one,many-to-oneorone-to-many.Itis one-to-one if every element in the domain is mapped to a unique element in the range; many-to-one if any two or more elements of the domain are mapped to the same element in the range; or one-to-many if each element in the domain is mapped to any two or more elements in the range.

165
Explain to the students Illustrative Example 1. Let the students identify what type of correspondence is the mapping diagram and the table.
Teacher’s Note and Reminders
Don’tForget!
Mary
John
Kim
001
025
154
One-to-One Correspondence Many-to-One Correspondence
1
3
Mary
Susan
Roger
Kenneth
One-to-Many Correspondence
Mrs. Peñas
John
Mars
Kim
Sonia
Student Student
Student
I.D. No. Class Rank
Teacher
Consider the table and mapping diagram below.Illustrative Example 1
Section
Zamora
Gomez
9
Student
Ivan
Camille
Faith
Jayson
Mapping Diagram
Government Agency Official Websites
DepEd www.deped.gov.ph
DSWD www.dswd.gov.ph
SSS www.sss.gov.ph
PhilHealth www.philhealth.gov.ph
Table
166
Teacher’s Note and Reminders
Don’tForget!
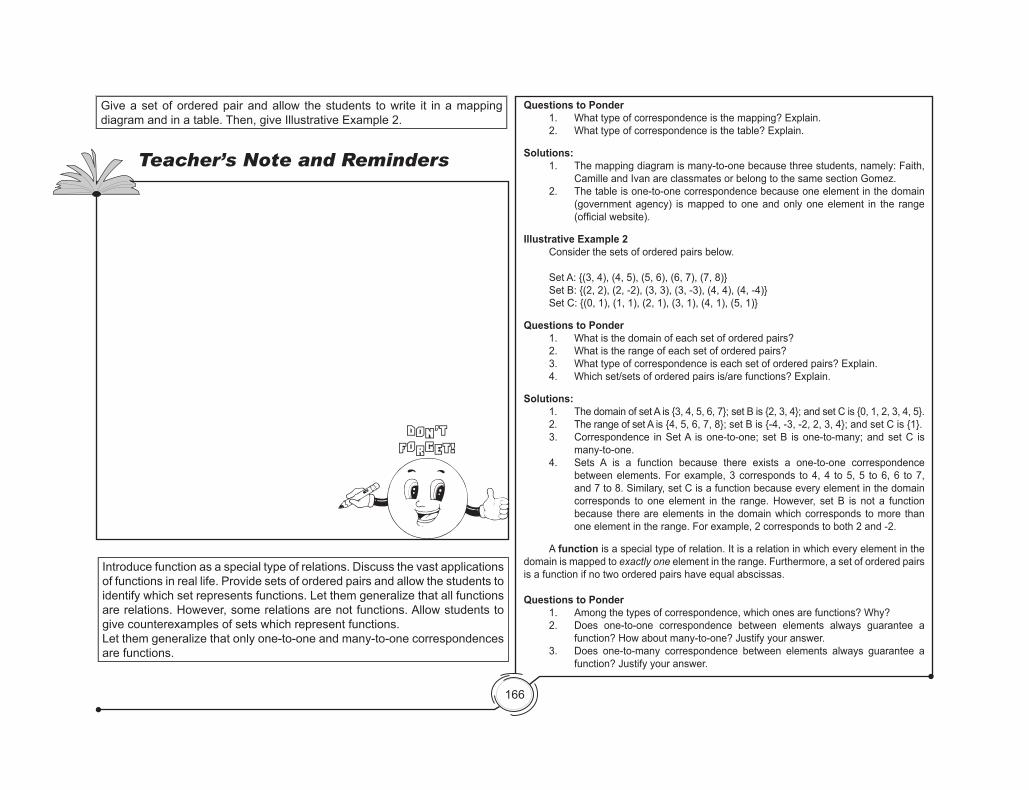
Questions to Ponder 1. What type of correspondence is the mapping? Explain. 2. What type of correspondence is the table? Explain.
Solutions:1. The mapping diagram is many-to-one because three students, namely: Faith,
Camille and Ivan are classmates or belong to the same section Gomez.2. The table is one-to-one correspondence because one element in the domain
(government agency) is mapped to one and only one element in the range (officialwebsite).
Illustrative Example 2Consider the sets of ordered pairs below.
Set A: {(3, 4), (4, 5), (5, 6), (6, 7), (7, 8)}Set B: {(2, 2), (2, -2), (3, 3), (3, -3), (4, 4), (4, -4)}Set C: {(0, 1), (1, 1), (2, 1), (3, 1), (4, 1), (5, 1)}
Questions to Ponder1. What is the domain of each set of ordered pairs?2. What is the range of each set of ordered pairs?3. What type of correspondence is each set of ordered pairs? Explain.4. Which set/sets of ordered pairs is/are functions? Explain.
Solutions:1. The domain of set A is {3, 4, 5, 6, 7}; set B is {2, 3, 4}; and set C is {0, 1, 2, 3, 4, 5}.2. The range of set A is {4, 5, 6, 7, 8}; set B is {-4, -3, -2, 2, 3, 4}; and set C is {1}.3. Correspondence in Set A is one-to-one; set B is one-to-many; and set C is
many-to-one.4. Sets A is a function because there exists a one-to-one correspondence
between elements. For example, 3 corresponds to 4, 4 to 5, 5 to 6, 6 to 7, and 7 to 8. Similary, set C is a function because every element in the domain corresponds to one element in the range. However, set B is not a function because there are elements in the domain which corresponds to more than one element in the range. For example, 2 corresponds to both 2 and -2.
A function is a special type of relation. It is a relation in which every element in the domain is mapped to exactly one element in the range. Furthermore, a set of ordered pairs is a function if no two ordered pairs have equal abscissas.
Questions to Ponder1. Among the types of correspondence, which ones are functions? Why?2. Does one-to-one correspondence between elements always guarantee a
function? How about many-to-one? Justify your answer.3. Does one-to-many correspondence between elements always guarantee a
function? Justify your answer.
Give a set of ordered pair and allow the students to write it in a mapping diagram and in a table. Then, give Illustrative Example 2.
Introduce function as a special type of relations. Discuss the vast applications of functions in real life. Provide sets of ordered pairs and allow the students to identify which set represents functions. Let them generalize that all functions are relations. However, some relations are not functions. Allow students to give counterexamples of sets which represent functions.Let them generalize that only one-to-one and many-to-one correspondences are functions.
167
Answers to Exercise 11:
Exercise 7 Exercise 81. Function 1. Not function2. Not function 2. Not function3. Function 3. Function4. Function 4. Function5. Function
Exercise 9 Exercise 101. Function 1. Not function2. Not function 2. Function3. Function 3. Function4. Not function 4. Not function
Let the students perform Activity 5 by pair. Let them observe and process their answers using the guide questions through oral questioning to enable them to generalize the rule of Vertical Line Test.
Teacher’s Note and Reminders
Don’tForget!
Note that all functions are relations but some relations are not functions.
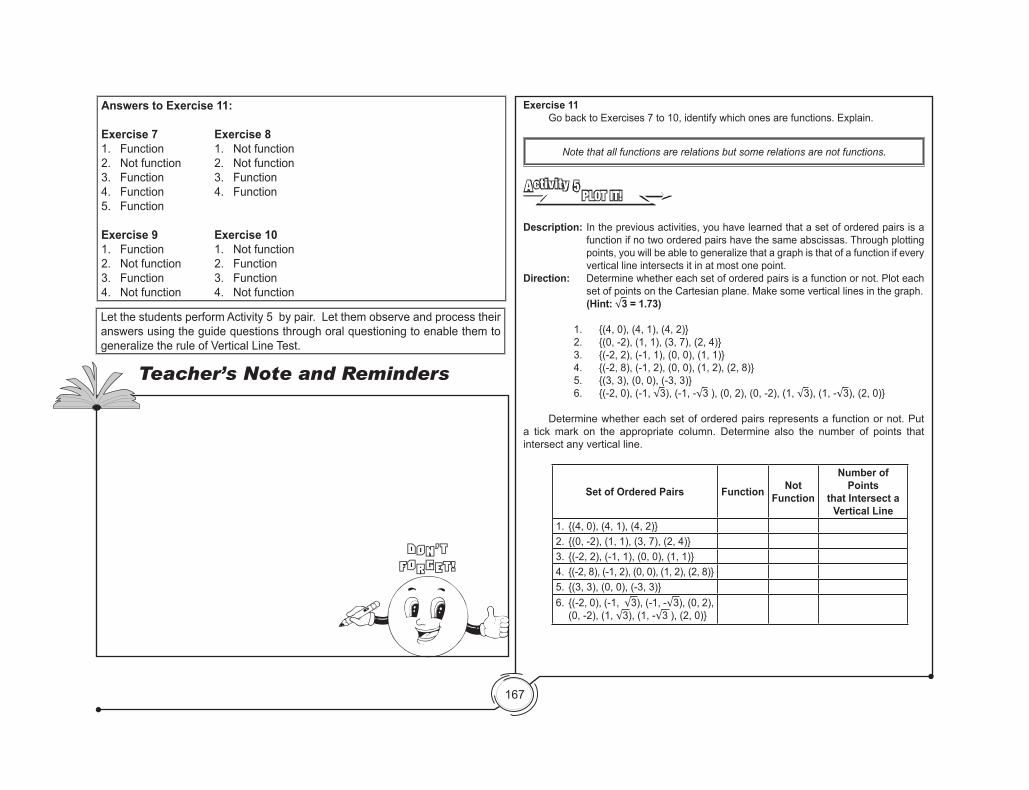
Exercise 11 Go back to Exercises 7 to 10, identify which ones are functions. Explain.
PLOT IT!Activity 5
Description: In the previous activities, you have learned that a set of ordered pairs is a function if no two ordered pairs have the same abscissas. Through plotting points, you will be able to generalize that a graph is that of a function if every vertical line intersects it in at most one point.
Direction: Determine whether each set of ordered pairs is a function or not. Plot each set of points on the Cartesian plane. Make some vertical lines in the graph.
(Hint: √3 = 1.73)
1. {(4, 0), (4, 1), (4, 2)}2. {(0, -2), (1, 1), (3, 7), (2, 4)}3. {(-2, 2), (-1, 1), (0, 0), (1, 1)}4. {(-2, 8), (-1, 2), (0, 0), (1, 2), (2, 8)}5. {(3, 3), (0, 0), (-3, 3)}6. {(-2, 0), (-1, √3), (-1, -√3 ), (0, 2), (0, -2), (1, √3), (1, -√3), (2, 0)}
Determine whether each set of ordered pairs represents a function or not. Put a tick mark on the appropriate column. Determine also the number of points that intersect any vertical line.
Set of Ordered Pairs Function Not Function
Number of Points
that Intersect a Vertical Line
1. {(4, 0), (4, 1), (4, 2)}2. {(0, -2), (1, 1), (3, 7), (2, 4)}3. {(-2, 2), (-1, 1), (0, 0), (1, 1)}4. {(-2, 8), (-1, 2), (0, 0), (1, 2), (2, 8)}5. {(3, 3), (0, 0), (-3, 3)}6. {(-2, 0), (-1, √3), (-1, -√3), (0, 2),
(0, -2), (1, √3), (1, -√3 ), (2, 0)}
168
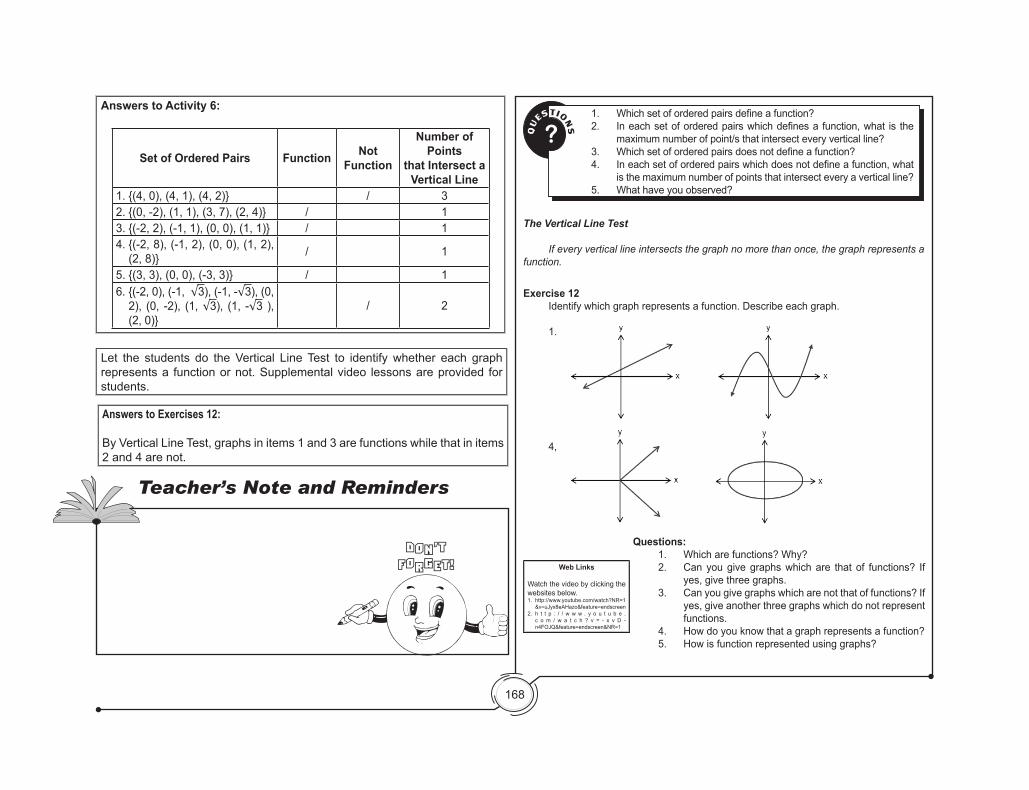
Answers to Activity 6:
Set of Ordered Pairs Function Not Function
Number of Points
that Intersect a Vertical Line
1. {(4, 0), (4, 1), (4, 2)} / 32. {(0, -2), (1, 1), (3, 7), (2, 4)} / 13. {(-2, 2), (-1, 1), (0, 0), (1, 1)} / 14. {(-2, 8), (-1, 2), (0, 0), (1, 2),
(2, 8)} / 1
5. {(3, 3), (0, 0), (-3, 3)} / 16. {(-2, 0), (-1, √3), (-1, -√3), (0,
2), (0, -2), (1, √3), (1, -√3 ), (2, 0)}
/ 2
Teacher’s Note and Reminders
Don’tForget!
QU
ESTIONS?
1. Whichsetoforderedpairsdefineafunction?2. Ineachsetoforderedpairswhichdefinesa function,what is the
maximum number of point/s that intersect every vertical line?3. Whichsetoforderedpairsdoesnotdefineafunction?4. Ineachsetoforderedpairswhichdoesnotdefineafunction,what
is the maximum number of points that intersect every a vertical line?5. What have you observed?
Exercise 12 Identify which graph represents a function. Describe each graph.
1. 3.
4, 5,
Web Links
Watch the video by clicking the websites below.1. http://www.youtube.com/watch?NR=1
&v=uJyx8eAHazo&feature=endscreen 2. h t t p : / / w w w . y o u t u b e .
c o m / w a t c h ? v = - x v D -n4FOJQ&feature=endscreen&NR=1
Questions:1. Which are functions? Why?2. Can you give graphs which are that of functions? If
yes, give three graphs.3. Can you give graphs which are not that of functions? If
yes, give another three graphs which do not represent functions.
4. How do you know that a graph represents a function?5. How is function represented using graphs?
The Vertical Line Test
If every vertical line intersects the graph no more than once, the graph represents a function.
Let the students do the Vertical Line Test to identify whether each graph represents a function or not. Supplemental video lessons are provided for students.
Answers to Exercises 12:
By Vertical Line Test, graphs in items 1 and 3 are functions while that in items 2 and 4 are not.
169
Introduce rule or equation as a representation of relation. Tell the students that a rule may either be a function or not. Let them observe Illustrative Examples 1 and Illustrative Examples 2. Use the process questions through oral questioning to enable students to draw a generalization that a rule is a function if and only if it can be written in the form y = f(x).
Teacher’s Note and Reminders
Don’tForget!
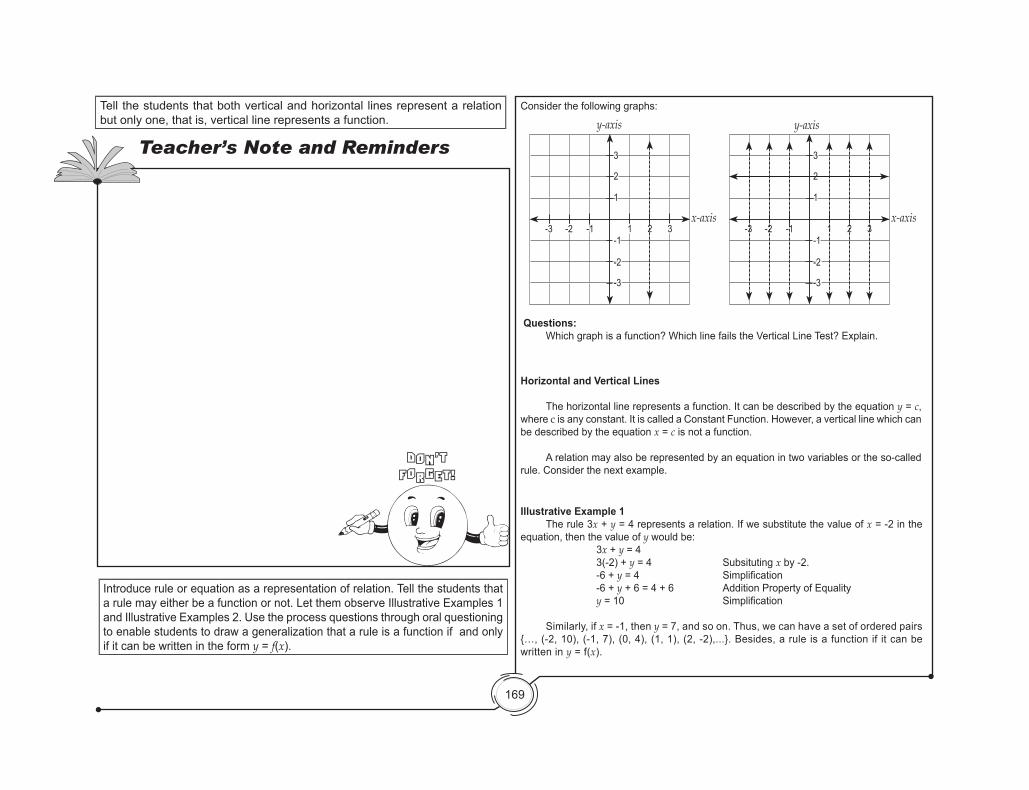
Consider the following graphs:
Questions: Which graph is a function? Which line fails the Vertical Line Test? Explain.
Illustrative Example 1 The rule 3x + y = 4 represents a relation. If we substitute the value of x = -2 in the equation, then the value of y would be: 3x + y = 4 3(-2) + y = 4 Subsituting x by -2. -6 + y=4 Simplification -6 + y + 6 = 4 + 6 Addition Property of Equality y=10 Simplification
Similarly, if x = -1, then y = 7, and so on. Thus, we can have a set of ordered pairs {…, (-2, 10), (-1, 7), (0, 4), (1, 1), (2, -2),...}. Besides, a rule is a function if it can be written in y = f(x).
Horizontal and Vertical Lines
The horizontal line represents a function. It can be described by the equation y = c, where c is any constant. It is called a Constant Function. However, a vertical line which can be described by the equation x = c is not a function.
A relation may also be represented by an equation in two variables or the so-called rule. Consider the next example.
3
2
1
1-1
-1-2-3
-2
-3
2 3
y-axis
3
2
1
1-1
-1-2-3
-2
-3
2 3
y-axis
x-axisx-axis
Tell the students that both vertical and horizontal lines represent a relation but only one, that is, vertical line represents a function.
170
Teacher’s Note and Reminders
Don’tForget!
Illustrative Example 2 Tell whether the rule 3x + y = 4 a function or not.
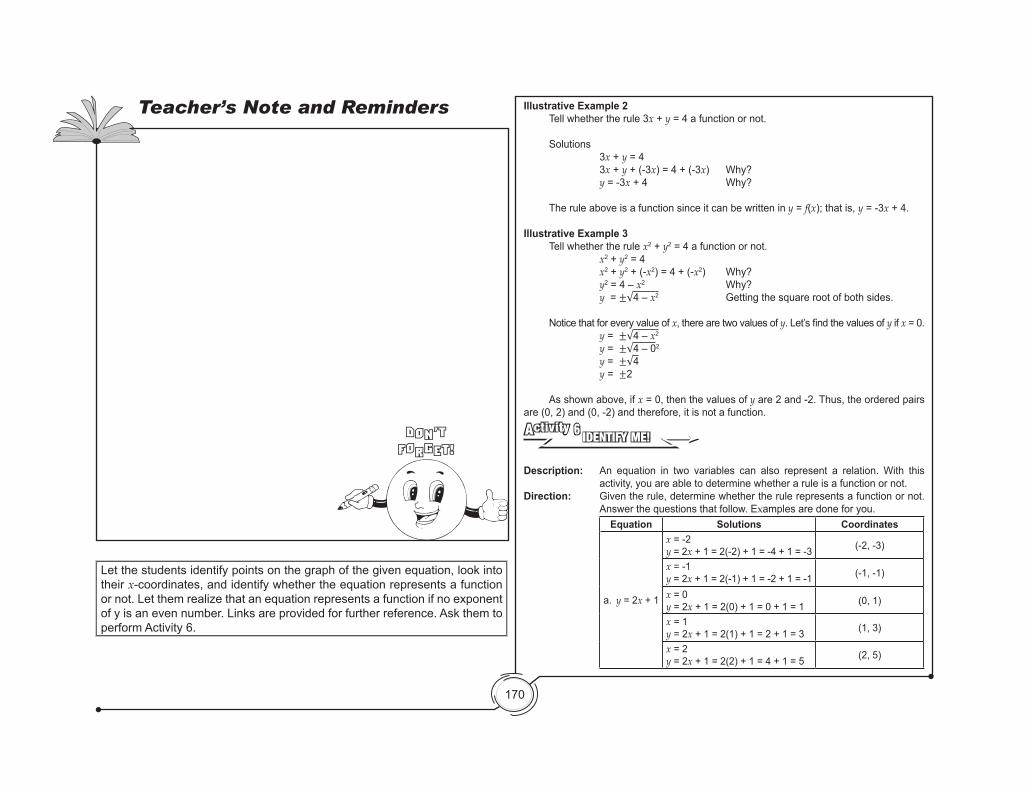
Solutions 3x + y = 4 3x + y + (-3x) = 4 + (-3x) Why? y = -3x + 4 Why?
The rule above is a function since it can be written in y = f(x); that is, y = -3x + 4.
Illustrative Example 3 Tell whether the rule x2 + y2 = 4 a function or not. x2 + y2 = 4 x2 + y2 + (-x2) = 4 + (-x2) Why? y2 = 4 – x2 Why? y = ±√4 – x2 Getting the square root of both sides.
Notice that for every value of x, there are two values of y.Let’sfindthevaluesofy if x = 0. y = ±√4 – x2
y = ±√4 – 02
y = ±√4 y = ±2
As shown above, if x = 0, then the values of y are 2 and -2. Thus, the ordered pairs are (0, 2) and (0, -2) and therefore, it is not a function.
IDENTIFY ME!Activity 6
Description: An equation in two variables can also represent a relation. With this activity, you are able to determine whether a rule is a function or not.
Direction: Given the rule, determine whether the rule represents a function or not. Answer the questions that follow. Examples are done for you.
Equation Solutions Coordinates
a. y = 2x + 1
x = -2y = 2x + 1 = 2(-2) + 1 = -4 + 1 = -3 (-2, -3)
x = -1y = 2x + 1 = 2(-1) + 1 = -2 + 1 = -1 (-1, -1)
x = 0y = 2x + 1 = 2(0) + 1 = 0 + 1 = 1 (0, 1)
x = 1y = 2x + 1 = 2(1) + 1 = 2 + 1 = 3 (1, 3)
x = 2y = 2x + 1 = 2(2) + 1 = 4 + 1 = 5 (2, 5)
Let the students identify points on the graph of the given equation, look into their x-coordinates, and identify whether the equation represents a function or not. Let them realize that an equation represents a function if no exponent of y is an even number. Links are provided for further reference. Ask them to perform Activity 6.
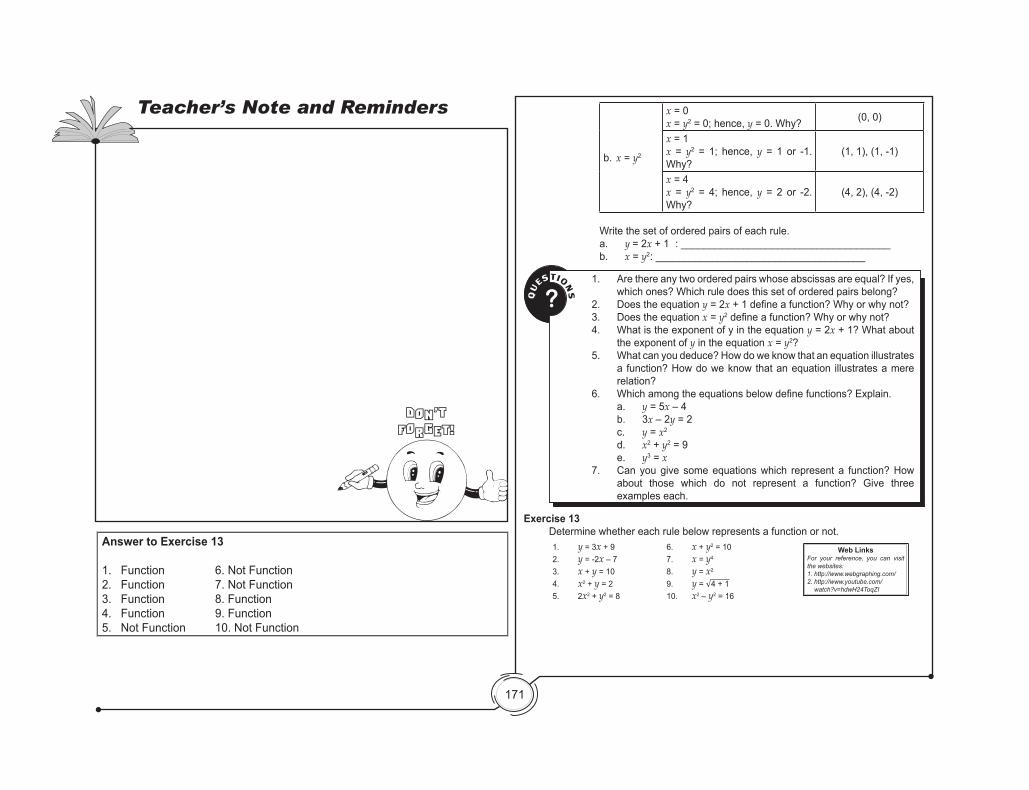
171
Answer to Exercise 13
1. Function 6. Not Function2. Function 7. Not Function3. Function 8. Function4. Function 9. Function5. Not Function 10. Not Function
Teacher’s Note and Reminders
Don’tForget!
b. x = y2
x = 0x = y2 = 0; hence, y = 0. Why? (0, 0)
x = 1x = y2 = 1; hence, y = 1 or -1. Why?
(1, 1), (1, -1)
x = 4x = y2 = 4; hence, y = 2 or -2. Why?
(4, 2), (4, -2)
Write the set of ordered pairs of each rule.a. y = 2x + 1 : _____________________________________b. x = y2 : _____________________________________
QU
ESTIONS?
1. Are there any two ordered pairs whose abscissas are equal? If yes, which ones? Which rule does this set of ordered pairs belong?
2. Does the equation y = 2x+1defineafunction?Whyorwhynot?3. Does the equation x = y2defineafunction?Whyorwhynot?4. What is the exponent of y in the equation y = 2x + 1? What about
the exponent of y in the equation x = y2?5. What can you deduce? How do we know that an equation illustrates
a function? How do we know that an equation illustrates a mere relation?
6. Whichamongtheequationsbelowdefinefunctions?Explain. a. y = 5x – 4 b. 3x – 2y = 2 c. y = x2
d. x2 + y2 = 9 e. y3 = x7. Can you give some equations which represent a function? How
about those which do not represent a function? Give three examples each.
Exercise 13 Determine whether each rule below represents a function or not.
1. y = 3x + 92. y = -2x – 7 3. x + y = 104. x2 + y = 25. 2x2 + y2 = 8
6. x + y2 = 107. x = y4
8. y = x2
9. y = √4 + 110. x2 – y2 = 16
Web LinksFor your reference, you can visit the websites: 1. http://www.webgraphing.com/ 2. http://www.youtube.com/ watch?v=hdwH24ToqZI

172
Let the students classify the variables as independent and dependent. Ask them to perform Activity 7.
Answers to Activity 7:
1. the number of hours of work and salary in a certain private company Independent variable: the number of hours of work Dependent variable: salary2. the number of hours boiling and the number of ounces of water left in pot Independent variable: the number of hours boiling Dependent variable: the number of ounces of water left in pot3. the distance covered and the volume of the gasoline Independent variable: the volume of the gasoline Dependent variable: the distance covered4. the number of hours studied to grade on test Independent variable: the number of hours studied Dependent variable: grade on test5. height of a plant to the number of months grown Independent variable: the number of months grown Dependent variable: height of a plant
Answers to Questions of Activity 7:
a. independent, controls f. independent, controlsb. dependent, depends g. independent, controlsc. independent, controls h. dependent, dependsd. dependent, depends i. dependent, dependse. dependent, depends j. independent, controls
Note that a rule represents a function if and only if it can be written in the form y = f(x).
MINDS-ONActivity 7
Description: Variables may be dependent and independent. Dependent variable depends on the independent variable while the independent variable controls the dependent variable.
Direction: Classify the variables as independent or dependent.
1. time and salary Independent variable: ______________ Dependent variable: _______________
2. the number of hours boiling and the number of ounces of water in pot Independent variable: ______________ Dependent variable: _______________
3. the distance covered and the volume of the gasoline Independent variable: ______________ Dependent variable: _______________
4. the number of hours studied to grade on test Independent variable: ______________ Dependent variable: _______________
5. height of a plant to the number of months grown Independent variable: ______________ Dependent variable: _______________
QU
ESTIONS?
1. Fill in the blanks.a. I consider time as a/an ________________ variable because
it ___________________ the salary. b. I consider salary as a/an ______________ variable because
it __________________ on the number of hours worked.c. I consider the number of hours boiling as a/an
________________ variable because it ___________ the number of ounces of water in pot.
d. I consider the number of ounces of water in pot as a/an ______________ variable because it ___________________ on the number of hours boiling.
Teacher’s Note and Reminders
Don’tForget!
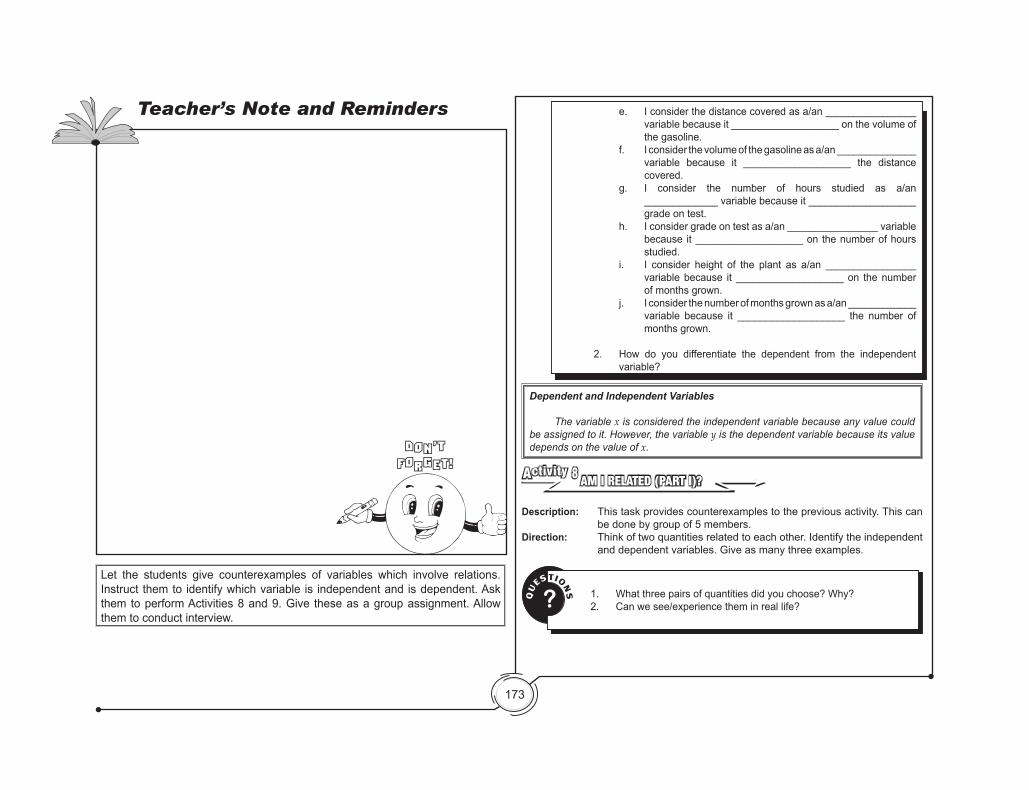
173
Let the students give counterexamples of variables which involve relations. Instruct them to identify which variable is independent and is dependent. Ask them to perform Activities 8 and 9. Give these as a group assignment. Allow them to conduct interview.
Teacher’s Note and Reminders
Don’tForget!
Dependent and Independent Variables
The variable x is considered the independent variable because any value could be assigned to it. However, the variable y is the dependent variable because its value depends on the value of x.
QU
ESTIONS? 1. What three pairs of quantities did you choose? Why?
2. Can we see/experience them in real life?
e. I consider the distance covered as a/an ________________ variable because it ___________________ on the volume of the gasoline.
f. I consider the volume of the gasoline as a/an ______________ variable because it ___________________ the distance covered.
g. I consider the number of hours studied as a/an _____________ variable because it ___________________ grade on test.
h. I consider grade on test as a/an ________________ variable because it ___________________ on the number of hours studied.
i. I consider height of the plant as a/an ________________ variable because it ___________________ on the number of months grown.
j. I consider the number of months grown as a/an ____________ variable because it ___________________ the number of months grown.
2. How do you differentiate the dependent from the independent variable?
AM I RELATED (PART I)?Activity 8
Description: This task provides counterexamples to the previous activity. This can be done by group of 5 members.
Direction: Think of two quantities related to each other. Identify the independent and dependent variables. Give as many three examples.
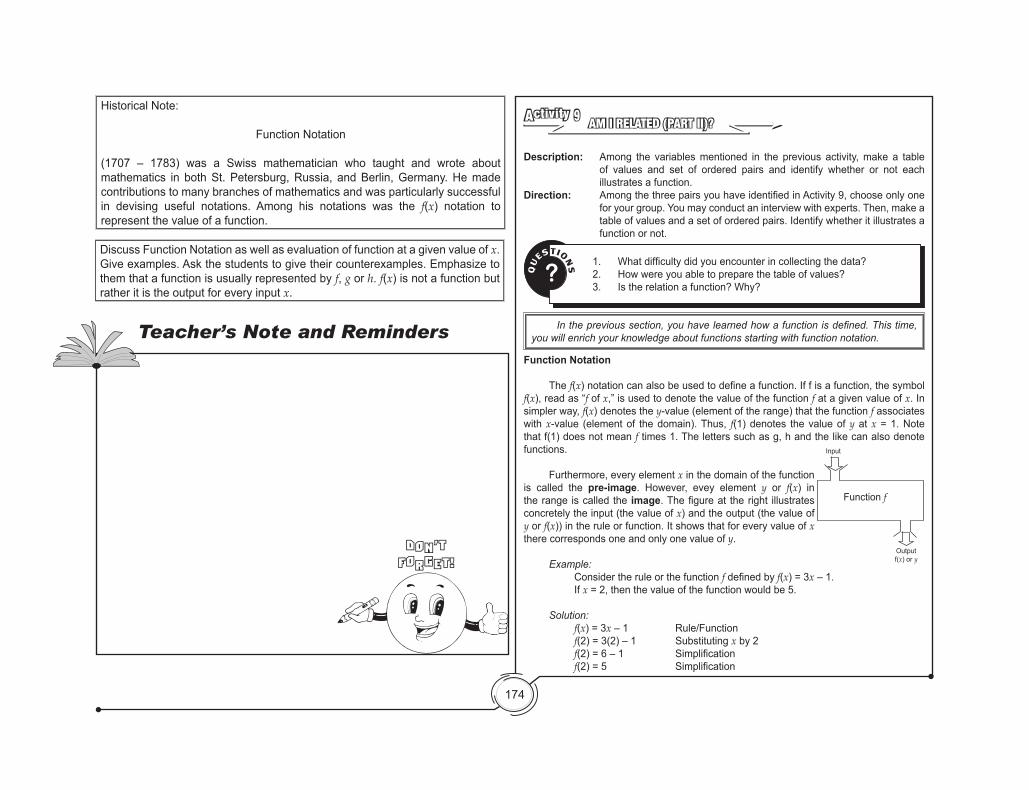
174
Historical Note:
Function Notation
(1707 – 1783) was a Swiss mathematician who taught and wrote about mathematics in both St. Petersburg, Russia, and Berlin, Germany. He made contributions to many branches of mathematics and was particularly successful in devising useful notations. Among his notations was the f(x) notation to represent the value of a function.
Discuss Function Notation as well as evaluation of function at a given value of x. Give examples. Ask the students to give their counterexamples. Emphasize to them that a function is usually represented by f, g or h. f(x) is not a function but rather it is the output for every input x.
Teacher’s Note and Reminders
Don’tForget!
AM I RELATED (PART II)?Activity 9
Description: Among the variables mentioned in the previous activity, make a table of values and set of ordered pairs and identify whether or not each illustrates a function.
Direction: AmongthethreepairsyouhaveidentifiedinActivity9,chooseonlyonefor your group. You may conduct an interview with experts. Then, make a table of values and a set of ordered pairs. Identify whether it illustrates a function or not.
QU
ESTIONS?
1. Whatdifficultydidyouencounterincollectingthedata?2. How were you able to prepare the table of values? 3. Is the relation a function? Why?
Intheprevioussection,youhavelearnedhowafunctionisdefined.Thistime,you will enrich your knowledge about functions starting with function notation.
Function Notation
The f(x)notationcanalsobeusedtodefineafunction.Iffisafunction,thesymbolf(x), read as “f of x,” is used to denote the value of the function f at a given value of x. In simpler way, f(x) denotes the y-value (element of the range) that the function f associates with x-value (element of the domain). Thus, f(1) denotes the value of y at x = 1. Note that f(1) does not mean f times 1. The letters such as g, h and the like can also denote functions.
Furthermore, every element x in the domain of the function is called the pre-image. However, evey element y or f(x) in the range is called the image.Thefigureat theright illustratesconcretely the input (the value of x) and the output (the value of y or f(x)) in the rule or function. It shows that for every value of x there corresponds one and only one value of y.
Example:Consider the rule or the function fdefinedby f(x) = 3x – 1. If x = 2, then the value of the function would be 5.
Solution:f(x) = 3x – 1 Rule/Functionf(2) = 3(2) – 1 Substituting x by 2f(2)=6–1 Simplification
f(2)=5 Simplification
Input
Outputf(x) or y
Function f
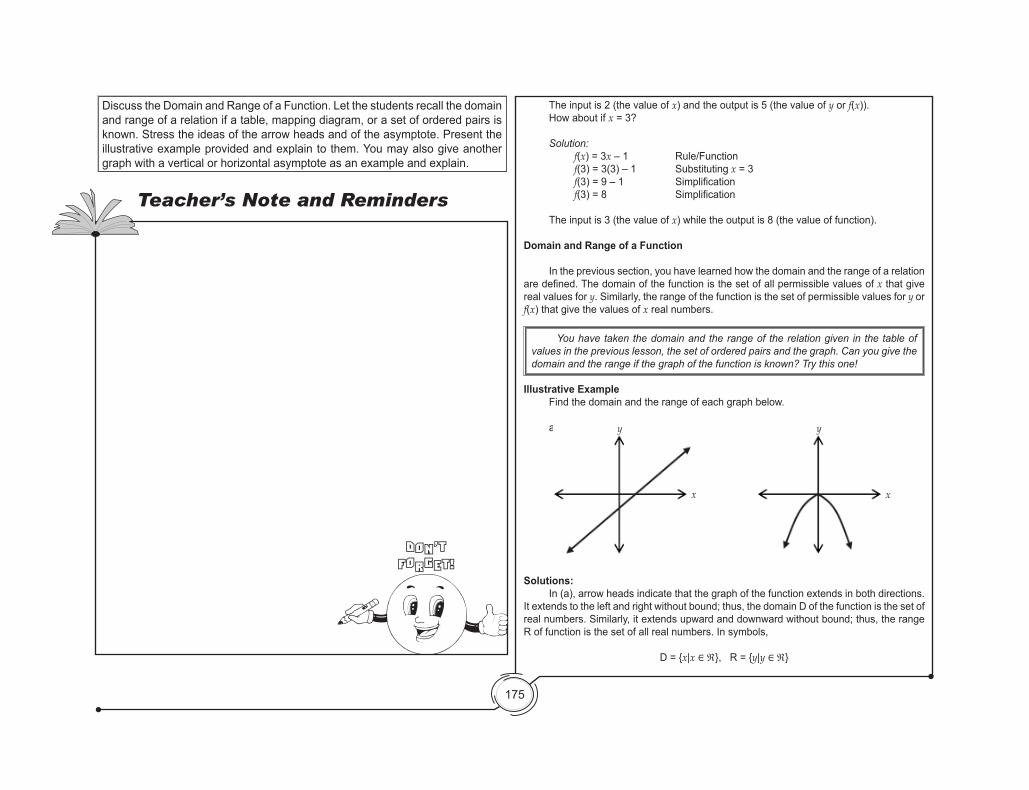
175
Discuss the Domain and Range of a Function. Let the students recall the domain and range of a relation if a table, mapping diagram, or a set of ordered pairs is known. Stress the ideas of the arrow heads and of the asymptote. Present the illustrative example provided and explain to them. You may also give another graph with a vertical or horizontal asymptote as an example and explain.
Teacher’s Note and Reminders
Don’tForget!
You have taken the domain and the range of the relation given in the table of values in the previous lesson, the set of ordered pairs and the graph. Can you give the domain and the range if the graph of the function is known? Try this one!
The input is 2 (the value of x) and the output is 5 (the value of y or f(x)). How about if x = 3?
Solution: f(x) = 3x – 1 Rule/Function f(3) = 3(3) – 1 Substituting x = 3 f(3)=9–1 Simplification f(3)=8 Simplification
The input is 3 (the value of x) while the output is 8 (the value of function).
Domain and Range of a Function
In the previous section, you have learned how the domain and the range of a relation aredefined.Thedomainofthefunctionisthesetofallpermissiblevaluesofx that give real values for y. Similarly, the range of the function is the set of permissible values for y or f(x) that give the values of x real numbers.
Illustrative Example Find the domain and the range of each graph below.
a. b.
Solutions: In (a), arrow heads indicate that the graph of the function extends in both directions. It extends to the left and right without bound; thus, the domain D of the function is the set of real numbers. Similarly, it extends upward and downward without bound; thus, the range R of function is the set of all real numbers. In symbols,
D = {x|x ∈ ℜ}, R = {y|y ∈ ℜ}
y
x
y
x

176
Answers to Exercise 14:
1. Domain: {x|x ∈ ℜ} Range: {y|y ≥ 0}2. Domain: {x|x ∈ ℜ} Range: {y|y = 5} or {5} 3. Domain: {x|x ∈ ℜ} Range: {y|y ∈ ℜ}4. Domain: {x|x ∈ ℜ} Range: {y|y > 0}5. Domain: {x|x ≥ 0} Range: {y|y ≥ 0}6. Domain: {x|x ∈ ℜ} Range: {y|y ≥ -2}
Teacher’s Note and Reminders
Don’tForget!
In (b), arrow heads indicate that the graph of the function is extended to the left and right without bound, and downward, but not upward, without bound. Thus, the domain of the function is the set of real numbers, while the range is any real number less than or equal to 0. That is,
D = {x|x ∈ ℜ}, R = {y|y ≤ 0}
Exercise 14 Determine the domain and the range of the functions below.
1. 2. 3.
4. 5. 6.
Note: The broken line in item number 4 is an asymptote. This is a line that the graph of a function approaches, but never intersects. (Hint: The value of x = 0 is not part of the domain of the function.)
5
(0, -2)
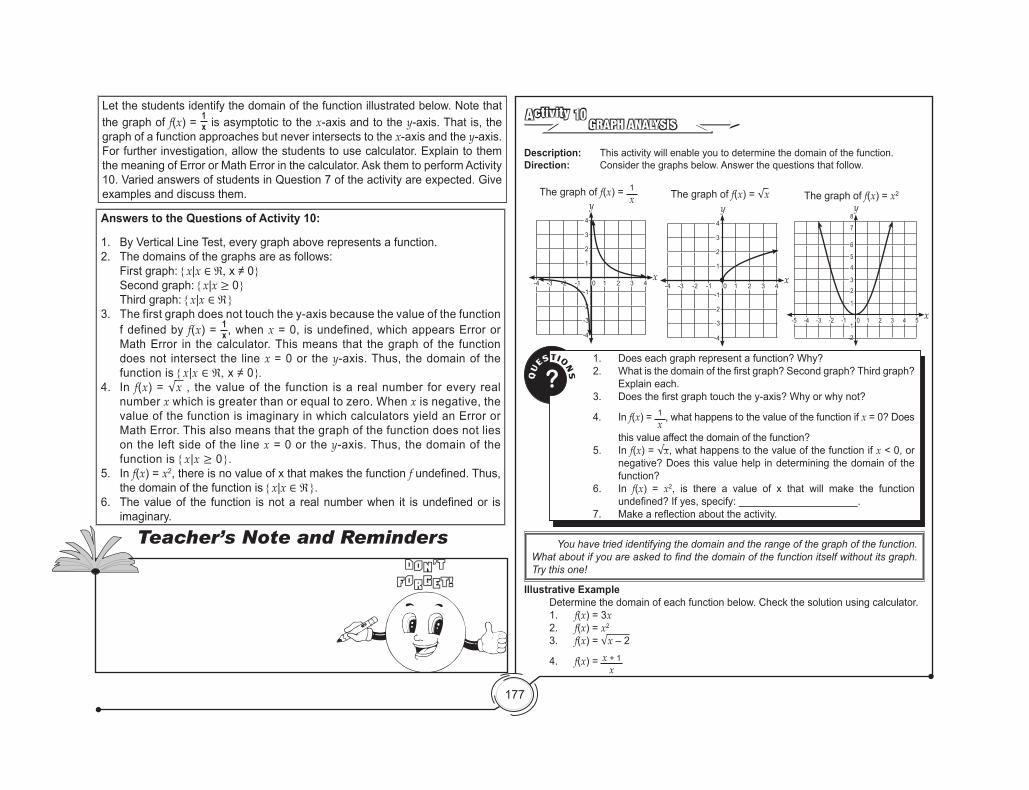
177
Let the students identify the domain of the function illustrated below. Note that the graph of f(x) = 1
x is asymptotic to the x-axis and to the y-axis. That is, the graph of a function approaches but never intersects to the x-axis and the y-axis. For further investigation, allow the students to use calculator. Explain to them the meaning of Error or Math Error in the calculator. Ask them to perform Activity 10. Varied answers of students in Question 7 of the activity are expected. Give examples and discuss them.
Answers to the Questions of Activity 10:
1. By Vertical Line Test, every graph above represents a function.2. The domains of the graphs are as follows: First graph: {x|x ∈ ℜ, x≠0} Second graph: {x|x ≥ 0} Third graph: {x|x ∈ ℜ}3. The first graph does not touch the y-axis because the value of the function
f defined by f(x) = 1x , when x = 0, is undefined, which appears Error or
Math Error in the calculator. This means that the graph of the function does not intersect the line x = 0 or the y-axis. Thus, the domain of the function is {x|x ∈ ℜ, x≠0}.
4. In f(x) = √x , the value of the function is a real number for every real number x which is greater than or equal to zero. When x is negative, the value of the function is imaginary in which calculators yield an Error or Math Error. This also means that the graph of the function does not lies on the left side of the line x = 0 or the y-axis. Thus, the domain of the function is {x|x ≥ 0}.
5. In f(x) = x2, there is no value of x that makes the function f undefined. Thus, the domain of the function is {x|x ∈ ℜ}.
6. The value of the function is not a real number when it is undefined or is imaginary.
-2
1-1
-1
-2
-3-4 -2
-3
-4
1
2
3
4
0 2 3 4 1-1
-1
-2
-3-4 -2
-3
-4
1
2
3
4
0 2 3 4
1-1
-1-3-4-5 -2
1
23
45
6
7
8
0 2 3 4 5
x
y
x
y
x
y
GRAPH ANALYSISActivity 10
Description: This activity will enable you to determine the domain of the function.Direction: Consider the graphs below. Answer the questions that follow.
The graph of f(x) = x2
QU
ESTIONS?
1. Does each graph represent a function? Why? 2. Whatisthedomainofthefirstgraph?Secondgraph?Thirdgraph?
Explain each.3. Doesthefirstgraphtouchthey-axis?Whyorwhynot?
4. In f(x) = 1x
, what happens to the value of the function if x = 0? Does
this value affect the domain of the function?5. In f(x) = √x, what happens to the value of the function if x<0,or
negative? Does this value help in determining the domain of the function?
6. In f(x) = x2, is there a value of x that will make the function undefined?Ifyes,specify:_____________________.
7. Makeareflectionabouttheactivity.
You have tried identifying the domain and the range of the graph of the function. Whataboutifyouareaskedtofindthedomainofthefunctionitselfwithoutitsgraph.Try this one!
Illustrative Example Determine the domain of each function below. Check the solution using calculator. 1. f(x) = 3x 2. f(x) = x2
3. f(x) = √x – 2
4. f(x) = x + 1x
The graph of f(x) = 1x
The graph of f(x) = √x
Teacher’s Note and RemindersDon’tForget!
178
Solutions:
1. In f(x) = 3x, there is no value of x that makes the function fundefined.Thus,thedomain of f(x) = 3x is the set of real numbers or {x|x ∈ ℜ}.
2. In f(x) = x2, there is no value of x that makes the function fundefined.Thus,thedomain of f(x) = x2 is the set of real numbers or {x|x ∈ ℜ}.
3. In f(x) = √x – 2 , the domain of the function is the set of values of x that will not make √x – 2 an imaginary number. Examples of these values of x are 2, 2.1, 3, 3.74, 4, 5, and so on. However, x = 1 cannot be because it can give the value of the function
√1 – 2 = √-1
which is imaginary where the calculator yields an Error or a Math Error. The numbers between 1 and 2 neither work. Thus, the domain of the function is x is greater than or equal to 2, or {x|x ≥ 2}.Foryoutofindeasilythedomainofthe function, we say the radicand ≥ 0. That is, x – 2 ≥ 0 which gives x ≥ 2 if simplified.
4. In f(x) = x + 1x
, the domain of the function is the set of values of x that will
not make x + 1x
undefined. The value x = 0 will make the expression x + 1x
undefined.Whentheanswer is undefined, the calculator yields an Error or a Math Error. Thus, x = 0 is not part of the domain. The domain, therefore, of the function is the set of real numbers except 0, or {x|x ∈ ℜ, x ≠ 0}. To find easily the domain of the function, we say denominator is not equal to zero, or x ≠ 0.
Exercise 15 Find the domain of each function.
1. g(x) = 5x + 1 6. g(x) = 3x + 4x – 1
2. g(x) = x – 7 7. g(x) = √x – 8
3. g(x) = √x 8. g(x) = 3xx + 6
4. g(x) = √x + 1 9. g(x) = √2x – 4
5. g(x) = x + 4x – 2
10. g(x) = x + 43x – 5
Note that the value of the function will not be a real number if it is an imaginary numberorundefined.
Teacher’s Note and Reminders
Don’tForget!
Answers to Exercise 15:
1. {x|x ∈ ℜ} 6. {x|x ∈ ℜ, x≠1}2. {x|x ∈ ℜ} 7. {x|x ≥ 8}3. {x|x ≥ 0} 8. {x|x ∈ ℜ, x≠-6}4. {x|x ≥ -1} 9. {x|x ≥ 2}5. {x|x ∈ ℜ, x≠2} 10. {x|x ∈ ℜ, x≠5/3}
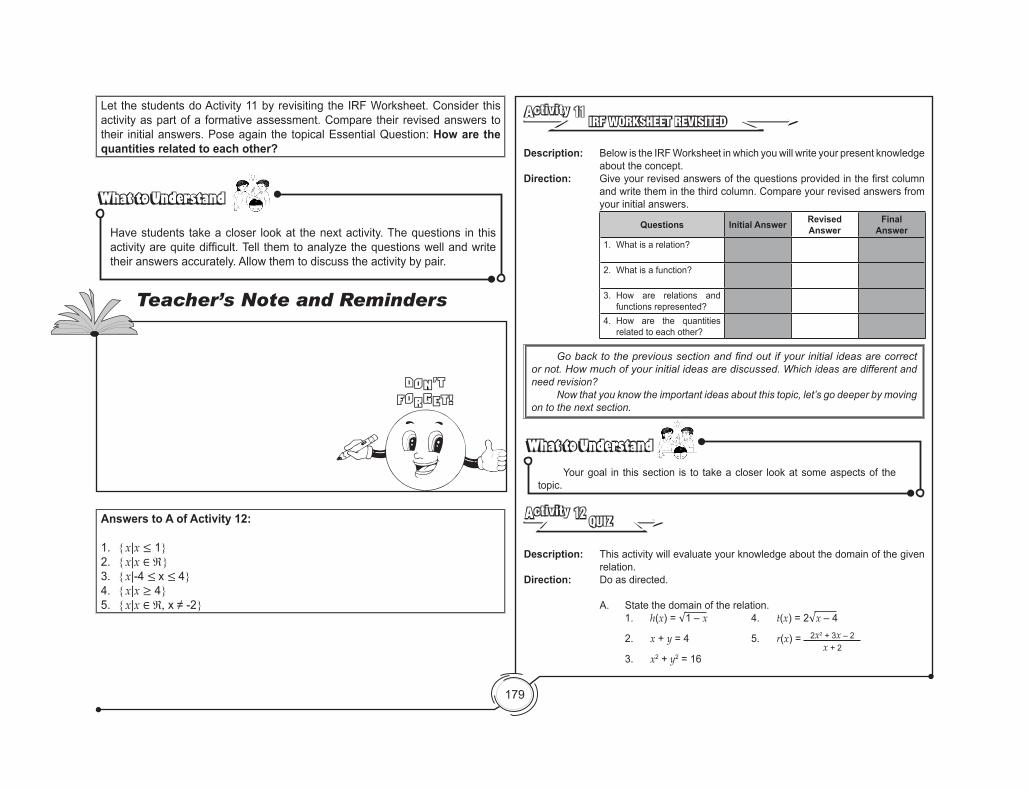
179
IRF WORKSHEET REVISITEDActivity 11
Description: Below is the IRF Worksheet in which you will write your present knowledge about the concept.
Direction: Giveyourrevisedanswersofthequestionsprovidedinthefirstcolumnand write them in the third column. Compare your revised answers from your initial answers.
Questions Initial Answer Revised Answer
Final Answer
1. What is a relation?
2. What is a function?
3. How are relations and functions represented?
4. How are the quantities related to each other?
Gobacktotheprevioussectionandfindoutifyourinitialideasarecorrector not. How much of your initial ideas are discussed. Which ideas are different and need revision? Now that you know the important ideas about this topic, let’s go deeper by moving on to the next section.
What to UnderstandWhat to Understand Your goal in this section is to take a closer look at some aspects of the topic.
QUIZActivity 12
Description: This activity will evaluate your knowledge about the domain of the given relation.
Direction: Do as directed.
A. State the domain of the relation. 1. h(x) = √1 – x 4. t(x) = 2√x – 4
2. x + y = 4 5. r(x) = 2x2 + 3x – 2x + 2
3. x2 + y2 = 16
Answers to A of Activity 12:
1. {x|x ≤ 1} 2. {x|x ∈ ℜ} 3. {x|-4 ≤ x ≤ 4} 4. {x|x ≥ 4} 5. {x|x ∈ ℜ, x≠-2}
Let the students do Activity 11 by revisiting the IRF Worksheet. Consider this activity as part of a formative assessment. Compare their revised answers to their initial answers. Pose again the topical Essential Question: How are the quantities related to each other?
What to UnderstandWhat to Understand
Have students take a closer look at the next activity. The questions in this activityarequitedifficult.Tell themtoanalyzethequestionswellandwritetheir answers accurately. Allow them to discuss the activity by pair.
Teacher’s Note and Reminders
Don’tForget!
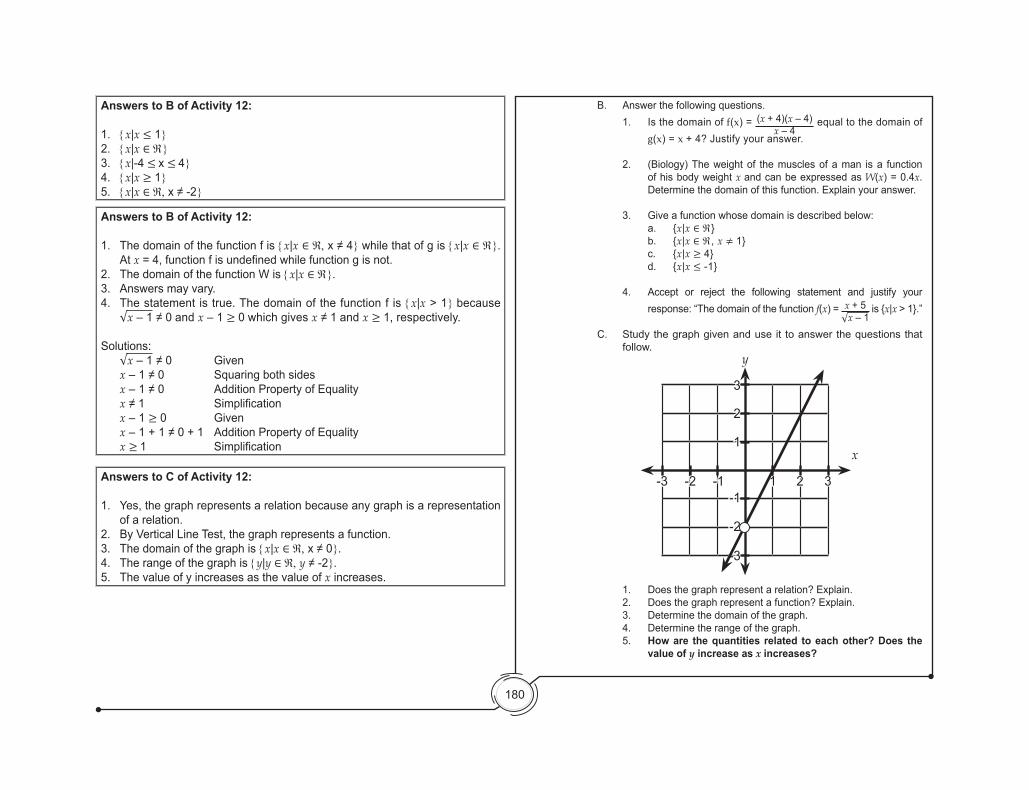
180
B. Answer the following questions.1. Is the domain of f(x) = (x + 4)(x – 4)
x – 4 equal to the domain of
g(x) = x + 4? Justify your answer.
2. (Biology) The weight of the muscles of a man is a function of his body weight x and can be expressed as W(x) = 0.4x. Determine the domain of this function. Explain your answer.
3. Give a function whose domain is described below: a. {x|x ∈ ℜ} b. {x|x ∈ ℜ, x ≠ 1} c. {x|x ≥ 4}
d. {x|x ≤ -1}
4. Accept or reject the following statement and justify your response: “The domain of the function f(x) = x + 5
√x – 1 is {x|x > 1}.”
C. Study the graph given and use it to answer the questions that follow.
1. Does the graph represent a relation? Explain.2. Does the graph represent a function? Explain.3. Determine the domain of the graph.4. Determine the range of the graph.5. How are the quantities related to each other? Does the
value of y increase as x increases?
y
-3
-3
-2
-2
-1-1
1
1
2
2
3
3
x
Answers to B of Activity 12:
1. {x|x ≤ 1} 2. {x|x ∈ ℜ} 3. {x|-4 ≤ x ≤ 4} 4. {x|x ≥ 1} 5. {x|x ∈ ℜ, x≠-2}
Answers to B of Activity 12: 1. The domain of the function f is {x|x ∈ ℜ, x≠4} while that of g is {x|x ∈ ℜ}.
At x = 4, function f is undefined while function g is not.2. The domain of the function W is {x|x ∈ ℜ}.3. Answers may vary.4. The statement is true. The domain of the function f is {x|x > 1} because
√x–1≠0andx – 1 ≥ 0 which gives x≠1andx ≥ 1, respectively.
Solutions: √x–1≠0 Given x–1≠0 Squaringbothsides x–1≠0 AdditionPropertyofEquality x ≠1 Simplification x – 1 ≥ 0 Given x–1+1≠0+1 AdditionPropertyofEquality x ≥ 1 Simplification
Answers to C of Activity 12: 1. Yes, the graph represents a relation because any graph is a representation
of a relation.2. By Vertical Line Test, the graph represents a function.3. The domain of the graph is {x|x ∈ ℜ, x≠0}.4. The range of the graph is {y|y ∈ ℜ, y≠-2}.5. The value of y increases as the value of x increases.

181
IRF WORKSHEET REVISITEDActivity 13
Description: Below is the IRF Worksheet in which you will give your present knowledge about the concept.
Direction: Giveyourfinalanswersofthequestionsprovidedinthefirstcolumnandwrite them in the third column. Compare your revised answers from your initial and revised answers.
Questions Initial Answer
Revised Answer
Final Answer
1. What is a relation?2. What is a function?3. How are relations and
functions represented?4. How are the
quantities related to each other?
What new realizations do you have about the topic? What new connections have you made for yourself? Now that you have a deeper understanding of the topic, you are ready to do the tasks in the next section.
What to TransferWhat to Transfer
Your goal in this section is to apply your learning to real-life situations. You will be given a practical task which will demonstrate your understanding.
What to TransferWhat to Transfer
Your goal in this section is to apply your learning to real-life situations. You will be given a practical task which will demonstrate your understanding.
GALLERY WALKActivity 14
Description: Your output of this activity is one of your projects for the second quarter. It summarizes the representations of relations and functions. This could be done by groups of 5 to 8 members each. Before doing this project, you are requiredtohavearesearchonmakingaleaflet.
Direction: You make an informative leaflet providing the information about therepresentations of relations and functions. Each member in the group will give a relation and write its representations. Arrange these in a creative manner. Your group output will be assessed using the rubric on the next page.
Before the students move to the next section of this lesson, give a short test (formative test) to find out how well they understood the lesson. Let them give their present knowledge about the concept. This is one way of assessing the student’s self-knowledge on the topic.
Teacher’s Note and Reminders
Don’tForget!

182
RUBRIC: INFORMATIVE LEAFLET
CRITERIA Exemplary4
Satisfactory3
Developing2
Beginning1
RequiredElements
Theleafletincludes all required elements as well as additional information.
All required elements are included on the leaflet.
All but 1 or 2 of the required elements are not included on theleaflet.
Several required elements were missing.
Graphics -Relevance /
Color
All graphics are related to the topic and make it easier to understand.All borrowed graphics have a source citation.
All graphics are related to the topic. Allborrowed graphics have a source citation.
All graphics relate to the topic. One or two borrowed graphics were not cited.
Graphics do not relate to the topic or several borrowed graphics were not cited.
Attractiveness/Formatting
Theleafletisexceptionally attractivein terms of design, layout, and neatness.
Theleafletisattractive in terms of design, layout and neatness.
Theleafletisacceptably attractive though it may be a bit messy.
Theleafletisdistractingly messy or very poorly designed. It is not attractive.
Inthissection,yourtaskwastomakeaninformativeleaflet.Howdidyoufindtheperformance task? Continue studying the next lesson for further understanding about functions.
Teacher’s Note and Reminders
Don’tForget!
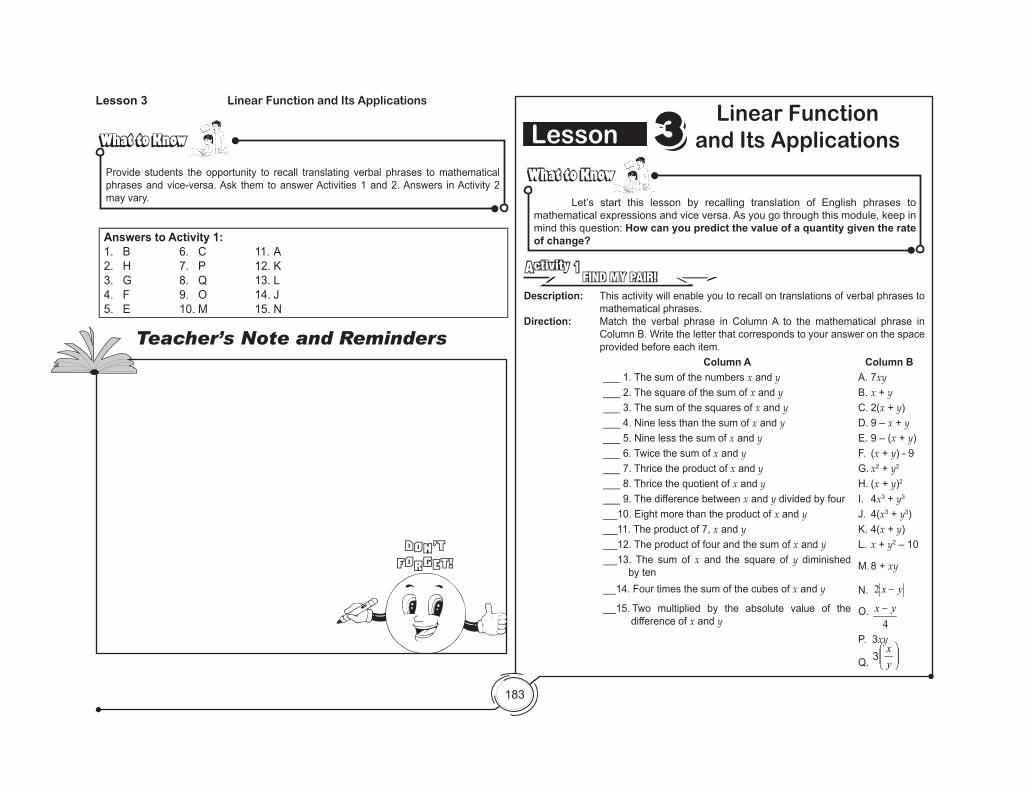
183
Lesson 33Linear Function
and Its Applications
What to KnowWhat to Know
Let’s start this lesson by recalling translation of English phrases to mathematical expressions and vice versa. As you go through this module, keep in mind this question: How can you predict the value of a quantity given the rate of change?
FIND MY PAIR!Activity 1
Description: This activity will enable you to recall on translations of verbal phrases to mathematical phrases.
Direction: Match the verbal phrase in Column A to the mathematical phrase in Column B. Write the letter that corresponds to your answer on the space provided before each item.
Column A Column B___ 1. The sum of the numbers x and y A. 7xy___ 2. The square of the sum of x and y B. x + y___ 3. The sum of the squares of x and y C. 2(x + y)___ 4. Nine less than the sum of x and y D. 9 – x + y___ 5. Nine less the sum of x and y E. 9 – (x + y)___ 6. Twice the sum of x and y F. (x + y) - 9___ 7. Thrice the product of x and y G. x2 + y2
___ 8. Thrice the quotient of x and y H. (x + y)2
___ 9. The difference between x and y divided by four I. 4x3 + y3
___10. Eight more than the product of x and y J. 4(x3 + y3)___11. The product of 7, x and y K. 4(x + y)___12. The product of four and the sum of x and y L. x + y2 – 10___13. The sum of x and the square of y diminished
by ten M. 8 + xy
___14. Four times the sum of the cubes of x and y N. yx −2
___15.]Two multiplied by the absolute value of the difference of x and y
O. 4
yx −
P. 3xy
Q.
yx33
Lesson 3 Linear Function and Its Applications
What to KnowWhat to Know
Provide students the opportunity to recall translating verbal phrases to mathematical phrases and vice-versa. Ask them to answer Activities 1 and 2. Answers in Activity 2 may vary.
Answers to Activity 1:1. B 6. C 11. A2. H 7. P 12. K3. G 8. Q 13. L4. F 9. O 14. J5. E 10. M 15. N
Teacher’s Note and Reminders
Don’tForget!
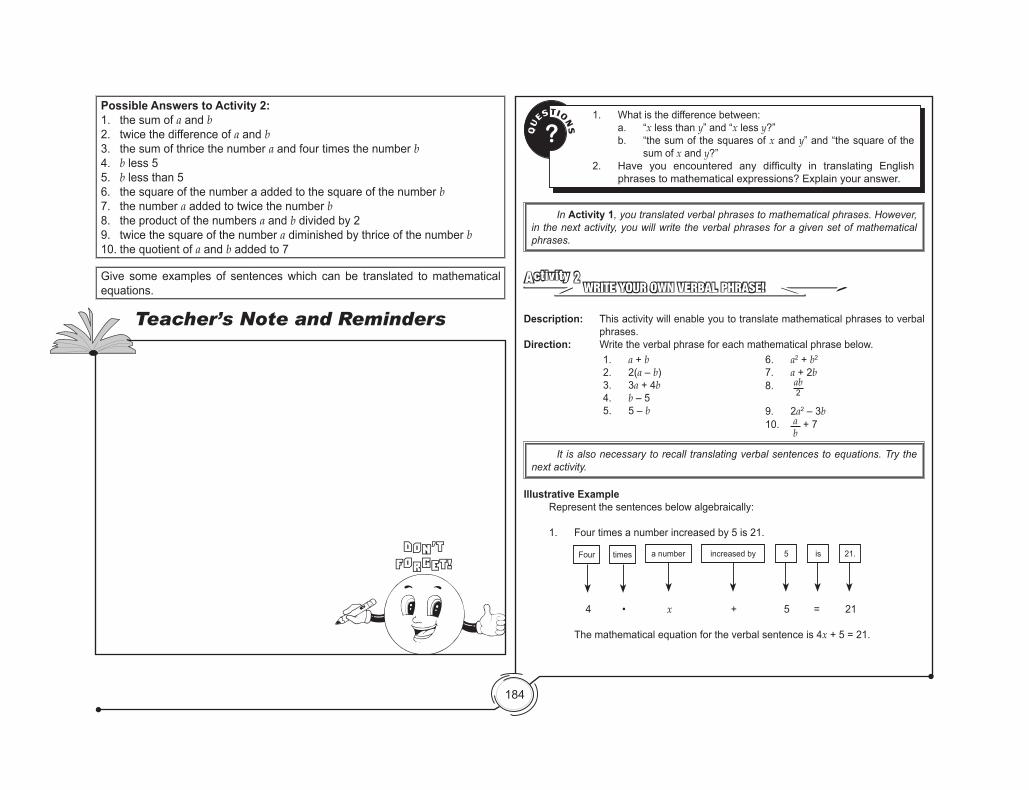
184
QU
ESTIONS?
1. What is the difference between: a. “x less than y” and “x less y?”
b. “the sum of the squares of x and y” and “the square of the sum of x and y?”
2. Have you encountered any difficulty in translating Englishphrases to mathematical expressions? Explain your answer.
In Activity 1, you translated verbal phrases to mathematical phrases. However, in the next activity, you will write the verbal phrases for a given set of mathematical phrases.
It is also necessary to recall translating verbal sentences to equations. Try the next activity.
WRITE YOUR OWN VERBAL PHRASE!Activity 2
Description: This activity will enable you to translate mathematical phrases to verbal phrases.
Direction: Write the verbal phrase for each mathematical phrase below.1. a + b2. 2(a – b)3. 3a + 4b4. b – 55. 5 – b
6. a2 + b2
7. a + 2b8. ab
2
9. 2a2 – 3b10. a
b + 7
Illustrative Example Represent the sentences below algebraically:
1. Four times a number increased by 5 is 21.
4 • x + 5 = 21 The mathematical equation for the verbal sentence is 4x + 5 = 21.
Four times a number increased by 5 is 21.
Possible Answers to Activity 2:1. the sum of a and b2. twice the difference of a and b3. the sum of thrice the number a and four times the number b4. b less 55. b less than 56. the square of the number a added to the square of the number b7. the number a added to twice the number b8. the product of the numbers a and b divided by 29. twice the square of the number a diminished by thrice of the number b10. the quotient of a and b added to 7
Give some examples of sentences which can be translated to mathematical equations.
Teacher’s Note and Reminders
Don’tForget!
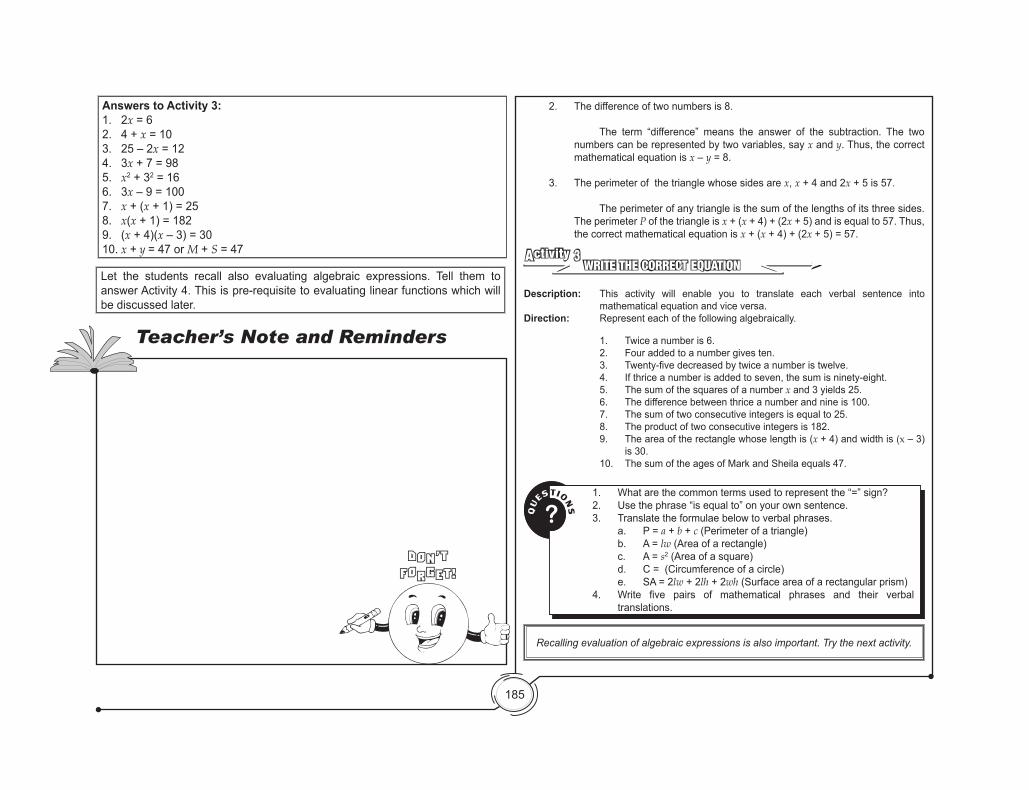
185
Recalling evaluation of algebraic expressions is also important. Try the next activity.
2. The difference of two numbers is 8.
The term “difference” means the answer of the subtraction. The two numbers can be represented by two variables, say x and y. Thus, the correct mathematical equation is x – y = 8.
3. The perimeter of the triangle whose sides are x, x + 4 and 2x + 5 is 57.
The perimeter of any triangle is the sum of the lengths of its three sides. The perimeter P of the triangle is x + (x + 4) + (2x + 5) and is equal to 57. Thus, the correct mathematical equation is x + (x + 4) + (2x + 5) = 57.
WRITE THE CORRECT EQUATIONActivity 3
Description: This activity will enable you to translate each verbal sentence into mathematical equation and vice versa.
Direction: Represent each of the following algebraically.
1. Twice a number is 6.2. Four added to a number gives ten.3. Twenty-fivedecreasedbytwiceanumberistwelve.4. If thrice a number is added to seven, the sum is ninety-eight.5. The sum of the squares of a number x and 3 yields 25.6. The difference between thrice a number and nine is 100.7. The sum of two consecutive integers is equal to 25.8. The product of two consecutive integers is 182.9. The area of the rectangle whose length is (x + 4) and width is (x – 3)
is 30.10. The sum of the ages of Mark and Sheila equals 47.
QU
ESTIONS?
1. What are the common terms used to represent the “=” sign? 2. Use the phrase “is equal to” on your own sentence.3. Translate the formulae below to verbal phrases. a. P = a + b + c (Perimeter of a triangle) b. A = lw (Area of a rectangle) c. A = s2 (Area of a square) d. C = (Circumference of a circle) e. SA = 2lw + 2lh + 2wh (Surface area of a rectangular prism)4. Write five pairs of mathematical phrases and their verbal
translations.
Answers to Activity 3:1. 2x = 62. 4 + x = 103. 25 – 2x = 124. 3x + 7 = 985. x2 + 32 = 166. 3x – 9 = 1007. x + (x + 1) = 258. x(x + 1) = 1829. (x + 4)(x – 3) = 3010. x + y = 47 or M + S = 47
Let the students recall also evaluating algebraic expressions. Tell them to answer Activity 4. This is pre-requisite to evaluating linear functions which will be discussed later.
Teacher’s Note and Reminders
Don’tForget!
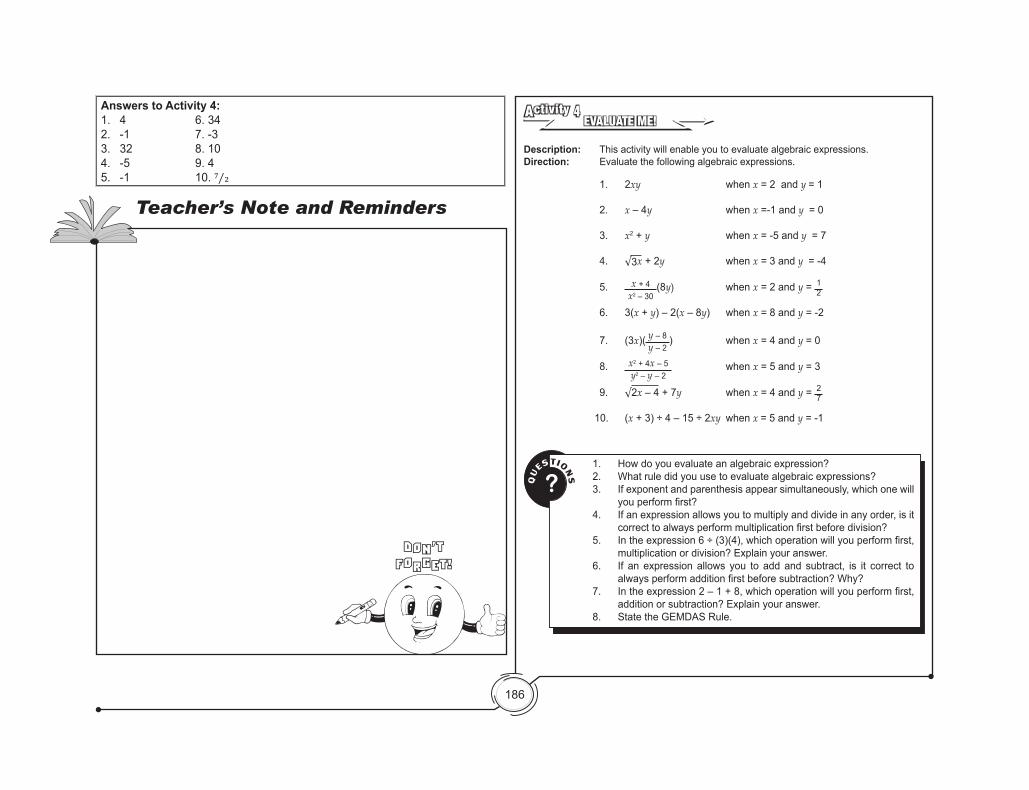
186
EVALUATE ME!Activity 4
Description: This activity will enable you to evaluate algebraic expressions.Direction: Evaluate the following algebraic expressions.
1. 2xy when x = 2 and y = 1
2. x – 4y when x =-1 and y = 0
3. x2 + y when x = -5 and y = 7
4. √3x + 2y when x = 3 and y = -4
5. x + 4x2 – 30
(8y) when x = 2 and y = 12
6. 3(x + y) – 2(x – 8y) when x = 8 and y = -2
7. (3x)( y – 8y – 2
) when x = 4 and y = 0
8. x2 + 4x – 5y2 – y – 2
when x = 5 and y = 3
9. √2x – 4 + 7y when x = 4 and y = 27
10. (x + 3) ÷ 4 – 15 ÷ 2xy when x = 5 and y = -1
QU
ESTIONS?
1. How do you evaluate an algebraic expression?2. What rule did you use to evaluate algebraic expressions?3. If exponent and parenthesis appear simultaneously, which one will
youperformfirst?4. If an expression allows you to multiply and divide in any order, is it
correcttoalwaysperformmultiplicationfirstbeforedivision?5. Intheexpression6÷(3)(4),whichoperationwillyouperformfirst,
multiplication or division? Explain your answer.6. If an expression allows you to add and subtract, is it correct to
alwaysperformadditionfirstbeforesubtraction?Why?7. Intheexpression2–1+8,whichoperationwillyouperformfirst,
addition or subtraction? Explain your answer.8. State the GEMDAS Rule.
Answers to Activity 4:1. 4 6. 342. -1 7. -33. 32 8. 104. -5 9. 45. -1 10. 7/2
Teacher’s Note and Reminders
Don’tForget!
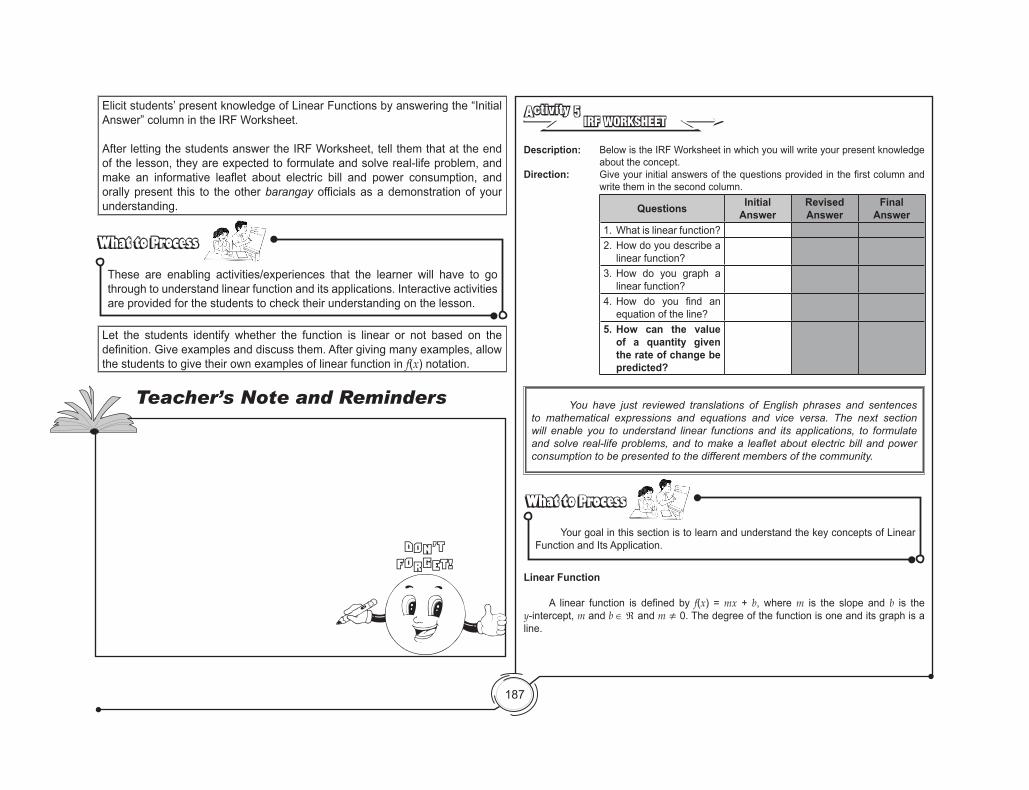
187
IRF WORKSHEET Activity 5
Description: Below is the IRF Worksheet in which you will write your present knowledge about the concept.
Direction: Giveyourinitialanswersofthequestionsprovidedinthefirstcolumnandwrite them in the second column.
Questions Initial Answer
Revised Answer
Final Answer
1. What is linear function?2. How do you describe a
linear function?3. How do you graph a
linear function?4.How do you find an
equation of the line?5. How can the value
of a quantity given the rate of change be predicted?
You have just reviewed translations of English phrases and sentences to mathematical expressions and equations and vice versa. The next section will enable you to understand linear functions and its applications, to formulate andsolve real-lifeproblems,and tomakea leafletaboutelectricbillandpowerconsumption to be presented to the different members of the community.
Your goal in this section is to learn and understand the key concepts of Linear Function and Its Application.
What to ProcessWhat to Process
Linear Function
A linear function is defined by f(x) = mx + b, where m is the slope and b is the y-intercept, m and b ∈ ℜ and m ≠ 0. The degree of the function is one and its graph is a line.
Elicit students’ present knowledge of Linear Functions by answering the “Initial Answer” column in the IRF Worksheet.
After letting the students answer the IRF Worksheet, tell them that at the end of the lesson, they are expected to formulate and solve real-life problem, and make an informative leaflet about electric bill and power consumption, and orally present this to the other barangay officials as a demonstration of your understanding.
Let the students identify whether the function is linear or not based on the definition. Give examples and discuss them. After giving many examples, allow the students to give their own examples of linear function in f(x) notation.
These are enabling activities/experiences that the learner will have to go through to understand linear function and its applications. Interactive activities are provided for the students to check their understanding on the lesson.
What to ProcessWhat to Process
Teacher’s Note and Reminders
Don’tForget!
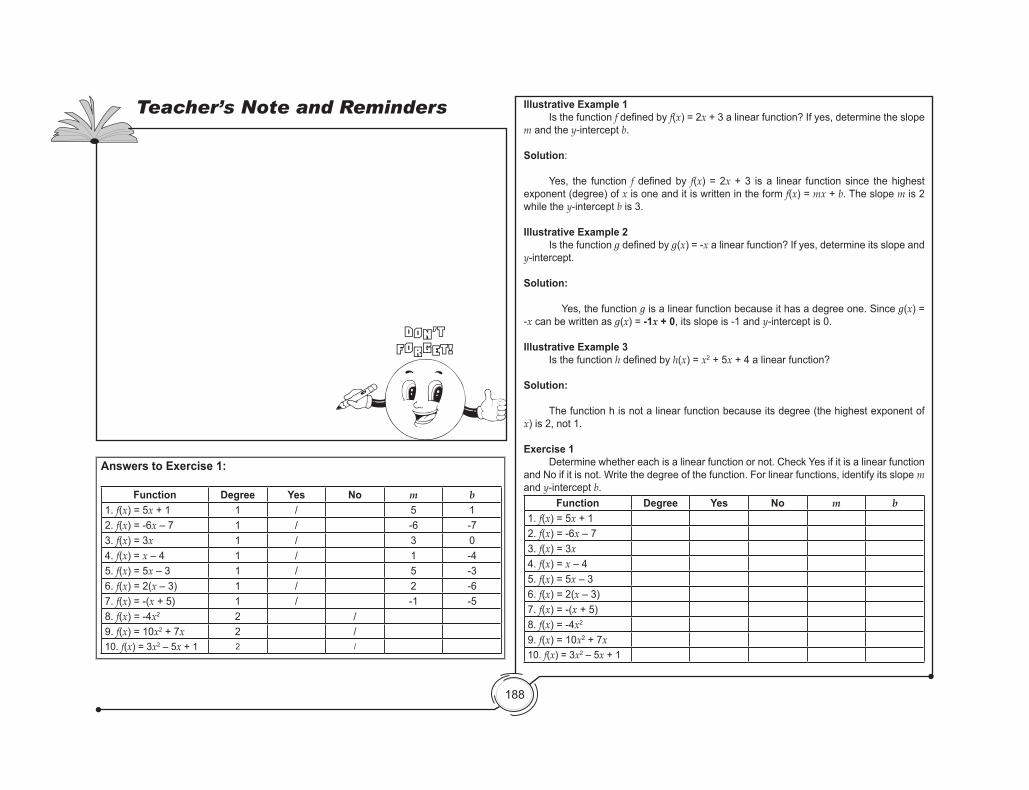
188
Illustrative Example 1Is the function fdefinedbyf(x) = 2x + 3 a linear function? If yes, determine the slope
m and the y-intercept b.
Solution:
Yes, the function f definedby f(x) = 2x + 3 is a linear function since the highest exponent (degree) of x is one and it is written in the form f(x) = mx + b. The slope m is 2 while the y-intercept b is 3.
Illustrative Example 2Is the function gdefinedbyg(x) = -x a linear function? If yes, determine its slope and
y-intercept.
Solution:
Yes, the function g is a linear function because it has a degree one. Since g(x) = -x can be written as g(x) = -1x + 0, its slope is -1 and y-intercept is 0.
Illustrative Example 3 Is the function hdefinedbyh(x) = x2 + 5x + 4 a linear function?
Solution:
The function h is not a linear function because its degree (the highest exponent of x) is 2, not 1.
Exercise 1 Determine whether each is a linear function or not. Check Yes if it is a linear function and No if it is not. Write the degree of the function. For linear functions, identify its slope m and y-intercept b.
Function Degree Yes No m b1. f(x) = 5x + 12. f(x) = -6x – 73. f(x) = 3x4. f(x) = x – 45. f(x) = 5x – 36. f(x) = 2(x – 3)7. f(x) = -(x + 5)8. f(x) = -4x2
9. f(x) = 10x2 + 7x10. f(x) = 3x2 – 5x + 1
Answers to Exercise 1:
Function Degree Yes No m b1. f(x) = 5x + 1 1 / 5 12. f(x) = -6x – 7 1 / -6 -73. f(x) = 3x 1 / 3 04. f(x) = x – 4 1 / 1 -45. f(x) = 5x – 3 1 / 5 -36. f(x) = 2(x – 3) 1 / 2 -67. f(x) = -(x + 5) 1 / -1 -58. f(x) = -4x2 2 /9. f(x) = 10x2 + 7x 2 /10. f(x) = 3x2 – 5x + 1 2 /
Teacher’s Note and Reminders
Don’tForget!
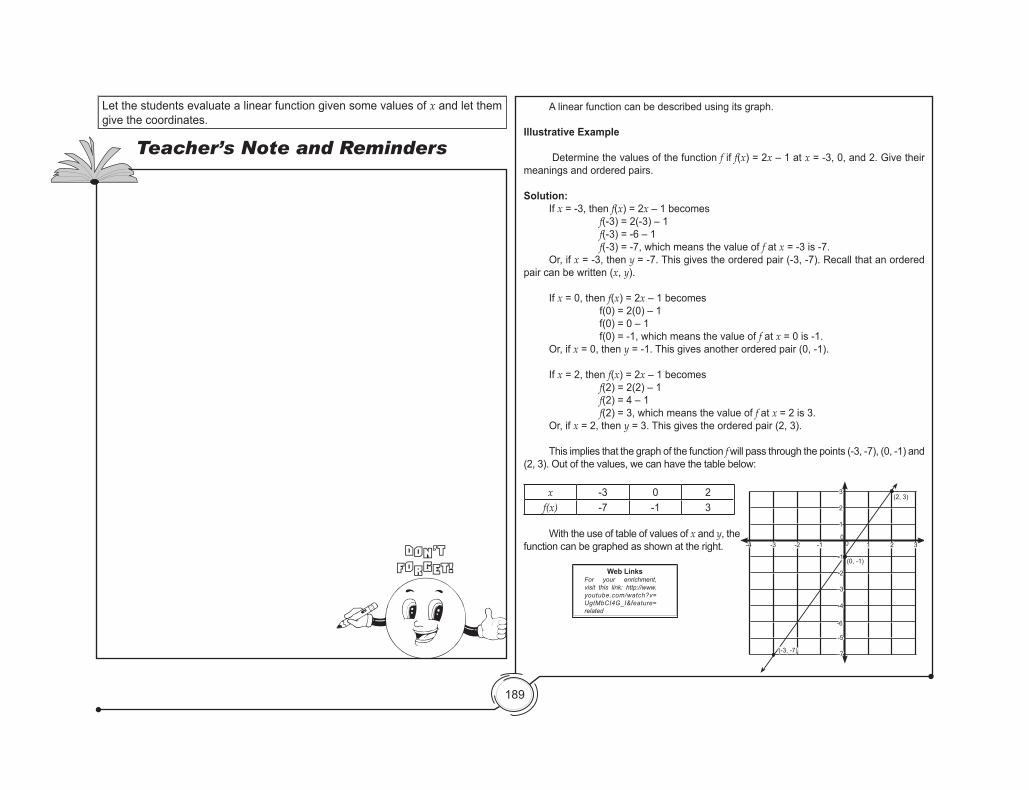
189
Illustrative Example
Determine the values of the function f if f(x) = 2x – 1 at x = -3, 0, and 2. Give their meanings and ordered pairs.
Solution: If x = -3, then f(x) = 2x – 1 becomes f(-3) = 2(-3) – 1 f(-3) = -6 – 1 f(-3) = -7, which means the value of f at x = -3 is -7. Or, if x = -3, then y = -7. This gives the ordered pair (-3, -7). Recall that an ordered pair can be written (x, y).
If x = 0, then f(x) = 2x – 1 becomes f(0) = 2(0) – 1 f(0) = 0 – 1 f(0) = -1, which means the value of f at x = 0 is -1. Or, if x = 0, then y = -1. This gives another ordered pair (0, -1). If x = 2, then f(x) = 2x – 1 becomes f(2) = 2(2) – 1 f(2) = 4 – 1 f(2) = 3, which means the value of f at x = 2 is 3. Or, if x = 2, then y = 3. This gives the ordered pair (2, 3).
This implies that the graph of the function f will pass through the points (-3, -7), (0, -1) and (2, 3). Out of the values, we can have the table below:
x -3 0 2f(x) -7 -1 3
With the use of table of values of x and y, the function can be graphed as shown at the right.
A linear function can be described using its graph.
Web LinksFor your enrichment, visit this link: http://www.youtube.com/watch?v=UgtMbCI4G_I&feature=related
3
2
(2, 3)
(-3, -7)
1
-1
-1
-2
-3
-4
-5
-6
-7
-2-30
0 1 2 3-4
(0, -1)
Let the students evaluate a linear function given some values of x and let them give the coordinates.
Teacher’s Note and Reminders
Don’tForget!
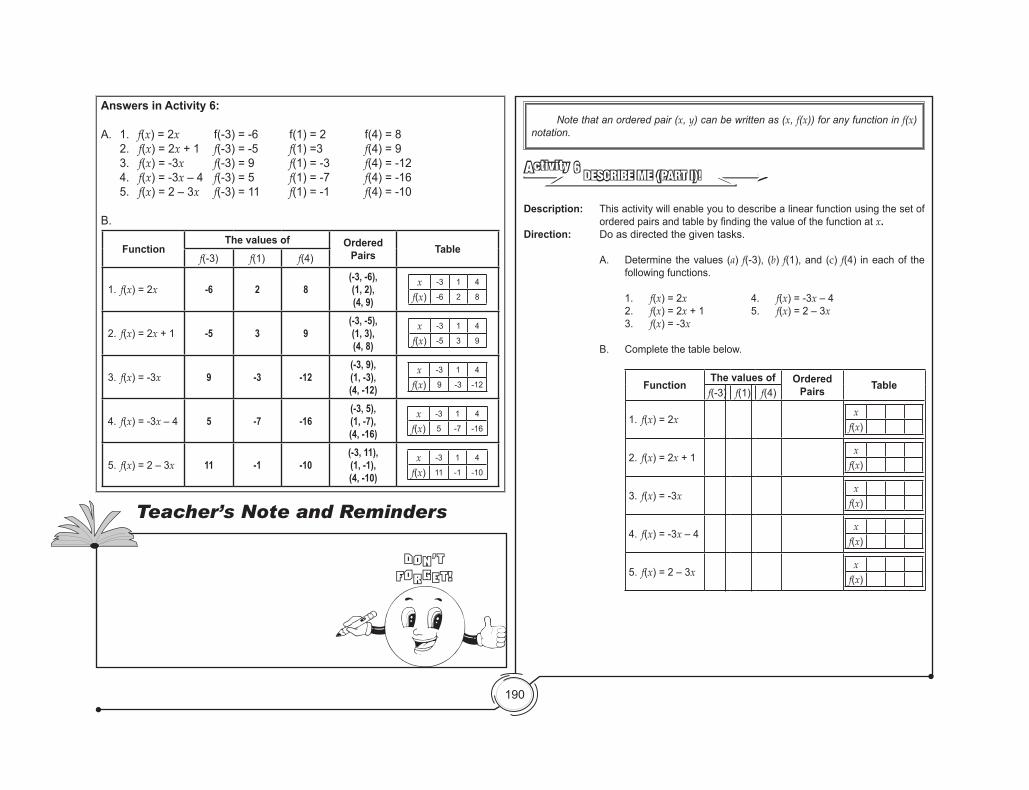
190
Note that an ordered pair (x, y) can be written as (x, f(x)) for any function in f(x) notation.
DESCRIBE ME (PART I)!Activity 6
Description: This activity will enable you to describe a linear function using the set of orderedpairsandtablebyfindingthevalueofthefunctionat x.
Direction: Do as directed the given tasks.
A. Determine the values (a) f(-3), (b) f(1), and (c) f(4) in each of the following functions.
1. f(x) = 2x 4. f(x) = -3x – 4 2. f(x) = 2x + 1 5. f(x) = 2 – 3x 3. f(x) = -3x
B. Complete the table below.
FunctionThe values of Ordered
Pairs Tablef(-3) f(1) f(4)
1. f(x) = 2xx
f(x)
2. f(x) = 2x + 1x
f(x)
3. f(x) = -3xx
f(x)
4. f(x) = -3x – 4x
f(x)
5. f(x) = 2 – 3xx
f(x)
Answers in Activity 6:
A. 1. f(x) = 2x f(-3) = -6 f(1) = 2 f(4) = 8 2. f(x) = 2x + 1 f(-3) = -5 f(1) =3 f(4) = 9 3. f(x) = -3x f(-3) = 9 f(1) = -3 f(4) = -12 4. f(x) = -3x – 4 f(-3) = 5 f(1) = -7 f(4) = -16 5. f(x) = 2 – 3x f(-3) = 11 f(1) = -1 f(4) = -10
B.
FunctionThe values of Ordered
Pairs Tablef(-3) f(1) f(4)
1. f(x) = 2x -6 2 8(-3, -6), (1, 2),(4, 9)
x -3 1 4
f(x) -6 2 8
2. f(x) = 2x + 1 -5 3 9(-3, -5), (1, 3),(4, 8)
x -3 1 4
f(x) -5 3 9
3. f(x) = -3x 9 -3 -12(-3, 9), (1, -3),(4, -12)
x -3 1 4
f(x) 9 -3 -12
4. f(x) = -3x – 4 5 -7 -16(-3, 5), (1, -7),(4, -16)
x -3 1 4
f(x) 5 -7 -16
5. f(x) = 2 – 3x 11 -1 -10(-3, 11), (1, -1),(4, -10)
x -3 1 4
f(x) 11 -1 -10
Teacher’s Note and Reminders
Don’tForget!
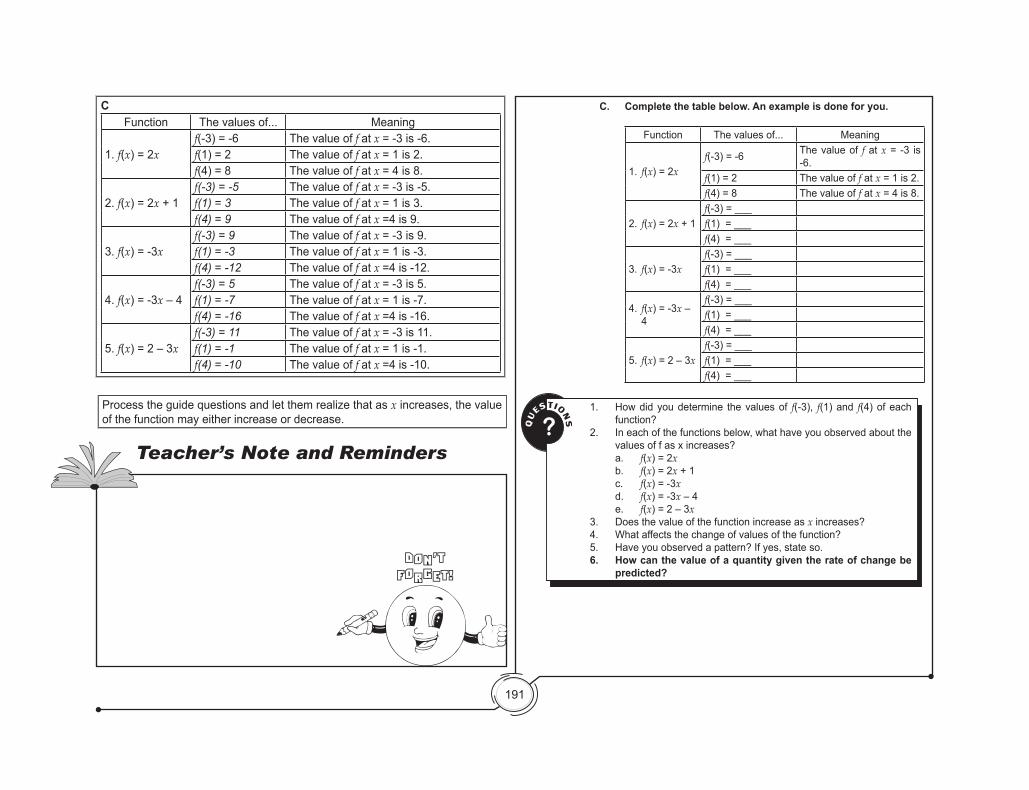
191
C. Complete the table below. An example is done for you.
Function The values of... Meaning
1. f(x) = 2xf(-3) = -6 The value of f at x = -3 is
-6.f(1) = 2 The value of f at x = 1 is 2.f(4) = 8 The value of f at x = 4 is 8.
2. f(x) = 2x + 1f(-3) = ___f(1) = ___f(4) = ___
3. f(x) = -3xf(-3) = ___f(1) = ___f(4) = ___
4. f(x) = -3x – 4
f(-3) = ___f(1) = ___f(4) = ___
5. f(x) = 2 – 3xf(-3) = ___f(1) = ___f(4) = ___
QU
ESTIONS?
1. How did you determine the values of f(-3), f(1) and f(4) of each function?
2. In each of the functions below, what have you observed about the values of f as x increases?
a. f(x) = 2x b. f(x) = 2x + 1 c. f(x) = -3x d. f(x) = -3x – 4 e. f(x) = 2 – 3x3. Does the value of the function increase as x increases?4. What affects the change of values of the function?5. Have you observed a pattern? If yes, state so.6. How can the value of a quantity given the rate of change be
predicted?
CFunction The values of... Meaning
1. f(x) = 2xf(-3) = -6 The value of f at x = -3 is -6.f(1) = 2 The value of f at x = 1 is 2.f(4) = 8 The value of f at x = 4 is 8.
2. f(x) = 2x + 1f(-3) = -5 The value of f at x = -3 is -5.f(1) = 3 The value of f at x = 1 is 3.f(4) = 9 The value of f at x =4 is 9.
3. f(x) = -3xf(-3) = 9 The value of f at x = -3 is 9.f(1) = -3 The value of f at x = 1 is -3.f(4) = -12 The value of f at x =4 is -12.
4. f(x) = -3x – 4f(-3) = 5 The value of f at x = -3 is 5.f(1) = -7 The value of f at x = 1 is -7.f(4) = -16 The value of f at x =4 is -16.
5. f(x) = 2 – 3xf(-3) = 11 The value of f at x = -3 is 11.f(1) = -1 The value of f at x = 1 is -1.f(4) = -10 The value of f at x =4 is -10.
Process the guide questions and let them realize that as x increases, the value of the function may either increase or decrease.
Teacher’s Note and Reminders
Don’tForget!
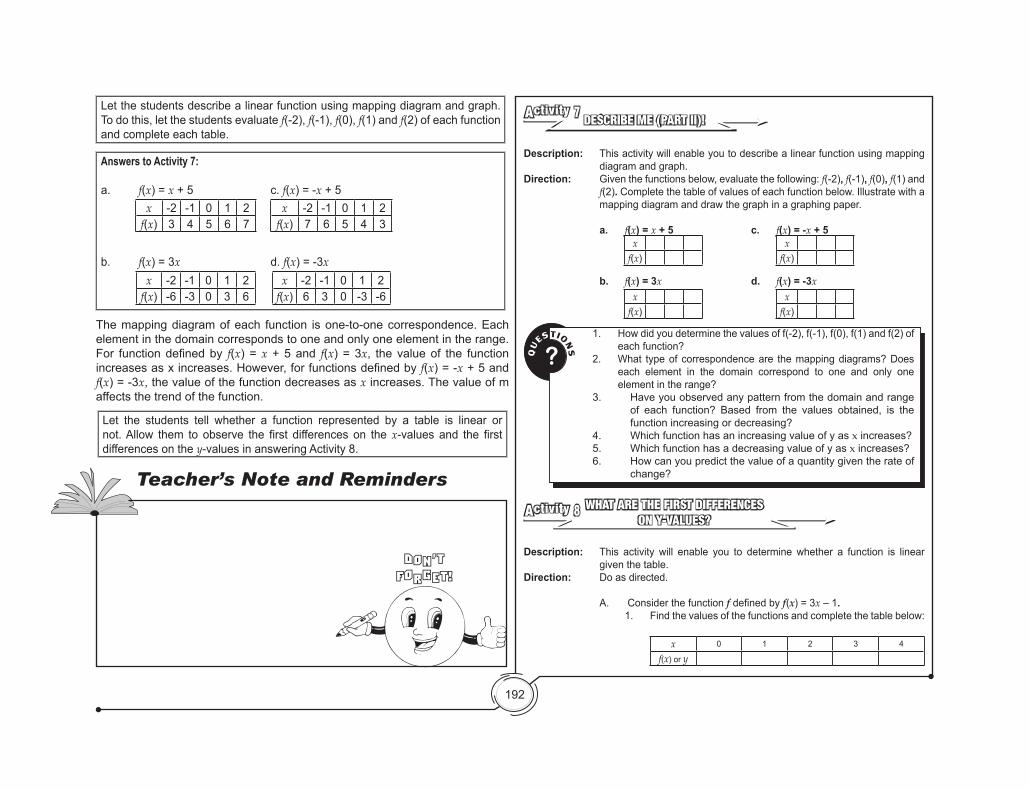
192
DESCRIBE ME (PART II)!Activity 7
Description: This activity will enable you to describe a linear function using mapping diagram and graph.
Direction: Given the functions below, evaluate the following: f(-2), f(-1), f(0), f(1) and f(2). Complete the table of values of each function below. Illustrate with a mapping diagram and draw the graph in a graphing paper.
a. f(x) = x + 5 c. f(x) = -x + 5
b. f(x) = 3x d. f(x) = -3x
xf(x)
xf(x)
xf(x)
xf(x)
QU
ESTIONS?
1. How did you determine the values of f(-2), f(-1), f(0), f(1) and f(2) of each function?
2. What type of correspondence are the mapping diagrams? Does each element in the domain correspond to one and only one element in the range?
3. Have you observed any pattern from the domain and range of each function? Based from the values obtained, is the function increasing or decreasing?
4. Which function has an increasing value of y as x increases? 5. Which function has a decreasing value of y as x increases?6. How can you predict the value of a quantity given the rate of
change?
WHAT ARE THE FIRST DIFFERENCES ON Y-VALUES?
Activity 8
Description: This activity will enable you to determine whether a function is linear given the table.
Direction: Do as directed.
A. Consider the function f definedby f(x) = 3x – 1. 1. Find the values of the functions and complete the table below:
x 0 1 2 3 4
f(x) or y
Let the students describe a linear function using mapping diagram and graph. To do this, let the students evaluate f(-2), f(-1), f(0), f(1) and f(2) of each function and complete each table.
Let the students tell whether a function represented by a table is linear or not. Allow them to observe the first differences on the x-values and the first differences on the y-values in answering Activity 8.
Answers to Activity 7:
a. f(x) = x + 5 c. f(x) = -x + 5
b. f(x) = 3x d. f(x) = -3x
x -2 -1 0 1 2f(x) 3 4 5 6 7
x -2 -1 0 1 2f(x) 7 6 5 4 3
x -2 -1 0 1 2f(x) -6 -3 0 3 6
x -2 -1 0 1 2f(x) 6 3 0 -3 -6
The mapping diagram of each function is one-to-one correspondence. Each element in the domain corresponds to one and only one element in the range. For functiondefinedby f(x) = x + 5 and f(x) = 3x, the value of the function increasesasxincreases.However,forfunctionsdefinedbyf(x) = -x + 5 and f(x) = -3x, the value of the function decreases as x increases. The value of m affects the trend of the function.
Teacher’s Note and Reminders
Don’tForget!
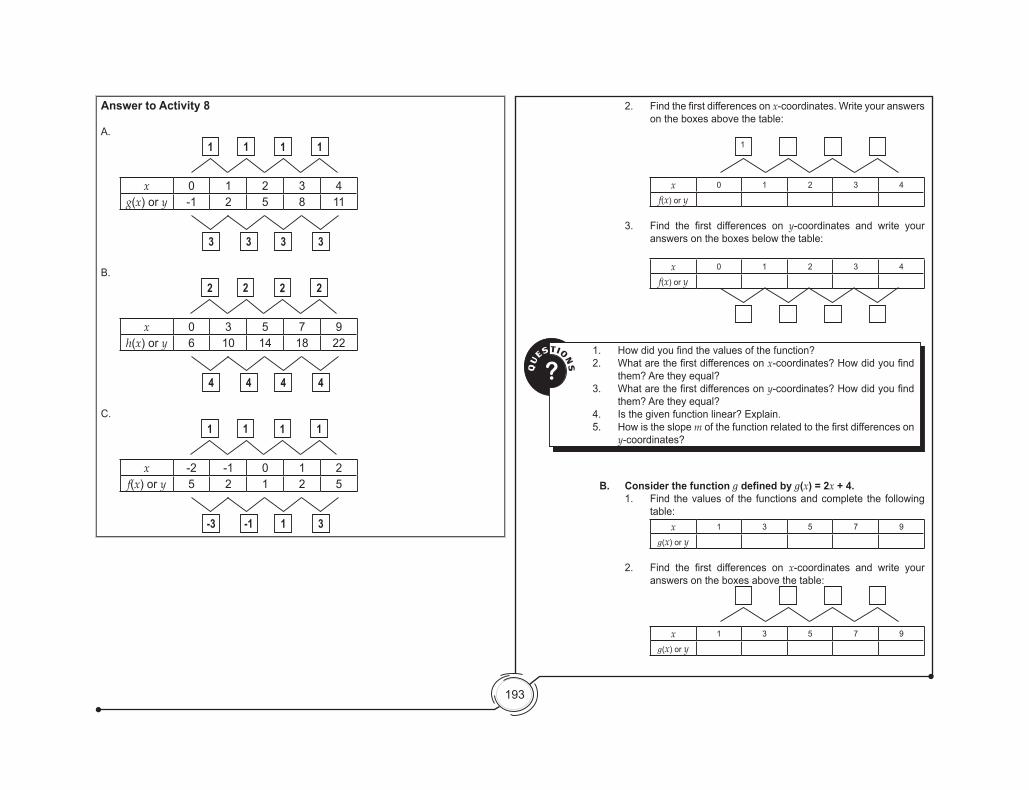
193
2. Findthefirstdifferencesonx-coordinates. Write your answers on the boxes above the table:
x 0 1 2 3 4
f(x) or y
3. Find the first differences on y-coordinates and write your answers on the boxes below the table:
x 0 1 2 3 4
f(x) or y
B. Consider the function g defined by g(x) = 2x + 4.1. Find the values of the functions and complete the following
table:x 1 3 5 7 9
g(x) or y
2. Find the first differences on x-coordinates and write your answers on the boxes above the table:
x 1 3 5 7 9
g(x) or y
QU
ESTIONS?
1. Howdidyoufindthevaluesofthefunction?2. Whatarethefirstdifferencesonx-coordinates?Howdidyoufind
them? Are they equal? 3. Whatarethefirstdifferencesony-coordinates?Howdidyoufind
them? Are they equal?4. Is the given function linear? Explain.5. How is the slope mofthefunctionrelatedtothefirstdifferenceson
y-coordinates?
1
Answer to Activity 8
A.
1 1 1 1
x 0 1 2 3 4
g(x) or y -1 2 5 8 11
3 3 3 3
B.
2 2 2 2
x 0 3 5 7 9
h(x) or y 6 10 14 18 22
4 4 4 4
C.
1 1 1 1
x -2 -1 0 1 2
f(x) or y 5 2 1 2 5
-3 -1 1 3
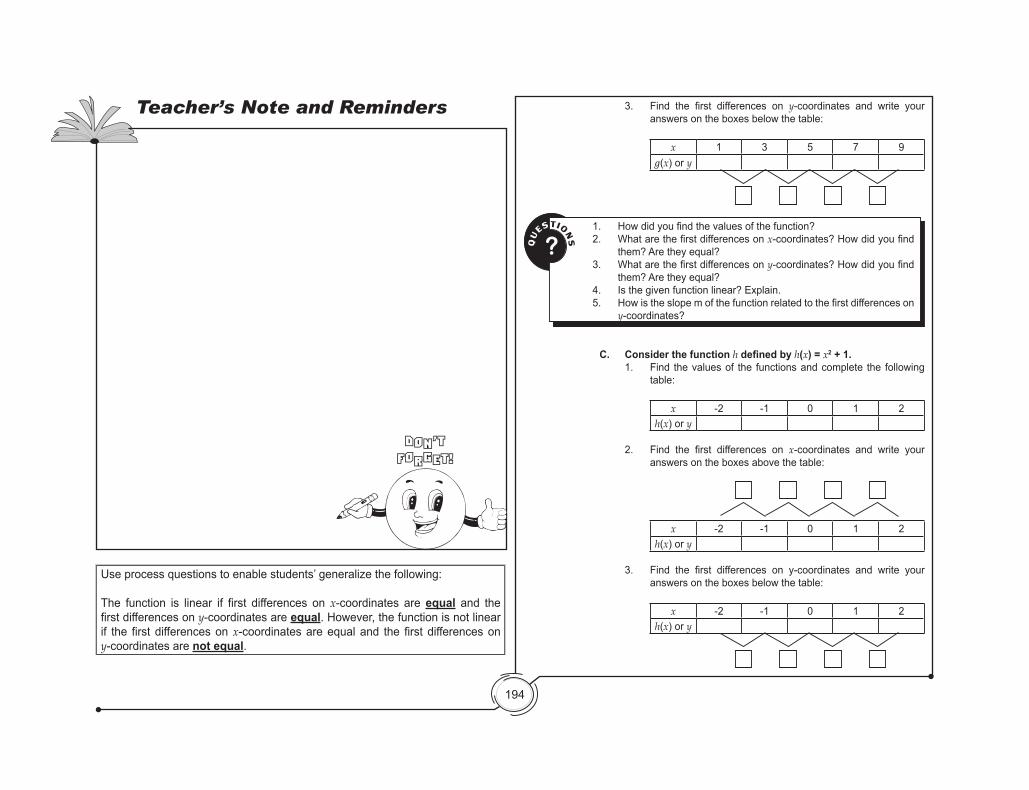
194
3. Find the first differences on y-coordinates and write your answers on the boxes below the table:
x 1 3 5 7 9g(x) or y
C. Consider the function h defined by h(x) = x2 + 1.1. Find the values of the functions and complete the following
table:
x -2 -1 0 1 2h(x) or y
2. Find the first differences on x-coordinates and write your answers on the boxes above the table:
x -2 -1 0 1 2
h(x) or y
3. Find the first differences on y-coordinates and write youranswers on the boxes below the table:
x -2 -1 0 1 2h(x) or y
QU
ESTIONS?
1. Howdidyoufindthevaluesofthefunction?2. Whatarethefirstdifferencesonx-coordinates?Howdidyoufind
them? Are they equal? 3. Whatarethefirstdifferencesony-coordinates?Howdidyoufind
them? Are they equal?4. Is the given function linear? Explain.5. Howistheslopemofthefunctionrelatedtothefirstdifferenceson
y-coordinates?
Teacher’s Note and Reminders
Don’tForget!
Use process questions to enable students’ generalize the following:
The function is linear if first differences on x-coordinates are equal and the first differences on y-coordinates are equal. However, the function is not linear if the first differences on x-coordinates are equal and the first differences on y-coordinates are not equal.

195
QU
ESTIONS?
1. Howdidyoufindthevaluesofthefunction?2. Whatarethefirstdifferencesonx-coordinates?Howdidyoufind
them? Are they equal? 3. Whatarethefirstdifferencesony-coordinates?Howdidyoufind
them? Are they equal?4. Is the given function linear? Explain.5. What have you realized? State your realization by completing the
statement below. The function is linear if first differences on x-coordinates are
_______andthefirstdifferencesony-coordinates are _______. However, the function is not linear if the first differences onx-coordinatesareequalandthefirstdifferencesony-coordinates are ___________.
Exercise 2 Determine whether the function below is linear given the table.
1. x -2 -1 0 1 2
f(x) or y 1 2 3 4 5
6. x -2 -1 0 1 2
f(x) or y -1 2 5 8 11
2. x -2 -1 0 1 2
f(x) or y -3 -1 1 3 5
7. x 5 4 3 2 1
f(x) or y -1 2 5 8 11
x -5 -4 -3 -2 -1
f(x) or y 15 11 7 3 -1
3. x -2 -1 0 1 2
f(x) or y 5 2 -1 -4 -7
8.
4. x 1 2 3 4 5
f(x) or y 4 1 0 1 4
9. x -2 -1 0 1 2
f(x) or y 1 0 1 4 9
5. x -2 0 2 4 6
f(x) or y 4 -2 -4 -2 4
10. x -4 -2 1 3 4
f(x) or y -21 -11 4 14 19
Domain and Range of a Linear Function
Again, consider the function fdefinedbyf(x) = 2x – 1. Study the graph carefully. What have you noticed about the arrow heads of the graph? What can you say about it?
3
2
(2, 3)
(-3, -7)
1
-1
-1
-2
-3
-4
-5
-6
-7
-2-30
0 1 2 3-4
(0, -1)
y
x
Let the students recall the domain and the range of a relation if a set of ordered pairs, a mapping diagram, a table, or a graph is known. Process the questions provided so that the students are able to generalize that the domain and the range of any linear function is a set of real numbers.
Answers in Activity 8:1. L
x -2 -1 0 1 2
f(x) or y 1 2 3 4 5
6. L x -2 -1 0 1 2
f(x) or y -1 2 5 8 11
2. L x -2 -1 0 1 2
f(x) or y -3 -1 1 3 5
7. L x 5 4 3 2 1
f(x) or y -1 2 5 8 11 3. L x -2 -1 0 1 2
f(x) or y 5 2 -1 -4 -7
8. L
4. NL x 1 2 3 4 5
f(x) or y 4 1 0 1 4
9. NL x -2 -1 0 1 2
f(x) or y 1 0 1 4 9
5. NL x -2 0 2 4 6
f(x) or y 4 -2 -4 -2 4
10. L x -4 -2 1 3 4
f(x) or y -21 -11 4 14 19
x -5 -4 -3 -2 -1
f(x) or y 15 11 7 3 -1
Teacher’s Note and Reminders
Don’tForget!
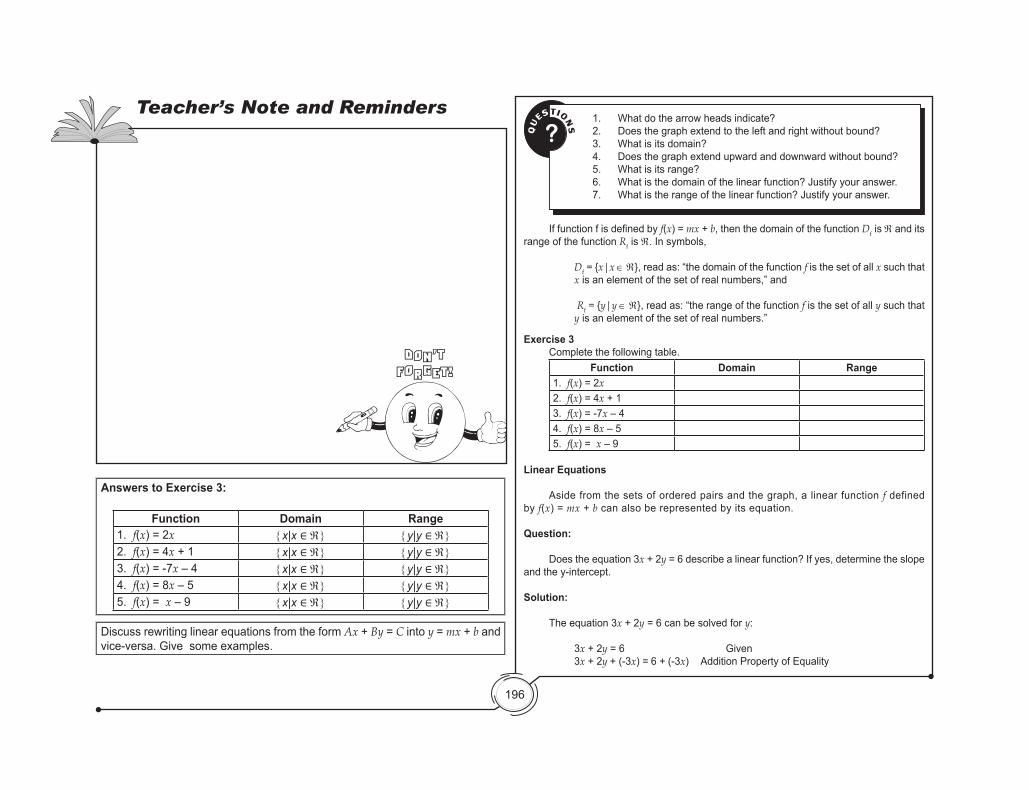
196
QU
ESTIONS?
1. What do the arrow heads indicate?2. Does the graph extend to the left and right without bound? 3. What is its domain? 4. Does the graph extend upward and downward without bound?5. What is its range?6. What is the domain of the linear function? Justify your answer.7. What is the range of the linear function? Justify your answer.
Exercise 3 Complete the following table.
Function Domain Range1. f(x) = 2x2. f(x) = 4x + 13. f(x) = -7x – 44. f(x) = 8x – 55. f(x) = x – 9
Linear Equations
Aside from the sets of ordered pairs and the graph, a linear function f defined by f(x) = mx + b can also be represented by its equation.
Question:
Does the equation 3x + 2y = 6 describe a linear function? If yes, determine the slope and the y-intercept.
Solution:
The equation 3x + 2y = 6 can be solved for y:
3x + 2y = 6 Given 3x + 2y + (-3x) = 6 + (-3x) Addition Property of Equality
Iffunctionfisdefinedbyf(x) = mx + b, then the domain of the function Df is ℜ and its range of the function Rf is ℜ. In symbols,
Df = {x|x ∈ ℜ}, read as: “the domain of the function f is the set of all x such that x is an element of the set of real numbers,” and
Rf = {y|y ∈ ℜ}, read as: “the range of the function f is the set of all y such that y is an element of the set of real numbers.”
Answers to Exercise 3:
Function Domain Range1. f(x) = 2x {x|x ∈ ℜ} {y|y ∈ ℜ}2. f(x) = 4x + 1 {x|x ∈ ℜ} {y|y ∈ ℜ}3. f(x) = -7x – 4 {x|x ∈ ℜ} {y|y ∈ ℜ}4. f(x) = 8x – 5 {x|x ∈ ℜ} {y|y ∈ ℜ}5. f(x) = x – 9 {x|x ∈ ℜ} {y|y ∈ ℜ}
Discuss rewriting linear equations from the form Ax + By = C into y = mx + b and vice-versa. Give some examples.
Teacher’s Note and Reminders
Don’tForget!
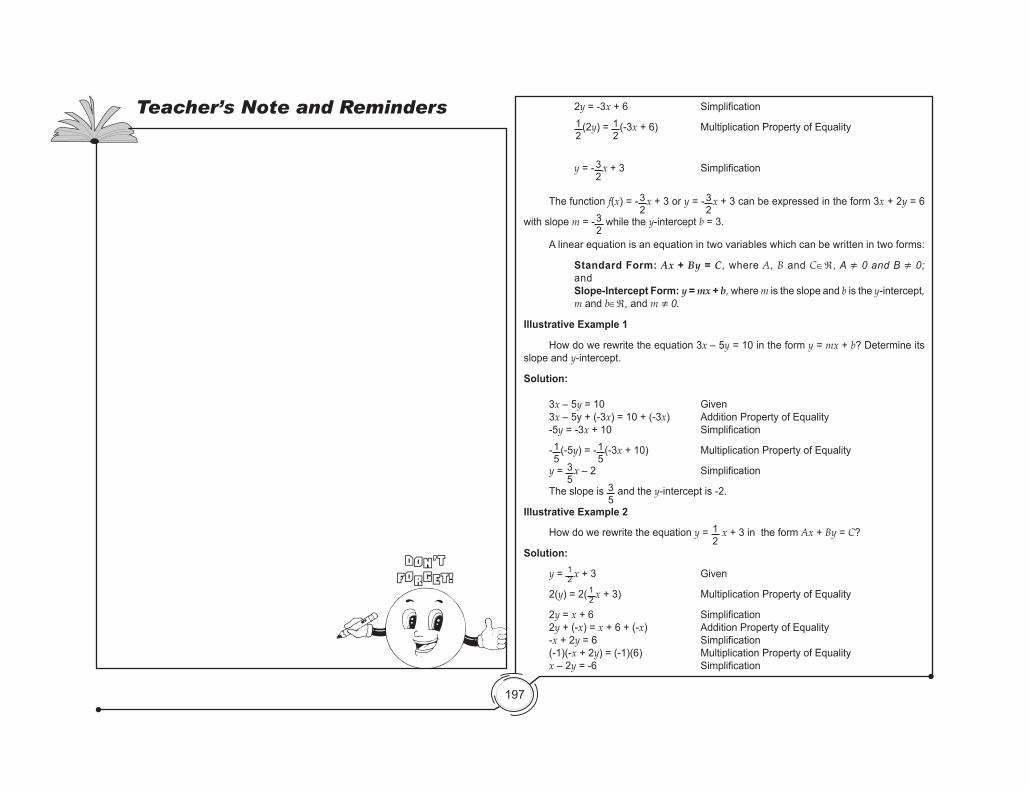
197
2y = -3x + 6 Simplification
12
(2y) = 12
(-3x + 6) Multiplication Property of Equality
y = - 32
x + 3 Simplification
The function f(x) = - 32
x + 3 or y = - 32
x + 3 can be expressed in the form 3x + 2y = 6
with slope m = - 32
while the y-intercept b = 3.
Illustrative Example 1
How do we rewrite the equation 3x – 5y = 10 in the form y = mx + b? Determine its slope and y-intercept.
Solution:
3x – 5y = 10 Given 3x – 5y + (-3x) = 10 + (-3x) Addition Property of Equality -5y = -3x+10 Simplification
- 15
(-5y) = - 15
(-3x + 10) Multiplication Property of Equality
y = 35
x – 2 Simplification
The slope is 35
and the y-intercept is -2.
Illustrative Example 2
How do we rewrite the equation y = 12
x + 3 in the form Ax + By = C?
Solution:
y = 12 x + 3 Given
2(y) = 2( 12 x + 3) Multiplication Property of Equality
2y = x + 6 Simplification 2y + (-x) = x + 6 + (-x) Addition Property of Equality -x + 2y=6 Simplification (-1)(-x + 2y) = (-1)(6) Multiplication Property of Equality x – 2y=-6 Simplification
A linear equation is an equation in two variables which can be written in two forms:
Standard Form: Ax + By = C, where A, B and C∈ℜ, A ≠ 0 and B ≠ 0; and Slope-Intercept Form: y = mx + b, where m is the slope and b is the y-intercept, m and b∈ℜ, and m ≠ 0.
Teacher’s Note and Reminders
Don’tForget!
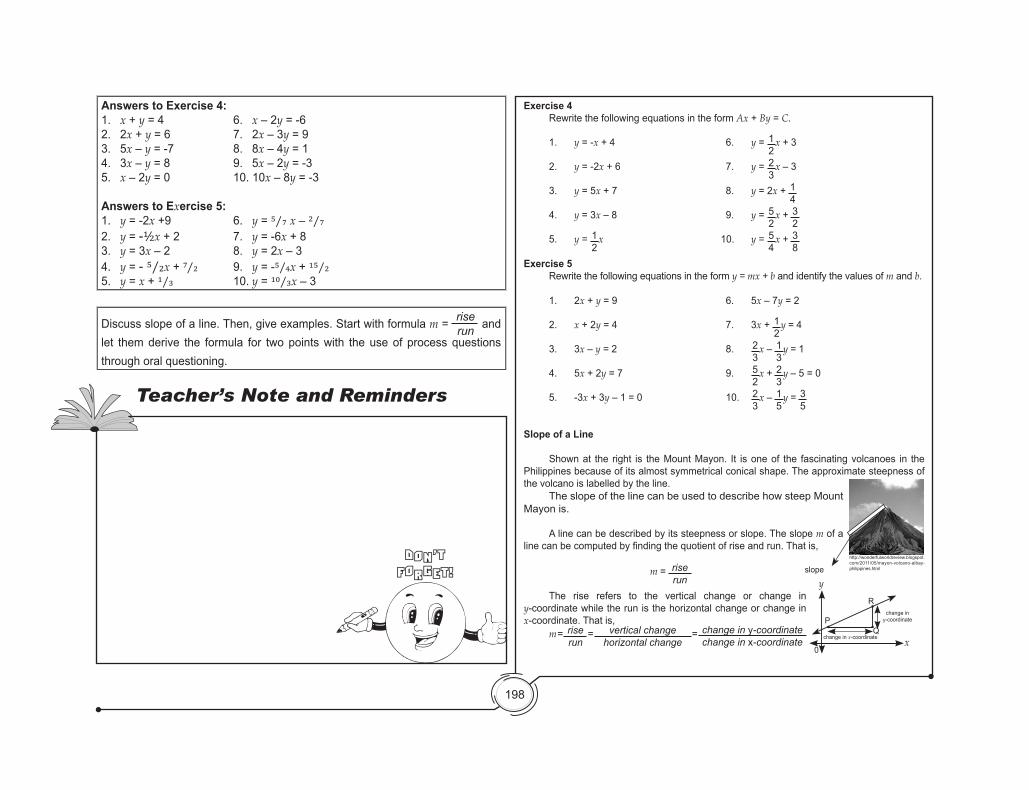
198
Exercise 4 Rewrite the following equations in the form Ax + By = C.
1. y = -x + 4 6. y = 12
x + 3
2. y = -2x + 6 7. y = 23
x – 3
3. y = 5x + 7 8. y = 2x + 14
4. y = 3x – 8 9. y = 52
x + 32
5. y = 12
x 10. y = 54
x + 38
Exercise 5 Rewrite the following equations in the form y = mx + b and identify the values of m and b.
1. 2x + y = 9 6. 5x – 7y = 2
2. x + 2y = 4 7. 3x + 12
y = 4
3. 3x – y = 2 8. 23
x – 13
y = 1
4. 5x + 2y = 7 9. 52
x + 23
y – 5 = 0
5. -3x + 3y – 1 = 0 10. 23
x – 15
y = 35
Slope of a Line
Shown at the right is the Mount Mayon. It is one of the fascinating volcanoes in the Philippines because of its almost symmetrical conical shape. The approximate steepness of the volcano is labelled by the line. The slope of the line can be used to describe how steep Mount Mayon is.
A line can be described by its steepness or slope. The slope m of a linecanbecomputedbyfindingthequotientofriseandrun.Thatis,
m = riserun
The rise refers to the vertical change or change in y-coordinate while the run is the horizontal change or change in x-coordinate. That is,
m = riserun
= vertical changehorizontal change
= change in y-coordinatechange in x-coordinate
slopehttp://wonderfulworldreview.blogspot.com/2011/05/mayon-volcano-albay-philippines.html
P
R
y
xQ
change in y-coordinate
change in x-coordinate
0
Answers to Exercise 4:1. x + y = 4 6. x – 2y = -62. 2x + y = 6 7. 2x – 3y = 9 3. 5x – y = -7 8. 8x – 4y = 14. 3x – y = 8 9. 5x – 2y = -35. x – 2y = 0 10. 10x – 8y = -3
Answers to Exercise 5:1. y = -2x +9 6. y = 5/7 x – 2/72. y = -1/2x + 2 7. y = -6x + 8 3. y = 3x – 2 8. y = 2x – 3 4. y = - 5/2x + 7/2 9. y = -5/4x + 15/25. y = x + 1/3 10. y = 10/3x – 3
Discuss slope of a line. Then, give examples. Start with formula m = riserun and
let them derive the formula for two points with the use of process questions through oral questioning.
Teacher’s Note and Reminders
Don’tForget!
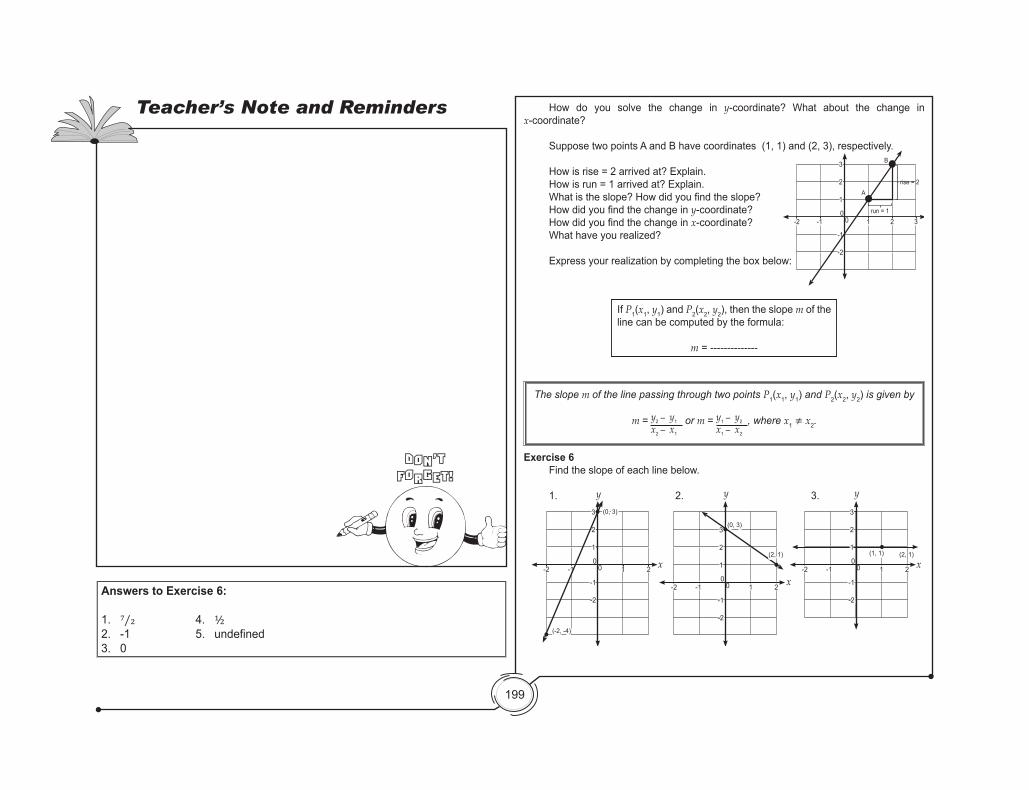
199
How do you solve the change in y-coordinate? What about the change in x-coordinate?
Suppose two points A and B have coordinates (1, 1) and (2, 3), respectively.
How is rise = 2 arrived at? Explain. How is run = 1 arrived at? Explain. Whatistheslope?Howdidyoufindtheslope? Howdidyoufindthechangeiny-coordinate? Howdidyoufindthechangeinx-coordinate? What have you realized?
Express your realization by completing the box below:
rise = 2
3
2
1
-1
-1
-2
-20
0 1 2 3run = 1
A
B
3
2
1
-1
-1
-2
-20
0 1 2
(0, 3)
(2, 1)
y
x
3
2
-1
-1
-2
-20
0 1 2
1(1, 1) (2, 1)
y
x
3
2
1
-1
-1
-2
-20
0 1 2
(0, 3)
(-2, -4)
y
x
If P1(x1, y1) and P2(x2, y2), then the slope m of the line can be computed by the formula:
m = --------------
The slope m of the line passing through two points P1(x1, y1) and P2(x2, y2) is given by
m = y2 – y1
x2 – x1
or m = y1 – y2
x1 – x2
, where x1 ≠ x2.
Exercise 6 Find the slope of each line below.
1. 2. 3.
Answers to Exercise 6:
1. 7/2 4. 1/22. -1 5. undefined3. 0
Teacher’s Note and Reminders
Don’tForget!
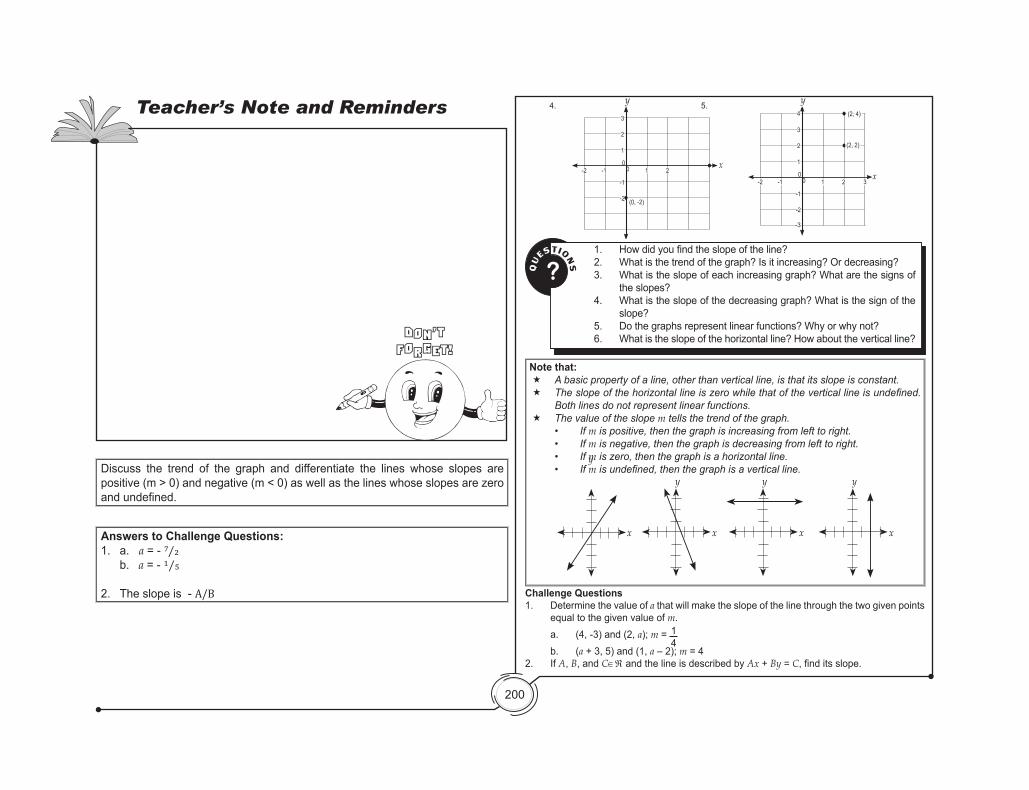
200
3
2
1
-1
-1
-2
-20
0 1 2
(0, -2)
x
3
2
1
-1
-1
-2
-20
0 1 2
(2, 2)
x3
-3
y4 (2, 4)
y
Note that: A basic property of a line, other than vertical line, is that its slope is constant. Theslopeofthehorizontallineiszerowhilethatoftheverticallineisundefined.
Both lines do not represent linear functions. The value of the slope m tells the trend of the graph. • Ifm is positive, then the graph is increasing from left to right. • Ifm is negative, then the graph is decreasing from left to right. • Ifm is zero, then the graph is a horizontal line. • Ifmisundefined,thenthegraphisaverticalline.
y
x
y
x
y
x
y
x Q
U
ESTIONS?
1. Howdidyoufindtheslopeoftheline?2. What is the trend of the graph? Is it increasing? Or decreasing?3. What is the slope of each increasing graph? What are the signs of
the slopes?4. What is the slope of the decreasing graph? What is the sign of the
slope?5. Do the graphs represent linear functions? Why or why not?6. What is the slope of the horizontal line? How about the vertical line?
Challenge Questions1. Determine the value of a that will make the slope of the line through the two given points
equal to the given value of m. a. (4, -3) and (2, a); m = 1
4 b. (a + 3, 5) and (1, a – 2); m = 42. If A, B, and C∈ℜ and the line is described by Ax + By = C,finditsslope.
4. 5.Teacher’s Note and Reminders
Don’tForget!
Discuss the trend of the graph and differentiate the lines whose slopes are positive(m>0)andnegative(m<0)aswellasthelineswhoseslopesarezeroand undefined.
Answers to Challenge Questions:1. a. a = - 7/2 b. a = - 1/5
2. The slope is - A/B
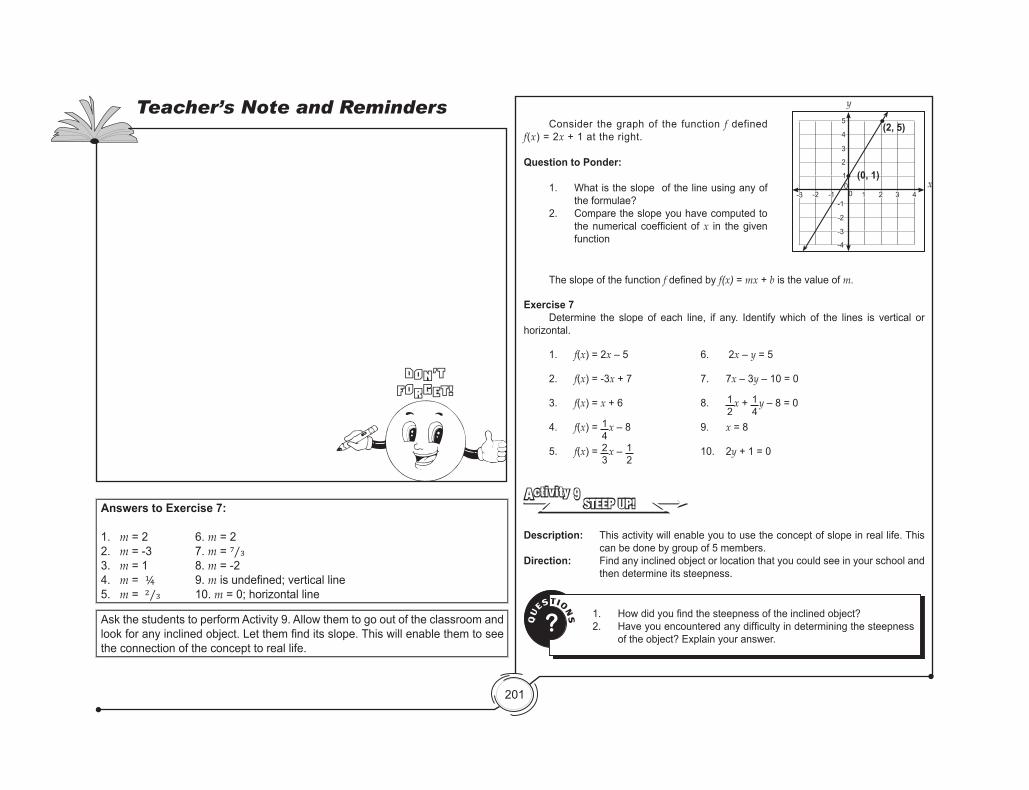
201
0-1-2-3
1
(2, 5)
(0, 1)0 1 2 3 4
2
3
4
5
-1
-2
-3
-4
x
y
Consider the graph of the function f defined f(x) = 2x + 1 at the right.
Question to Ponder:
1. What is the slope of the line using any of the formulae?
2. Compare the slope you have computed to thenumerical coefficientofx in the given function
QU
ESTIONS?
1. Howdidyoufindthesteepnessoftheinclinedobject?2. Haveyouencounteredanydifficultyindeterminingthesteepness
of the object? Explain your answer.
Exercise 7 Determine the slope of each line, if any. Identify which of the lines is vertical or horizontal.
1. f(x) = 2x – 5 6. 2x – y = 5
2. f(x) = -3x + 7 7. 7x – 3y – 10 = 0
3. f(x) = x + 6 8. 12
x + 14
y – 8 = 0
4. f(x) = 14
x – 8 9. x = 8
5. f(x) = 23
x – 12
10. 2y + 1 = 0
STEEP UP!Activity 9
Description: This activity will enable you to use the concept of slope in real life. This can be done by group of 5 members.
Direction: Find any inclined object or location that you could see in your school and then determine its steepness.
The slope of the function f definedby f(x) = mx + b is the value of m.
Answers to Exercise 7:
1. m = 2 6. m = 22. m = -3 7. m = 7/33. m = 1 8. m = -24. m = 1/4 9. m is undefined; vertical line5. m = 2/3 10. m = 0; horizontal line
Ask the students to perform Activity 9. Allow them to go out of the classroom and look for any inclined object. Let them find its slope. This will enable them to see the connection of the concept to real life.
Teacher’s Note and Reminders
Don’tForget!
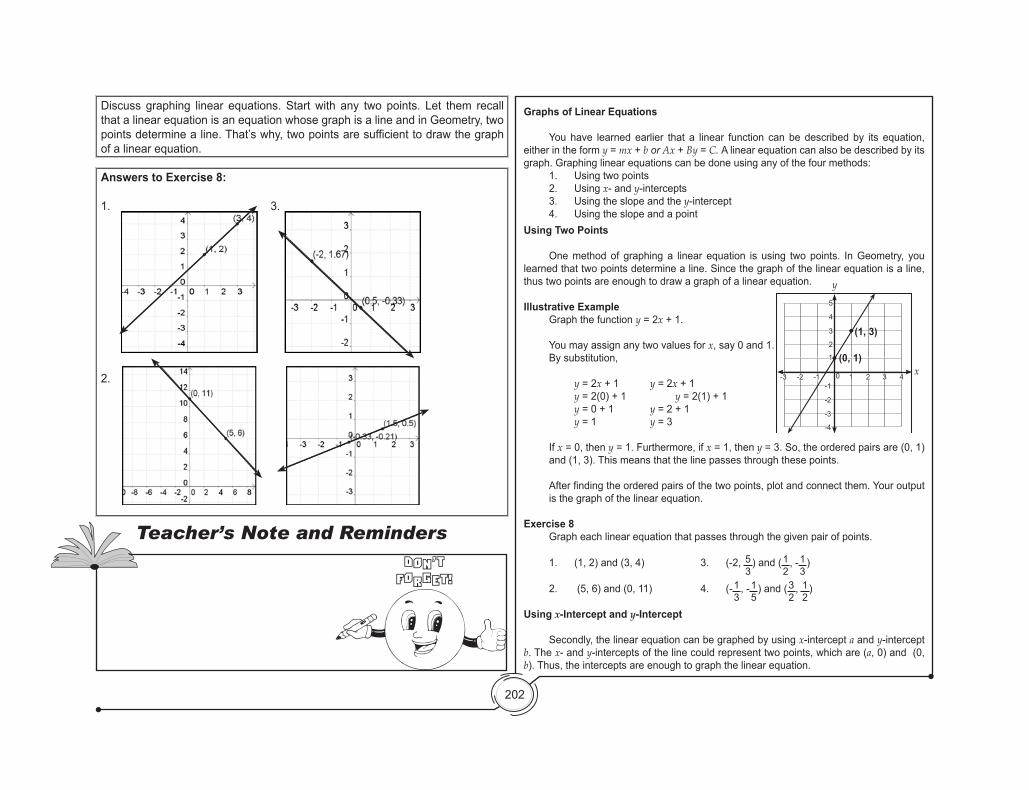
202
Answers to Exercise 8:
1. 3.
2. 4.
(1, 3)
(0, 1)0 1 2 3 4
2
3
4
5
-1
-2
-3
-4
1
-1-2-3x
y
Using Two Points
One method of graphing a linear equation is using two points. In Geometry, you learned that two points determine a line. Since the graph of the linear equation is a line, thus two points are enough to draw a graph of a linear equation.
Illustrative Example Graph the function y = 2x + 1.
You may assign any two values for x, say 0 and 1. By substitution,
y = 2x + 1 y = 2x + 1 y = 2(0) + 1 y = 2(1) + 1 y = 0 + 1 y = 2 + 1 y = 1 y = 3
If x = 0, then y = 1. Furthermore, if x = 1, then y = 3. So, the ordered pairs are (0, 1) and (1, 3). This means that the line passes through these points.
Afterfindingtheorderedpairsofthetwopoints,plotandconnectthem.Youroutputis the graph of the linear equation.
Exercise 8 Graph each linear equation that passes through the given pair of points.
1. (1, 2) and (3, 4) 3. (-2, 53
) and (12
, -13
)
2. (5, 6) and (0, 11) 4. (-13
, -15
) and (32
, 12
)
Using x-Intercept and y-Intercept
Secondly, the linear equation can be graphed by using x-intercept a and y-intercept b. The x- and y-intercepts of the line could represent two points, which are (a, 0) and (0, b). Thus, the intercepts are enough to graph the linear equation.
Graphs of Linear Equations
You have learned earlier that a linear function can be described by its equation, either in the form y = mx + b or Ax + By = C. A linear equation can also be described by its graph. Graphing linear equations can be done using any of the four methods: 1. Using two points 2. Using x- and y-intercepts 3. Using the slope and the y-intercept 4. Using the slope and a point
Discuss graphing linear equations. Start with any two points. Let them recall that a linear equation is an equation whose graph is a line and in Geometry, two points determine a line. That’s why, two points are sufficient to draw the graph of a linear equation.
Teacher’s Note and RemindersDon’tForget!
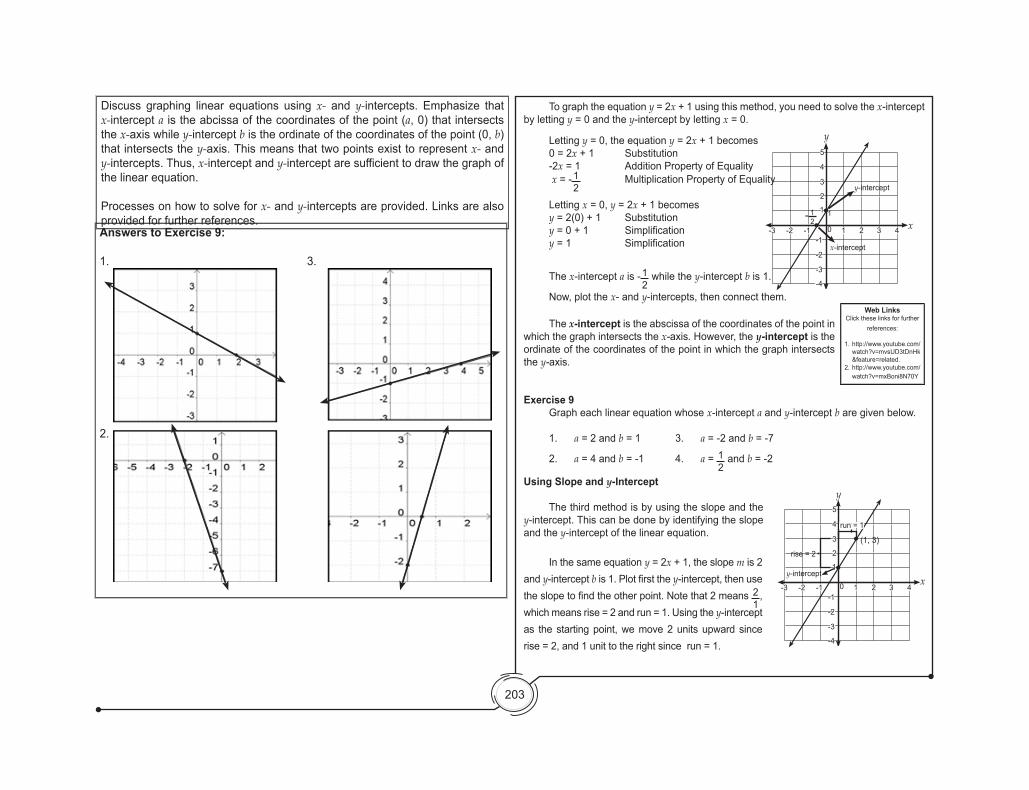
203
Answers to Exercise 9:
1. 3.
2. 4.
y-intercept
x-intercept
1
0 1 2 3 4
2
3
4
5
-1
-2
-3
-4
1
-1-2-3 x
y
- 12
y-intercept
rise = 2
(1, 3)
0 1 2 3 4
2
3
4
5
-1
-2
-3
-4
1
-1-2-3
run = 1
x
y
Letting y = 0, the equation y = 2x + 1 becomes 0 = 2x + 1 Substitution -2x = 1 Addition Property of Equality x = - 1
2 Multiplication Property of Equality
Letting x = 0, y = 2x + 1 becomes y = 2(0) + 1 Substitution y=0+1 Simplification y=1 Simplification
The x-intercept a is - 12
while the y-intercept b is 1.
Now, plot the x- and y-intercepts, then connect them.
To graph the equation y = 2x + 1 using this method, you need to solve the x-intercept by letting y = 0 and the y-intercept by letting x = 0.
Web LinksClick these links for further
references:
1. http://www.youtube.com/watch?v=mvsUD3tDnHk&feature=related.
2. http://www.youtube.com/watch?v=mxBoni8N70Y
Exercise 9 Graph each linear equation whose x-intercept a and y-intercept b are given below.
1. a = 2 and b = 1 3. a = -2 and b = -7
2. a = 4 and b = -1 4. a = 12
and b = -2
Using Slope and y-Intercept
The third method is by using the slope and the y-intercept. This can be done by identifying the slope and the y-intercept of the linear equation.
In the same equation y = 2x + 1, the slope m is 2 and y-intercept bis1.Plotfirstthey-intercept, then use theslopetofindtheotherpoint.Notethat2means2
1,
which means rise = 2 and run = 1. Using the y-intercept as the starting point, we move 2 units upward since rise = 2, and 1 unit to the right since run = 1.
The x-intercept is the abscissa of the coordinates of the point in which the graph intersects the x-axis. However, the y-intercept is the ordinate of the coordinates of the point in which the graph intersects the y-axis.
Discuss graphing linear equations using x- and y-intercepts. Emphasize that x-intercept a is the abcissa of the coordinates of the point (a, 0) that intersects the x-axis while y-intercept b is the ordinate of the coordinates of the point (0, b) that intersects the y-axis. This means that two points exist to represent x- and y-intercepts. Thus, x-intercept and y-intercept are sufficient to draw the graph of the linear equation.
Processes on how to solve for x- and y-intercepts are provided. Links are also provided for further references.
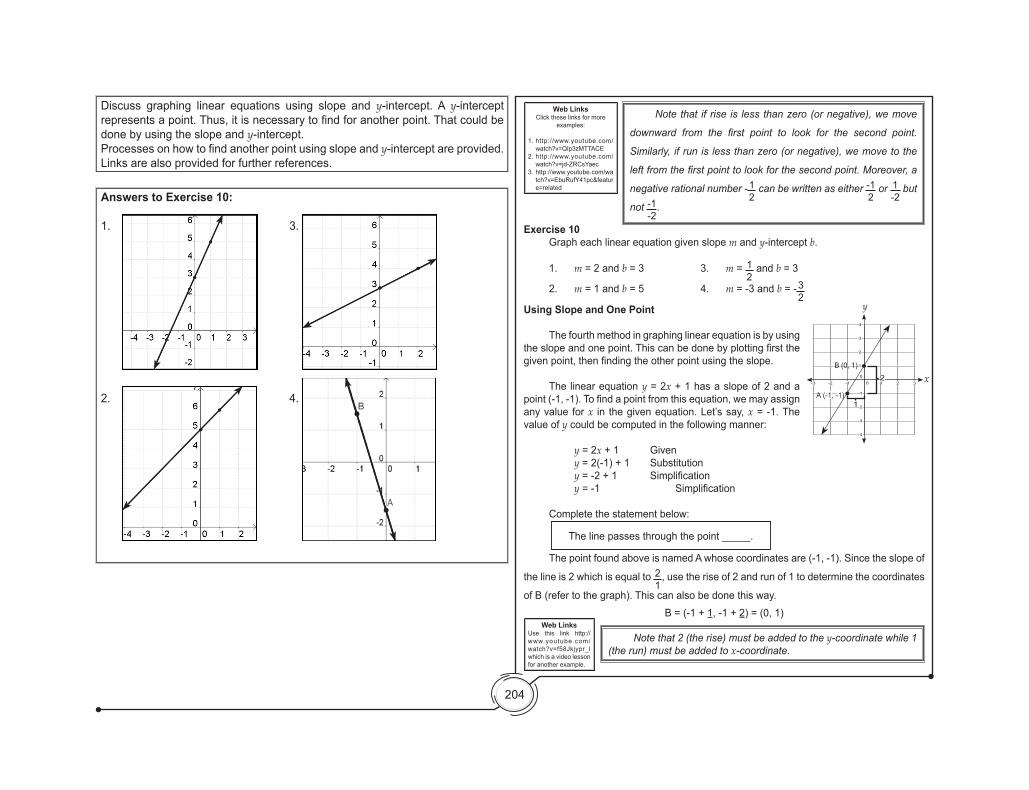
204
Answers to Exercise 10:
1. 3.
2. 4.0
0-1
-1
-2
-3
-4
-2-3
1
2
3
4
1 22
1
3
(0, 1)
(-1, -1)
B
A
x
y
Note that if rise is less than zero (or negative), we move
downward from the first point to look for the second point.
Similarly, if run is less than zero (or negative), we move to the
leftfromthefirstpointtolookforthesecondpoint.Moreover,a
negative rational number -12
can be written as either -12
or 1-2
but
not -1-2
.
Note that 2 (the rise) must be added to the y-coordinate while 1 (the run) must be added to x-coordinate.
Web LinksClick these links for more
examples:
1. http://www.youtube.com/watch?v=QIp3zMTTACE
2. http://www.youtube.com/watch?v=jd-ZRCsYaec
3. http://www.youtube.com/watch?v=EbuRufY41pc&feature=related
Web LinksUse this link http://www.youtube.com/watch?v=f58Jkjypr_I which is a video lesson for another example.
Exercise 10 Graph each linear equation given slope m and y-intercept b.
1. m = 2 and b = 3 3. m = 12
and b = 3
2. m = 1 and b = 5 4. m = -3 and b = - 32
Using Slope and One Point
The fourth method in graphing linear equation is by using theslopeandonepoint.Thiscanbedonebyplottingfirstthegivenpoint,thenfindingtheotherpointusingtheslope.
The linear equation y = 2x + 1 has a slope of 2 and a point(-1,-1).Tofindapointfromthisequation,wemayassignany value for x in the given equation. Let’s say, x = -1. The value of y could be computed in the following manner:
y = 2x + 1 Given y = 2(-1) + 1 Substitution y=-2+1 Simplification y=-1 Simplification
Complete the statement below:
The point found above is named A whose coordinates are (-1, -1). Since the slope of
the line is 2 which is equal to 21
, use the rise of 2 and run of 1 to determine the coordinates
of B (refer to the graph). This can also be done this way.B = (-1 + 1, -1 + 2) = (0, 1)
The line passes through the point _____.
Discuss graphing linear equations using slope and y-intercept. A y-intercept represents a point. Thus, it is necessary to find for another point. That could be done by using the slope and y-intercept.Processes on how to find another point using slope and y-intercept are provided. Links are also provided for further references.
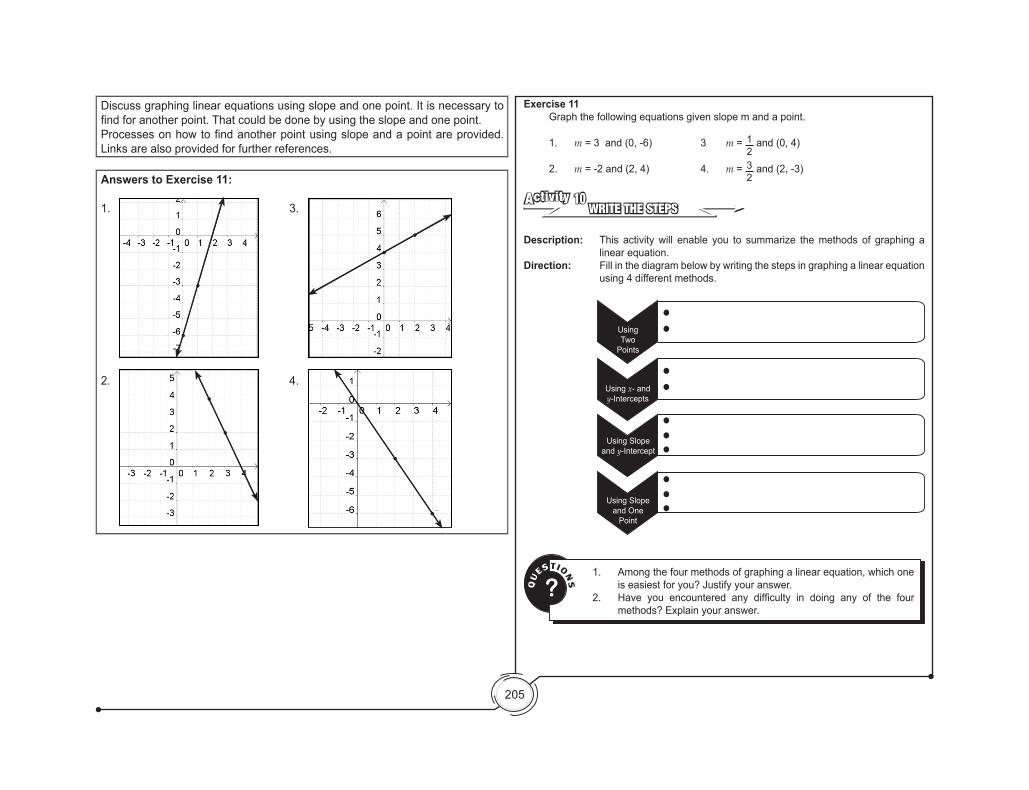
205
Exercise 11 Graph the following equations given slope m and a point.
1. m = 3 and (0, -6) 3 m = 12
and (0, 4)
2. m = -2 and (2, 4) 4. m = 32
and (2, -3)
WRITE THE STEPSActivity 10
Description: This activity will enable you to summarize the methods of graphing a linear equation.
Direction: Fill in the diagram below by writing the steps in graphing a linear equation using 4 different methods.
Using Two
Points
Using x- and y-Intercepts
Using Slope and y-Intercept
Using Slope and One
Point Q
U
ESTIONS?
1. Among the four methods of graphing a linear equation, which one is easiest for you? Justify your answer.
2. Have you encountered any difficulty in doing any of the fourmethods? Explain your answer.
Discuss graphing linear equations using slope and one point. It is necessary to find for another point. That could be done by using the slope and one point.Processes on how to find another point using slope and a point are provided. Links are also provided for further references.
Answers to Exercise 11:
1. 3.
2. 4.
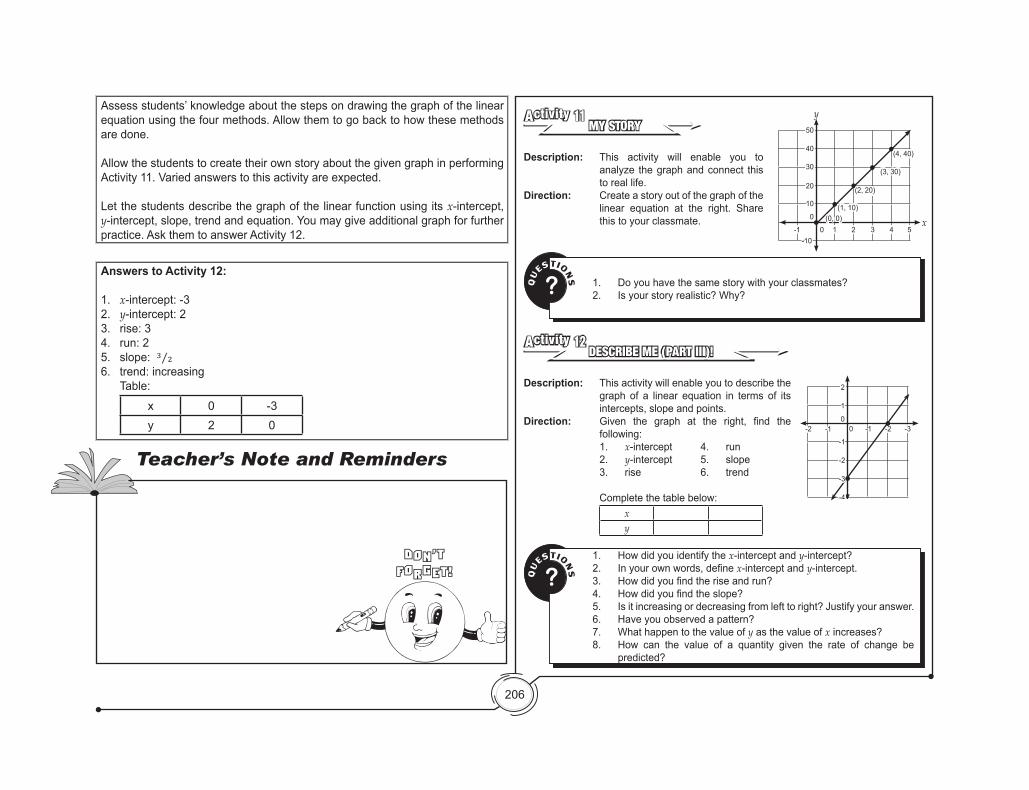
206
MY STORYActivity 11
Description: This activity will enable you to analyze the graph and connect this to real life.
Direction: Create a story out of the graph of the linear equation at the right. Share this to your classmate.
00
1
2
-1
-1
-1 -2 -3
-2
-3
-4
-2
-1 0 1 2 3 4 5
0
-10
10
(0, 0)(1, 10)
(2, 20)
(3, 30)
(4, 40)
20
30
40
50
y
x
QU
ESTIONS? 1. Do you have the same story with your classmates?
2. Is your story realistic? Why?
QU
ESTIONS?
1. How did you identify the x-intercept and y-intercept?2. Inyourownwords,definex-intercept and y-intercept.3. Howdidyoufindtheriseandrun?4. Howdidyoufindtheslope?5. Is it increasing or decreasing from left to right? Justify your answer.6. Have you observed a pattern? 7. What happen to the value of y as the value of x increases?8. How can the value of a quantity given the rate of change be
predicted?
DESCRIBE ME (PART III)!Activity 12
Description: This activity will enable you to describe the graph of a linear equation in terms of its intercepts, slope and points.
Direction: Given the graph at the right, find thefollowing:1. x-intercept 4. run2. y-intercept 5. slope3. rise 6. trend
Complete the table below:xy
Assess students’ knowledge about the steps on drawing the graph of the linear equation using the four methods. Allow them to go back to how these methods are done.
Allow the students to create their own story about the given graph in performing Activity 11. Varied answers to this activity are expected.
Let the students describe the graph of the linear function using its x-intercept, y-intercept, slope, trend and equation. You may give additional graph for further practice. Ask them to answer Activity 12.
Answers to Activity 12:
1. x-intercept: -32. y-intercept: 23. rise: 34. run: 25. slope: 3/26. trend: increasing Table:
x 0 -3y 2 0
Teacher’s Note and Reminders
Don’tForget!
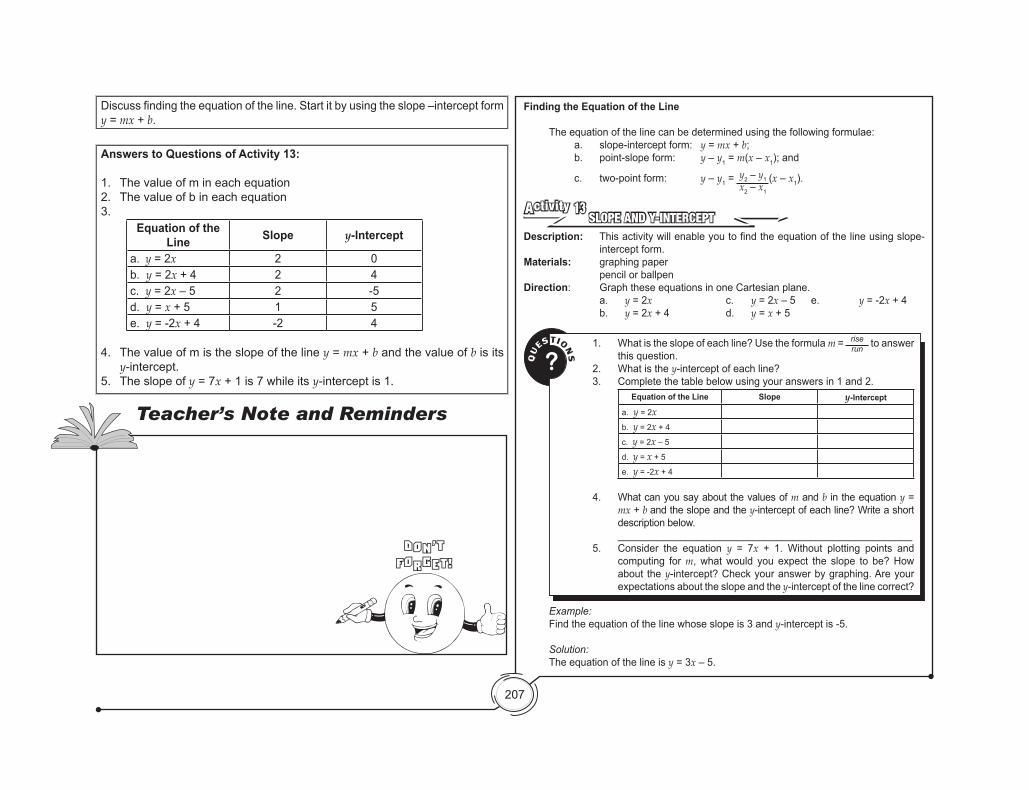
207
QU
ESTIONS?
1. What is the slope of each line? Use the formula m = riserun to answer
this question.2. What is the y-intercept of each line?3. Complete the table below using your answers in 1 and 2.
Equation of the Line Slope y-Intercept
a. y = 2xb. y = 2x + 4
c. y = 2x – 5
d. y = x + 5
e. y = -2x + 4
4. What can you say about the values of m and b in the equation y = mx + b and the slope and the y-intercept of each line? Write a short description below.
____________________________________________________5. Consider the equation y = 7x + 1. Without plotting points and
computing for m, what would you expect the slope to be? How about the y-intercept? Check your answer by graphing. Are your expectations about the slope and the y-intercept of the line correct?
Finding the Equation of the Line
The equation of the line can be determined using the following formulae:a. slope-intercept form: y = mx + b;b. point-slope form: y – y1 = m(x – x1); and
c. two-point form: y – y1 = y2 – y1x2 – x1
(x – x1).
SLOPE AND Y-INTERCEPTActivity 13
Description: Thisactivitywillenableyoutofindtheequationofthelineusingslope-intercept form.
Materials: graphing paper pencil or ballpenDirection: Graph these equations in one Cartesian plane. a. y = 2x c. y = 2x – 5 e. y = -2x + 4 b. y = 2x + 4 d. y = x + 5
Example: Find the equation of the line whose slope is 3 and y-intercept is -5.
Solution: The equation of the line is y = 3x – 5.
Discuss finding the equation of the line. Start it by using the slope –intercept form y = mx + b.
Answers to Questions of Activity 13:
1. The value of m in each equation2. The value of b in each equation3.
Equation of the Line Slope y-Intercept
a. y = 2x 2 0b. y = 2x + 4 2 4c. y = 2x – 5 2 -5d. y = x + 5 1 5e. y = -2x + 4 -2 4
4. The value of m is the slope of the line y = mx + b and the value of b is its y-intercept.
5. The slope of y = 7x + 1 is 7 while its y-intercept is 1.
Teacher’s Note and Reminders
Don’tForget!
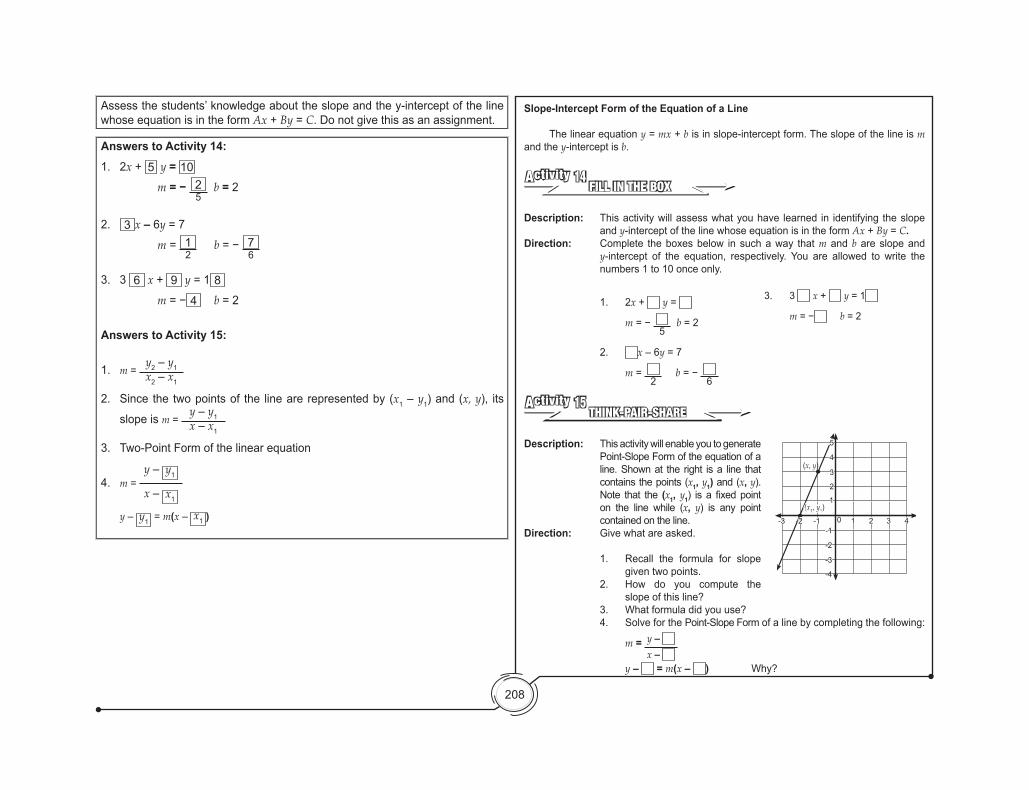
208
-4
0 1 2 3 4
2
3
4
5
-1
-2
-3
1
-1-2-3
(x1, y1)
(x, y)
Slope-Intercept Form of the Equation of a Line
The linear equation y = mx + b is in slope-intercept form. The slope of the line is m and the y-intercept is b.
FILL IN THE BOXActivity 14
Description: This activity will assess what you have learned in identifying the slope and y-intercept of the line whose equation is in the form Ax + By = C.
Direction: Complete the boxes below in such a way that m and b are slope and y-intercept of the equation, respectively. You are allowed to write the numbers 1 to 10 once only.
1. 2x + y =
m = − 5
b = 2
2. x – 6y = 7
m = 2
b = − 6
THINK-PAIR-SHAREActivity 15
Description: This activity will enable you to generate Point-Slope Form of the equation of a line. Shown at the right is a line that contains the points (x1, y1) and (x, y). Note that the (x1, y1) is a fixedpointon the line while (x, y) is any point contained on the line.
Direction: Give what are asked.
1. Recall the formula for slope given two points.
2. How do you compute the slope of this line?
3. What formula did you use?4. Solve for the Point-Slope Form of a line by completing the following:
m = y – x –
y – = m(x – ) Why?
3. 3 x + y = 1
m = − b = 2
Assess the students’ knowledge about the slope and the y-intercept of the line whose equation is in the form Ax + By = C. Do not give this as an assignment.
Answers to Activity 14:1. 2x + 5 y = 10
m = − 25
b = 2
2. 3 x – 6y = 7 m = 1
2 b = − 7
6
3. 3 6 x + 9 y = 1 8 m = − 4 b = 2
Answers to Activity 15:
1. m = y2 – y1 x2 – x1
2. Since the two points of the line are represented by (x1 – y1) and (x, y), its
slope is m = y – y1 x – x1
3. Two-Point Form of the linear equation
4. m = y – y1
x – x1
y – y1 = m(x – x1 )
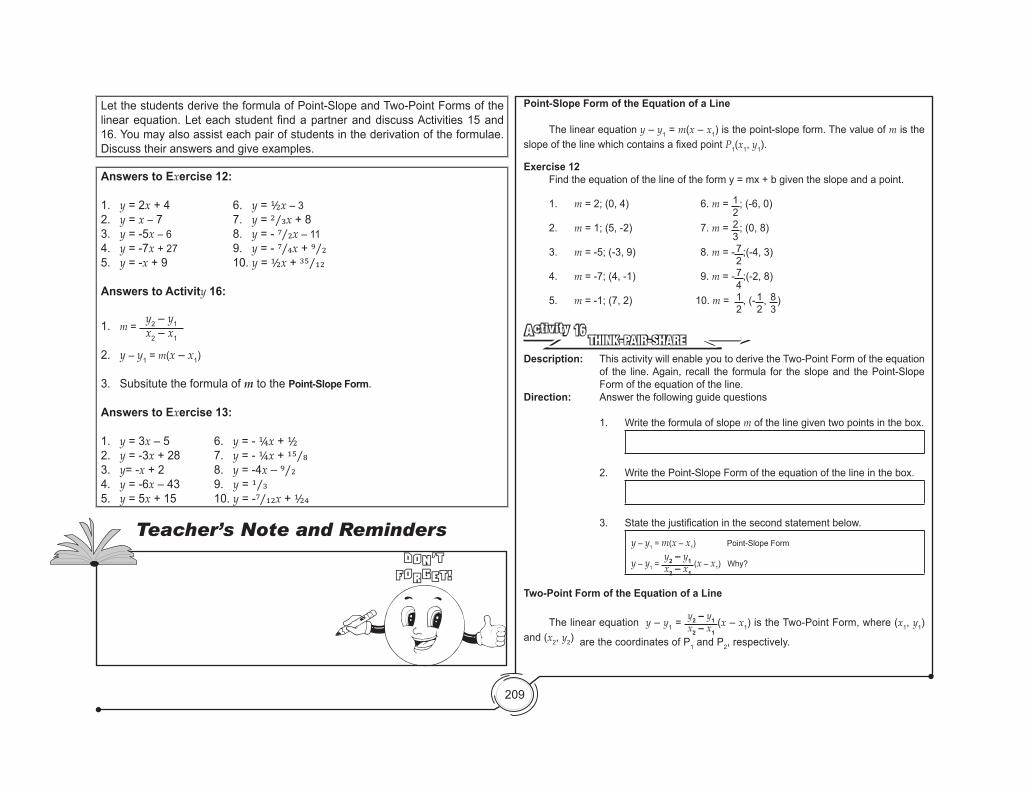
209
Point-Slope Form of the Equation of a Line
The linear equation y – y1 = m(x – x1) is the point-slope form. The value of m is the slopeofthelinewhichcontainsafixedpointP1(x1, y1).
Exercise 12 Find the equation of the line of the form y = mx + b given the slope and a point.
1. m = 2; (0, 4) 6. m = 12
; (-6, 0)
2. m = 1; (5, -2) 7. m = 23
; (0, 8)
3. m = -5; (-3, 9) 8. m = - 72
;(-4, 3)
4. m = -7; (4, -1) 9. m = - 74
;(-2, 8)
5. m = -1; (7, 2) 10. m = 12
, (- 12
, 83
)
THINK-PAIR-SHAREActivity 16
Description: This activity will enable you to derive the Two-Point Form of the equation of the line. Again, recall the formula for the slope and the Point-Slope Form of the equation of the line.
Direction: Answer the following guide questions
1. Write the formula of slope m of the line given two points in the box.
2. Write the Point-Slope Form of the equation of the line in the box.
3. Statethejustificationinthesecondstatementbelow.
y – y1 = m(x – x1) Point-Slope Form
y – y1 = y2 – y1x2 – x1
(x – x1) Why?
Two-Point Form of the Equation of a Line
The linear equation y – y1 = y2 – y1x2 – x1
(x – x1) is the Two-Point Form, where (x1, y1) and (x2, y2) are the coordinates of P1 and P2, respectively.
Let the students derive the formula of Point-Slope and Two-Point Forms of the linear equation. Let each student find a partner and discuss Activities 15 and 16. You may also assist each pair of students in the derivation of the formulae. Discuss their answers and give examples.
Answers to Exercise 12:
1. y = 2x + 4 6. y = 1/2x – 3 2. y = x – 7 7. y = 2/3x + 83. y = -5x – 6 8. y = - 7/2x – 114. y = -7x + 27 9. y = - 7/4x + 9/25. y = -x + 9 10. y = 1/2x + 35/12
Answers to Activity 16:
1. m = y2 – y1 x2 – x1
2. y – y1 = m(x – x1)
3. Subsitute the formula of m to the Point-Slope Form.
Answers to Exercise 13:
1. y = 3x – 5 6. y = - 1/4x + 1/22. y = -3x + 28 7. y = - 1/4x + 15/83. y= -x + 2 8. y = -4x – 9/24. y = -6x – 43 9. y = 1/35. y = 5x + 15 10. y = -7/12x + 1/24
Teacher’s Note and RemindersDon’tForget!

210
Exercise 13 Find the equation of the line of the form y = mx + b that passes through the following pairs of points.
1. (3, 4) and (4, 7) 6. (0, 12
) and (1, - 12
)
2. (8, 4) and (6, 10) 7. ( 72
, 1) and (- 12
, 2)
3. (3, -1) and (7, -5) 8. (- 12
, -52
) and (- 32
, 32
)
4. (-8, 5) and (-9, 11) 9. (-152
, 13
) and (- 12
, 13
)
5. (-1, 10) and (0, 15) 10. (- 52
, 32
) and (12
, -14
)
IRF WORKSHEET REVISITEDActivity 17
Description: Below is the IRF Worksheet in which you will give your present knowledge about the concept.
Direction: Giveyourrevisedanswersofthequestionsprovidedinthefirstcolumnandwrite them in the third column. Compare your revised answers from your initial answers.
Questions Initial Answer
Revised Answer
Final Answer
1. What is linear function?2. How do you describe a
linear function?3. How do you graph a
linear function?4.How do you find an
equation of the line?5. How can the value
of a quantity given the rate of change be predicted?
To enrich your skills in finding the equation of the line, which is horizontal,vertical or slanting, go to this link http://www.mathplayground.com/SaveTheZogs/SaveTheZogs_IWB.html. Youcanalsovisit the link infinding theequationof the line,where twopointscan be moved from one place to another http://www.mathwarehouse.com/algebra/linear_equation/linear-equation-interactive-activity.php
Teacher’s Note and Reminders
Don’tForget!
Elicit present knowledge about the linear functions by answering the “Revised Answer” column in the IRF Worksheet. Compare their revised answers of the questions to their initial answers.
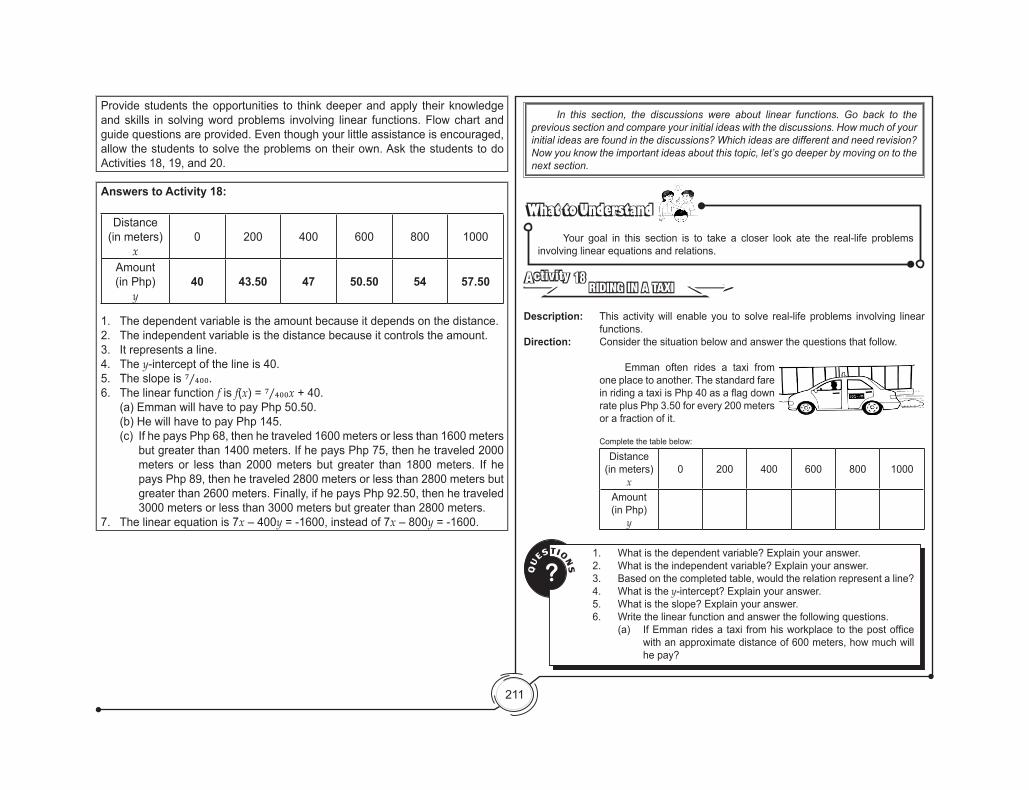
211
In this section, the discussions were about linear functions. Go back to the previous section and compare your initial ideas with the discussions. How much of your initial ideas are found in the discussions? Which ideas are different and need revision? Now you know the important ideas about this topic, let’s go deeper by moving on to the next section.
What to UnderstandWhat to Understand
Your goal in this section is to take a closer look ate the real-life problems involving linear equations and relations.
RIDING IN A TAXIActivity 18
Description: This activity will enable you to solve real-life problems involving linear functions.
Direction: Consider the situation below and answer the questions that follow.
Emman often rides a taxi from one place to another. The standard fare inridingataxiisPhp40asaflagdownrate plus Php 3.50 for every 200 meters or a fraction of it.
Complete the table below:
Distance (in meters)
x0 200 400 600 800 1000
Amount (in Php)
y Q
U
ESTIONS?
1. What is the dependent variable? Explain your answer.2. What is the independent variable? Explain your answer.3. Based on the completed table, would the relation represent a line?4. What is the y-intercept? Explain your answer. 5. What is the slope? Explain your answer.6. Write the linear function and answer the following questions.
(a) IfEmmanridesataxi fromhisworkplacetothepostofficewith an approximate distance of 600 meters, how much will he pay?
Provide students the opportunities to think deeper and apply their knowledge and skills in solving word problems involving linear functions. Flow chart and guide questions are provided. Even though your little assistance is encouraged, allow the students to solve the problems on their own. Ask the students to do Activities 18, 19, and 20.
Answers to Activity 18:
Distance (in meters)
x0 200 400 600 800 1000
Amount (in Php)
y40 43.50 47 50.50 54 57.50
1. The dependent variable is the amount because it depends on the distance. 2. The independent variable is the distance because it controls the amount. 3. It represents a line.4. The y-intercept of the line is 40.5. The slope is 7/400.6. The linear function f is f(x) = 7/400x + 40. (a) Emman will have to pay Php 50.50. (b) He will have to pay Php 145.
(c) If he pays Php 68, then he traveled 1600 meters or less than 1600 meters but greater than 1400 meters. If he pays Php 75, then he traveled 2000 meters or less than 2000 meters but greater than 1800 meters. If he pays Php 89, then he traveled 2800 meters or less than 2800 meters but greater than 2600 meters. Finally, if he pays Php 92.50, then he traveled 3000 meters or less than 3000 meters but greater than 2800 meters.
7. The linear equation is 7x – 400y = -1600, instead of 7x – 800y = -1600.
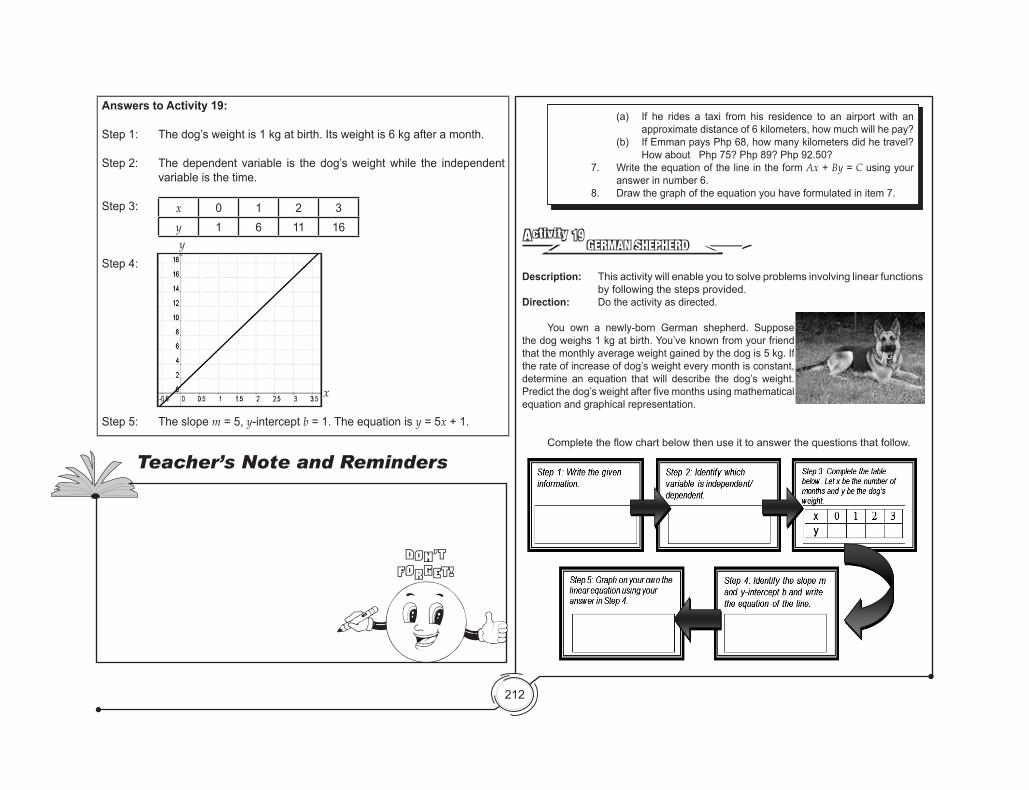
212
Answers to Activity 19:
Step 1: The dog’s weight is 1 kg at birth. Its weight is 6 kg after a month.
Step 2: The dependent variable is the dog’s weight while the independent variable is the time.
Step 3:
Step 4:
Step 5: The slope m = 5, y-intercept b = 1. The equation is y = 5x + 1.
(a) If he rides a taxi from his residence to an airport with an approximate distance of 6 kilometers, how much will he pay?
(b) If Emman pays Php 68, how many kilometers did he travel? How about Php 75? Php 89? Php 92.50?
7. Write the equation of the line in the form Ax + By = C using your answer in number 6.
8. Draw the graph of the equation you have formulated in item 7.
GERMAN SHEPHERD Activity 19
Description: This activity will enable you to solve problems involving linear functions by following the steps provided.
Direction: Do the activity as directed.
You own a newly-born German shepherd. Suppose the dog weighs 1 kg at birth. You’ve known from your friend that the monthly average weight gained by the dog is 5 kg. If the rate of increase of dog’s weight every month is constant, determine an equation that will describe the dog’s weight. Predictthedog’sweightafterfivemonthsusingmathematicalequation and graphical representation.
Completetheflowchartbelowthenuseittoanswerthequestionsthatfollow.
x 0 1 2 3y 1 6 11 16
Teacher’s Note and Reminders
Don’tForget!
y
x
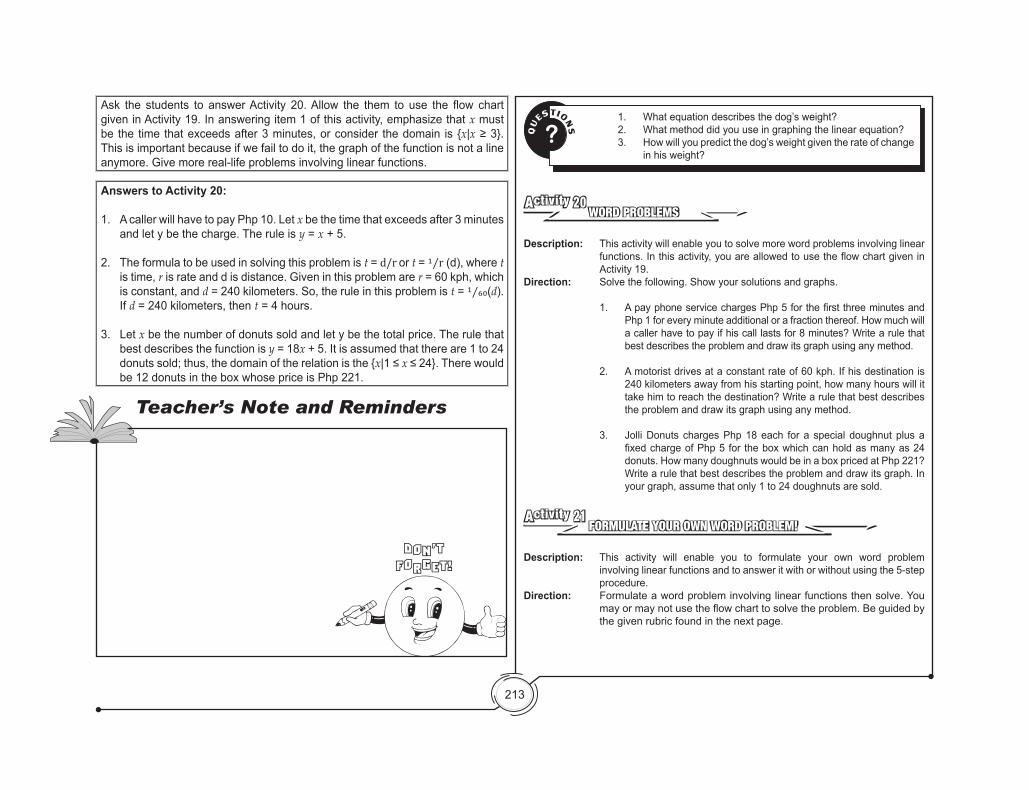
213
Answers to Activity 20:
1. A caller will have to pay Php 10. Let x be the time that exceeds after 3 minutes and let y be the charge. The rule is y = x + 5.
2. The formula to be used in solving this problem is t = d/r or t = 1/r (d), where t is time, r is rate and d is distance. Given in this problem are r = 60 kph, which is constant, and d = 240 kilometers. So, the rule in this problem is t = 1/60(d). If d = 240 kilometers, then t = 4 hours.
3. Let x be the number of donuts sold and let y be the total price. The rule that best describes the function is y = 18x + 5. It is assumed that there are 1 to 24 donuts sold; thus, the domain of the relation is the {x|1≤x ≤24}.Therewouldbe 12 donuts in the box whose price is Php 221.
QU
ESTIONS?
1. What equation describes the dog’s weight?2. What method did you use in graphing the linear equation?3. How will you predict the dog’s weight given the rate of change
in his weight?
WORD PROBLEMS Activity 20
Description: This activity will enable you to solve more word problems involving linear functions.Inthisactivity,youareallowedtousetheflowchartgiveninActivity 19.
Direction: Solve the following. Show your solutions and graphs.
1. ApayphoneservicechargesPhp5forthefirstthreeminutesandPhp 1 for every minute additional or a fraction thereof. How much will a caller have to pay if his call lasts for 8 minutes? Write a rule that best describes the problem and draw its graph using any method.
2. A motorist drives at a constant rate of 60 kph. If his destination is 240 kilometers away from his starting point, how many hours will it take him to reach the destination? Write a rule that best describes the problem and draw its graph using any method.
3. Jolli Donuts charges Php 18 each for a special doughnut plus a fixedchargeofPhp5for theboxwhichcanholdasmanyas24donuts. How many doughnuts would be in a box priced at Php 221? Write a rule that best describes the problem and draw its graph. In your graph, assume that only 1 to 24 doughnuts are sold.
FORMULATE YOUR OWN WORD PROBLEM!Activity 21
Description: This activity will enable you to formulate your own word problem involving linear functions and to answer it with or without using the 5-step procedure.
Direction: Formulate a word problem involving linear functions then solve. You mayormaynotusetheflowcharttosolvetheproblem.Beguidedbythe given rubric found in the next page.
Ask the students to answer Activity 20. Allow the them to use the flow chart given in Activity 19. In answering item 1 of this activity, emphasize that x must be the time that exceeds after 3 minutes, or consider the domain is {x|x≥3}.This is important because if we fail to do it, the graph of the function is not a line anymore. Give more real-life problems involving linear functions.
Teacher’s Note and Reminders
Don’tForget!
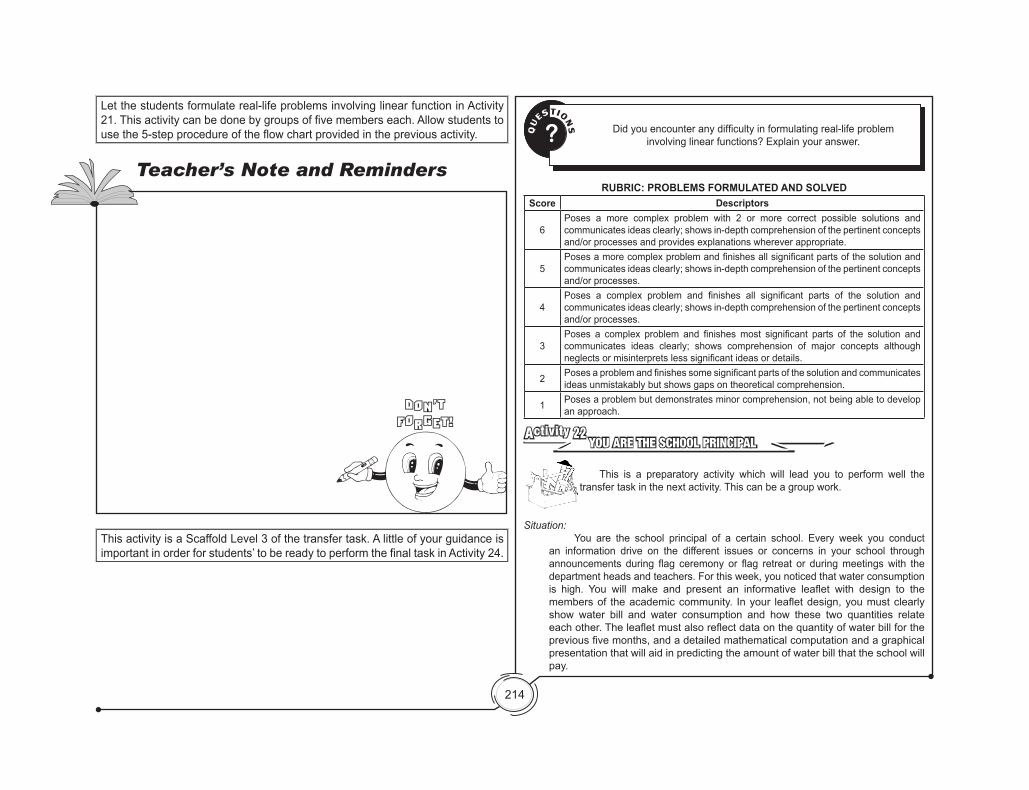
214
QU
ESTIONS?
1. What equation describes the dog’s weight?2. What method did you use in graphing the linear equation?3. How will you predict the dog’s weight given the rate of change in his
weight?
QU
ESTIONS? Didyouencounteranydifficultyinformulatingreal-lifeproblem
involving linear functions? Explain your answer.
RUBRIC: PROBLEMS FORMULATED AND SOLVEDScore Descriptors
6Poses a more complex problem with 2 or more correct possible solutions and communicates ideas clearly; shows in-depth comprehension of the pertinent concepts and/or processes and provides explanations wherever appropriate.
5Posesamorecomplexproblemandfinishesallsignificantpartsofthesolutionandcommunicates ideas clearly; shows in-depth comprehension of the pertinent concepts and/or processes.
4Poses a complex problem and finishes all significant parts of the solution andcommunicates ideas clearly; shows in-depth comprehension of the pertinent concepts and/or processes.
3Poses a complex problem and finishesmost significant parts of the solution andcommunicates ideas clearly; shows comprehension of major concepts although neglectsormisinterpretslesssignificantideasordetails.
2 Posesaproblemandfinishessomesignificantpartsofthesolutionandcommunicatesideas unmistakably but shows gaps on theoretical comprehension.
1 Poses a problem but demonstrates minor comprehension, not being able to develop an approach.
YOU ARE THE SCHOOL PRINCIPALActivity 22
This is a preparatory activity which will lead you to perform well the transfer task in the next activity. This can be a group work.
Situation: You are the school principal of a certain school. Every week you conduct an information drive on the different issues or concerns in your school through announcements during flag ceremony or flag retreat or duringmeetingswith thedepartment heads and teachers. For this week, you noticed that water consumption is high. You will make and present an informative leaflet with design to themembersof theacademiccommunity. Inyour leafletdesign,youmustclearlyshow water bill and water consumption and how these two quantities relate eachother.Theleafletmustalsoreflectdataonthequantityofwaterbillforthepreviousfivemonths,andadetailedmathematicalcomputationandagraphicalpresentation that will aid in predicting the amount of water bill that the school will pay.
Let the students formulate real-life problems involving linear function in Activity 21. This activity can be done by groups of five members each. Allow students to use the 5-step procedure of the flow chart provided in the previous activity.
This activity is a Scaffold Level 3 of the transfer task. A little of your guidance is important in order for students’ to be ready to perform the final task in Activity 24.
Teacher’s Note and Reminders
Don’tForget!
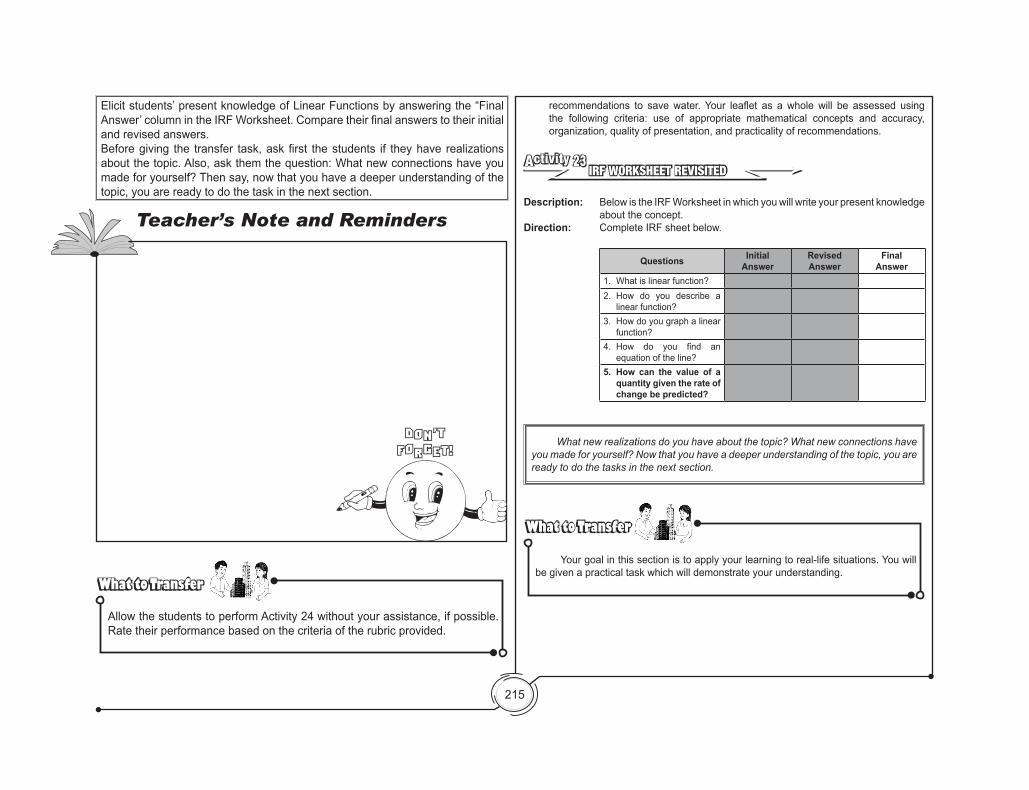
215
recommendations to savewater. Your leaflet as a whole will be assessed usingthe following criteria: use of appropriate mathematical concepts and accuracy, organization, quality of presentation, and practicality of recommendations.
IRF WORKSHEET REVISITEDActivity 23
Description: Below is the IRF Worksheet in which you will write your present knowledge about the concept.
Direction: Complete IRF sheet below.
Questions InitialAnswer
Revised Answer
Final Answer
1. What is linear function?2. How do you describe a
linear function?3. How do you graph a linear
function?4. How do you find an
equation of the line?5. How can the value of a
quantity given the rate of change be predicted?
What new realizations do you have about the topic? What new connections have you made for yourself? Now that you have a deeper understanding of the topic, you are ready to do the tasks in the next section.
What to TransferWhat to Transfer
Your goal in this section is to apply your learning to real-life situations. You will be given a practical task which will demonstrate your understanding.
Elicit students’ present knowledge of Linear Functions by answering the “Final Answer’ column in the IRF Worksheet. Compare their final answers to their initial and revised answers.Before giving the transfer task, ask first the students if they have realizations about the topic. Also, ask them the question: What new connections have you made for yourself? Then say, now that you have a deeper understanding of the topic, you are ready to do the task in the next section.
Teacher’s Note and Reminders
Don’tForget!
What to TransferWhat to Transfer
Allow the students to perform Activity 24 without your assistance, if possible. Rate their performance based on the criteria of the rubric provided.
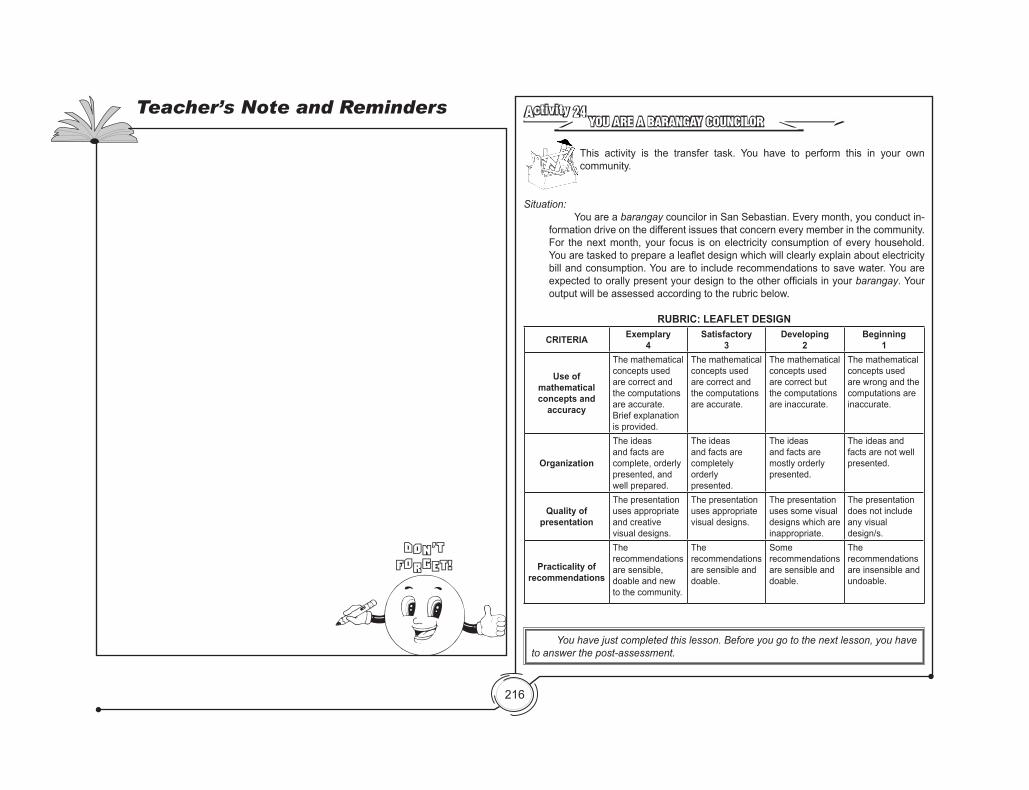
216
YOU ARE A BARANGAY COUNCILORActivity 24
This activity is the transfer task. You have to perform this in your own community.
Situation: You are a barangay councilor in San Sebastian. Every month, you conduct in-formation drive on the different issues that concern every member in the community. For the next month, your focus is on electricity consumption of every household. Youaretaskedtopreparealeafletdesignwhichwillclearlyexplainaboutelectricitybill and consumption. You are to include recommendations to save water. You are expectedtoorallypresentyourdesigntotheotherofficialsinyourbarangay. Your output will be assessed according to the rubric below.
RUBRIC: LEAFLET DESIGN
CRITERIA Exemplary4
Satisfactory3
Developing2
Beginning1
Use of mathematical concepts and
accuracy
The mathematical concepts used are correct and the computations are accurate. Brief explanation is provided.
The mathematical concepts used are correct and the computations are accurate.
The mathematical concepts used are correct but the computations are inaccurate.
The mathematical concepts used are wrong and the computations are inaccurate.
Organization
The ideas and facts are complete, orderly presented, and well prepared.
The ideas and facts are completely orderly presented.
The ideas and facts are mostly orderly presented.
The ideas and facts are not well presented.
Quality of presentation
The presentation uses appropriate and creative visual designs.
The presentation uses appropriate visual designs.
The presentation uses some visual designs which are inappropriate.
The presentation does not include any visual design/s.
Practicality of recommendations
The recommendations are sensible, doable and new to the community.
The recommendations are sensible and doable.
Some recommendations are sensible and doable.
The recommendations are insensible and undoable.
You have just completed this lesson. Before you go to the next lesson, you have to answer the post-assessment.
Teacher’s Note and Reminders
Don’tForget!
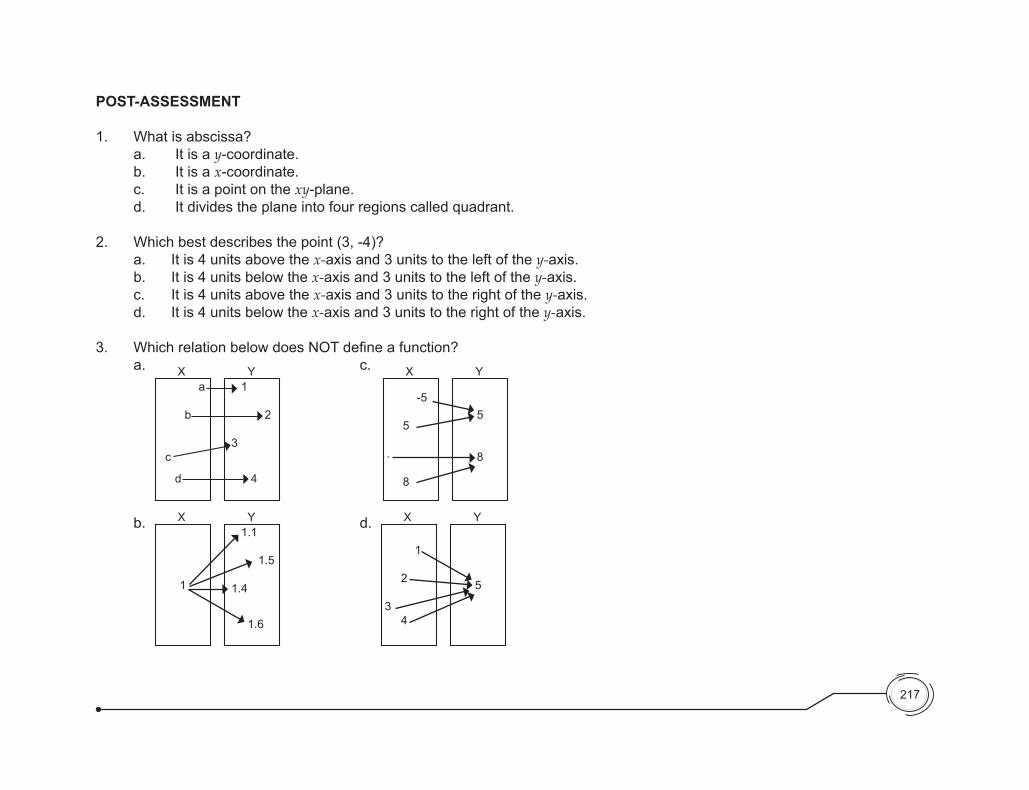
POST-ASSESSMENT
1. What is abscissa? a. It is a y-coordinate. b. It is a x-coordinate. c. It is a point on the xy-plane. d. It divides the plane into four regions called quadrant.
2. Which best describes the point (3, -4)? a. It is 4 units above the x-axis and 3 units to the left of the y-axis. b. It is 4 units below the x-axis and 3 units to the left of the y-axis. c. It is 4 units above the x-axis and 3 units to the right of the y-axis. d. It is 4 units below the x-axis and 3 units to the right of the y-axis.
3. WhichrelationbelowdoesNOTdefineafunction? a. c.
b. d.
a
b
c
d
1
2
3
4
X Y
-5
5
.
8
5
8
X Y
1
2
3 4
5
X Y
1
1.1
1.5
1.4
1.6
X Y
217
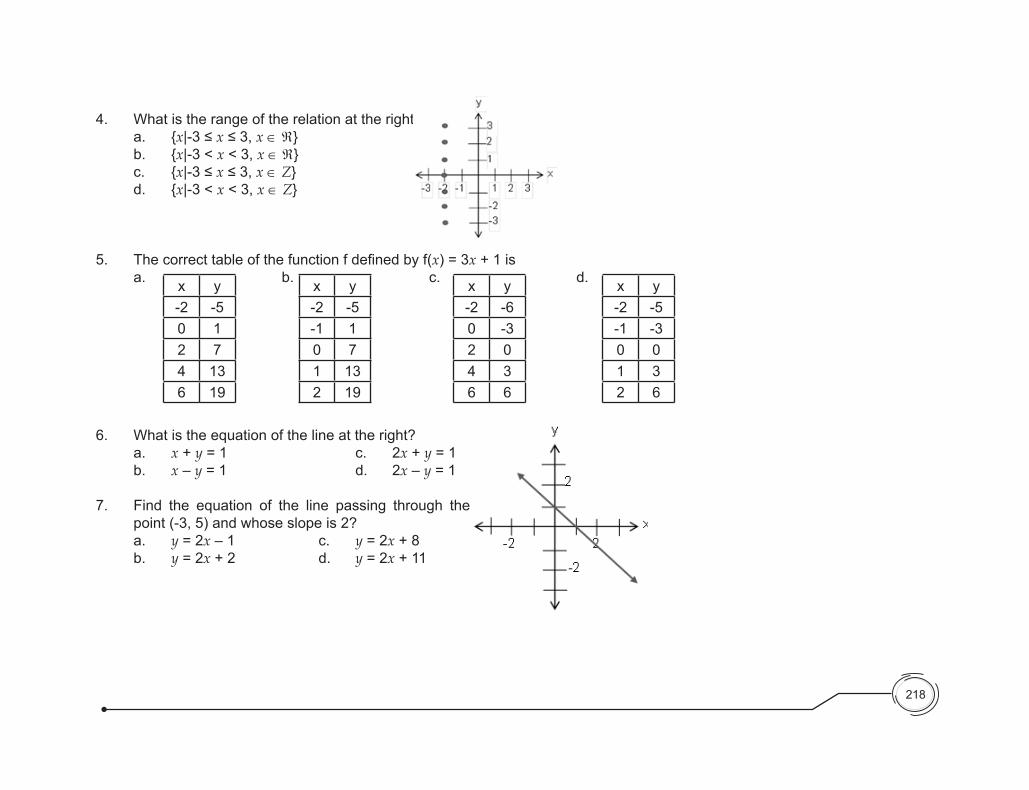
218
4. What is the range of the relation at the right? a. {x|-3≤x≤3,x ∈ ℜ} b. {x|-3<x<3,x ∈ ℜ} c. {x|-3≤x≤3,x ∈ Z} d. {x|-3<x<3,x ∈ Z}
5. Thecorrecttableofthefunctionfdefinedbyf(x) = 3x + 1 is a. b. c. d.
6. What is the equation of the line at the right? a. x + y = 1 c. 2x + y = 1 b. x – y = 1 d. 2x – y = 1
7. Find the equation of the line passing through the point (-3, 5) and whose slope is 2?
a. y = 2x – 1 c. y = 2x + 8 b. y = 2x + 2 d. y = 2x + 11
x y-2 -50 12 74 136 19
x y-2 -5-1 10 71 132 19
x y-2 -60 -32 04 36 6
x y-2 -5-1 -30 01 32 6
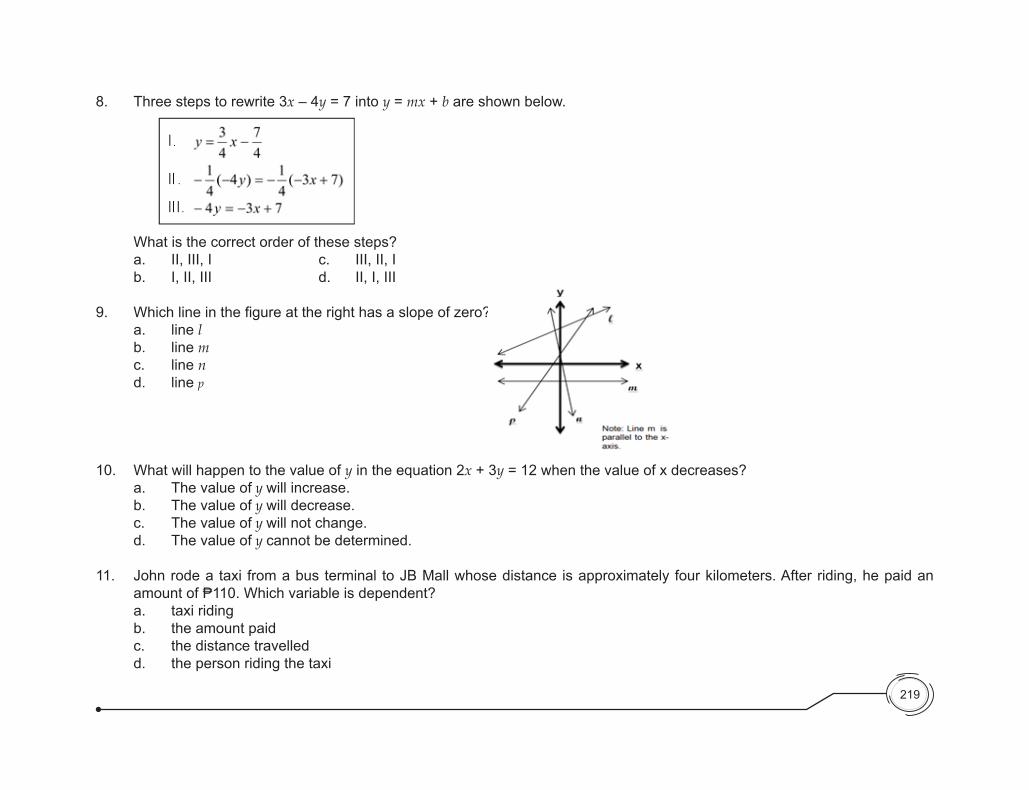
219
8. Three steps to rewrite 3x – 4y = 7 into y = mx + b are shown below.
What is the correct order of these steps? a. II, III, I c. III, II, I b. I, II, III d. II, I, III
9. Whichlineinthefigureattherighthasaslopeofzero? a. line l b. line m c. line n d. line p
10. What will happen to the value of y in the equation 2x + 3y = 12 when the value of x decreases? a. The value of y will increase. b. The value of y will decrease. c. The value of y will not change. d. The value of y cannot be determined.
11. John rode a taxi from a bus terminal to JB Mall whose distance is approximately four kilometers. After riding, he paid an amount of ₱110. Which variable is dependent?
a. taxi riding b. the amount paid c. the distance travelled d. the person riding the taxi
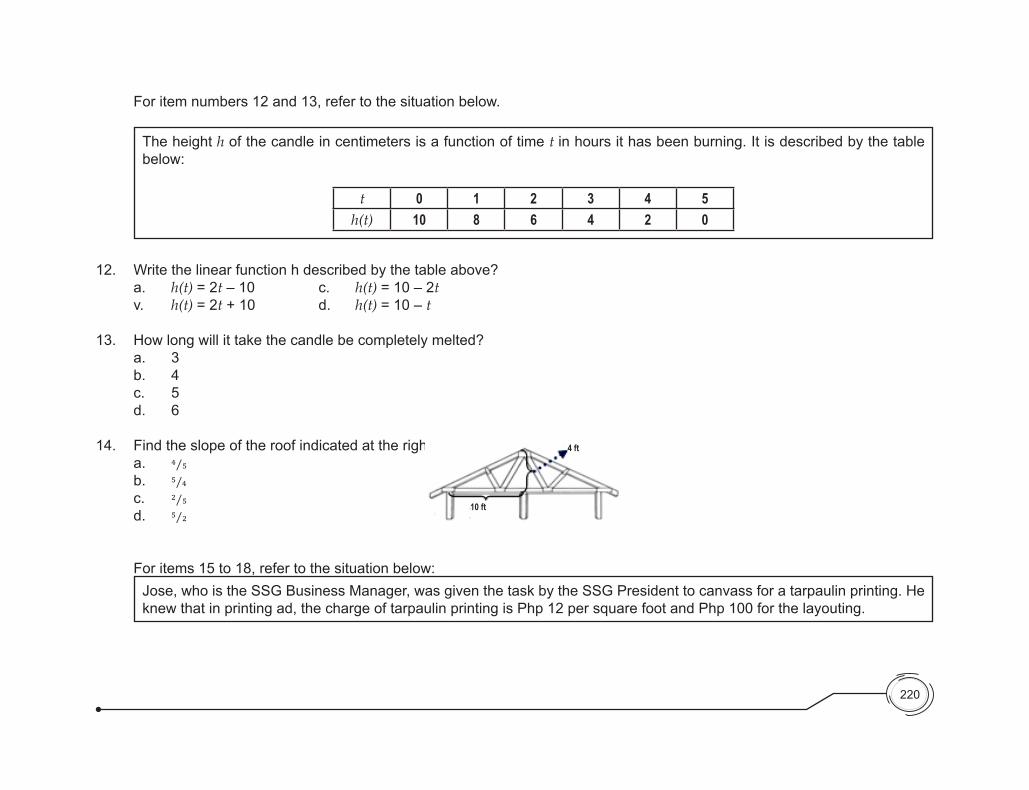
220
For item numbers 12 and 13, refer to the situation below.
The height h of the candle in centimeters is a function of time t in hours it has been burning. It is described by the table below:
t 0 1 2 3 4 5h(t) 10 8 6 4 2 0
12. Write the linear function h described by the table above? a. h(t) = 2t – 10 c. h(t) = 10 – 2t v. h(t) = 2t + 10 d. h(t) = 10 – t
13. How long will it take the candle be completely melted? a. 3 b. 4 c. 5 d. 6
14. Find the slope of the roof indicated at the right. a. 4/5 b. 5/4 c. 2/5 d. 5/2
For items 15 to 18, refer to the situation below:
Jose, who is the SSG Business Manager, was given the task by the SSG President to canvass for a tarpaulin printing. He knew that in printing ad, the charge of tarpaulin printing is Php 12 per square foot and Php 100 for the layouting.
10 ft
4 ft
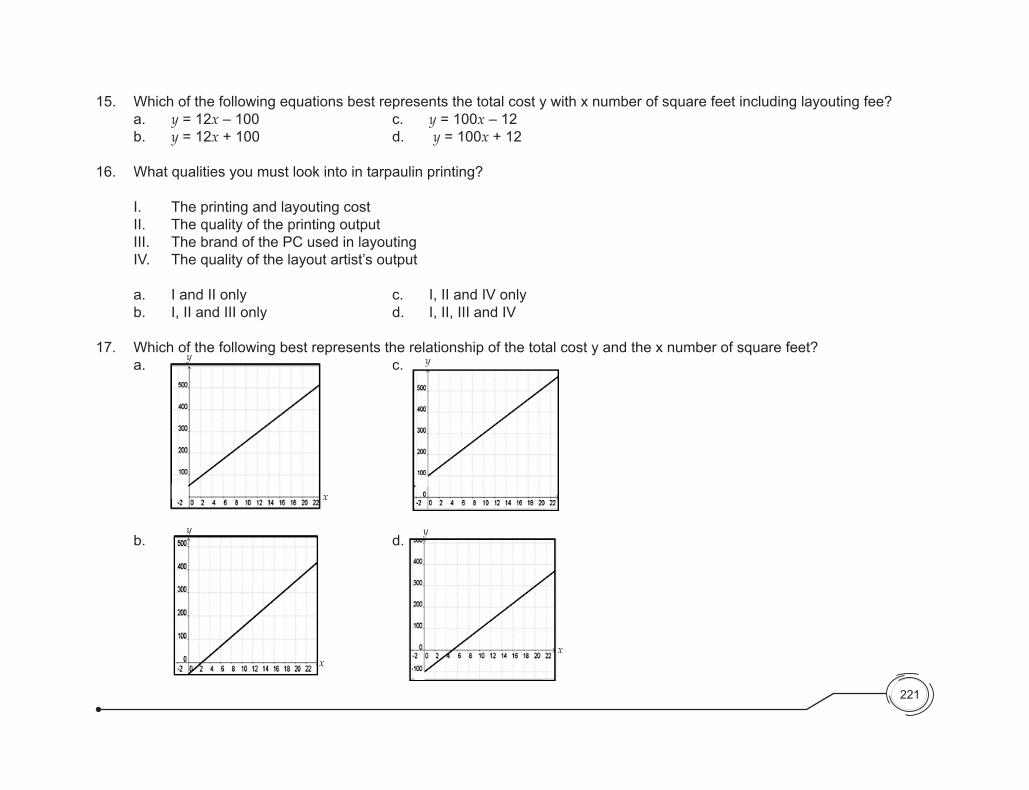
221
15. Which of the following equations best represents the total cost y with x number of square feet including layouting fee? a. y = 12x – 100 c. y = 100x – 12 b. y = 12x + 100 d. y = 100x + 12 16. What qualities you must look into in tarpaulin printing?
I. The printing and layouting cost II. The quality of the printing output III. The brand of the PC used in layouting IV. The quality of the layout artist’s output
a. I and II only c. I, II and IV only b. I, II and III only d. I, II, III and IV 17. Which of the following best represents the relationship of the total cost y and the x number of square feet? a. c.
b. d.
y y
x
y
x
y
x
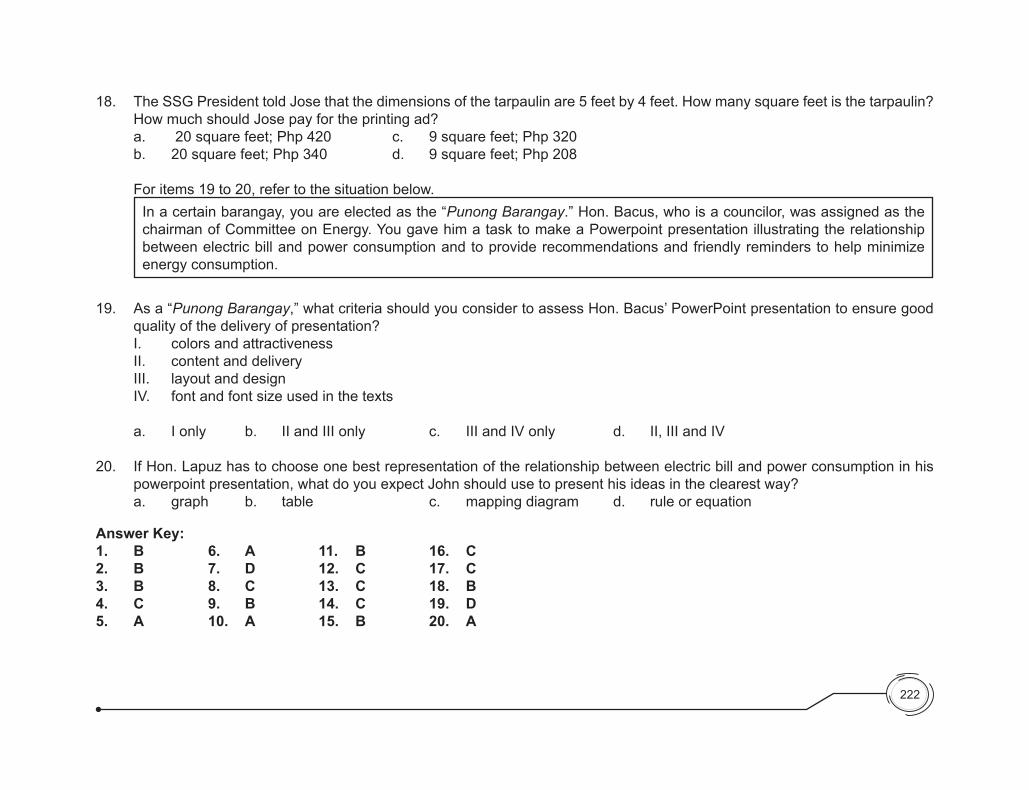
222
18. The SSG President told Jose that the dimensions of the tarpaulin are 5 feet by 4 feet. How many square feet is the tarpaulin? How much should Jose pay for the printing ad?
a. 20 square feet; Php 420 c. 9 square feet; Php 320 b. 20 square feet; Php 340 d. 9 square feet; Php 208
For items 19 to 20, refer to the situation below.
In a certain barangay, you are elected as the “Punong Barangay.” Hon. Bacus, who is a councilor, was assigned as the chairman of Committee on Energy. You gave him a task to make a Powerpoint presentation illustrating the relationship between electric bill and power consumption and to provide recommendations and friendly reminders to help minimize energy consumption.
19. As a “Punong Barangay,” what criteria should you consider to assess Hon. Bacus’ PowerPoint presentation to ensure good quality of the delivery of presentation?
I. colors and attractiveness II. content and delivery III. layout and design IV. font and font size used in the texts
a. I only b. II and III only c. III and IV only d. II, III and IV
20. If Hon. Lapuz has to choose one best representation of the relationship between electric bill and power consumption in his powerpoint presentation, what do you expect John should use to present his ideas in the clearest way?
a. graph b. table c. mapping diagram d. rule or equation
Answer Key:1. B 6. A 11. B 16. C2. B 7. D 12. C 17. C3. B 8. C 13. C 18. B4. C 9. B 14. C 19. D5. A 10. A 15. B 20. A
SUMMARY/SYNTHESIS/GENERALIZATION
This module was about relations and functions. It involved three lessons, namely: Rectangular Coordinate System, Representations of Relations and Functions, and Linear Functions. Inthefirstlesson,studentswereexpectedtoproperlyplotpointsinCartesianplaneandapplythistoreallife. In thesecond lesson, students were exposed to the different types of representing relations and functions. They were able to differentiate a function from a relation. Finally, in the last lesson, students were expected to solve, graph, and write in different ways a linear function. More importantly, they were given the chance to formulate real-life problems, solve these using a variety of strategies, and demonstrate their understanding of the lesson by doing some practical tasks.
GLOSSARY
Cartesian plane Also known as the Rectangular Coordinate System which is composed of two perpendicular number lines (vertical and horizontal) that meet at the point of origin (0, 0).
degree of a function f The highest exponent of x that occurs in the function f.
dependent variable The variable (usually) y that depends on the value of the independent variable (usually) x.
domain of the relationThesetoffirstcoordinatesoftheorderedpairs.
function A relation in which each element in the domain is mapped to exactly one element in the range.
function notation A notation in which a function is written in the form f(x) in terms of x.
horizontal line A line parallel to the x-axis.
independent variable The variable (usually) x that controls the value of the dependent variable (usually) y.
line A straight line in Euclidean Geometry.
Linear FunctionAfunctionoffirstdegreeintheformf(x) = mx + b, where m is the slope and b is the y-intercept.
223
224
mapping diagram A representation of a relation in which every element in the domain corresponds to one or more elements in the range.
mathematical phrase An algebraic expression that combines numbers and/or variables using mathematical operators.
ordered pair A representation of point in the form (x, y).
point-slope form The linear equation y−y1 = m(x−x1) is the point-slope form, where m is the slope and x1 and y1 are coordinates ofthefixedpoint.
quadrants The four regions of the xy-plane separated by the x- and y-axes.
range of the relation The set of second coordinates of the ordered pairs.
rate of change The slope m of the line and is the quotient of change in y-coordinate and the change in x-coordinate.
Rectangular Coordinate System Also known as Cartesian plane or xy-plane
relation Any set of ordered pairs.
slope of a line Refers to the steepness of a line which can be solved using the formulae:
m = riserun or m = y2−y1
x2−x1
.
slope-intercept form The linear equation y = mx + b is in slope-intercept form, where m is the slope and b is the y-intercept.
standard form The linear equation in the form Ax + By = C, where A, B and C are real numbers.
trend Tells whether the line is increasing or decreasing and can be determined using the value of m (or slope).
two-point form The linear equation y−y1 = y2−y1
x2−x1
(x−x1) is the two-point form, where x1 and y1 arecoordinatesofthefirstpoint
while x2 and y2 are coordinates of the second point.
225
vertical line A line parallel to the y-axis.
Vertical Line Test If every vertical line intersects the graph no more than once, the graph represents a function.
x-axis The horizontal axis of the Cartesian plane.
x-intercept The x-coordinate of the point at which the graph intersects the x-axis.
y-axis The vertical axis of the Cartesian plane.
y-intercept The y-coordinate of the point at which the graph intersects the y-axis.
REFERENCES
Dolciani,M.P.,Graham,J.A.,Swanson,R.A.,Sharron,S.(1986).Algebra2andTrigonometry.HoughtonMifflinCompany,OneBeacon Street, Boston, Massachussetts.
Oronce, O. A., Mendoza, M. O. (2003). Worktext in Mathematics for Secondary Schools: Exploring Mathematics (Elementary Algebra). Rex Book Store, Inc. Manila, Philippines. Oronce, O. A., Mendoza, M. O. (2003). Worktext in Mathematics for Secondary Schools: Exploring Mathematics (Intermediate Algebra). Rex Book Store, Inc. Manila, Philippines.
Oronce, O. A., Mendoza, M. O. (2010). Worktext in Mathematics: e-math for Advanced Algebra and Trigonometry. Rex Book Store, Inc. Manila, Philippines.
Ryan, M., et al (1993). Advanced Mathematics: A Precalculus Approach. Prentice-Hall, Inc., Englewood Cliffs, New Jersey.
YouMin,G.N.(2008).GCE“O”LevelPurePhysicsStudyGuide.FairfieldBookPublishers:Singapore.http://hotmath.com/help/gt/genericalg1/section_9_4.html http://jongeslaprodukties.nl/yj-emilb.html
http://math.about.com/od/geometry/ss/cartesian.htmhttp://mathsfirst.massey.ac.nz/Algebra/StraightLinesin2D/Slope.htmhttp://members.virtualtourist.com/m/p/m/21c85f/http://people.richland.edu/james/lecture/m116/functions/translations.html http://roof-materials.org/wp-content/uploads/2011/09/Roof-Trusses.jpghttp://store.payloadz.com/details/800711-Other-Files-Documents-and-Forms-sports-car-.htmlhttp://wonderfulworldreview.blogspot.com/2011/05/mayon-volcano-albay-philippines.html http://www.dog-guides.us/german-shepherds/http://www.go2album.com/showAlbum/323639/coordinartiguana_macawhttp://www.mathtutor.ac.uk/functions/linearfunctionshttp://www.myalgebrabook.com/Chapters/Quadratic_Functions/the_square_function.phphttp://www.nointrigue.com/docs/notes/maths/maths_relfn.pdfhttp://www.onlinemathlearning.com/rectangular-coordinate-system.html http://www.plottingcoordinates.com/coordinart_patriotic.htmlhttp://www.purplemath.com/modules/fcns.htmhttp://www.teachbuzz.com/lessons/graphing-functionshttp://www.webgraphing.com/http://www.youtube.com/watch?NR=1&v=uJyx8eAHazo&feature=endscreen http://www.youtube.com/watch?v=EbuRufY41pc&feature=related http://www.youtube.com/watch?v=f58Jkjypr_Ihttp://www.youtube.com/watch?v=hdwH24ToqZIhttp://www.youtube.com/watch?v=I0f9O7Y2xI4http://www.youtube.com/watch?v=jd-ZRCsYaec http://www.youtube.com/watch?v=mvsUD3tDnHk&feature=related. http://www.youtube.com/watch?v=mxBoni8N70Y http://www.youtube.com/watch?v=QIp3zMTTACE http://www.youtube.com/watch?v=-xvD-n4FOJQ&feature=endscreen&NR=1http://www.youtube.com/watch?v=UgtMbCI4G_I&feature=related http://www.youtube.com/watch?v=7Hg9JJceywA
226


![[PPT]“Unpacking the Standards” - Griffin Middle Schoolgriffinmiddleschool.typepad.com/files/unpacking-the... · Web view“Unpacking the Standards” Last modified by install](https://static.fdocuments.net/doc/165x107/5b1bbcd97f8b9a28258ee047/pptunpacking-the-standards-griffin-middle-schoo-web-viewunpacking.jpg)