Unpacking Health ODA - Global Health...
37
Unpacking Health ODA Webinar, September 02, 2015 Tim Roosen, Marco Simonelli and Joachim Rüppel
Transcript of Unpacking Health ODA - Global Health...

Unpacking Health ODA Webinar, September 02, 2015
Tim Roosen, Marco Simonelli and Joachim Rüppel

Content
I. Our Approach -Methodology
II. Unpacking ODA: the reality behind official figures
III. ODA for Health - Health Financing Perspectives
2

I. Our approach - Step by Step
SCOPE
Our research attempts to analyse the ODA of the DAC/OECD Members on the following levels:
• Volume of resources for Total development cooperation in the period 2005-14 (for all members)
• ODA contributions for health promotion as a whole in 2007-2013 (completed for European members, for non-European members in process)
4

Benchmarks
International Agreements and Recommendations on Official Development Assistance (ODA)
• 0.7% of GNI for ODA: Each economically advanced country committed in
an UN resolution in 1970 to increase its official development assistance and “reach a minimum net amount of 0.7 percent of its gross national product by the middle of the decade”. Unfortunately the recommitment in the draft outcome document of FFD3 in Addis to achieve this target by 2020 was blocked by rich countries and postponed to 2030, too late for realizing the sustainable development goals.
• WHO recommendation: 0.1% of Donor’s GNI to global health: The WHO Commission on Macroeconomics and Health (2001) found that if DAC donors contributed a minimum of 0.1% of GNI to global health, it would bridge the gap between current health expenditure and the US$ 44-60 per capita (now updated to US$86 in 2012 terms) that is needed to deliver health for all in low-income countries.
5

Benchmarks
Main Reference for Project Classification: Needs Assessments developed by Millennium Project (Health Sector) and UNAIDS (HIV Response)
Health funding needs include:
• the cost of running a health system offering essential medical interventions, such as emergency obstetric care, treatment for the major infectious diseases, and interventions to reduce child mortality and all other health interventions.
• interventions primarily provided outside the health system, such as preventing major diseases and mitigating the social impact
6
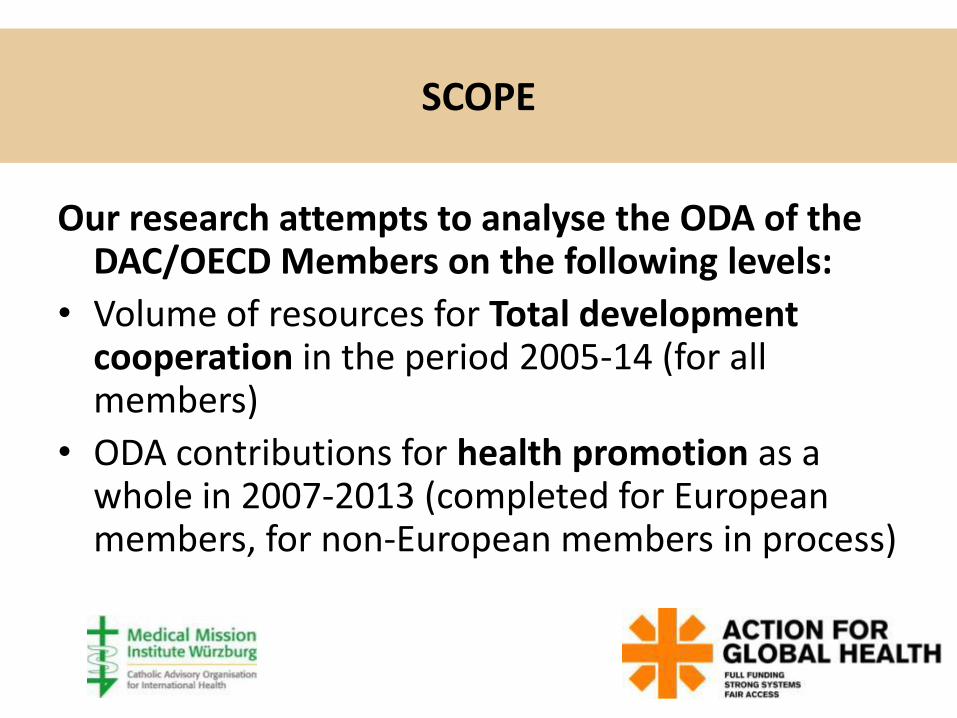
Research method – Project by Project reviews
The Analysis of Health ODA is based on a Review of all Relevant Projects Reported by Donors (bilateral and multilateral)
7

The Analysis of Health ODA is based on a Review of all Relevant Projects Reported by Donors (bilateral and
multilateral)
• The project-level information system of DAC/OECD (creditor reporting system) constitutes the main source
• Examination of every single aid activity reported in the health and population sectors in order to determine the main purposes (linking activities over the years)
• Health-relevant projects recorded in other sectors are identified via text search and scrutinized accordingly
• Insufficient or contradictory data are complemented through web-based research and direct communication with implementing agencies
8

Health ODA Analysis: Guiding Principles
• To assess the financial efforts in support of the specified purposes as precisely as possible
• To take into account all relevant aid activities and financing mechanisms that could influence the calculation of health financing in a significant way
• To identify exactly those projects and components that coincide with the specific objectives and interventions defined in the respective resource needs estimates,
• To prepare the results in order to facilitate the public use for verification of findings, further research, and promotion of accountability and transparency.
9

Result: Consolidated List of Pertinent Projects
This inventory permits to:
• correct misclassifications and reporting errors
• avoid double counting of multilateral flows
• Identify and quantify different components of multi-sector or multi-purpose programmes
• document additional information used for the determination of main purposes and components
• compute the health part of general budget support for every single recipient country
• calculate the precise share of funding for health and HIV services in relation to the total amount of disbursements, especially for multilateral organizations
10

Categories of Classification
Included in bilateral health ODA:
1) Specific HIV interventions
2) Projects of reproductive health (comprehensive)
3) General (sector-wide) health programmes
4) Child health
5) Immunisation
6) Other health problems or subsectors
Excluded from bilateral health ODA:
7) Emergency projects (meeting additional funding needs)
8) Multilateral core contributions (accounted for as multilateral)
9) Activities that are reported as health activities, but are designed mainly or entirely to promote other sectors
11

Effect of Project Review, overall

2005-2014
II. “Unpacking” ODA: the reality behind official figures

DAC Members: OECD accepted ODA Volumes, 2013, US$ million
11.3
billion
11.6 14.2 17.9 31.5

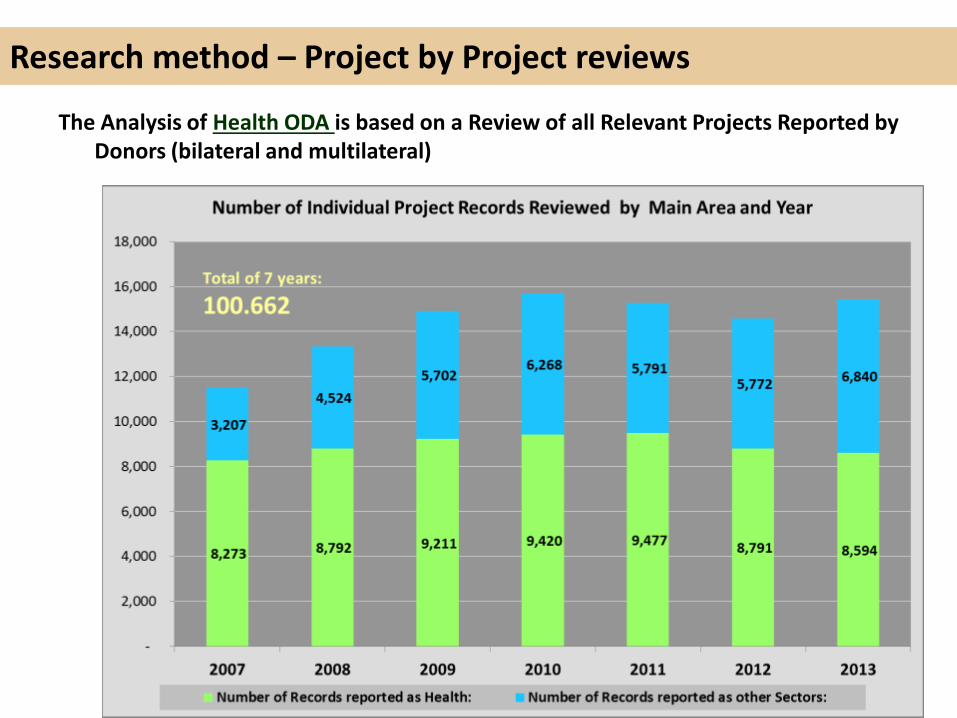
European Donors: Components of ODA (2013)
Comparing the composition of
total ODA in France (various ‘in-
country’ costs & loans) and UK
(mainly grants)
1.4572.054 2.122 2.308 2.491
3.261 3.343 3.305
4.717 5.0002.356
2.630 2.976 3.321 4.222
4.657 4.798 4.997
6.3976.337
136
252401
431
354
414 284 269
303575
1.942
1.90435
304
27
95 111 71
413
234,95
259
272,18
255,89
254,19
237,81 286,17 333,44
236,97262,38
-182 -289-872
-263 -133 -197 -205 -181 -226 -360
0,30%0,35% 0,37% 0,38%
0,47%0,53% 0,53% 0,53%
0,68% 0,67%
-0,10%
0,00%
0,10%
0,20%
0,30%
0,40%
0,50%
0,60%
0,70%
0,80%
0,90%
1,00%
1,10%
1,20%
1,30%
-1.000
-
1.000
2.000
3.000
4.000
5.000
6.000
7.000
8.000
9.000
10.000
11.000
12.000
13.000
2005 2006 2007 2008 2009 2010 2011 2012 2013 2014
Figure1:UnitedKingdom:ComponentsofOECD-acceptedODAandRa oofRealGrantTransfersinRela ontoGrossNa onalIncome(GNI),2005-13,inGBPMillions,preliminarydatafor2014
Mul lateralGrants BilateralGrantTransfers Mul lateralLoans
BilateralLoans BilateralEquityInvestments DebtForgiveness
DebtRescheduling Imputedstudentcosts Refugeesindonorcountries
Administra veCosts RecoveriesofGrants RepaymentsofLoans(principal)
RepaymentsofLoans(interest) EquityInvestments(proceeds) RealTransfersofGrantsinRela ontoGNI
2.211 2.544 2.691 2.916 3.302 3.422 3.244 3.122 3.294 3.026
1.8802.230 2.242 2.342
2.389 2.398 1.895 1.831 1.9111.868
1.862 2.645 2.762 2.271 2.696
2.584
2.7351.085
625
461
1.092881 1.040
517 3767
898
879642
669703
704 724
738738
470
376
276258
272
328392 394
341341
269
272
261285
317
331337 384
388408
-979-1.525
-1.034 -993 -900 -927 -951 -1.115 -1.089 -1.405-297
-242-282 -340 -405 -216 -226 -305 -412
-531
0,22% 0,24% 0,25%0,27%
0,30% 0,30%0,25% 0,24% 0,25%
0,22%
-0,15%
-0,10%
-0,05%
0,00%
0,05%
0,10%
0,15%
0,20%
0,25%
0,30%
0,35%
0,40%
0,45%
0,50%
0,55%
0,60%
0,65%
0,70%
-3.000
-2.000
-1.000
-
1.000
2.000
3.000
4.000
5.000
6.000
7.000
8.000
9.000
10.000
11.000
12.000
13.000
14.000
2005 2006 2007 2008 2009 2010 2011 2012 2013 2014
Figure1:France:ComponentsofOECD-acceptedODAandRa oofRealGrantTransfersinRela ontoGrossNa onalIncome(GNI),2005-13,inEuroMillions,preliminarydatafor2014
Mul lateralGrants BilateralGrantTransfers Mul lateralLoans
BilateralLoans BilateralEquityInvestments DebtForgiveness
DebtRescheduling Imputedstudentcosts Refugeesindonorcountries
Administra veCosts RecoveriesofGrants RepaymentsofLoans(principal)
RepaymentsofLoans(interest) EquityInvestments(proceeds) RealTransfersofGrantsinRela ontoGNI
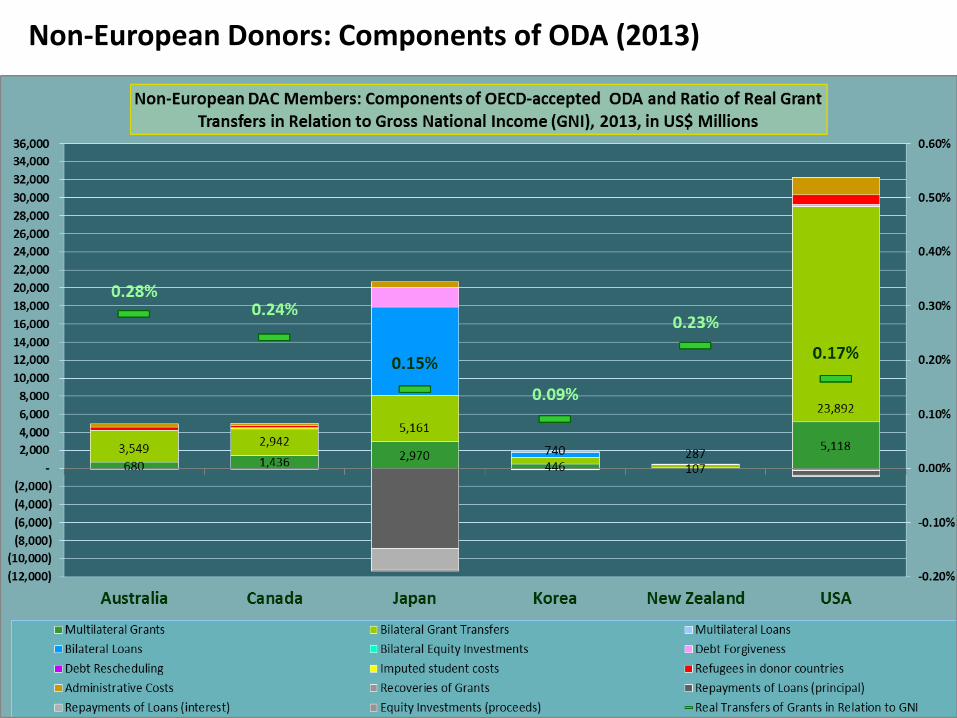
Non-European Donors: Components of ODA (2013)
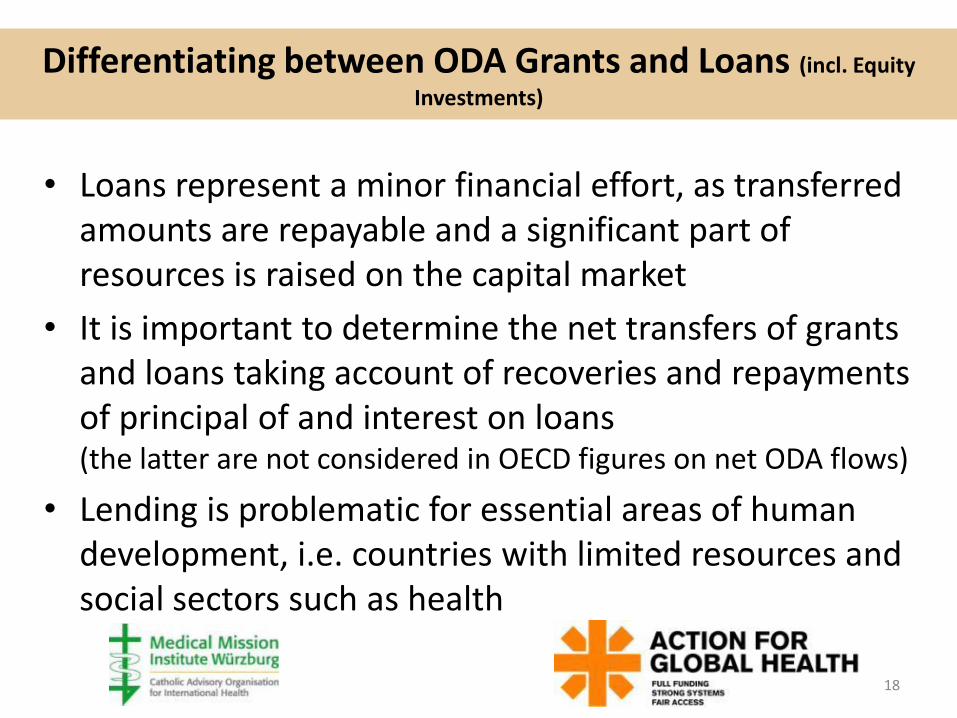
Differentiating between ODA Grants and Loans (incl. Equity
Investments)
• Loans represent a minor financial effort, as transferred amounts are repayable and a significant part of resources is raised on the capital market
• It is important to determine the net transfers of grants and loans taking account of recoveries and repayments of principal of and interest on loans (the latter are not considered in OECD figures on net ODA flows)
• Lending is problematic for essential areas of human development, i.e. countries with limited resources and social sectors such as health
18

European Donors: Lending for ODA (2013)

Germany: Money from the Capital Market to Expand ODA

Evolution Of ODA Lending per country (in particular Japan, France, Germany)
-
2.000
4.000
6.000
8.000
10.000
12.000
14.000
16.000
18.000
20.000
2005 2006 2007 2008 2009 2010 2011 2012 2013 2014
Gross Disbursements of Loans and Equity Investments by Donor
Other
Switzerland
Portugal
Canada
Norway
Korea
United Kingdom
France
Germany
Japan

DAC Donors: ODA Grants as % of GNI (2013)
0.68%
0.29% 0.25% 0.17% 0.15%

III. ODA for Health DAC Donor’s Financial Efforts for Global Health

The Urgency of ODA for Health Government Expenditure for Health per capita, 2013, in US$

The Urgency of ODA for Health Percentage of Deaths that Occurred in Persons Younger than 50 years, 2010-15

European Donors: Volumes of Health ODA (2013)
1.1 1.3 3.5
billion

European Donors: Health ODA as % of GNI (2013)
0.137%
0.043% 0.028%

DAC Donors: Components of Health ODA (2013)
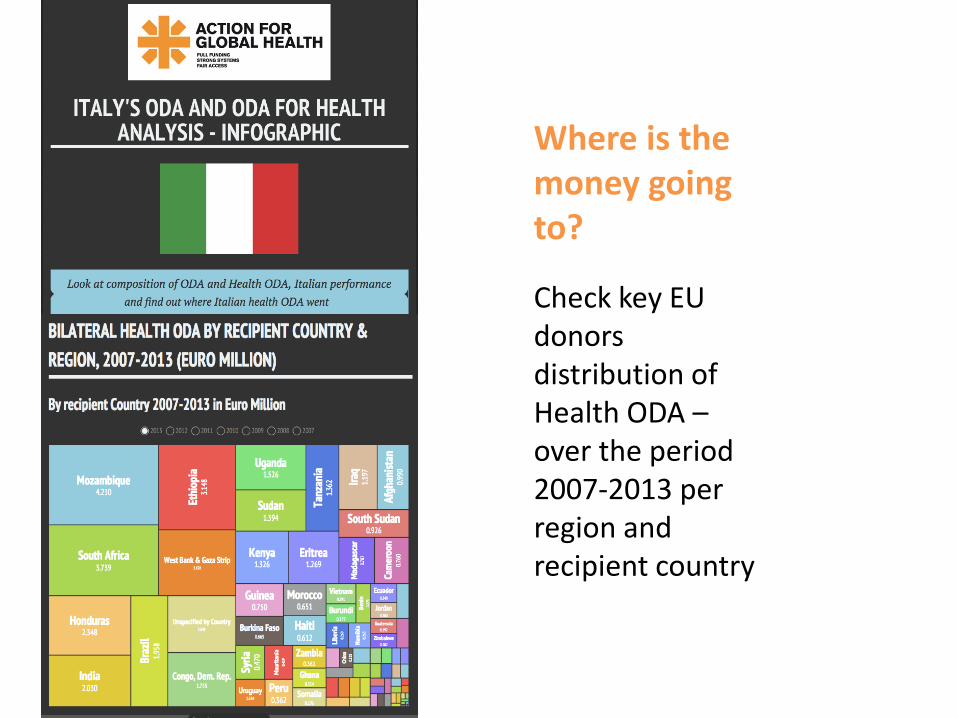
Where is the money going to?
Check key EU donors distribution of Health ODA – over the period 2007-2013 per region and recipient country
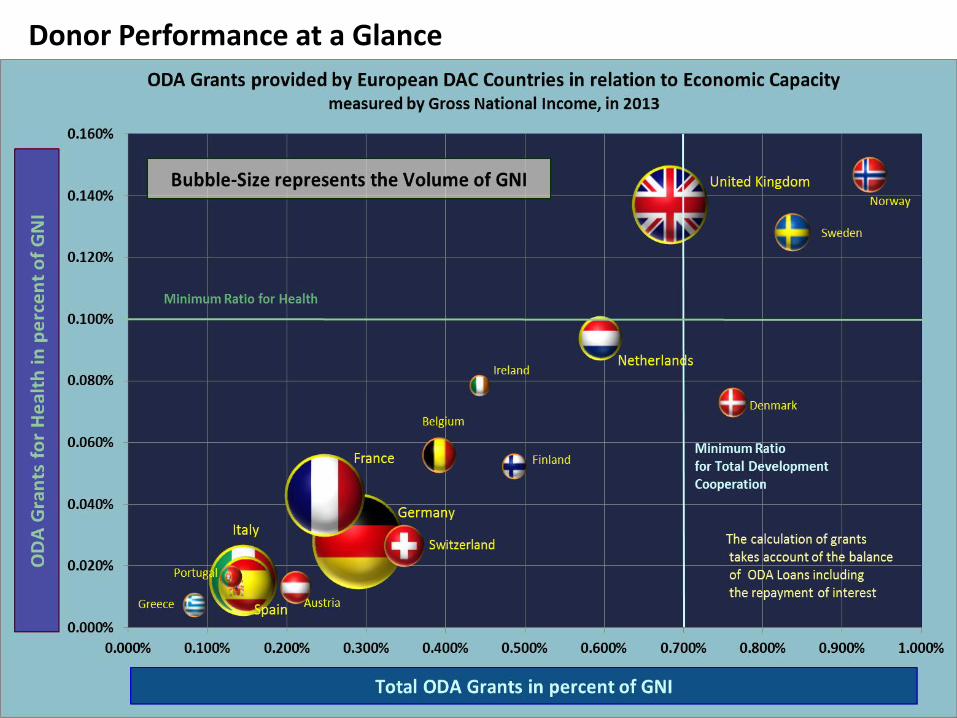
Donor Performance at a Glance

Funding Gap to Reach 0.1% of GNI for Health ODA
Eur. DAC Members: 9 billion US$ All DAC Members: approx. 24 billion US$

Fulfilling Commitments and Closing the Funding Gap

Unpacking Health ODA
Key messages of the webinar
• At the Financing for Development conference of Addis, DAC member governments have postponed again the deadline to accomplish funding targets from 2020 to 2030 – an additional ten years. To implement the Agenda for Sustainable Development and realise the Health SDG targets such as Universal Health Coverage , DAC members need to take progressive steps towards financing targets of 0.7% of GNI for human development • DAC countries should increase efforts on Health ODA – in particular the wealthiest countries that have economic capacity and the responsibility to double or even triple their volume of total Health ODA, and strive to reach 0.1% for health by 2020;

Key messages of the webinar
• The trend of increased use of loans within ODA – including from Capital market – distorts the actual performance of DAC members. If the trend (Japan, France and Germany) continues and becomes common practice amongst all large DAC members then ODA in the form of grants risks being reduced. Social sectors such as health, that are largely dependent on ODA in the form of grants, are at risk of reduced funding. •Donors must ensure that use of non grant transfers such as ODA loans and equity investments is not to the detriment of increases in ODA grants, especially in the health sector. OECD DAC members must advocate for a change in OECD-DAC reporting practices to make data more accurate, increase transparency and accountability.

Explore the interactive tools and infografics at
www.actionforglobalhealth.eu Contact: [email protected] [email protected]
http://odaforhealth.medmissio.de/ Contact [email protected]
Read more in AfGH report Health Financing – unpacking trends in ODA for Health