Unlocking the potential of data through Mapbooks
13
Unlocking the potential of data through Mapbooks Andy McGlashan NM Group ESRI UK Conference 17/05/2016
Transcript of Unlocking the potential of data through Mapbooks

Unlocking the potential of data
through Mapbooks
Andy McGlashan
NM Group
ESRI UK Conference
17/05/2016
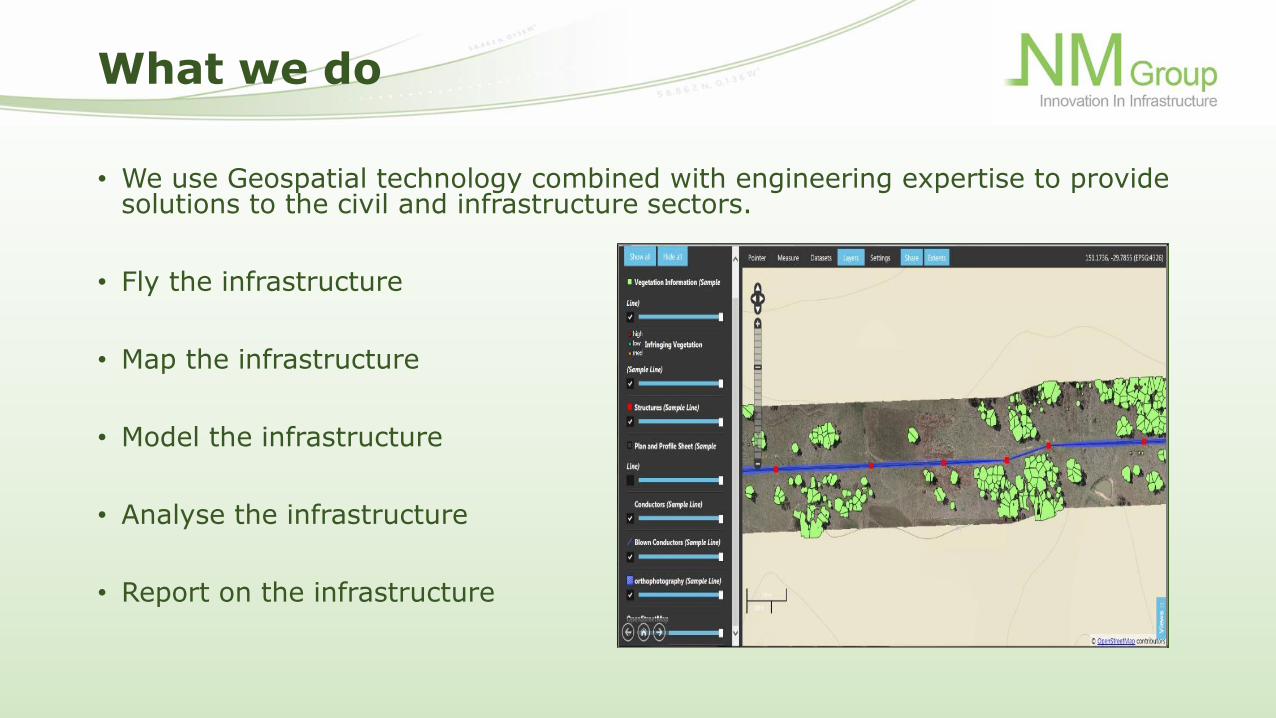
What we do
• We use Geospatial technology combined with engineering expertise to provide solutions to the civil and infrastructure sectors.
• Fly the infrastructure
• Map the infrastructure
• Model the infrastructure
• Analyse the infrastructure
• Report on the infrastructure

So why is this so important
• USA/Canada:
• In 2003 a tree came into contact with a overhead transmission line. Over the following 2 days ~50 million people lost power at a cost of 6 billion dollars. At least 11 deaths were directly attributed to the lose of power.
• Italy 2003:
• Vegetation in contact with an overhead transmission line, triggered a series of cascade failures, resulting in over 12 hours of blackout for all of Italy and parts of Switzerland; some parts continuing for over 2 days. 30,000 people were trapped on trains and an unknown number of directly attributed fatalities.
• USA:
• June 12th 2009 flash over caused a fire, burning over 5000 acres and costing over 5.5 million dollars in class action suits.
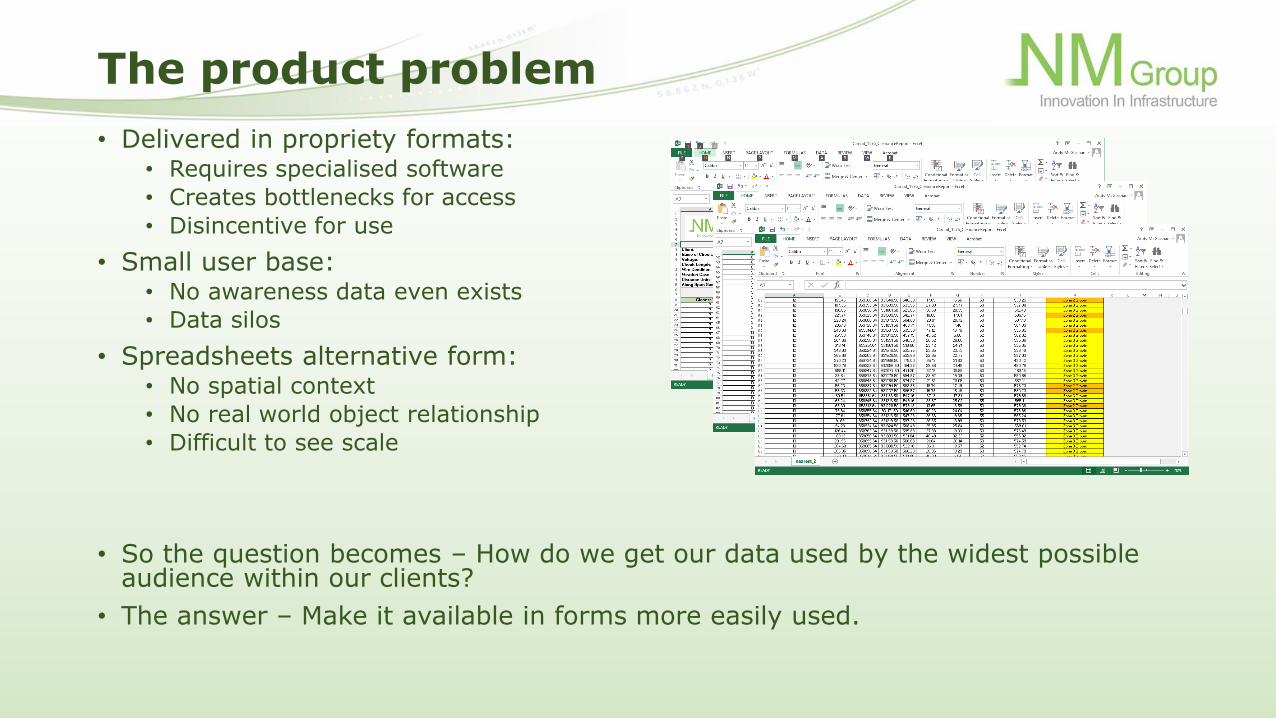
The product problem
• Delivered in propriety formats:• Requires specialised software
• Creates bottlenecks for access
• Disincentive for use
• Small user base:• No awareness data even exists
• Data silos
• Spreadsheets alternative form:• No spatial context
• No real world object relationship
• Difficult to see scale
• So the question becomes – How do we get our data used by the widest possible audience within our clients?
• The answer – Make it available in forms more easily used.

The solution
• The Map!!!
• Pdf mapbooks
• Printed hard copies
• GIS Layers
• Tabular indexed reports
• All from one data source, one flow line.

The new problem
• How to get from the table to the map…without breaking the bank.

The process – 1. data reformat
• Converts data into more ‘friendly’ formats.
• Python tool scripts.• xml creating attributed point files
• dxfs creating linear features
• base DTM and DSM raster layers
• Although command line scripts are always cool, ArcTools provides a simple, more ‘production friendly’ GUI.

The process – 2. Map making
• Spatial Analyst - Creates vegetation height rasters.
• Spatial Analyst - Classifies height rasters into client zones.
• Connect data sources to pre-styled layers in template – Everything already set up.
• Uses Strip Index combined with Data Driven pages to define map sheets.

The process – 2. Map making
• Template designed with multiple views all controlled through Data Driven Pages.
Dynamic Text allows access to attribute table valuesTip: Use draft mode to speed up composition

The process – 3. Product creation
• Python tool script creates tabular reports.
• Data Driven Pages creates single map sheet pdf.
• Data Driven Pages creates lower resolution mapbooks.
• GIS layers already setup in file gdb. Uploaded to NM Group Web viewer for serving as a WMS\WFS Map Service.
Its that simple!
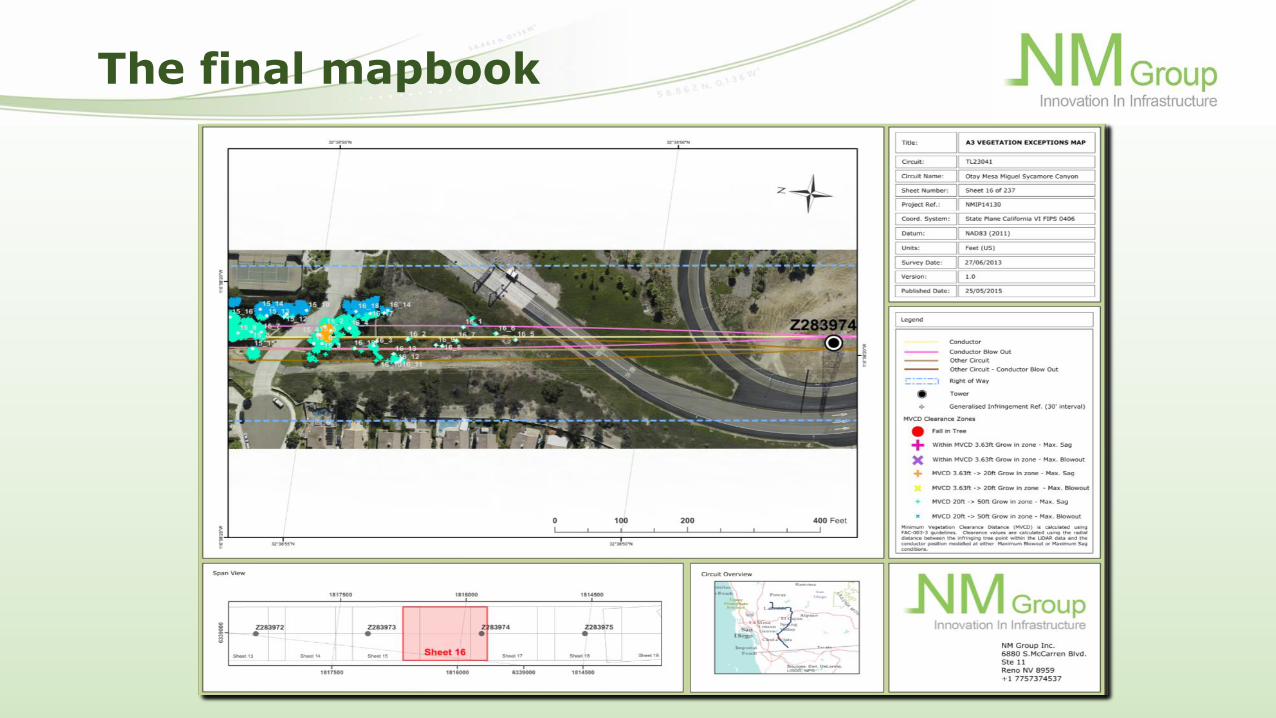
The final mapbook
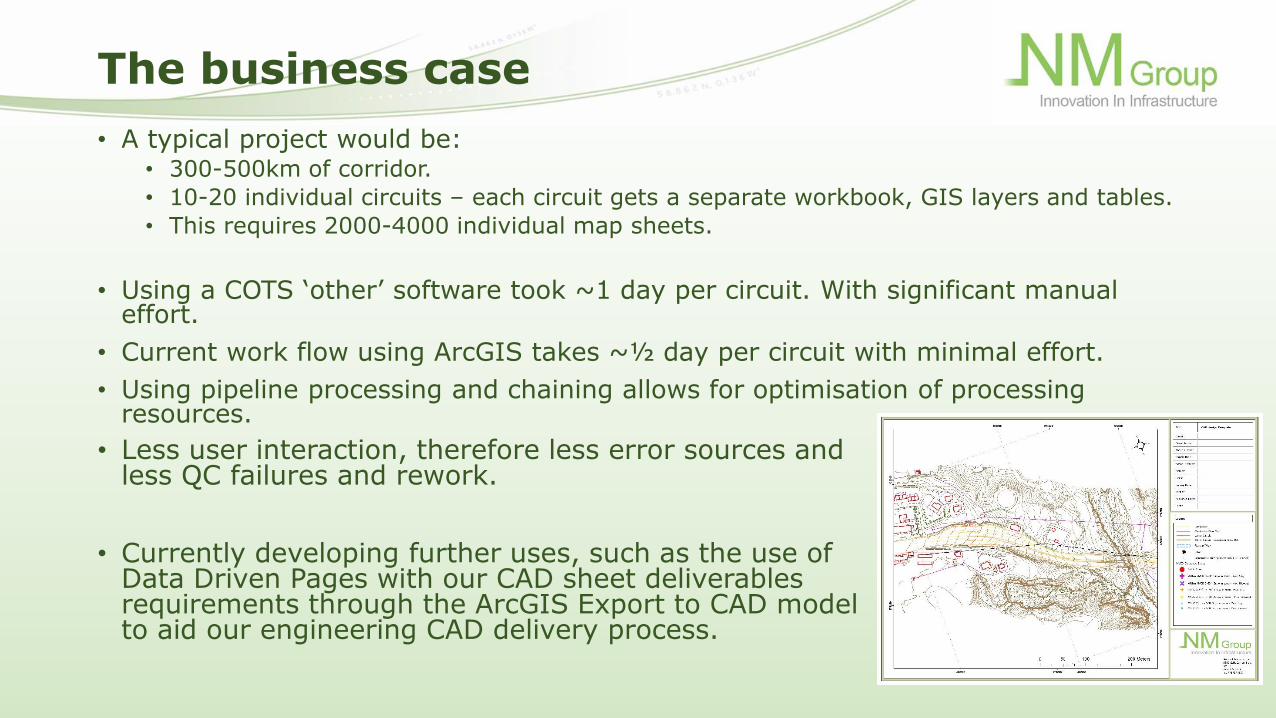
The business case
• A typical project would be:• 300-500km of corridor.
• 10-20 individual circuits – each circuit gets a separate workbook, GIS layers and tables.
• This requires 2000-4000 individual map sheets.
• Using a COTS ‘other’ software took ~1 day per circuit. With significant manual effort.
• Current work flow using ArcGIS takes ~½ day per circuit with minimal effort.
• Using pipeline processing and chaining allows for optimisation of processing resources.
• Less user interaction, therefore less error sources and less QC failures and rework.
• Currently developing further uses, such as the use of Data Driven Pages with our CAD sheet deliverables requirements through the ArcGIS Export to CAD model to aid our engineering CAD delivery process.

Thank you and any questions?