UNLOCKING SHAREHOLDER VALUE HIDING IN … · management systems to capture the purported benefits....
50
UNLOCKING SHAREHOLDER VALUE HIDING IN PROGRAMMATIC WASTE Accelerate Programmatic Transformation
Transcript of UNLOCKING SHAREHOLDER VALUE HIDING IN … · management systems to capture the purported benefits....

UNLOCKING
SHAREHOLDER
VALUE
HIDING IN
PROGRAMMATIC
WASTE
Accelerate Programmatic Transformation

Big budget marketers are increasingly using programmatic tech
methods to buy and optimize online ads. While the opportunity
to finally get the art and science of programmatic right is truly
massive, many challenges stand in the way of progress. Too many
programmatic marketers are suffering from unaccounted
working media inefficiency, suboptimal operating models, and lack
management systems to capture the purported benefits. Given the
billions spent on programmatic ads, we hypothesized by asking:
What do these nagging shortcomings cost the shareholders of big
budget advertisers?
This paper answers the question by analyzing the theoretical
financial impact on a company’s stock price when the inefficiencies
are fixed and turned into an operating advantage.
2 © 2018 Labmatik Inc.
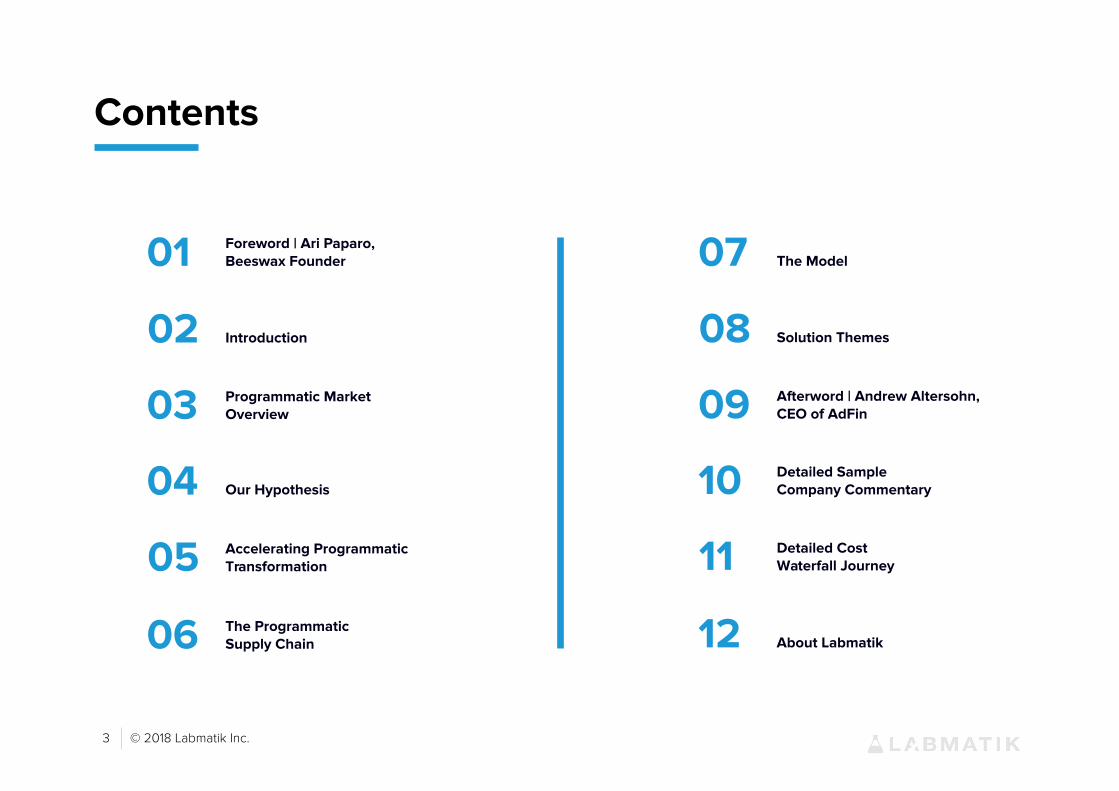
Contents
01 Foreword | Ari Paparo, Beeswax Founder
Introduction
03 Programmatic Market Overview
04 Our Hypothesis
05 Accelerating Programmatic Transformation
06 The Programmatic Supply Chain
02
07 The Model
08 Solution Themes
09 Afterword | Andrew Altersohn, CEO of AdFin
10 Detailed Sample Company Commentary
11 Detailed Cost Waterfall Journey
12 About Labmatik
3 © 2018 Labmatik Inc.
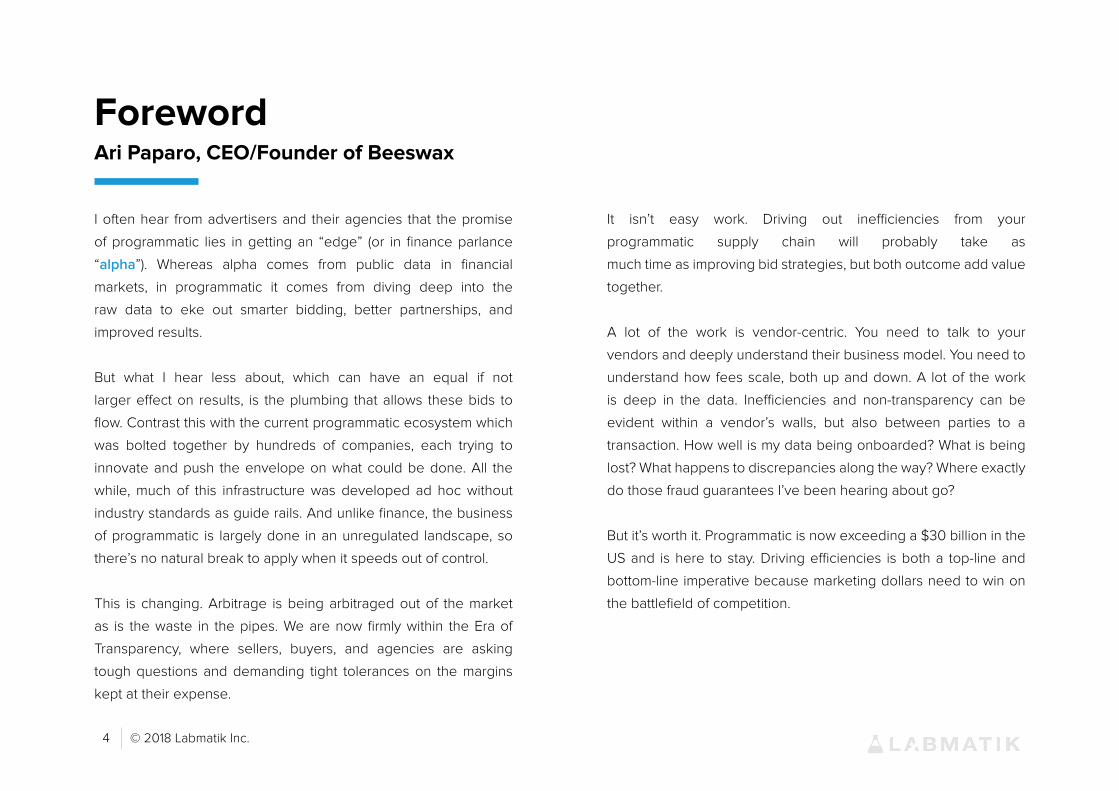
I often hear from advertisers and their agencies that the promise
of programmatic lies in getting an “edge” (or in finance parlance
“alpha”). Whereas alpha comes from public data in financial
markets, in programmatic it comes from diving deep into the
raw data to eke out smarter bidding, better partnerships, and
improved results.
But what I hear less about, which can have an equal if not
larger effect on results, is the plumbing that allows these bids to
flow. Contrast this with the current programmatic ecosystem which
was bolted together by hundreds of companies, each trying to
innovate and push the envelope on what could be done. All the
while, much of this infrastructure was developed ad hoc without
industry standards as guide rails. And unlike finance, the business
of programmatic is largely done in an unregulated landscape, so
there’s no natural break to apply when it speeds out of control.
This is changing. Arbitrage is being arbitraged out of the market
as is the waste in the pipes. We are now firmly within the Era of
Transparency, where sellers, buyers, and agencies are asking
tough questions and demanding tight tolerances on the margins
kept at their expense.
It isn’t easy work. Driving out inefficiencies from your
programmatic supply chain will probably take as
much time as improving bid strategies, but both outcome add value
together.
A lot of the work is vendor-centric. You need to talk to your
vendors and deeply understand their business model. You need to
understand how fees scale, both up and down. A lot of the work
is deep in the data. Inefficiencies and non-transparency can be
evident within a vendor’s walls, but also between parties to a
transaction. How well is my data being onboarded? What is being
lost? What happens to discrepancies along the way? Where exactly
do those fraud guarantees I’ve been hearing about go?
But it’s worth it. Programmatic is now exceeding a $30 billion in the
US and is here to stay. Driving efficiencies is both a top-line and
bottom-line imperative because marketing dollars need to win on
the battlefield of competition.
ForewordAri Paparo, CEO/Founder of Beeswax
4 © 2018 Labmatik Inc.

Introduction
Labmatik is a programmatic transformation consulting firm. We
work with marketers to take the cost and complexity out of the
programmatic supply chain so our clients can capture a competitive
advantage.
Across several engagements and with many years of experience
working in digital media, we stumbled onto a hypothesis that
we think deserves special attention from marketers, ecosystem
stakeholders and shareholders alike:
If big budget marketers are increasingly using programmatic
methods to buy and optimize, but suffering from low
working media efficiency, what is the theoretical impact on the
advertiser’s stock price when these inefficiencies are identified,
fixed and turned into a competitive advantage?
“What you have to do and the way you have to do it is incredibly simple. Whether you are
willing to do it is another matter.”Peter Drucker.
In order to answer our question, we built a straightforward
discounted cash flow model and populated it with information from
twelve publicly traded companies. After layering in a handful of
rational assumptions, we measure the impact of programmatic
efficiency gains relative to the 200-day moving average stock price.
We found that even under the most optimistic circumstances, where
the marketing organization, along with their external partners,
use programmatic tools with maximum efficiency (a rare case), all
twelve advertisers in our study are likely leaving varying degrees of
shareholder value on the table.
Conversely, by fixing the marketer’s programmatic apparatus and
turning it into a competitive advantage, shareholders can unlock
material and quantifiable gains.
Unknown problems are usually expensive and do not fix
themselves. Our paper, Unlocking Shareholder Value Hiding In
Programmatic Waste, unpacks the problem and lays out methods
to understand and solve it once and for all.
5 © 2018 Labmatik Inc.

Programmatic Market Overview67% of digital display to be sold programmatically by 2019
According to Zenith research, programmatic is already a ~$70B
market and growing at a high rate. To put programmatic in
perspective, our data and model indicates that major advertisers
such as P&G, GM, and Target allocate roughly $500M, $300M and
$100M, respectively, to programmatic buying.
However, not all of these funds turn into actual ads that benefit the
marketer’s objectives. In many cases, very little results in ads that
real consumers see because the lion’s share goes to ungoverned
external parties. Whether or not ecosystem partners ad value in
exchange is another thing.
In 2018, brands will spend about $1.2 trillion globally in paid media,
which includes paid advertising, trade marketing and other paid
communications.
The paid advertising portion is reported by eMarketer and other
research companies to be around $600B.
These are basically ads you get on traditional media such as TV
and print and all the ads you see across the digital landscape (e.g.
search, social, banner and native ads).
Digital advertising is not only growing at a fast pace but poised
to surpass TV in worldwide ad spending this year. It already
represents 38% of total paid advertising at $230B.
Over the past decade, advertisers have increasingly leaned on
programmatic methods – buying audiences and media
impressions using software-aided decisions instead of human
decisions – as the dominant tool box by which ads are bought, sold,
tracked and measured. Programmatic is not just eating the online
world, automated ad buying is happening across TV, OTT, OOH,
radio and just about everywhere else.
Paid Media
~$1.2T
Advertising
~$600B
Digital
~$230B
Programmatic
~$70B 2018
6 © 2018 Labmatik Inc.

Our Hypothesis
Given the large and increasing advertising share allocated to
programmatic methods, and the working media dollars left on the
table due to insufficient media spend accountability, we believe
when advertisers convert their current supply chain into a unique
proprietary system, they can deliver material incremental value to
shareholders.
Looking across the twelve companies in our study, shareholders
can realize a few cents per share at the low end and over a $1.00
per share in more extreme cases where programmatic ad spend
is high and control over the programmatic supply chain is weak or
non-existent.
In the more extreme cases, the severity of the problem is
generally unknown, dismissed or ignored due to common behavioral
economic issues such as cognitive dissonance, confirmation bias,
and escalation of commitment (discussed in more detail in the
Solution Themes section).
In order to prove out our hypothesis, we built a straightforward
model using public information and trade press data to estimate
potential shareholder gains.
What follows is a programmatic overview, then a step-by-step
tutorial on how the model works, directional results and
explanations to further educate readers on programmatic cost
accounting, supply chain governance, and how to turn
programmatic into a privileged advantage.
While our assumptions and the associated calculations do not
purport to be all-inclusive, the model is intended to serve as an
illustrative method to describe potential shareholder gains in a
fascinating and high-growth area of advertising strategy and
execution.
In many cases, marketers have no choice but to right-size
programmatic as a stepping stone into new changes and untapped
opportunity lining up at their doorstep.
7 © 2018 Labmatik Inc.
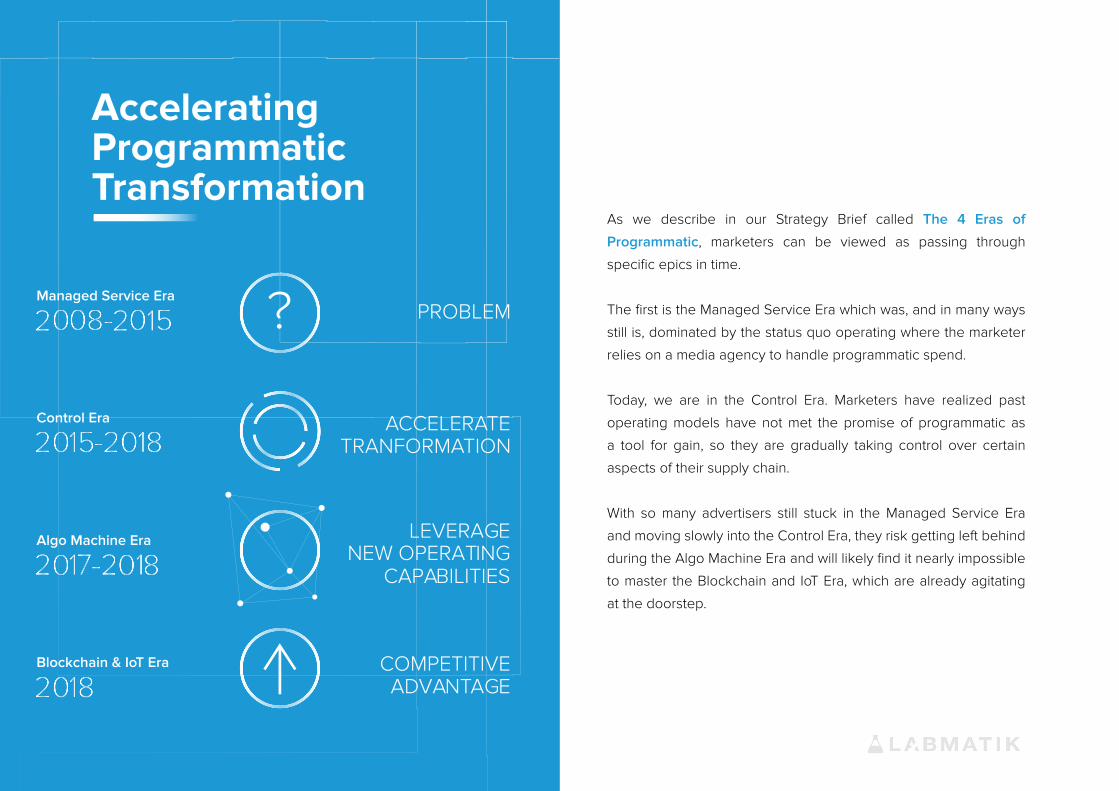
As we describe in our Strategy Brief called The 4 Eras of
Programmatic, marketers can be viewed as passing through
specific epics in time.
The first is the Managed Service Era which was, and in many ways
still is, dominated by the status quo operating where the marketer
relies on a media agency to handle programmatic spend.
Today, we are in the Control Era. Marketers have realized past
operating models have not met the promise of programmatic as
a tool for gain, so they are gradually taking control over certain
aspects of their supply chain.
With so many advertisers still stuck in the Managed Service Era
and moving slowly into the Control Era, they risk getting left behind
during the Algo Machine Era and will likely find it nearly impossible
to master the Blockchain and IoT Era, which are already agitating
at the doorstep.
Accelerating Programmatic Transformation
Managed Service EraPROBLEM
TRANFORMATIONACCELERATE
LEVERAGE
CAPABILITIES
COMPETITIVE ADVANTAGE
Blockchain & IoT Era
Control Era
Algo Machine EraNEW OPERATING

The Programmatic Supply Chain
The supply chain has two primary principals in the trade.
1. Advertiser: Wants to sell product and writes the first check in the
supply chain to buy advertising placements.
2. Publisher: Creates or curates content that its audience spends
time consuming (eyeballs, unique visitors, page views, dwell time,
etc) and generates revenue by selling ad space (banner ads, native
ads, video ads, etc)
In between the advertiser and the publisher sit several ad tech
facilitators, each taking either disclosed or undisclosed fees. The
first intermediary is the media agency, who on the one hand acts
as an agent providing various services to clients, and on the other
buys ad inventory in a variety of ways, marks it up and sells it on to
clients. Conflicts of interest notwithstanding, the two most
common approaches are marking up cost and funneling budget to an
agency trading desk contracted to a DSP that acts as a broker.
AD
VER
TISE
R PU
BLI S
HER
AGENCY
PROGRAMMATIC
TRADING DESK
VERIFICATION AND
MEASUREMENT
TECH
VERIFICATION AND
MEASUREMENT
TECHAGENCYDSP 3
DSP 2
DSP 1
SSP 3
SSP 2
SSP 1
9 © 2018 Labmatik Inc.

Start With Trailing 12-month Revenue
Estimate Total Annual Ad Spend Today
Estimate Total Programmatic Spend Today
Estimate And Apply Growth Rates to Programmatic Spend
Estimate The Working Media Today (Case For Change)
Set Working Media Goal In The Future (Value Of Change)
Calculate Working Media Cash Savings
Calculate Present Value Of Savings Over 5-year Horizon
Calculate Savings As % Of 200-Day Average Share Price
1
2
3
4
5
6
7
8
9
Our programmatic media valuation model contains nine (9)
ordered steps and estimates the share value gained when
marketers optimize and govern their programmatic supply
chain to grow working media.
The following section describes each step.
The Model

Step 1 Start With Trailing 12-month Revenue
In order to tune the model and gain a relative view, we studied
twelve (12) large advertisers across eleven (11) industries. With
respect to the illustrative purposes of this paper, we kept the
sample company list short in an attempt to create a representative
snapshot across different industries.
While all the example companies on our list rely on media agency
partners to steward media budgets, including programmatic spend,
some have started to take more control over programmatic in
order to move from the Managed Service Era to the Control Era and
beyond. While some senior marketers have made waves in the
news cycle, it is unclear how much real financial and operational
competitiveness gains have actually materialized.
In either case, most, if not all, large advertisers can realize
materialized gains for shareholders by learning how to tighten
programmatic usage as a tool to reach business objectives.
See Company Commentary in the appendix for additional
context on each company. If you would like review the actual
DCF model, please request access at [email protected]
P&G
Coke
Weight Watchers
Bayer
General Motors
Citibank
AMEX
Allstate
Target
RyanAir
Marriott
Booking Holdings
Company Symbol IndustryAnnual TTM Revenue
PG
KO
WTW
BAYRY
GM
C
AXP
ALL
TGT
RYAAY
MAR
BKNG
CPG
CPG
Personal Services
Pharmaceutical
Auto
Banking
Financial Services
Insurance
Retail
Airline
Hotel
Travel
$65.73B
$35.41B
$1.31B
$43.2B
$145.59B
$64.28B
$30.47B
$38.52B
$71.88B
$8.6B
$5.13B
$12.68B
1
2
3
4
5
6
7
8
9
10
11
12
11 © 2018 Labmatik Inc.

Step 2Estimated Total Annual Ad Spend
The second step of our model is to input total annual ad spend
using public filings and other sources such as financial and media
trade press articles.
For example, simply searching on Google for ‘P&G total ad spend’
or ‘Marriott digital ad spend’ results in a variety of articles with
either specific or directional data points. While our research does
not purport to be all-inclusive with respect to estimating total annual
ad spend, readers will likely find our estimates to be reasonably
close. In any case, any margin of error in total annual ad spend will
not materially change the answer to our hypothesis.
From a percentage of revenue perspective, large brands across
various industries allocate 0.50% to over 35.5% of revenue to
ad spend.
P&G
Coke
Weight Watchers
Bayer
General Motors
Citibank
AMEX
Allstate
Target
RyanAir
Marriott
Booking Holdings
Min
Max
Company SourceAd Spend
Ad Spend as % of Revenue
$7.10B
$4.00B
$150M
$2.73B
$3.50B
$300M
$304M
$360M
$1.50B
$48M
$195M
$4.50B
10.8%
11.3%
11.5%
6.3%
2.4%
0.5%
1.0%
0.9%
2.1%
0.6%
3.8%
35.5%
0.5%
35.5%
Financial Times
Ad Age
AdWeek
Ad Age
Autonews
AdWeek
Ad Age
AdWeek
SEC 10-K 2017
Bloomberg
Ad Age
SEC 10-K 2018
1
2
3
4
5
6
7
8
9
10
11
12
12 © 2018 Labmatik Inc.

Step 3Estimated Total Programmatic Spend
Estimating total programmatic spend is a bit trickier because none
of the companies in our study breakout programmatic ad spend
from other forms of paid media. So, rather than guessing, we rely
on a classification ad spend tree to fill in the missing programmatic
puzzle piece.
At the macro level, we already know that total global ad spend is
around $600B of which $230B is digital and $70B of digital is done
programmatically. So, on average, a given advertiser will spend
~10% of total ad budget programmatically.
Using American Express as an example, Ad Age reports that
AmEx’s total ad budget in 2016 was $304M on $30.4B in
revenue (1% of revenue) on paid advertising. Assuming AmEx spends
roughly equal portions between traditional (TV, print radio, etc) and
digital, we estimate $152M in total digital ad spend.
Since global search spend is ~$100B market, or ~43% of total
digital spend.
If AmEx’s paid search spend is 40% of digital spend, then the
remaining 60% goes to banner and video ads. If 30% of the
remaining budget goes to social ads (e.g. Facebook) and the
other 70% goes to buy banner and video ads on websites, and the
remaining is 50% executed programmatically, then AmEx’s
estimated programmatic spends is around 11% of total ad budget
or $35M.
Traditional
50%
TV, Print, Radio, OOH
Search
40%
Social
30%
Direct Buys
50%
Ad Spend 100%
Digital
50%
= x x x =Display/Video
60%
Web
70%
Programmatic
50% ~11%AmEx
Programmatic
Spend
13 © 2018 Labmatik Inc.

Estimated Total ProgrammaticSpend By Company
It is critical for readers to understand that many big advertisers
may not even know or possess a digital spend classification tree.
Ideally, a big digital advertiser would want to breakdown spend into
forensic detail as each branch can have multiple twigs and leaves.
Without seeing the entire tree in detail, it is impossible to shift,
optimize and prune spending in ways that benefit the marketer’s
objectives.
The reason for this missing classification is primarily due to
inconsistent agency categorization and incentive misalignment
within the client and agency relationship. From our point of view, a
detailed ad spend classification methodology and corresponding
cost accounting is an obvious building block to advance strategy,
planning, buying and optimization.
$600M
$400M
7.1%
$0M
$200M
7.1%
4.4%
3.2%
8.6%
11.5% 12.3% 7.0%
7.0%
13.4%17.6%
3.4%
P&G Coke Weight
Watchers
Bayer General
Motors
Citibank AMEX Allstate Target RyanAir Marriott Booking
Holdings
Estimated
Programmatic
Ad Spend
14 © 2018 Labmatik Inc.

Step 4 Estimated Programmatic Growth Rate
As marketers learn to tighten their programmatic supply chain and
turn these tools into a competitive advantage, the savings from
working media gains will grow in line with overall programmatic
spend increases, which is likely case for most major advertisers.
Since we don’t know specific marketers plans with respect to
projected ad spend in any particular channel, our model assumes
that each company in the study will increase programmatic spend
in line with industry projected growth. While there are several
programmatic forecasts available, we use eMarketer’s and
ZenithOptimedia’s projection (2015 to 2019) and extrapolate over a
5-year horizon (2020 to 2024), ending with a terminal growth rate.
While programmatic growth rates will likely differ from one
company to another, the sensitivity impact on value creation from
working media gains is not substantially altered.
Industry Programmatic Spend Growth Rate
(30% CAGR, 2012-2024)
60.0%
40.0%
20.0%
0.0%
2016 2018 2020 2022 2024
GR
OW
TH R
ATE
15 © 2018 Labmatik Inc.

Step 5 Estimated Working Media Baseline
For most, if not all, of the companies in our study, current
programmatic working media is likely around 20% or
lower. While certain misplaced belief systems in the advertising
ecosystem might disagree with such a claim, the jury is out in almost all
cases because most marketing organizations have not
undertaken a thorough investigation to baseline working media on a
fully-loaded, forensic basis.
Although engaging in such a study is relatively inexpensive and
can be completed in a few months, such a proposition can often
cause concern as opposed to an opportunity for value creation. As
discussed earlier, some marketing organizations are comfortable
with loose estimates of working media while others might prefer
the false belief that everything is fine because their partners told
them so.
In any case, once a marketer decides to get an accurate
measure of working media the opportunity to win with supply chain
management becomes real. In other words, if you can’t count it, you
can’t grow it.
For every $1.00 going into programmatic ads, as little as a dime or
less can get put to work toward buying actual ads that matter to the
marketer and consumers. In fact, it is quite easy to illustrate how
programmatic working media can be eaten away by both avoidable
and unavoidable transaction costs.
The trade press often refers to these costs as ‘ad tech taxes’. Once
they are identified and classified in forensic detail, the marketer can
then work toward eliminating avoidable charges and minimizing
pay-to-play unavoidable charges.
Some readers might be asking: How is it possible to go from $1.00
to a dime or less? It is not difficult to get by knowing where to look,
identifying avoidable costs, minimizing unavoidable costs, and
connecting nuanced relationships between different vendors
throughout the supply chain.
See Appendix ‘Detailed Cost Waterfall Journey’ for an illustrated
journey from $1.00 to less than a dime.
16 © 2018 Labmatik Inc.

Programmatic Cost Accounting
As part of our overall practice area called Programmatic
Resource Planning, Labmatik has developed a programmatic cost
accounting system that puts advertisers first. After all, they write
the first check in the ecosystem and should want to get the most
out of it.
Programmatic cost accounting is a set of defined terms used by
advertisers and their contracted partners to raise and sustain
financial accountability. Needless to say, in a time period of
growing activist investor interest in reigniting brand revenue growth,
as well as underappreciated changes in competitive market forces,
increased consumer bargaining power, and the growing adoption
of zero-based budgeting (ZBB), our cost accounting method and
terminology create a standard upon which CMOs and CFOs can
gain total alignment.
We break down programmatic cost accounting into a 2-step
process from which marketers can realize impactful and relatively
painless change over the short-term.
Case for Change: Baseline current programmatic
working media by identifying avoidable costs, minimizing
unavoidable costs, and connecting nuanced relationships
between different vendors throughout the supply chain.
Value of Change: Set a proper goal to dramatically
improve programmatic working media and make changes to
technology partners, process design and programmatic
system management. Highly efficient supply chain
management has a better chance of achieving measurable ad
effectiveness than an inefficient system.
When marketers get working media right, they get their entire supply chain right.
1
2
17 © 2018 Labmatik Inc.

The Cost Waterfall Belief System
Programmatic cost efficiency starts with a dollar
going into the supply chain and results in working
media coming out the other side. Working media are
the actual funds that buy real ad impressions that real
human consumers see.
Our model approach provides more detail into the very
nuanced accounting flow and illustrates how easy it is
to end up with $0.10 on the dollar or less as we take a
step-by-step walk down the cost waterfall.
The high-level take-away is about beliefs versus
reality. More often than not, CMOs tend to believe
programmatic working media is much higher than it
is in reality, thus exasperating expensive downstream
decisions. If the reality is $0.15, but the operating belief
upon which big budgeting decisions are made is much
higher, then nobody should be surprised when moral
hazard prevails.
Media Available
Media (AM)Fully-Loaded
Working Media
(FLWM)Working Media
BEFORE Arbitrage,
Supply & Quality
Costs(WMBASQ)
Working Media BEFORE
Quality Costs
(WMBQ)
Working Media BEFORE
Supply & Quality Costs
(WMBSQ)
$1.0
$0.80
$0.60
$0.35
$0.25
$0.10 Reality
$0.40 CMO Belief
$0.80 Potential
Media Agency Fees
3rd Party Data Buying
Tech Stack + Talent
Arbitrage, Markups, Rebates
SSP Fees
Human?
Viewable?
On Target?
18 © 2018 Labmatik Inc.

Programmatic Cost Accounting
The journey to working media is essentially a waterfall ledger where
the order of calculations matters because changes at the top of the
waterfall have a cascading effect on Fully-Loaded Working Media
toward the bottom of the waterfall. This effect is mostly due to the
fact that most programmatic supply chain fees are charged or taken
on a percentage of media basis. Not only is this pricing model one
of the biggest problem themes for marketers, but also a driving
factor in the flawed business models of many ad tech firms.
Our programmatic cost accounting terminology has been adopted
from standard financial language and establishes working media
breakpoints.
As marketers embark on a project to baseline working media
and calculate potential savings, it is important to decide which
breakpoint to deploy and communicate to stakeholders.
Working Media Breakpoints
Media Budget
Available Media Budget
(AMB)
Working Media Before Arbitrage, Supply & Quality Costs
(WMBASQ)
Working Media Before Supply & Quality Costs
(WMBSQ)
Working Media Before Quality Costs
(WMBQ)
Fully-Loaded Working Media
(FLWM)
19 © 2018 Labmatik Inc.

Step 6 Setting A Working Media Goal
Assuming the marketer has arrived at a well-researched working
media baseline, the next natural questions are:
How do I grow it?
What should I grow it to?
By how much can I grow it?
The answer depends on how much change the marketer wants to
undertake. The more open the marketer is to change management,
the more pathways there are to maximize programmatic working
media.
By ‘pathways’ we specifically mean the operating model by which
the marketing organization will handle decision management,
decision control and incentives up and down the programmatic
supply chain.
In order to help guide the decision, we devised three working
media levels to which marketers can aim:
1
2
3
Working Media Frontier
In our experience with programmatic financial modeling, we
have observed that 80% Fully-Loaded Working Media the
maximum limit before diminishing returns set in. We call this
the Working Media Frontier. Reaching it requires the most
rigorous set of trade-offs consisting of several technology and
operating model choices.
Sweet Spot
A marketing organization can decide to take a less intense
path and aim for 70%, which still means making important
operating model choices and sustaining consistent system
management across agency and ad tech partners.
Stepping Stones
Lastly, marketing leadership can aim for a lower goal of 60%
working media and still create material value. Taking this
low-bar route should be viewed as a stepping stone strategy
with the future aim of getting to 70% or 80%.
20 © 2018 Labmatik Inc.

Rule-of-Thumb
With respect to the three aforementioned working media goals,
it is important for marketers to grasp a key rule-of-thumb before
embarking down an operating model decision.
One of the biggest issues with ad tech and programmatic is how
too many marketers and their agency partners focus on tech
decisions before designing precise campaign use cases by which
the tech will facilitate the desired outcome. In other words, knowing
precisely what you want to achieve with programmatic and only
then implementing a precision system to determine whether or not
it’s been achieved should be the first step in the decision-making
process.
For example, over the past two years, many marketers have taken
transparency to heart and initiated RFP processes to sign contracts
directly with select ad tech partners such as DSPs.
While this is a sensible step forward, it is not a silver bullet.
Marketers might find out after the fact that the chosen tech
partner, particularly the DSP, cannot accomplish the marketer’s
most desired and advanced campaign use cases.
The better approach is the opposite one. First define the core
campaign use case against key business objectives and only then
identify the right technology partners and operating model that
have the best chance of making it come true.
“Plan, organize, integrate, motivate, and measure.”
Peter F. Drucker
21 © 2018 Labmatik Inc.

Operating Models Choices
After designing the core campaign use case(s) such that all actors,
pre-conditions and success metrics have been rigorously defined,
the marketer can then go about matching it to one of the four (4)
primary operating models.
Again, each model will impact programmatic working media goals
in different ways with different outcomes. The four broad model
choices are as follows:
1. Status Quo Operating Model
2. The New Trend
3. In-house Conventional Approach
4. In-house Avant-Garde Approach
While each model can stand on its own, marketers have the option
to deploy various hybrid approaches or start with the best quick win
model as a stepping stone to a predefined desired state.
4 Primary Operating Models
Status QuoOperating Model
1 2 3 4The New
TrendIn-house
ConventionalApproach
In-house Avant-Garde
Approach
Agency
BPO
DSP
SSP
22 © 2018 Labmatik Inc.

Operating Models
Status Quo Operating Model
The Status Quo Operating Model is still the most widely used
approach. While some might believe it the least worst choice
amongst past alternatives, programmatic and technology
changes have opened up other viable options that make marketers
better off. Today, marketer dissatisfaction with respect to finding the
programmatic promiseland, low working media and expensive
outcomes is rooted in this model.
The status quo involves the marketer’s media agency, who assigns
internal staff to the account and maintains contractual relationships
with DSP(s) and other ad tech partners such as ad serving and
verification vendors. The agency may also have agreements in
place with SSPs to which they will channel buys under certain
circumstances.
The New Trend
The new or recent trend over the past few years is one where the
marketer brings ad tech contracts into direct ownership, but still
relies on agency resources to play a hands-on-keyboard role, often
with very little distinction from the status quo model.
In-house Conventional Approach
Several marketers have taken the in-house conventional approach,
which is also referred to as the ‘3-legged stool’ model. This is the
most prevalent form of in-housing programmatic today, consist-
ing of internal brand teams with more skin in the game and more
involvement in daily decisions. Agency staff and their offshore
resources continue to play the execution role and retain close
relationships with DSP partners. In some cases, the agency plays
the strategy lead role and in others the marketer takes the lead.
In-house Avant-Garde Approach
A handful of marketers have taken their programmatic strategy fully
in-house – from tech contracts to staff and from process design
to system management. However, these bold marketers can only
become true avant-gardes by setting up their own low-cost
offshore teams and striking direct deals with everyone in their
supply chain including a handful of best-of-breed SSPs.
Avant-gardes don’t bid on and buy impressions. They calculate the
intrinsic value of a user and buy the ad placement for much less.
23 © 2018 Labmatik Inc.

Step 7 Calculate Savings
After programmatic working media has been baselined, and
the marketer has set a future working media goal aligned to an
appropriate operating model, real cash savings can be calculated
and captured. However, it is critical to note an important distinction
between working media gains and real cash savings.
For example, it is one thing to grow working media efficiency but
still spend the same ad budget as before. It is another to treat
the new efficiency as a way to reduce ad budget and pocket the
surplus value creation.
Working Media Gains
Spend The Same After The Change
Real Cash Savings
After TheChange
Baseline
Working Media Gains
Cash Savings
Real Cash Savings
Media Spend Fully-LoadedWorking Media
(FLWM)
24 © 2018 Labmatik Inc.

Working Media Gains vs. Cash Savings
Working Media Gains Example
Let’s say P&G allocates $500M per year in programmatic
advertising (6% of total ad spend). Let’s also assume P&G’s
real working media baseline is found to be 20% after having
undergone a full programmatic cost accounting exercise.
Based on the findings, P&G makes certain decisions to increase
working media to 70%.
Before the changes, the $500M at 20% working media equals
$100M in true working media, which is simply ad spend on real ads
to real consumers. After the changes, the $500M at 70% working
media results in $350M of ads that matter.
Assuming P&G will still spend the entire $500M after making
the change, the marketing team will have effectively increased
available working media by $250M.
In a zero-based budgeting environment, P&G would incur zero
savings if it still spends on $500M after the change from 20% to
70% working media.
Cash Savings Example
Let’s use the same P&G scenario as before, except in this example
we’ll illustrate actual cash savings.
Before the changes, the $500M at 20% working media equaled
$100M in true working media, which is the same as before.
After the changes, higher working media efficiency prevails so now
P&G only needs to spend $143M in order to buy the same $100M
of ads as before (e.g. $100M ÷ 70% new working media = $143M)
Therefore, the cash savings are $500M less $143M which is
$357M. Not only is this a of lot money, but it only takes into account
a single year of savings. It does not include the present value and
perpetuity benefits of the changes.
Given that P&G will now be able to buy the same reach and
frequency as before, and pocket $357M in real cash savings, it has
effectively started from zero.
25 © 2018 Labmatik Inc.

Zero-based Budgeting & Incentives
As you can see, in the first scenario the marketing team still spends
the same ad budget as before and in the second scenario P&G
pockets the savings resulting in shareholder gains.
The two scenarios together illustrate perhaps the biggest and
most solvable problem in programmatic and advertising in
general — escalation of commitment to exhaust all ad budget at all
costs.
Once the media budget gets cut in annual planning cycles and
starts to move downstream, the entire ecosystem has become
mentally hardwired and technically coded to ensure every last
penny gets spent on ads.
Even though sound advertising ROI measurement still eludes most
marketers, which is a very hard problem to solve, too much energy
goes into making sure the budget gets fully exhausted instead of
solving the real problem of advertising ROI. The entire advertising
ecosystem and the sprawling apparatus is based on this reality.
In the $70B programmatic world, much of the supply chain is
tuned precisely to this self-fulfilling prophecy. In some cases, the
algorithms that buy impressions are tuned to optimize spend
and pacing, not actual outcomes that shareholders would find
interesting.
On the one hand, continuing to spend the newly found money will
likely result in two equally bad outcomes. By forcing unnecessary
demand into an ecosystem with scarce supply of quality inventory,
the excess spend will likely cause price increases. On the other
hand, once the scarce supply is tapped, the remaining spend will
get forced further down the supply long-tail, into the dark web of
impression fraud, non-human users and brand unsafe
environments.
The smarter strategy is to spend only what the marketer needs to
spend in order to achieve well-defined goals. By accounting for and
increasing working media, the marketer opens the opportunity to
start from zero and ramp up quarter by quarter to the point where
it no longer makes sense to chase impressions past the point of
diminishing returns.
26 © 2018 Labmatik Inc.

Step 8 Present Value of Savings over 5 years
In Step 7, we illustrated $357M in savings over a single year using
the P&G example. In this section, we illustrate the present value of
savings over a 5-year horizon.
In order to do so, we apply programmatic industry growth rates to
show how P&G’s estimated current year programmatic spend at
~$500M might grow over time.
For the purposes of illustration, we set the model to assume 20%
working media efficiency today and set a future goal of 70%. The
operating model changes can occur over a quick time frame and
should be considered permanent, thus creating future savings in
perpetuity.
We then present value annual savings over the 5-year forecast
using the company’s weighted average cost of capital (WACC). For
P&G we estimate WACC to be ~5.1%.
To keep the model simple, we do not include any cash returns
beyond the 5-year horizon which means our calculation excludes
the continuous value of savings.
In the P&G example, total savings over five years after making the
requisite changes and applying the aforementioned assumptions
is $2.80B.
$0
$250
$500
$750
$1000
Spend with industry growth assumption
AnnualSavings
PresentValue
2017=Year 0 Year 1 Year 2 Year 3 Year 4 Year 5
27 © 2018 Labmatik Inc.

Step 9Value of Savings Relative To Share Price
In the P&G example case, the savings amounts to ~$1.00 per share
or around 1% of the 200-day moving average stock price.
Recall that we assumed a 20% working media baseline with a 70%
goal which generates an impactful outcome for shareholders. The
blue-shaded area of Table A indicates that the impact under a
variety of scenarios. In all likelihood, marketers will not find a
working media scenario where shareholders don’t gain.
Even in the best/worst case scenario where current working media
is 50% and P&G aims for the low-bar goal of 60%, shareholders
stand to gain $512M in present value savings.
In the worst/best case scenario where current working media is
10% and P&G decides to truly lead the programmatic space to the
frontier (80%), shareholders stand to gain nearly $3B in cash value.
Outcome Table B
Outcome Table A
Working
Media
In Future
Working Media Today
Shares Oustanding
Present Value from Working Media Gains
Stock Price (200-Day Moving Average)
Cash Value of Programmatic Change per Share
% Estimated Stock Price Increase
50%
60%
70%
80%
$2.50B
$2.60B
$2.68B
$2.73B
10% 20% 30% 40% 50%
$1.88B
$2.08B
$2.23B
$2.34B
$1.25B
$1.56B
$1.79B
$1.95B
$625M
$1.04B
$1.34B
$1.56B
$0M
$521M
$893M
$1.17B
2.51B
$2,233
$85.23
$0.89
1.04%
28 © 2018 Labmatik Inc.

Cash Outcomes For The 12 Example Companies
P&G
Coke
Weight Watchers
Bayer
General Motors
Citibank
AMEX
Allstate
Target
RyanAir
Marriott
Booking Holdings
Company Symbol Industry
Programmatic Spend(in $ millions)
200-day Moving Average Stock Price
DCF Savings as % of Share Price
DCF Savings (in $ millions)
DCF Savings per Share
CPG
CPG
Personal Services
Pharmaceutical
Auto
Banking
Financial Services
Insurance
Retail
Airline
Hotel
Travel
$507
$286
$10
$87
$302
$35
$37
$25
$105
$6
$34
$153
$2,232.52
$1,273.00
$18.00
$377.00
$1,329.00
$149.00
$158.00
$102.00
$463.00
$30.00
$132.00
$575.00
$0.89
$0.30
$0.28
$0.43
$0.95
$0.06
$0.18
$0.29
$0.86
$0.03
$0.37
$11.91
$85.47
$45.29
$56.13
$31.38
$41.50
$73.98
$96.01
$97.74
$67.31
$116.17
$132.26
$2,098.68
1.04%
0.66%
0.50%
1.37%
2.29%
0.08%
0.19%
0.30%
1.28%
0.03%
0.28%
0.57%
1
2
3
4
5
6
7
8
9
10
11
12
PG
KO
WTW
BAYRY
GM
C
AXP
ALL
TGT
RYAAY
MAR
BKNG
29 © 2018 Labmatik Inc.

Solution Themes

Solution Theme Avoiding The Chasm
Step 1:
Set a high aspiration to achieve programmatic excellence.
Step 2:
Get working media right by knowing your supply chain inside and
out.
Step 3:
Understand that going “in-house” means directly owning your
supply chain relationships independent of who handles
strategy and execution work, for which there are a variety of operating
models.
Step 4:
Implement a process-driven management systems.
Step 5:
Think and act as if everything in digital is a test all the time.P
rivi
lege
d K
now
ledg
e
Avoid the Chasm
Investment inProgrammatic Change
CompetitiveAdvantage
Set High AspirationFor ProgrammaticExcellence
Gain foundationalsystematic approachLeverage into customalgo and blockchain
Time
31 © 2018 Labmatik Inc.

Solution Theme Disclosure vs. Value Add, Eliminating Avoidable Charges
Given the fiduciary relationship between advertisers and their
partners, particularly media agencies, both sides are looking to
better understand and modify contractual disclosure clauses.
With downward pressure on fees over the past decade, forcing
external partners to find profitable endeavors, the practice of
taking undisclosed margins have become a primary earnings growth
driver with far-reaching implications.
From a practical point of view, advertisers should be asking
themselves: If my partner is not willing to disclose buying practices
in a forthright manner, then how can I quantify the purported value
add? If excessive and opaque margins are being taken in lieu of
services performed, then how can I value services for which I don’t
know the effective price?
The Goal
Mutual interest between
client-agent. Environment of
trust where mutual intent is
transparent.
Table Stakes
The partner is unable to get
the whole job done, but at
least the advertiser is able
to price and measure value
add.
Judgment Call
Partner is not compelled to
disclose all fees. The client
runs an experiment to
assess true value add,
concluding little to no value
add is generated.
Market Reality
The partner is not
compelled to disclose all
fees, therefore purported
and unmeasurable value
add must be called into
question because it might
not exist.
Value Add
Complete Disclosure No Disclosure
No Value Add
32 © 2018 Labmatik Inc.

Solution Theme Behavioral Psychology Translated Into Marketing Mindset
Attitudinal Issue
Cognitive Dissonance
Availability Bias
Fundamental Attribution Error
Escalation of Commitment
Confirmation Bias
Definition Example
Cognitive dissonance occurs when tension arises between a marketer’s attitude or beliefs and a decision that contradicts those pre-existing modes of thinking.
Believing working media is 50% when in reality it is 10% on the dollar.
The tendency to interpret new evidence as confirmation of one’s existing beliefs or theories.
The marketer’s primary DSP of record promotes technology roadmap developments that won’t prevail in the foreseeable future but nonetheless fit the past sales narrative when the marketer was originally sold on the purported features and benefits.
A mental shortcut that relies on immediate examples that come to a given person’s mind when evaluating a specific topic, concept, method or decision.
A direct response marketer responsible for ad budget and proven returns points to 500% ROAS achievement after doubling down on retargeting even though in reality 99% of the sales conversions would have occurred without advertising treatment.
The tendency to explain a failed campaign based on external partner factors, and to underestimate the influence of internal factors.
The digital team at a brand tries a new technology, makes uninformed campaign setup decisions then blames the tech vendor when the campaign fails to meet poorly defined success metrics.
A normal human behavior pattern in which a group facing a pattern of negative or unsatisfactory outcomes from a past decision or investment, but nevertheless continues on rather than altering course.
A marketer signs a direct contract with a DSP, pays 10% tech fees on media spend, and thinks the deal is transparent. When evidence arises that undisclosed fees are taken or the technology does not perform as sold, the marketer doubles down on the past decision.
33 © 2018 Labmatik Inc.

Solution Theme Shift Control To Advertisers To Better Leverage Partners
Budget Flows into Opaque Ecosystem and Distorted Data and Competitive Advantage
Advertiser B
CONTROL CONTROL
Advertiser A Advertiser C
Advertiser BAdvertiser A Advertiser C
Re-imaginedSystem
External Resource Layer
When budget flows into an opaque supply chain, working
media inefficiency is practically guaranteed to prevail and marketer
dissatisfaction will eventually boil over into the next best alternative.
When marketers reimagine their programmatic destiny by
educating themselves and surfacing options they can’t see today,
they will then be able to get the most out of external partners who
will be better equipped to meet high bar expectations.
34 © 2018 Labmatik Inc.

AfterwordAndrew Altersohn, CEO of AdFin
Programmatic finance is essential for 21st-century marketers. It is
the new reality, getting bigger and spanning across all advertising
mediums.
Yet, after a decade of programmatic growing pains, most
marketers are still not able to maximize the ‘bang for each
programmatic buck’, often leaving with more questions than
answers. By anybody’s math, working media figures must
improve (fast), with far more of each dollar buying eyeballs instead of
technology, data, execution and purported value add.
The path to improvement is through financial discipline and supply
chain management. As Tom points out, “If you can’t count it, you
can’t grow it.” Going a bit farther, ‘if you can’t count it, you can’t
control it, you can’t manage it, you can’t optimize it.’
Marketers must now think like supply chain managers and assess
the financial cost and benefits of each player, partner, tool, and
technology. Adopted from standard cost accounting, programmatic
finance is at the core of this approach.
In Unlocking Shareholder Value Hiding In Programmatic Waste,
Tom points out how the complexity of programmatic media means
standard approaches won’t cut it. Instead, marketers need to get
far more fluent with ‘precision system’ thinking, one that can see
patterns, trends and insights that humans can’t see given the scale
of programmatic buying.
So marketers, get ready to embrace this next chapter in
media – one that puts financial discipline, data processing,
automation and intellectual horsepower at the core.
35 © 2018 Labmatik Inc.

Detailed Company Commentary

Company + Programmatic: P&G and Coke
P&G
Going from top to bottom, P&G is known as the biggest ad spender
in the world and also known for leading the ad industry since the
1905’s. With programmatic spend estimated to be ~$500M, P&G’s
shareholders have a lot at stake when it comes to ensuring efficient
spend and measurable results.
Over the past year, P&G has been very public about efforts to take
control over programmatic, remove opaque trading arrangements
from the supply chain and benefit from the intended purpose of
these new advertising tools.
On the one hand, P&G cut $200M in digital media to save
money and vote for change with their ad dollars. On the other,
P&G would likely be better off improving and managing its digital
operating model and get better at programmatic advertising
instead of stepping out of a game in which other competitors will
certainly step in to take market share.
Coke
Similar to P&G, Coke has a sprawling marketing apparatus
and likely has a relatively large programmatic budget in the
$200M to $300M range. In a March 2017 AdExchanger article,
Mariano Bosaz, Coca-Cola’s global senior digital director said,
“Programmatic buying is about intelligence and connections. It’s
about leveraging data and intelligence, or artificial intelligence,
to disrupt the advertising industry or co-lead the disruption that is
going to happen and can’t be stopped.”
The article goes on to say how Coke started thinking about
programmatic roughly three years before and began buying
programmatically a year later via its agency partners who execute
programmatic media plans.
While $200M is only 5% of Coke’s total ad spend, if working media
today is 10% and brought up to 70%, Coke’s shareholders stand to
gain $1.6B in freed cash or ~$0.39 per share.
37 © 2018 Labmatik Inc.

Weight Watchers
We added Weight Watchers to our example company list to illustrate
how an advertiser with lower comparable ad spend, yet still sizable
in percentage of revenue terms, can equally benefit from getting
programmatic right.
Weight Watchers is a $1.3B revenue business and known for
memorable advertising. In their most recent 10-K report, Weight
Watchers said, “While our traditional advertising schedule
generally supports the three key marketing campaigns of the year
– winter, spring and fall – we communicate with consumers in the
digital space throughout the year. In other words, programmatic
ads are likely used to automate evergreen campaigns.
With only $150M in total ad budget (nearly 12% of revenue) and just
$8M in estimated annual programmatic spend, Weight Watchers
still has a big opportunity to pick up potential gains for its
shareholders.
Bayer
In February 2018, AdExchanger reported that “Pharma giant Bayer
has been scrutinizing its digital media supply chain since the ANA’s
blockbuster 2016 media transparency report warned advertisers of
waste and fraud in the ecosystem”.
In November 2017, Josh Palau, VP Of Digital And Omnichannel
Marketing, said: “Programmatic is a very useful thing, but only if we
can build segments and learn from them, and drive cost efficiencies
or creative efficiencies. That’s where programmatic becomes more
useful, compared to direct buys where you can’t target women, or
women in San Diego with kids.”
Building audience segments is an important point because if the
data that goes into a segment is corrupt, everything that follows
is negatively affected. As Bayer undergoes digital transformation
and looks to expand its marketing beyond TV, the estimated $87M
in programmatic spend will likely grow and become that much more
important.
Company + Programmatic: Weight Watchers and Bayer
38 © 2018 Labmatik Inc.

Company + Programmatic: GM and Citibank
GM
GM is one of the biggest ad spenders in the world at $3.5B. Given
the dual nature of digital ads where both upper funnel branding
(reach and frequency) and lower funnel direct response ads aim
to get buyers in the showroom, programmatic is likely a key media
pillar across GM’s many brands.
While the economics of programmatic waste are very different
between upper and lower funnel tactics, shareholders would likely
benefit from GM maximizing its programmatic advertising efficiency
to get the most showroom visits for the least cost.
Our study conservatively estimates GM’s programmatic spend in
the $300M range making GM a very large programmatic buyer. The
present value cost savings of minor adjustments and removal of
avoidable transactions should be very compelling for shareholders.
Citibank
In our estimation, Citibank spends ~$35M/year programmatically or
roughly 12% of total ad spend in order to reach consumers looking
for a checking account, mortgage, credit card, wealth
management, etc.
At the 4A’s Data Summit in February 2018, AdExchanger reported,
“We’re not always seeing the data quality we want to be seeing
[from agencies],” said Michael Wexler, director of digital insights
and marketing effectiveness. “As agencies, you guys are in a great
position to become more technically adept and to do more with
data. They should be showing us data quality that’s better than
what we have ourselves, not just pushing us a stack. When your
CFO wonders why you spend so much with one or two partners,
they want to see what’s driving impact. It’s holding us all to a higher
level of rigor.”
These astute comments highlight what is perhaps the biggest
unresolved issue in digital and programmatic — when the machine
is tuned to spend money instead of getting results, problems will
persist and the holy grail will remain elusive.
39 © 2018 Labmatik Inc.

Company + Programmatic: AmEx and Allstate
American Express
In March 2014 during an ad tech RFP process, American Express
claimed it was going 100% programmatic. As reported by AdAge,
the document said, “American Express would like to transform their
Display Media Channel to become 100% programmatic”.
In 2017 during AdExchanger’s Programmatic I/O conference, VP of
B2B Tatyana Zlotsky “revealed that the financial services company
had quadrupled programmatic media spend in 2016”.
While these programmatic aspirations are no doubt meaningful,
success hinges on the ability of AmEx’s operating model to deliver
proven efficiency and ad effectiveness. With over $300M in total
ad spend (1% of revenue) and an estimated $37M in programmatic
spend, getting AmEx on solid supply chain foundations should be
considered a top priority and inline with AmEx’s history for precision
marketing.
Allstate
Allstate was one the early adopters to take programmatic in-house
using the 3-legged stool operating model (discussed in Step 6).
However, the extent to which these inhousing efforts still rely on
external agency partners and increase working media is
hard to say.
In all likelihood, programmatic spend for Allstate is growing and
cost inefficiency may have followed suit. With an estimated $360M
in total spend and roughly 7% going to programmatic efforts,
Allstate’s programmatic budget is around $25M.
With respect to our comments on GM’s divided marketing funnel,
Allstate probably has similar challenges to overcome. The more
its programmatic strategy is disjointed, the less Allstate can truly
measure ad ROI and understand the drivers of incremental gain.
40 © 2018 Labmatik Inc.

Company + Programmatic: Target and RyanAir
Target
Target is included in our study to showcase a large retail advertiser
where using programmatic tech as a tool to reach customers at
scale, who are increasingly mobile, is critical for top-line growth.
However, as a large lower-funnel direct response advertiser,
Target likely relies on tactics such as retargeting, which if done
incorrectly with a focus on the wrong optimization objective
undetected waste is sure to follow. In fact, most large direct
response advertisers might be unknowingly spending ad dollars only
to achieve negative incrementality. In the section called “Behavioral
Psychology Translated Into Marketing Mindset” we provide a few
explanations as to why these unintended consequences prevail
more often than not.
With $1.5B in total ad spend and an estimated $100M going to
programmatic, Target has much at stake for shareholders to
understand and maximize.
RyanAir
RyanAir is a bit different than the rest of the companies in our
sample list. Their outspoken CMO Kenny Jacobs believes brands
don’t need to be loved to win over consumers and that consumers
don’t trust any brands and they don’t engage with advertising and
communications the way they used to.
“I meet marketers and they say, do you want to be loved and
is it all about the brand and brand love? It’s not. Short-haul
flying for me is a commodity choice. It’s about having the best
schedule, the cheapest flights and being very good at execution.” This
marketing attitude is interesting because RyanAir is focused on
getting the customer’s travel job better and cheaper than the
alternatives. They lead with their product instead of marketing,
which likely permeates down to advertising efficiency.
That said, with $48M in total ad spend and an estimated $7M going
to programmatic, RyanAir can almost certainly get new efficiencies
by pushing the envelope with advanced incrementality testing and
uplift modeling.
41 © 2018 Labmatik Inc.

Company + Programmatic: Marriott and Booking Holdings
Marriott
Over the past year or so, Marriott has messaged its in-house
strategy, but still relies on agencies to do the heavy lifting.
In 2016, Andy Kauffman, Marriott’s VP of digital marketing, said, “it
was important to us to build what we call a Marriott-centric stack,
rather than an agency-centric stack or a vendor-centric stack.
Our stack is a combination of third-party providers and some
proprietary stuff. We also work with a combination of agencies,
including our global media agency MEC, and five different search
agencies around the world that work locally while we take care of
strategy in-house.”
Like other direct response advertisers who might suffer the
unintended consequences of running a disjointed full-funnel
approach, Marriott might stand to gain by upping its test and learn
approach by embedding advanced media math and incrementality
statistics into its programmatic approach. With $195M in total ad
spend and an estimated $35M going to programmatic, materials
savings and competitive advantage might be for the taking when
working media is maximized.
Booking Holdings (ex-Priceline.com)
Booking Holdings, is the single ‘web endemic’ example on our
list. By ‘web endemic’ we refer to companies that were born in the
digital age and view advertising from a digital-first perspective.
In other words, traditional TV probably does not dominate the
marketing vernacular.
Companies with the holding such as Booking.com and Kayak, total
ad spend is 35% of revenue and nearly all of it is digital. As per
the most recent 2017 10-K report, total performance advertising
expense was approximately $4.1 billion (primarily Google search)
and another $392 million in brand ads primarily related TV
advertising, online video advertising (e.g. YouTube and Facebook)
and online display advertising.
Given the heavy weighting toward search, we estimate Booking
Holdings spends about $150M annually on programmatic. With
much expertise already in-house and data in their DNA, Booking
Holdings should be perfecting advanced tactics such as expected
value bidding and lean toward fixed cost DSP pricing models.
42 © 2018 Labmatik Inc.

Detailed Cost Waterfall JourneyFrom $1.00 to >$0.10

Buy-Side Costs
Media
MediaAgency
3rd parydata
OtherTech
Agency + DSP
Markup
DSP
Available
Media (AM)
Working Media
BEFORE Arbitrage, Supply
& Quality Costs
(WMBASQ)
Working Media
BEFORE Supply &
Quality Costs
(WMBSQ)
$1.0
$0.80
$0.60
$0.35
$0.60
Media Agency fees are typically charged on top of media budget, so we convert them from gross to net fees as if we only had $1.00 dollar to spend. The first $0.05 to $0.10 goes to the advertiser’s media agency who is supposed to ‘steward’ the remaining funds toward the best outcome, e.g. ads that deliver incremental value.
3rd Party DataProgrammatic campaigns typically start with buying 3rd party data to create targeted audience segments. The cost is taken from media budget and usually in the range of 5% to 20% of the budget. Assume a $0.10 charge to the advertiser.
DSP’s typically charge on a percentage of media basis. Some marketers have taken ownership of DSP contracts from agency partners over the past few years while others still lean on Agency Trading Desk DSP relationships. In the latter case, the agency will either disclose their contracted DSP fees and charge a transparent pass-through fee to the client and sometimes mark it up. In other cases, the client accepts undisclosed fees, so the agency’s DSP costs are baked into an overall client fee which will likely include some form of arbitrage or markup. Let’s assume the former and treat arbitrage in the next step. Take out $0.08 to $0.12 in DSP fees.
Other Tech includes, but not limited to, 3rd party ad tracking, verification, measurement and dynamic creative. These fees are also charged on a percentage of media basis. Depending on how these contracts are set up and how much unnecessary overlap or markup is in play, these fees total anywhere from $0.05 to $0.15. Take out another $0.10.
Arbitrage, Hidden Markups, Tricks And TomfooleryDepending on the ad stack set up and the degree of ‘quagmire’ in the media plan, there will likely exist additional costs in the form of markups, arbitrage, float, rebate, various kickbacks, etc. A conservative plug number is $0.25 even though it could be 2x or 3x higher. Since we started with $1.00 budget constraint, the SSP representing publishers on the other side of the trade gets $0.35 anywhere from $0.05 to $0.15. Take out another $0.10.
44 © 2018 Labmatik Inc.

Sell-Side and Quality Costs
SSPOnce the $0.35 hits the SSPs, which represent publisher ad inventory, they need to make a living too which is typically referred to as a ‘take-rate’. Take-rates are said to be 10% to 20%, however, SPPs have also been known to charge undisclosed fees. Looking at the Guardian’s self-imposed test buy, sell-side costs could be much higher. Once advertisers create direct contracts with SSP, these costs will be easier to know and confirm. We’ll use the midpoint and
take out another $0.10 leaving the publisher with 25% of the original dollar.
Non-viewable InventoryIf the remaining human impressions are 70% viewable as per the IAB’s minimum guideline for programmatic, and we ignore the facts that a significant share of long-tail impressions are still unmeasured by publishers and only 50% of the top 5000 publishers have implemented Ads.txt, we assume at least another $0.075 charge is incurred (30% non-viewable x remaining $0.25).
Off-target ImpressionsGoing back to audience segment creation, if the data is corrupt, poor quality and/or has low match rates, the resulting ads will be off-target. Assume this to be the case at least 25% of the time.
Invalid TrafficNot all impressions are created equal because impressions have no value on their own. An ad impression only has value when there is a real human behind it consuming content on a website or video player. Moreover, an ad impression only has value if the actual placement on the page has the opportunity to be viewed.
We conservatively assume 20% of the bought impressions are non-human, thus creating an additional charge of $0.025 (considering overlap with previously treated non-viewable impressions). If viewability rates are 70%, which would be high, another 30% charge needs to be tacked on.
45
Media
SSP
Available
Media (AM)
Working Media
BEFORE Arbitrage, Supply
& Quality Costs
(WMBASQ)
Working Media BEFORE
Supply & Quality Costs
(WMBSQ)
Working Media
BEFORE Quality Costs
(WMBQ)
Fully-Loaded
Working Media
(FLWM)
$1.0
$0.80
$0.60
$0.35
$0.25<$0.10
© 2018 Labmatik Inc.

Company Table
P&G
Coke
Weight Watchers
Bayer
General Motors
Citibank
AMEX
Allstate
Target
RyanAir
Marriott
Booking Holdings
Company
Min
Max
0.47%
35.49%
3.63%
22.07%
Symbol Industry Ad Spend
Annual TTM Revenue ($ billions)
Stock Price (200-Day Moving Average)
SharesOutstanding
Ad Spend as % of Revenue
Cost of Capital Source
CPG
CPG
Personal Services
Pharmaceutical
Auto
Banking
Financial Services
Insurance
Retail
Airline
Hotel
Travel
65.73B
35.41B
1.31B
43.06B
145.59B
64.28B
30.47B
38.52B
71.88B
8.61B
5.13B
12.68B
2.52B
4.26B
66.24M
872.47M
1.40B
2.56B
860.15M
353.14M
538.8M
1.18B
356.9M
48.29M
85.61
45.31
55.86
31.41
41.55
74.03
95.94
97.70
67.22
116.10
132.06
2,097.78
$7.10B
$4.00B
$193M
$2.73B
$3.50B
$300M
$304M
$360M
$1.50B
$48M
$195M
$4.50B
10.80%
11.30%
14.73%
6.34%
2.40%
0.47%
1.00%
0.93%
2.09%
0.56%
3.80%
35.49%
5.14%
4.75%
22.07%
5.85%
10.63%
5.96%
6.50%
7.91%
5.31%
3.63%
9.67%
10.77%
Financial Times
Ad Age
AdWeek
Ad Age
Autonews
AdWeek
Ad Age
AdWeek
SEC 10-K 2017
Bloomberg
Ad Age
SEC 10-K 2018
1
2
3
4
5
6
7
8
9
10
11
12
PG
KO
WTW
BAYRY
GM
C
AXP
ALL
TGT
RYAAY
MAR
BKNG
46 © 2018 Labmatik Inc.

P&G
Coke
Weight Watchers
Bayer
General Motors
Citibank
AMEX
Allstate
Target
RyanAir
Marriott
Booking Holdings
Company
Min
Max
3.20%
17.64%
% Traditional
Traditional / Digital Splits Digital Splits Display Splits Open Web Splits
% Digital % Search % Display % Social % Open Web % Direct % Programmatic
Est. Programmatic %
of Total Ad Spend
35%
35%
25%
20%
40%
60%
50%
40%
50%
60%
70%
97%
65%
65%
70%
80%
60%
40%
50%
60%
50%
40%
30%
3%
15%
15%
30%
60%
40%
40%
30%
50%
60%
60%
40%
90%
85%
85%
70%
40%
60%
60%
70%
50%
40%
40%
60%
10%
40%
40%
50%
20%
40%
20%
30%
30%
30%
20%
30%
30%
60%
60%
50%
80%
60%
80%
70%
70%
70%
80%
70%
70%
60%
60%
50%
50%
40%
60%
50%
50%
50%
30%
40%
50%
40%
40%
50%
50%
60%
40%
50%
50%
50%
70%
60%
50%
7%
7%
4%
3%
9%
12%
12%
7%
7%
13%
18%
3%
1
2
3
4
5
6
7
8
9
10
11
12
47
Ad Spend % Share Estimates
© 2018 Labmatik Inc.

P&G
Coke
Weight Watchers
Bayer
General Motors
Citibank
AMEX
Allstate
Target
RyanAir
Marriott
Booking Holdings
Company
TOTAL
% Traditional
Traditional / Digital Splits Digital Splits Display Splits Open Web Splits
% Digital % Search % Display % Social % Open Web % Direct % Programmatic
Total Ad Spend
$2,485
$1,400
$58
$546
$1,400
$180
$152
$144
$750
$29
$137
$4,365
$4,615
$2,600
$135
$2,184
$2,100
$120
$152
$216
$750
$19
$59
$135
$373
$210
$17
$328
$560
$72
$46
$72
$450
$17
$55
$3,929
$2,112
$1,190
$41
$218
$840
$108
$106
$72
$300
$12
$82
$437
$845
$476
$20
$44
$336
$22
$32
$22
$90
$2
$25
$131
$1,267
$714
$20
$175
$504
$86
$74
$50
$210
$9
$57
$306
$760
$428
$10
$87
$202
$52
$37
$25
$105
$3
$23
$153
$507
$286
$10
$87
$302
$35
$37
$25
$105
$6
$34
$153
$7,100
$4,000
$193
$2,730
$3,500
$300
$304
$360
$1,500
$48
$195
$4,500
$17,630 $8,470 $9,160 $5,755 $3,405 $1,199 $2,206 $1,125 $1,081
1
2
3
4
5
6
7
8
9
10
11
12
48
Ad Spend Share Estimates (in $ millions)
© 2018 Labmatik Inc.

Company Information

About Labmatik
When we launched Labmatik, we stated programmatic in very
simple terms: It’s just a new way to get an old job done. When
programmatic and data are used as intended, the advertising job
gets done in a very scalable, efficient and effective manner. If not,
the opposite and unintended outcome prevails.
Labmatik works with clients in the US, Europe, and China. They
hire us to take the cost and complexity out of programmatic. We
solve their programmatic transformation problem and materially
reduce cost. We figure out why programmatic is underperforming
and create viable action plans to correct it.
Our engagements solve for cost efficiency, solid foundations and
ad effectiveness advancement – in that order. As such, our project
ROI is typically multiples of our client’s investment hurdle rate.
From a client need perspective, the value we add falls into three
buckets:
Increased Accountability: by turning over every stone and
teaching how to count things that matter
Increased Working Media Efficiency: leads to material savings
and/or getting more bang for their buck (e.g. from sub 20% to
over 70%)
Thought Leadership: Create efficient foundations through process
redesign and deployment thus allowing the client’s team to execute
advanced campaign use cases.
Contacts:
Tom Triscari
Matt Nally
Ann Reilly
Managing Partner
Managing Partner
Consulting Partner
50 © 2018 Labmatik Inc.