Univerzita Karlova v Praze Matematicko-fyzik´aln´a...
171
Univerzita Karlova v Praze Matematicko-fyzik´ aln´ a fakulta DISERTA ˇ CN ´ I PR ´ ACE Mgr. Jana Brot´ ankov´ a Studium hork´ eho plazmatu v experiment´ aln´ ıch zaˇ r´ ızen´ ıch typu Tokamak Katedra fyziky povrch˚ u a plazmatu Vedouc´ ı disertaˇ cn´ ıpr´ace: RNDr. Jan St¨ockel CSc. Konzultant: Prof. RNDr. Milan Tich´ y, DrSc. Studijn´ ı program: Fyzika Studijn´ ı obor: Fyzika povrch˚ u a ionizovan´ ych prostˇ red´ ı Disertaˇ cn´ ı pr´ace byla vypracov´ana na ´ Ustavu fyziky plazmatu, v.v.i. Akademie vˇ ed ˇ Cesk´ e Republiky oddˇ elen´ ı Tokamak Za Slovankou 3, 182 21 Praha 8
Transcript of Univerzita Karlova v Praze Matematicko-fyzik´aln´a...

Univerzita Karlova v Praze
Matematicko-fyzikalna fakulta
DISERTACNI PRACE
Mgr. Jana Brotankova
Studium horkeho plazmatu v experimentalnıch
zarızenıch typu Tokamak
Katedra fyziky povrchu a plazmatuVedoucı disertacnı prace: RNDr. Jan Stockel CSc.
Konzultant: Prof. RNDr. Milan Tichy, DrSc.Studijnı program: Fyzika
Studijnı obor: Fyzika povrchu a ionizovanych prostredı
Disertacnı prace byla vypracovana na Ustavu fyziky plazmatu, v.v.i.Akademie ved Ceske Republiky
oddelenı TokamakZa Slovankou 3, 182 21 Praha 8


Charles University in Prague
Faculty of Mathematics and Physics
PhD THESIS
Mgr. Jana Brotankova
Study of high temperature plasma in
tokamak-like experimental devices
Department of Surface and Plasma ScienceSupervisor: RNDr. Jan Stockel CSc.
Consultant: Prof. RNDr. Milan Tichy, DrSc.Study programme: Physics
Study branch: Physics of Plasmas and Ionized Media
The PhD thesis was carried out at the Institute of Plasma Physics, v.v.i.Academy of Sciences of the Czech Republic
Tokamak departmentZa Slovankou 3, 182 21 Prague 8


Prohlasuji, ze jsem svou disertacnı praci napsala samostatne a vyhradne s pouzi-tım citovanych pramenu. Souhlasım se zapujcovanım prace.
V Praze dne 3.3.2009Mgr. Jana Brotankova


;a;va.Èåî ÁÁ*+;a;na;<a na;a;Za;n<a k+:tRua;m,aBUa;ta;a;na;<a .=+[a;Na;a;ya .. a:de ;va;a;n<a tua;Sta;yea .. a;a;pa;a:prea;[a;k+:a;na;<a ;a;va;BUa;ta;yea(rea;ya;sea na;ya;k+:~Ta;a:a:pa;a:a;s<a:=+[a;Na;a;ya .. aA;a;. a;a;yRa ; a;Za;[a;a;Æa;sa;Dya;T_a:pua;Spa.êîé*.a;a;l+.ma;Ta;a:=+Bea;t,a


Acknowledgements
First of all, I would like to thank my supervisor Jan Stockel who was guiding meon the way of knowledge. For his precious discussions about the tokamak CASTORand plasma physics when he shared his broad experience with me, his neverend-ing patience with explaining the secrets (and obvious things) of the research. Hiskindness and wonderful life attitude made our department a great place to work forme and for many other people, including our guests. His intoxicating optimism andsocial behaviour turned experiments into pleasant events when we were not awareof working hours. Such people are rare and I am sincerely happy to be his student.Thanks for his understanding and encouraging me in difficult times, reminding methat first I need to smile when I did not feel like at all.
Many thanks belong also to Milan Tichy, my consultant from the faculty, myguardian angel and a blessing for many other students of our faculty. He alwayshad opened door for me, his support and readiness to help was a solid pillar in mypast years. Thanks for the patience and carefulness in reading my work and for hisinterest in my research.
Thanks to my colleagues in the institute. The technicians for taking care of thetokamak, without them, the experiments would be infeasible. My colleagues, mainlyHonza Horacek, Ivan Duran, Renaud Dejarnac, Vlada Weinzettl and Martin Hronwho always helped me in need and who were never annoyed by my requests. Thanksto Jirka Adamek for his fruitful cooperation and enriching experience while dealingwith him. Thanks to the other colleagues who are not listed above, but who weresupporting me and who made the environment of the department and the institutepleasant.
Thanks to Guido van Oost for his kindness, for his nice collaboration in ourprojects, interest in my research and valuable comments.
Thanks to my colleagues from abroad. The RFX-mod team, mainly GianluigiSerianni, Monica Spolaore, Matteo Zuin, Matteo Agostini and others. Special thanksto Emilio Martines for his fruitful discussions and invaluable help with IDL andstatistic analysis, for his useful IDl procedures, for establishing my cooperation withPadova and for his effort in the Ball-pen probe development research.
Thanks to the TJ-II team, mainly Maria Angeles Pedrosa Luna and CarlosHidalgo Vera for inviting me to the institute and for their hospitality and help withthe work. To Maria Angeles for her support, her discussions and her help in thejungle of new environment and to Carlos for his great ideas and insight. Thanksalso to Victor Ivan Vargas Blanco for his help in struggling with IDL in Madrid.
Thanks to Pascal Devynck for his nice discussions about physics and arts andfor the interesting work about turbulence. Thanks to Codrina Ionita and RomanSchrittwieser, Gheorghe Popa and Claudiu Costin for their cooperation in the matterof the Ball-pen probe. Thanks to Linda van de Peppel for her exemplary work inour department such as for her refreshing company which, among others, resultedin making me an opera-fan.
Thanks to my colleagues who were helping me with the Thomson Scattering
project. To Petra Bılkova and others from our institute for their cooperation, toRolie Barth and Hennie van der Meiden from FOM for their fruitful discussions andto Michael Kantor, Mike Walsh and Roberto Pasqualotto who help our team.
Thanks to my professors and colleagues from the Faculty of Mathematics andPhysics for the knowledge they have passed me on and for a wonderful environmentat the department seminars. Thanks to Jana Safrankova for the great patience shehad with me.
Thanks to my colleagues from the Faculty of Nuclear Sciences and PhysicalEngineering at the Czech Technical University in Prague for their support duringmy teaching there. Special thanks belong to Vojta Svoboda who brought me to ourinstitute twelve years ago.
Thanks to leaders of the project ”Otevrena Veda” (Open Science), mainly toDagmar Dvorakova and Tomas Palaty. This project involving high school studentsinto the science let me supervising Matej Peterka, who slowly became to be a nicemember of our team. Thanks him for his interest, his enthusiasm to learn and hiswillingness to help whenever needed.
Thanks to my parents and family who brought me up and who supported me aswell as they could. For giving me the background and helping me in life struggles.
Last but not least I would like to thank to my friends. Without them, my lifewould be a lonely sojourn in this space-time. Thanks to my neighbours from thehostel, for being tolerant and just nice. To my colleagues from the student societySpolek Matfyzak and recently founded Studentska Unie UK for giving me their trustand for their energy. To all the others who brightened my days, who comforted mewhen I needed and who were just happy to be with me. Thanks to my friends wholeft their fingerprints in my thesis – Martin for his invaluable help with editing,mainly with LaTeX when my struggles were beyond my patience and Harish whowas never tired of my inventions concerning English.
At this point, I should not forget the people who were troubling me. By in-troducing obstacles into my life, they were challenging me, giving me lessons andcontributing to keeping my life in the state of marginal stability.

Part I
Introduction
1


Chapter 1
Aims of the thesis
3

4 AIMS OF THE THESIS
The understanding of plasma turbulence in magnetic confinement devices is believedto be one of the key elements leading to practical exploitation of fusion as an ultimateenergy source for mankind. As is mentioned in the introduction chapters, turbulenceis responsible for anomalously high losses of particles and energy at the plasma edge.In order to control the effects caused by turbulence, proper understanding of thephenomena occurring at the edge plasma is required.
In spite of the need for detailed knowledge about the physics of the plasma edge,it still remains an open issue for the fusion community. The Institute of PlasmaPhysics in Prague contributes to this research by taking advantage of the smallCASTOR tokamak. Relatively cold plasma and short discharges enable a detailedstudies of radial and poloidal profiles of important plasma parameters in the edgeplasma region. Several arrays of Langmuir probes with high spatial and temporalresolution are being developed as well as designs of advanced probes which aredirectly tested and improved for large fusion facilities. Last but not least is the roleof the CASTOR tokamak for the education of new scientists in fusion research.
The aims of my PhD thesis can be concluded in several items:
• Participation in experiments and development of new diagnostic methods
– domestic and international campaigns at the CASTOR tokamak
– measurements at the TJ-II stellarator
– measurements at the RFX-mod reversed field pinch
– contribute to development of the Ball-pen probe - a new electric probedesigned in IPP Prague
• Develop programmes for evaluating big packages of experimental data bymeans of statistical methods
– correlation analysis
– Fourier methods for calculating of frequency spectra
– other modern statistical methods
• Analyse experimental data in the standard regimes as well as in regimes withimproved confinement
• Contribute to the programme for education of new scientists
The thesis is organised in the following way: In the first part, an introduction tothe fusion research with focus on the edge plasma of fusion devices is given togetherwith a description of the CASTOR tokamak and its diagnostic tools. The secondpart briefly presents my work in the field of investigation of turbulence at the plasmaedge of the CASTOR tokamak, the TJ-II stellarator, and the RFX-mod reversedfield pinch. The third part exposes my contribution to the development of the Ball-pen probe. In the last (fourth) part, the conclusions are given and a list of mypublications is appended.
Chapter 2
Introduction to nuclear fusion
A brief introduction to fusion research as well as the basic prin-ciple of the plasma confinement in the experimental device namedtokamak is given in this chapter.
5

6 INTRODUCTION TO NUCLEAR FUSION
2.1 Fusion
Pollution as well as increasing demand of energy is one among the most seriousproblems of current civilization. Realization of controlled nuclear fusion reactor onthe Earth aims to solve the second one.
The concept of fusion research is to make a reactor where hydrogen nuclei getsynthetized together to produce helium and energy in a controlled manner. Similarreactions occurring in the sun and other stars produce required energy to supportlife on Earth.
The problem of nuclear fusion is that the input is formed by two positivelycharged particles, which repel each other due to the Coulombic force. They need tomeet for a distance of 10−10 m where the strong nuclei force asserts itself and boundsthe nuclei together. This can be achieved by high energetic collisions, generatedeither by accelerators or by heating ionized fuel. It was shown that the injection ofaccelerated nuclei into a hydrogen target is not efficient enough thus the research isfocused to the second option: heating the fuel.
2.1.1 Nuclear fusion reactions
There are several fusion reactions involving various hydrogen isotopes and heliumwith different cross-sections, as shown in figure 2.1. The highest cross-section at
Figure 2.1: Cross-sections of fusion reactions as a function of the energy of nuclei.
reasonable energy has the reaction with heavy isotopes deuterium (D = 2H) andtritium (T = 3H):
D + T →4 He (3.52 MeV) + n (14.1 MeV). (2.1)
Deuterium is a common element on earth as it occurs in all compounds containinghydrogen in the rate of 1:6500 (0.015%) to the 1H and it is easy to be separated.On the other hand, Tritium is a radioactive gas with half-life of 12.4 years and is

INTRODUCTION TO NUCLEAR FUSION 7
not readily avialable or present in nature. It needs to be synthetized from Lithium,directly from the inner wall of the reactor by the reaction with fusion neutrons:
n +6 Li → 4He (2.1 MeV) + T (2.7 MeV). (2.2)
The cross-sections shown in figure 2.1 come from the calculations of the energyneeded for overcoming the potential barrier for one nucleus to approach another fora sufficient time to fuse. Although this barrier is 500 keV, for our most interestingcase (the D-T reaction), nuclei with lower energies can fuse together due to thetunnel effect. This tunnel effect is considered while calculating the energy valuesshown in figure 2.1.
2.1.2 Lawson criterion
Plasma is not a group of individual nuclei, but a set of particles with the Maxwelldistribution of velocities. The rate coefficient for the D-T reaction as a function oftemperature is plotted in figure 2.2. It is obtained by averaging the cross-section(plotted in figure 2.1) over the velocity distribution.
Figure 2.2: Rate coefficient of the D-T reaction as a function of temperature.
For using fusion as a source of energy, a relation among plasma parameters,termed the Lawson criterion, must be fulfilled [1]:
L = nτET ≥ ccrit (2.3)
where n is the ion density, T is the ion temperature and the definition of τE dependson the approach to the fusion (see in the following); roughly it is the time when thethermonuclear reactions can take place. The product nτE as a function of tempera-ture is plotted in figure 2.3. For the D−T reaction, the ccrit ∼ 5 ·1021 s·keV·m−3. Inorder to build up a fusion reactor, we are looking for a compromise among density,energy confinement time, and temperature.

8 INTRODUCTION TO NUCLEAR FUSION
Figure 2.3: Product nτE as the function of temperature.
2.1.3 Approaches to nuclear fusion
Two concepts are being developed to fulfill the Lawson criterion: low density con-fined for a long time in magnetic traps and high density kept for a short time.
• Magnetic confinement
As the name suggests, this approach is to confine the hot plasma for a timelong enough to let the fast ions from the tail of the Boltzmann distributionovercome the Coulomb barrier, fuse, and sustain the reaction by covering theenergy losses. The Lawson criterion for the magnetic fusion is L = nτETwhere τE represents the energy confinement time (∼ 5 s) and the ion densityn takes values ∼ 1020 m−3.
From the cross-section in figure 2.2, it seems that the optimal temperature T(which means the temperature of the highest cross-section) is in the range of50 to 100 keV. For a fusion reactor, the energy balance between the powerlosses and the heating by α-particles (the products of the nuclear reactions)must be considered. Power losses and the α-particle heating as functions oftemperature are presented in figure 2.4. This figure is important to realize thatthe optimal temperature for the plasma in fusion reactor is around 15 keV.
Plasma is confined in magnetic traps of different configurations. The mostadvanced are the toroidal devices: tokamaks, stellarators, and reversed fieldpinches.
• Inertial fusion
On the contrary, the second approach uses high densities and very short time ofconfinement. This method is based on micro-explosions of pellets (frozen fuel)heated by high-energy laser or ion beams. The outer shell of the pellet, madeusually from plastics, explodes and by the inertial force, it compresses the fuelinside which consequently reaches the required temperature and density.

INTRODUCTION TO NUCLEAR FUSION 9
Figure 2.4: Power losses and the α-particle heating as functions of temperature. Theadditional heating is necessary for temperatures outside the range of the power gain.
Typical configuration of an inertial fusion device is limited by achievable densi-ties ∼ 1030 m−3. Burning time of the pellet for such compression is τE ∼ 10−10 sand the temperature takes values of ∼ 30 keV.
2.2 Tokamaks
The most promising reactor arrangement in current fusion research is the tokamak.It is a ring-shaped vacuum vessel placed as the secondary circuit of a transformer.Plasma is confined inside by a strong magnetic field along the chamber and it isheated by electric current.
2.2.1 Magnetic field of tokamak
A scheme of a tokamak is shown in figure 2.5. Tokamaks take advantage of the factthat the charged particles cannot move across magnetic field but they follow the fieldlines [1]. The vacuum chamber is wrapped by poloidal coils generating magneticfield along the torus (in the toroidal direction). This field is usually around 1 T forsmall tokamaks and up to 4 T for large facilities (JET). The toroidal magnetic fielddecreases with increasing major radius R, Btor ∼ 1/R due to the toroidal geometry.
As a consequence, the grad B drift ∇B× ~B separates ions and electrons and createsan electric field perpendicular to ~Btor. The resulting ~Erad × ~Btor drift causes acollective motion of charged particles, making the plasma unstable.
A significant feature of tokamak configuration is the plasma current. It flows inthe toroidal direction having two important tasks: it heats the plasma and simul-taneously it eliminates the ∇B × ~B instability by giving the current its poloidalcomponent. The ring of fully ionized plasma is placed as the secondary winding ofa transformer as shown in figure 2.5. At the beginning of the discharge, the plasmacurrent ionizes and heats the working gas by so-called ohmic heating (details are

10 INTRODUCTION TO NUCLEAR FUSION
Poloidalcross-section
Plasma column
Helical field linesPoloidal coilsDiagnostic port
Vacuum vessel
Vertical field coils
Primary windingof the transformer
Transformer core
Figure 2.5: Principle of tokamak.
given in section 3.2). Simultaneously, it generates a poloidal magnetic field, whichtwists the magnetic field lines giving the resulting magnetic field a helical shape.
The magnetic field lines lay on nested surfaces centred on the magnetic axis asshown in figure 2.6. These layers are termed magnetic flux surfaces. The poloidalcomponent of the tokamak magnetic field is ∼ 10 times lower than the toroidal one.Thus, the helicity of the magnetic field is low and one field line needs several turnsin the toroidal direction in order to intersect the poloidal cross-section at the samepoint. This number is termed the safety factor and is described in section 3.2.7.
poloidaldirection
toroidaldirection
nested surfaces
tokamakaxis
Figure 2.6: Magnetic surfaces.

Chapter 3
CASTOR tokamak and diagnostictools
This chapter gives a description of the CASTOR tokamak, gener-ating the discharge, the main plasma parameters and diagnostics.
11
12 CASTOR TOKAMAK AND DIAGNOSTIC TOOLS
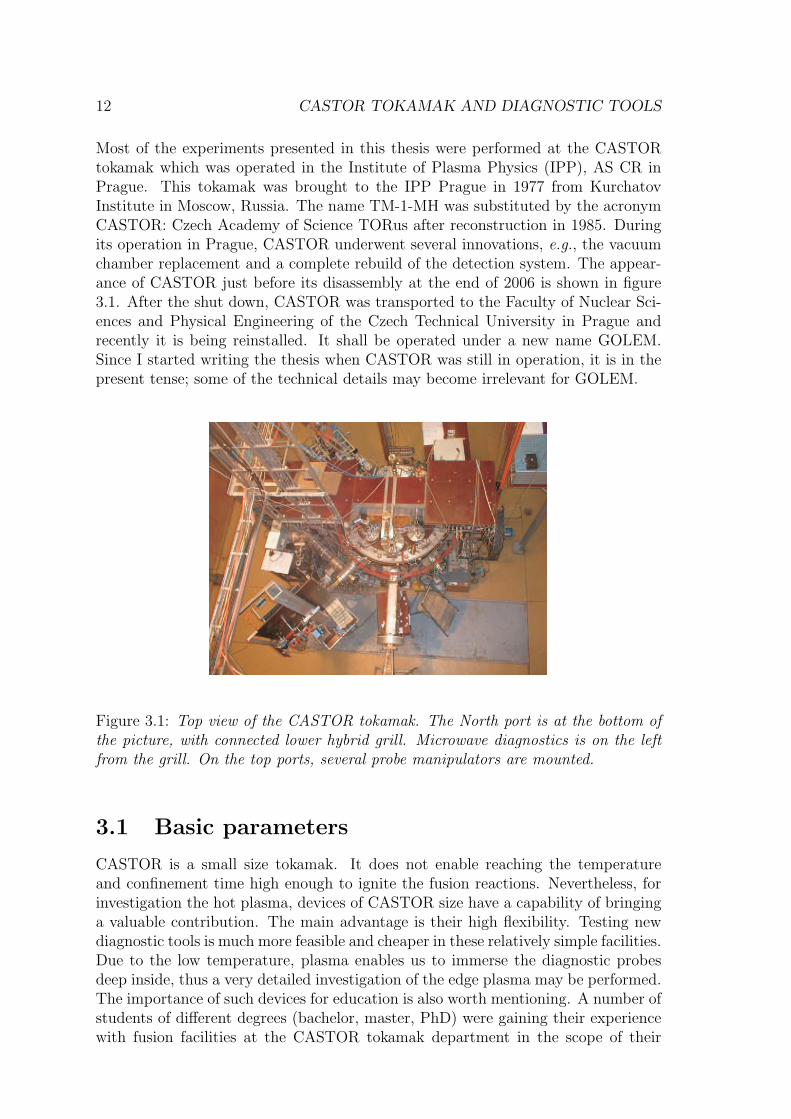
Most of the experiments presented in this thesis were performed at the CASTORtokamak which was operated in the Institute of Plasma Physics (IPP), AS CR inPrague. This tokamak was brought to the IPP Prague in 1977 from KurchatovInstitute in Moscow, Russia. The name TM-1-MH was substituted by the acronymCASTOR: Czech Academy of Science TORus after reconstruction in 1985. Duringits operation in Prague, CASTOR underwent several innovations, e.g., the vacuumchamber replacement and a complete rebuild of the detection system. The appear-ance of CASTOR just before its disassembly at the end of 2006 is shown in figure3.1. After the shut down, CASTOR was transported to the Faculty of Nuclear Sci-ences and Physical Engineering of the Czech Technical University in Prague andrecently it is being reinstalled. It shall be operated under a new name GOLEM.Since I started writing the thesis when CASTOR was still in operation, it is in thepresent tense; some of the technical details may become irrelevant for GOLEM.
Figure 3.1: Top view of the CASTOR tokamak. The North port is at the bottom ofthe picture, with connected lower hybrid grill. Microwave diagnostics is on the leftfrom the grill. On the top ports, several probe manipulators are mounted.
3.1 Basic parameters
CASTOR is a small size tokamak. It does not enable reaching the temperatureand confinement time high enough to ignite the fusion reactions. Nevertheless, forinvestigation the hot plasma, devices of CASTOR size have a capability of bringinga valuable contribution. The main advantage is their high flexibility. Testing newdiagnostic tools is much more feasible and cheaper in these relatively simple facilities.Due to the low temperature, plasma enables us to immerse the diagnostic probesdeep inside, thus a very detailed investigation of the edge plasma may be performed.The importance of such devices for education is also worth mentioning. A number ofstudents of different degrees (bachelor, master, PhD) were gaining their experiencewith fusion facilities at the CASTOR tokamak department in the scope of their
CASTOR TOKAMAK AND DIAGNOSTIC TOOLS 13
studies, several Summer schools for students and young scientists were organized bythe CASTOR team.
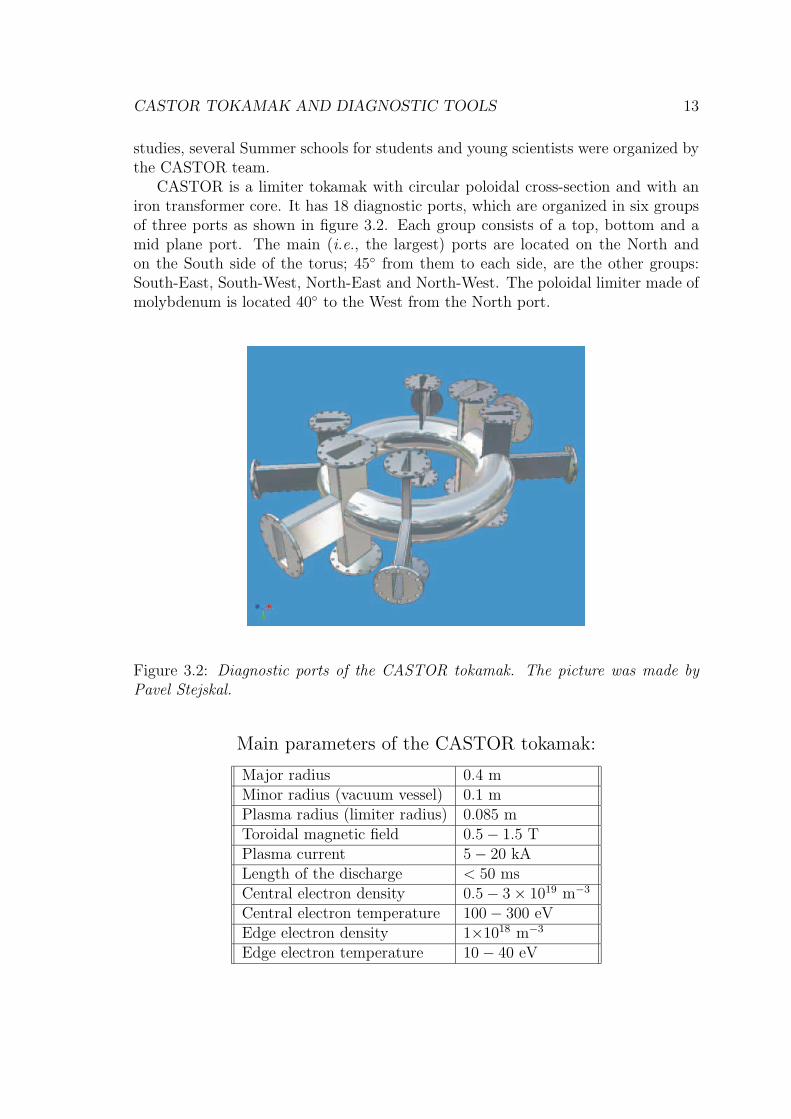
CASTOR is a limiter tokamak with circular poloidal cross-section and with aniron transformer core. It has 18 diagnostic ports, which are organized in six groupsof three ports as shown in figure 3.2. Each group consists of a top, bottom and amid plane port. The main (i.e., the largest) ports are located on the North andon the South side of the torus; 45 from them to each side, are the other groups:South-East, South-West, North-East and North-West. The poloidal limiter made ofmolybdenum is located 40 to the West from the North port.
Figure 3.2: Diagnostic ports of the CASTOR tokamak. The picture was made byPavel Stejskal.
Main parameters of the CASTOR tokamak:
Major radius 0.4 mMinor radius (vacuum vessel) 0.1 mPlasma radius (limiter radius) 0.085 mToroidal magnetic field 0.5 − 1.5 TPlasma current 5 − 20 kALength of the discharge < 50 msCentral electron density 0.5 − 3 × 10¹⁹ m−3
Central electron temperature 100 − 300 eVEdge electron density 1×10¹⁸ m−3
Edge electron temperature 10 − 40 eV

14 CASTOR TOKAMAK AND DIAGNOSTIC TOOLS
3.2 Discharge in the CASTOR tokamak
3.2.1 Plasma generation
Temporal evolution of a typical discharge of the CASTOR tokamak is shown infigure 3.3. Before discharge, the vacuum vessel is evacuated down to the pressureof 10−4 Pa and filled by working gas (hydrogen). After that, the power suppliesare connected to the toroidal magnetic field coils. Since now, the toroidal magneticfield Btor starts increasing (detailed behaviour is described in appendix A-1). WhenBtor reaches the range of 0.8 – 1 T (which is usually 10 – 25 ms after switchingit on), the primary transformer winding is automatically connected to its powersupplies (capacitor banks) [2, 3] and the toroidal electric field Etor is induced withinthe vacuum vessel. The Btor is measured by an open loop fixed at the top of thevessel. The measured voltage is termed a loop voltage Uloop, its temporal evolutionis shown in the second panel of figure 3.3. The Etor = Uloop/2πR starts to acceleratefree electrons, which are produced by an electron gun placed in the limiter shadow.Some free electrons are always present due to the cosmic radiation, but their amount
Figure 3.3: Temporal evolution of a typical CASTOR discharge, with parameters:toroidal magnetic field (Btor), loop voltage (Uloop), plasma current (Ipl), line averagedelectron density (ne). The whole discharge is plotted in left panels, the zoomed instart-up phase is shown in the right ones. Blue vertical lines (left panels) indicatethe beginning and the end of the discharge. Green vertical lines (right panels) denotethe breakdown.

CASTOR TOKAMAK AND DIAGNOSTIC TOOLS 15
is not sufficient for a fast and reproducible breakdown (the moment of ignition ofthe discharge). After breakdown, the electron density ne increases exponentially,as shown in figure 3.3, right bottom panel. After ∼ 1 ms from breakdown, theworking gas is completely ionized. Simultaneously, the plasma current Ipl increasesto the rate of 2 MA/s, which is determined by the primary circuit parameters. Theslope dIpl/dt has to be kept relatively low to negate the skin effect, which coulddrive the current only on the surface of the plasma column. In this case, the radialprofile of plasma current and plasma current density gets a hollow shape, plasmagets unstable and consequently disrupts.
After the plasma current reaches values of ∼ 10 kA, it tends to remain constantfor the next 20 − 30 ms. During this quasistationary phase of discharge, the loopvoltage is 2− 3 V, as shown in figure 3.3. It is interesting to realize that the plasmacurrent in the range of 10 kA is driven by toroidal electric field 1 V/m only. Thequasistationary phase is exploited for physical measurements. After the 20− 30 ms,the primary winding of the transformer is set to be short circuited. The plasmacurrent exponentially decays. This is called a soft termination of discharge or a“soft landing”.
3.2.2 Electron density, gas filling
Before the working gas (hydrogen) is injected into the vacuum vessel, it is purified bypassing through a heated nickel tube as schematically shown in figure 3.4. A thinnickel finger is immersed into a reservoir of hydrogen with pressure of about 3atmospheres. It is heated by electric current. For a certain temperature, the fingerwalls become permeable for hydrogen only.
heating voltage
insulator
hydrogen
nickel finger
pressurecylinderwithhydrogen
weld
tokamak
Figure 3.4: Scheme of a nickel finger for purifying hydrogen.

16 CASTOR TOKAMAK AND DIAGNOSTIC TOOLS
The working pressure is ∼ 10 − 20 mPa. The stationary filling continues duringthe whole discharge but it is too slow to compensate losses of charged particles causedby the finite particle confinement time ∼ 1 − 2 ms. These losses are compensatedby an additional injection of hydrogen during the stationary phase of the dischargecontrolled by a piezoelectric valve (“gas puffing”).
The electron density is measured by a microwave interferometer placed on thetop of the North-East port. It is line averaged over a chord coming through thegeometric centre of the vessel, and normalized to show the averaged electron densityin the whole plasma volume. The temporal evolution of the result (line averagedelectron density ne) is shown in figure 3.3, bottom panel. A detailed calculation ofthe central electron density and averaged electron density is given in appendix A-2.
3.2.3 Plasma current
Plasma current is measured by a Rogowski coil [4], enlacing the tokamak chamber.The active area of the coil is perpendicular to the direction of the poloidal magneticfield. The coil is outside the stainless steel chamber, thus it measures not only theplasma current, but also the current through the tokamak liner Iliner. Hence, theplasma current Ipl should be determined as
Ipl = Imeasured − Iliner. (3.1)
At the beginning of the discharge - before breakdown (avalanche phase of thedischarge), the plasma resistivity is infinite, thus the whole current flows throughthe liner, which has resistivity ∼ 10 mΩ:
Iliner =Uloop
Rliner
≈ 10 V
10 · 10−3 Ω= 1 kA. (3.2)
After breakdown, the resistivity of plasma drops. During the quasistationary partof the discharge, the resistivity of plasma is ∼ 0.2 mΩ, Uloop has values of 2 − 3 Vwhile Iliner becomes
Iliner =Uloop
Rliner
≈ 2.5 V
10 · 10−3 Ω= 250 A, (3.3)
which is a negligible value compared to the Ipl ∼ 10 kA. The starting phase of thedischarge is shown in detail in figure 3.3, right panels.
3.2.4 Plasma resistivity, ohmic power
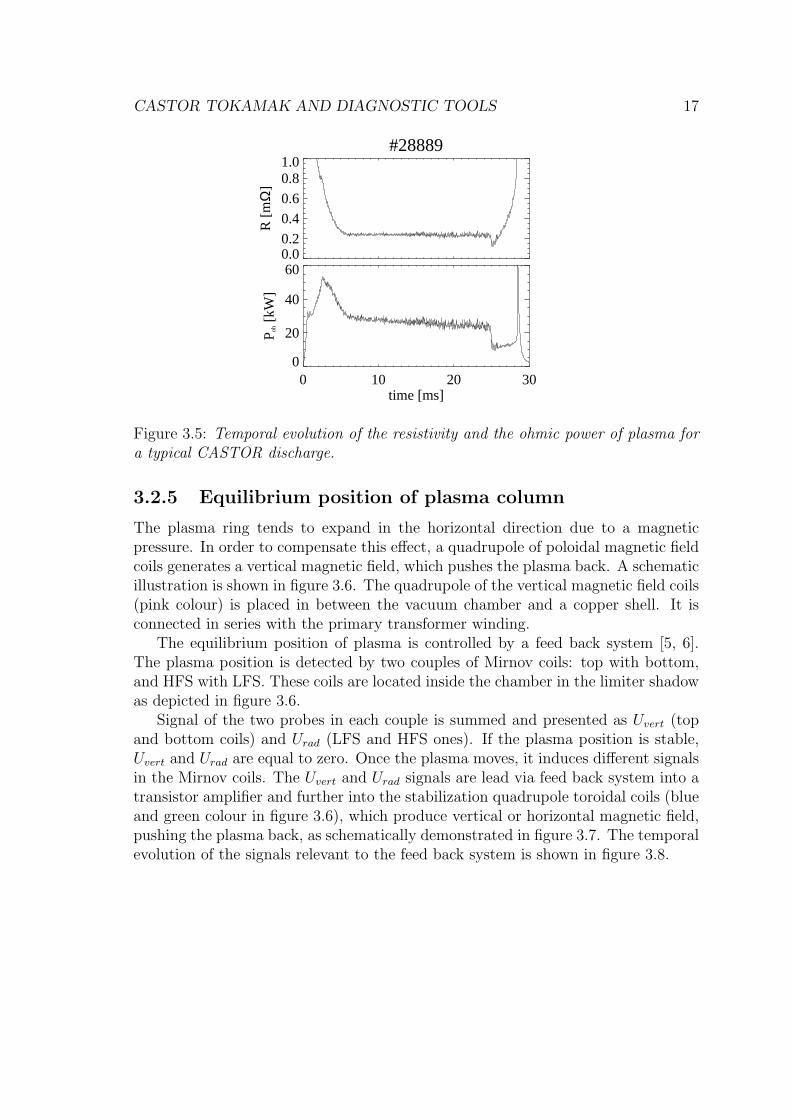
The resistivity of plasma R in the quasistationary part of discharge becomes ∼0.2 mΩ as illustrated in the top panel of figure 3.5. R is calculated as
R =Uloop
Ipl
. (3.4)
The ohmic powerPoh = Uloop · Ipl (3.5)
is between 20 and 30 kW (see figure 3.5, bottom panel).
CASTOR TOKAMAK AND DIAGNOSTIC TOOLS 17
#28889
0.00.2
0.4
0.6
0.81.0
R [
mΩ
]
0 10 20 30time [ms]
0
20
40
60P o
h [kW
]
Figure 3.5: Temporal evolution of the resistivity and the ohmic power of plasma fora typical CASTOR discharge.
3.2.5 Equilibrium position of plasma column
The plasma ring tends to expand in the horizontal direction due to a magneticpressure. In order to compensate this effect, a quadrupole of poloidal magnetic fieldcoils generates a vertical magnetic field, which pushes the plasma back. A schematicillustration is shown in figure 3.6. The quadrupole of the vertical magnetic field coils(pink colour) is placed in between the vacuum chamber and a copper shell. It isconnected in series with the primary transformer winding.
The equilibrium position of plasma is controlled by a feed back system [5, 6].The plasma position is detected by two couples of Mirnov coils: top with bottom,and HFS with LFS. These coils are located inside the chamber in the limiter shadowas depicted in figure 3.6.
Signal of the two probes in each couple is summed and presented as Uvert (topand bottom coils) and Urad (LFS and HFS ones). If the plasma position is stable,Uvert and Urad are equal to zero. Once the plasma moves, it induces different signalsin the Mirnov coils. The Uvert and Urad signals are lead via feed back system into atransistor amplifier and further into the stabilization quadrupole toroidal coils (blueand green colour in figure 3.6), which produce vertical or horizontal magnetic field,pushing the plasma back, as schematically demonstrated in figure 3.7. The temporalevolution of the signals relevant to the feed back system is shown in figure 3.8.

18 CASTOR TOKAMAK AND DIAGNOSTIC TOOLS
core
Bhor
Bhor
Bvert
BhorBvertMirnov coils
for horizontal position
Bvert
LFSHFS
Mirnovcoils
for verticalposition
limiter
IplBtor
quadrupole ofvertical mag.
field coils
feed back coils
centralsolenoid
Bvert
Bhor
coppershell
vacuum chamber
Figure 3.6: Magnetic system of the CASTOR tokamak, poloidal cross-section.

CASTOR TOKAMAK AND DIAGNOSTIC TOOLS 19
Bhor
Bhor
Bvert
BhorBvert
Bvert
LFSHFS
centralsolenoid
Bvert
Bhor
plasmamovement
Florentz
Bhor
Ipl Btor
Figure 3.7: The feed back principle. When the plasma moves up, the coils depicted asBhor generate a horizontal magnetic field, which pushes the plasma back downwardsby the Lorenz force. Similar effect happens in the horizontal direction. The greencircles imply the magnetic field generated by individual windings of Bhor.

20 CASTOR TOKAMAK AND DIAGNOSTIC TOOLS
Figure 3.8: Signals of the feed back system. Urad collects information about the radialposition of plasma and controls the current into the vertical magnetic field coils Ivert
via the feed back system. In a similar way, the Uvert controls the horizontal magneticfield by adjusting Ihor. The beginning and the end of the discharge is denoted by thevertical blue lines. The feed back currents start at about 2 ms in advance in order tocompensate stray magnetic fields generated by toroidal current and primary windingscurrent.

CASTOR TOKAMAK AND DIAGNOSTIC TOOLS 21
3.2.6 Plasma radiation
Plasma radiates in a broad range of wavelengths from microwave through the visiblelight up to hard X-rays (HXR). Measurements of the visible radiation can show thedensity of neutral hydrogen (Hα line intensity) or of the impurities such as carbon(CIII line). The HXR provides information on the behaviour of run-away electrons[7].
To monitor the plasma radiation, several detectors are installed. There are twophotomultipliers equipped by interference filters measuring the intensity of Hα lineat the CASTOR tokamak: one is at the position of the limiter (North-West), andthe other is placed 180 toroidally from the first one (South-East) as depicted infigure 3.9. Both of them are mounted at the top of the vessel. The detector of theCIII line is located from the bottom of the North-Eastern port. The HXR detectoris a photomultiplier with a NaI(Tl) scintillator located at the toroidal position ofthe limiter (North-West), from the top, two meters above the tokamak vessel.
HXR detector,
H limiter (top),gas pufing
(bottom)
a
Btor
Bpol
North
South
limiter
H chamber(top)a
transformercore
diagnosticports
Biasingelectrode (top),CIII detector(bottom)
Figure 3.9: Layout of the detectors of plasma radiation, top view. The HXR andthe Hα line detector are located at the North-West port from the top, the second Hα
line detector is located in the South-East port from the top. The CIII line detectoris located from the bottom of North-Eastern port.
The Hα line is the first of the Balmer series for neutral hydrogen, the transitionfrom n = 3 to n = 2 where n is the principal quantum number. The wavelength ofthe Hα line is 656.28 nm, which falls into the red part of the visible spectrum. Theintensity of the Hα line can be expressed as
IHα=
1
4πn3A32 [photons · s−1 · m−3 · sr, m−3, s−1] (3.6)
where A32 is the probability of transition between the states 3 → 2 and n3 is thedensity of the atoms excited to the state n = 3.

22 CASTOR TOKAMAK AND DIAGNOSTIC TOOLS
Figure 3.10: Plasma radiation. Left panels: Temporal evolution of electron densityne, Hα line emission at the limiter position, Hα line emission on the opposite sidetoroidally from the limiter, CIII line emission and HXR signal. The vertical blue linemarks the end of the discharge, when the primary circuit is shorted. Right panel top:The Hα line intensity at the limiter position with emphasized scale shows periodicalincreasing of intensity corresponding to the gas puffing. Right bottom panel: Plasmadensity during the start-up phase of the discharge (black) with the Hα chamber lineintensity. The time when the Hα reaches its maximum is marked by a vertical blueline. It corresponds to the half-ionization of the plasma, i.e., half of the maximumof the electron density.
The Hα line detectors give an information about the amount of atomic hydrogen.The temporal evolution of their signals are shown in figure 3.10, second and thirdpanel from the top, left. The Hα chamber detector is looking directly into thechamber, thus it can see only neutrals knocked out from the vessel wall (recycling)or from the surface of probe inserted at the same toroidal position. The Hα limiterdetector is located above the gas-puffing valve, which is installed in the bottom partof the same port. We can clearly observe periodical increasing of the Hα intensity inthis detector signal as emphasized in figure 3.10, the top right panel, by enlarging thescale. The pattern is not observable in the Hα chamber signal, because the neutralgas ionizes close to the region of gas injection and it does not reach the place visible
CASTOR TOKAMAK AND DIAGNOSTIC TOOLS 23
by the Hα chamber detector.The full ionization of the working gas as well as the maxwellization of plasma,
takes place during a thermal ionization phase of the discharge (TIP) [8]. Fromthe experimental point of view, the TIP starts when a measurable value of the Hα
line intensity and the electron density can be observed. It ends when the electrondensity reaches its maximal value, i.e., at the beginning of the quasistationary phaseof discharge. The maximum of the Hα intensity corresponds to the ionization of 50%of the working gas (half of the ne), as shown in figure 3.10 in the right bottom paneland demonstrated in [8].
The CIII line (λ = 464.7 nm) is emitted by twice ionized carbon atom C2+. Themain source of carbon impurities are the walls, eventually the biasing electrode,immersed into the plasma from the top just opposite to the CIII detector. A typicaltemporal evolution of the CIII detector signal is shown in figure 3.10.
The HXR detector collects radiation produced mainly by interaction of run-awayelectrons [9] with the limiter. The run-away electrons are developed from the highenergy part (> 60 keV) of the velocity distribution function. The cross section of thecoulomb collisions decreases with rising velocity, thus the fast electrons are acceler-ated by Etor. The run-away electrons are generated during the avalanche phase ofthe discharge, i.e. before the electron density starts to increase [8]. Typically after∼ 15 ms, they start leaving the confinement region and they hit the limiter, mostlyat the LFS close to the mid-plane. Temporal evolution of the HXR signal is shownin figure 3.10. Generation of run-away electrons depends also on plasma density:for low density discharges, the amount of run-aways is higher, for very low densities,they can carry a significant fraction of the plasma current, and consequently also asignificant fraction of the ohmic energy.
3.2.7 Safety factor q
Magnetic field in tokamak is not purely toroidal as it has a helical shape. The strongtoroidal current adds a poloidal component to the magnetic field. Thus, a particularmagnetic field line does not come into the same poloidal position after one toroidalturn, but after several of them, after it covers a toroidal angle ∆ϕ. The helicity oftokamak magnetic field can be accurately described by defining a safety factor q as
q =∆ϕ
2π. (3.7)
If q is irrational, one magnetic field line covers the whole magnetic surface and anyfluctuation can spread quickly and homogeneously. On the contrary, if q is a smallrational or even a natural number, individual parts of the magnetic surface do notcommunicate and instabilities like magnetic islands can arise.
The safety factor depends on the geometry of the machine and it varies alongthe minor radius. For large aspect ratio tokamaks (ǫ = R/a) with circular poloidalcross-section (as in the case of CASTOR), q can be written as [4]
q(r) =r
R
Btor
Bpol(r)(3.8)

24 CASTOR TOKAMAK AND DIAGNOSTIC TOOLS
where r and R are the minor and major radii, while Btor and Bpol are the toroidaland poloidal magnetic fields. Bpol can be expressed as
Bpol(r) =µ0
2π
Ipl(r)
r=
µ0
2π
Ipl(a)
r
1 −(
1 − r2
a2
)p+1
(3.9)
where Ipl is the plasma current which is driven within the radius r. Substituting(3.9) into (3.8), q(r) can be written as
q(r) = q(a)r2/a2
1 − (1 − r2/a2)p+1(3.10)
where q(a) is the edge safety factor:
q(a) =2π
µ0
a2
R
Btor
Ipl(a). (3.11)
A radial profile of the normalized safety factor q(r)/q(a) is shown in figure 3.11.
Figure 3.11: Radial profile of the normalized safety factor. The vertical blue lineindicates the limiter position.
For the edge of CASTOR tokamak (a = 85 mm), we can write
q(a) = 90.3 · Btor
Ipl
[T, kA]. (3.12)
This is true in an ideal case when the plasma column is centralized with the poloidalcircumference a = 85 mm. If the plasma is shifted, the constant in the formula (3.12)has to be modified.
Temporal evolution of q(a) during a typical discharge is shown in figure 3.12.

CASTOR TOKAMAK AND DIAGNOSTIC TOOLS 25
Figure 3.12: Temporal evolution of the safety factor q(a) (bottom panel). In the toppanel, the toroidal magnetic field Btor is shown. The discharge is depicted by theplasma current Ipl (red line). The calculation was performed for a = 78 mm.
3.2.8 Determination of electron temperature and density
Electron temperature
The electron temperature profile Te(r) is used in many calculations but not routinelymeasured at the CASTOR tokamak. Experimental measurements were performedat the plasma edge only, by swept Langmuir probes [10]. The resulting profiles arepresented in section 4.3.5.
An estimation of the central electron temperature Te(0) can be obtained fromthe following considerations: The current density of plasma is
j = E · σ (3.13)
where σ is the specific conductivity of plasma given by
σ(r) = 1.544 · 103 · Te(r)3/2
Zeff
, [Ω−1m−1, eV] (3.14)
and the electric field E is assumed constant in the poloidal cross-section:
E =Uloop
2πR. (3.15)
Plasma current is obtained by integrating current density over the plasma column:
Ipl =
a∫
0
E · σ(r)2πrdr. (3.16)

26 CASTOR TOKAMAK AND DIAGNOSTIC TOOLS
Using (3.14) and (3.15) in (3.16) we can write
Ipl
Uloop
· 2πR · Zeff
1.544 · 103=
a∫
0
Te(r)3/22πrdr. (3.17)
For the electron temperature, we assume a polynomial profile
Te(r) = Te(0)
(
1 − r2
a2
)α
(3.18)
where a is the minor radius and Te(0) is the electron temperature in the centre ofthe plasma column. We assume α = 2, thus the integral on the right side of equation(3.17) can be calculated as
a∫
0
Te(0)3/2
(
1 − r2
a2
)3
2πrdr = 2π · Te(0)3/2 · a2
8. (3.19)
Substituting (3.19) into (3.17) gives us the formula for the central electron temper-ature
Te(0) =
(
R
a2
8 · Zeff
1.544 · 103
)2/3
·(
Ipl
Uloop
)2/3
. (3.20)
For the CASTOR tokamak geometry with a = 78 mm (plasma shift is 7 mm down-wards, see section 4.3.1):
Te(0) = 89.8 ·(
Ipl [kA]
Uloop
)2/3
≈ 230 eV. (3.21)
The effective ion charge is assumed as Zeff = 2.5. The result is over-estimated incomparison to previous evaluations from Hα measurements (Te ≈ 150 − 200 eV)[11]. The difference may be caused by neglecting energy losses in the presentedcalculation.
The temporal evolution of Te(0) is shown in figure 3.13 in the top panel.
Electron density
The line averaged density is measured by a microwave interferometer, its temporalevolution during a typical discharge is shown in figure 3.3. Assuming parabolicdensity profile (A-21), we can express the relation between the measured ne meas
and the central electron density ne(0) as
ne(0) =3
2ne meas. (3.22)
Detailed calculation is given in appendix A-2.

CASTOR TOKAMAK AND DIAGNOSTIC TOOLS 27
#28889
0
100
200
300
Te(0
) [e
V]
0 10 20 30time [s]
0.0
0.1
0.2
0.3τ e
[ms]
Figure 3.13: Temporal evolution of the central electron temperature Te(0) (top panel)and of the energy confinement time τe (bottom panel) for a typical CASTOR dis-charge.
3.2.9 Electron confinement time
The electron confinement time τe can be estimated as the ratio of the energy storedin the electron component of the plasma Qe and of the ohmic power Poh:
τe =Qe
Poh
. (3.23)
The total energy stored in the electron component of the plasma can be obtainedfrom
Qe =3
2〈Te(r)ne(r)〉 · Vtor Te, ne, Vtor [J, m−3, m3] (3.24)
where Vtor = πa2 · 2πR is the plasma volume and 〈Te(r)ne(r)〉 is the product ofelectron temperature and density
〈Te(r)ne(r)〉 =1
4Te(0) · ne(0) (3.25)
as shown in appendix A-2. Introducing (3.25) into (3.24), we obtain
Qe =3
8Vtor · Te(0) · ne(0). (3.26)
Finally, the energy confinement time τe derived from equation (3.23) by substitutingequation (3.26) and (3.5) (page 16), can be written as
τe =3
8Vtor
Te(0) · ne(0)
Uloop · Ipl
≈ 0.25 ms Te, Ipl [J, kA]. (3.27)
Temporal evolution obtained from experimental data is shown in figure 3.13, bottompanel.
This was a rough estimation of the τe. A proper calculation requires to includethe radiative power loss and the energy stored in ion component, as is described in[12] and [13]. Similar results (τe ≃ 0.3 ms) were obtained from measurements ofplasma diamagnetism [14].
28 CASTOR TOKAMAK AND DIAGNOSTIC TOOLS
3.3 Diagnostics
Tokamak CASTOR is equipped by a set of basic diagnostics for measurements of themain plasma parameters such as the loop voltage, the plasma current, and the aver-aged plasma density as well as the plasma radiation and magnetic properties. Themain emphasis of the physical programme of the facility is on measurements of theedge plasma. For this purpose, several arrays with high space and temporal resolu-tion were constructed and several advanced probes were developed. In this section,we focus on the most important diagnostic tools for the turbulence measurements,used in this work.
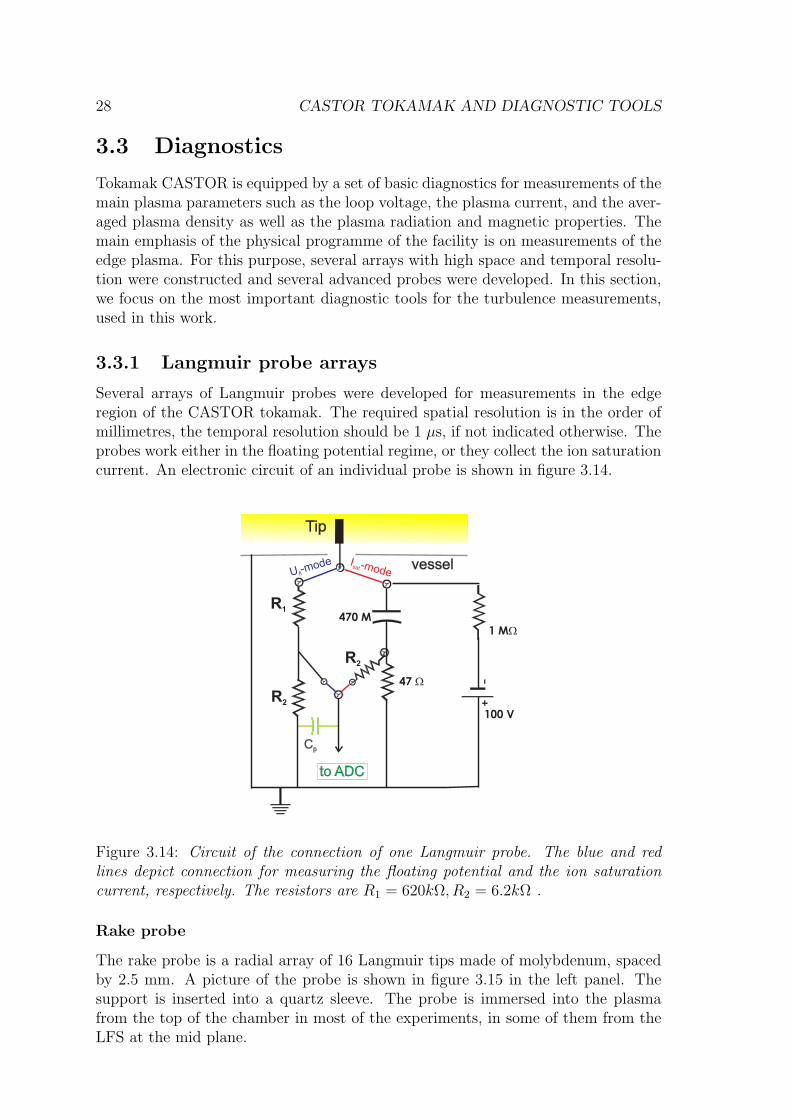
3.3.1 Langmuir probe arrays
Several arrays of Langmuir probes were developed for measurements in the edgeregion of the CASTOR tokamak. The required spatial resolution is in the order ofmillimetres, the temporal resolution should be 1 µs, if not indicated otherwise. Theprobes work either in the floating potential regime, or they collect the ion saturationcurrent. An electronic circuit of an individual probe is shown in figure 3.14.
vessel
Cp
to ADC
Tip
U -modefl
I -modesat
R1
R2
R2
470 M
1 MW
100 V
47 W
Figure 3.14: Circuit of the connection of one Langmuir probe. The blue and redlines depict connection for measuring the floating potential and the ion saturationcurrent, respectively. The resistors are R1 = 620kΩ, R2 = 6.2kΩ .
Rake probe
The rake probe is a radial array of 16 Langmuir tips made of molybdenum, spacedby 2.5 mm. A picture of the probe is shown in figure 3.15 in the left panel. Thesupport is inserted into a quartz sleeve. The probe is immersed into the plasmafrom the top of the chamber in most of the experiments, in some of them from theLFS at the mid plane.

CASTOR TOKAMAK AND DIAGNOSTIC TOOLS 29
Figure 3.15: Arrays of Langmuir probes. Left panel: the single rake probe, centralpanel: the double rake probe. Right panel: the 2D probe array; the bottom part showsthe Langmuir probe tips, the blue top part contains connectors for the conductorsleading the signal out from the vacuum vessel. This part is in the diagnostic port.
Double rake probe
The double rake probe is a radial array of 24 Langmuir tips (two rows each of 12tips). They are made of molybdenum, spaced by 2.5 mm in the radial as well as inthe poloidal direction, as shown in figure 3.15 in the middle panel. The support ismade of machinable ceramics (boron-nitride). The probe is immersed into plasmafrom the top of the chamber, facing the upstream with respect to the magnetic fieldlines (and the plasma current).
2D probe array
The 2D probe array [15] is a two-dimensional matrix of 64 graphite tips (8×8) withspacing of 6 mm in the poloidal direction and 4.5 mm in the radial direction as shownin figure 3.15, right panel. The tips are held by a support made of boron-nitride.
The 2D matrix is inserted into the plasma from the top of the chamber, orientedeither upstream, or downstream with respect to the magnetic field lines.
Poloidal ring
The poloidal ring [16, 18] consists of 124 Langmuir probes made of molybdenum,located on a circumference of a stainless steel ring with the radius of 58 mm, asshown in figure 3.16. The probes have the length of 2.5 mm and the diameter of0.6 mm, their poloidal distance is 3 mm. This ring plays the role of an additionallimiter.
30 CASTOR TOKAMAK AND DIAGNOSTIC TOOLS
Figure 3.16: Poloidal ring.
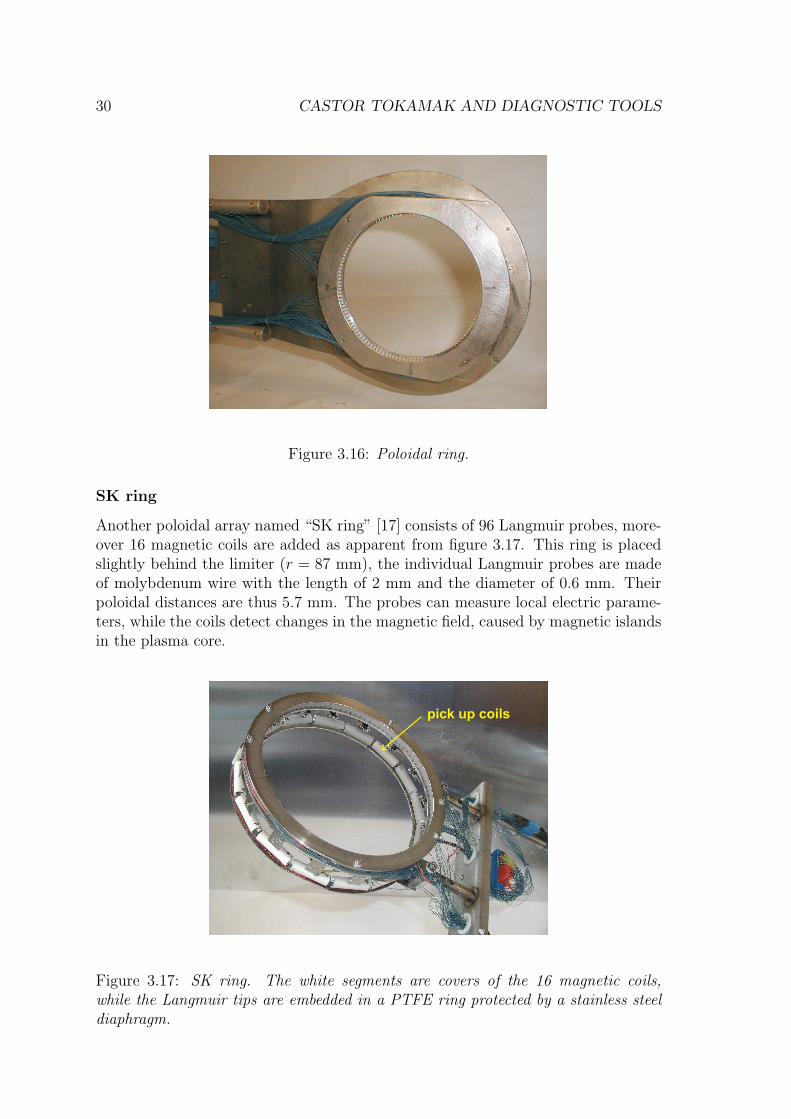
SK ring
Another poloidal array named “SK ring” [17] consists of 96 Langmuir probes, more-over 16 magnetic coils are added as apparent from figure 3.17. This ring is placedslightly behind the limiter (r = 87 mm), the individual Langmuir probes are madeof molybdenum wire with the length of 2 mm and the diameter of 0.6 mm. Theirpoloidal distances are thus 5.7 mm. The probes can measure local electric parame-ters, while the coils detect changes in the magnetic field, caused by magnetic islandsin the plasma core.
pick up coils
Figure 3.17: SK ring. The white segments are covers of the 16 magnetic coils,while the Langmuir tips are embedded in a PTFE ring protected by a stainless steeldiaphragm.
CASTOR TOKAMAK AND DIAGNOSTIC TOOLS 31
3.3.2 Advanced probes
Ball-pen probe
The Ball-pen probe is a novel type of probe, which was developed in IPP Pragueto measure directly the plasma potential [19, 20]. This probe, which is based onthe Katsumata probe concept [21], consists of a movable collector with a conical tiphoused inside an insulating boron-nitride shielding, as shown in figure 11.1. Thecollector can be moved radially, and adjusted in order to collect equal fluxes of ionsand electrons, due to the shadowing effect of the shielding. When such conditionis reached, and the collector is floating, the collector potential will be equal to theplasma potential.
Another application of the probe is to study the spatial decay of the fluctuationpower spectrum inside the shaft for different collector positions. From these data, theplasma diffusion coefficient is derived. Part III is devoted to the detailed descriptionof the method as well as of the probe itself.
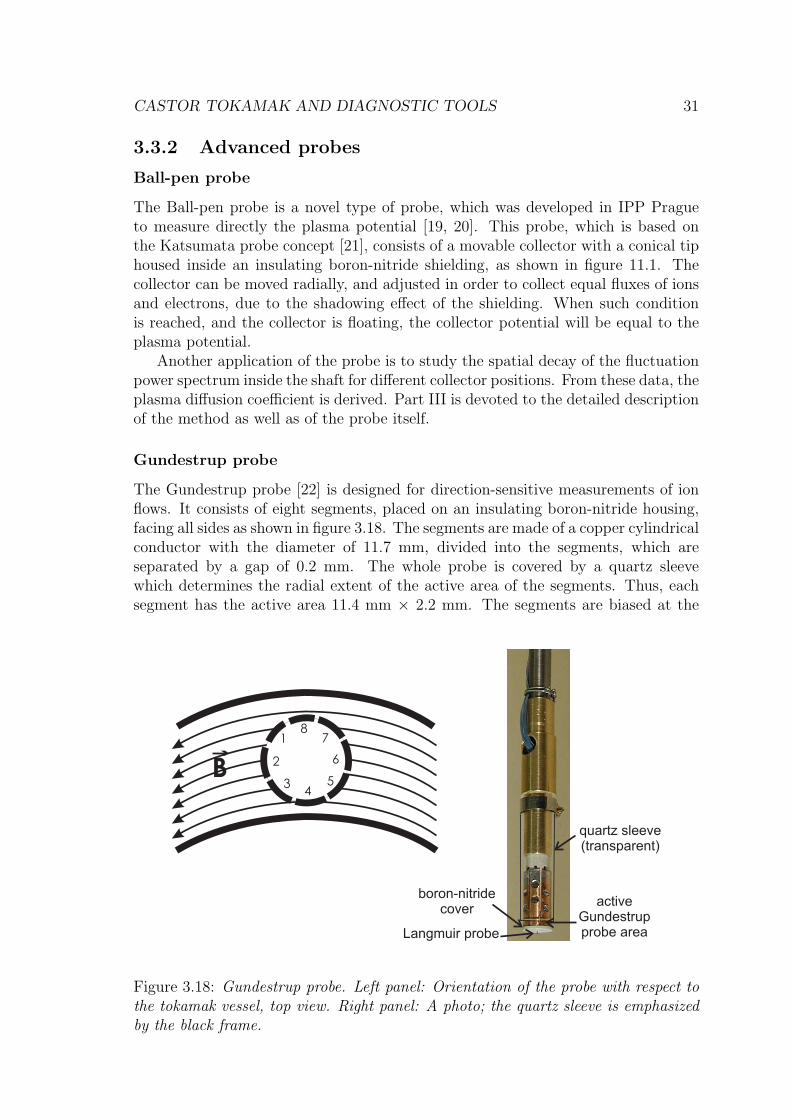
Gundestrup probe
The Gundestrup probe [22] is designed for direction-sensitive measurements of ionflows. It consists of eight segments, placed on an insulating boron-nitride housing,facing all sides as shown in figure 3.18. The segments are made of a copper cylindricalconductor with the diameter of 11.7 mm, divided into the segments, which areseparated by a gap of 0.2 mm. The whole probe is covered by a quartz sleevewhich determines the radial extent of the active area of the segments. Thus, eachsegment has the active area 11.4 mm × 2.2 mm. The segments are biased at the
1
2
34
5
6
78
B
quartz sleeve(transparent)
activeGundestrupprobe area
boron-nitridecover
Langmuir probe
Figure 3.18: Gundestrup probe. Left panel: Orientation of the probe with respect tothe tokamak vessel, top view. Right panel: A photo; the quartz sleeve is emphasizedby the black frame.
32 CASTOR TOKAMAK AND DIAGNOSTIC TOOLS
ion saturation current. Moreover, a single Langmuir probe (1.25 mm length and0.6 mm diameter) is located on the top of the Gundestrup probe, insulated by aboron-nitride cover (1.8 mm thick). The Langmuir probe is swept by a triangularvoltage in order to get the voltage current characteristics to determine the localelectron temperature and density in front of the Gundestrup probe.
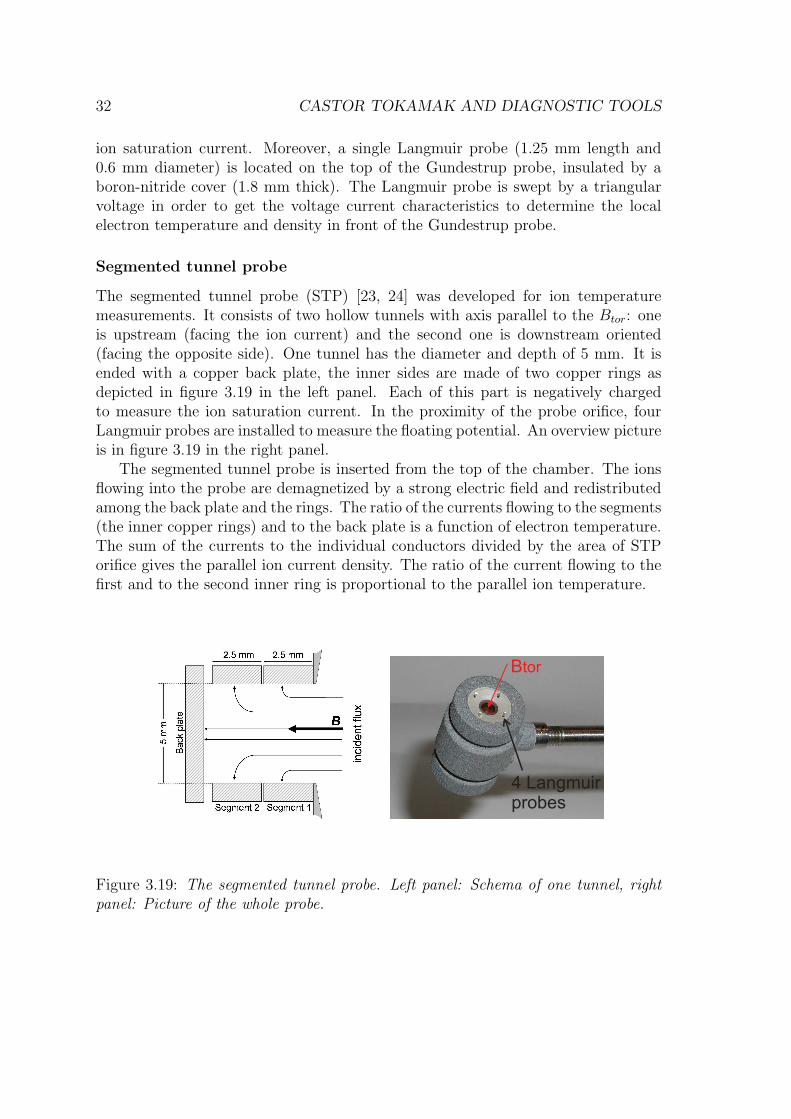
Segmented tunnel probe
The segmented tunnel probe (STP) [23, 24] was developed for ion temperaturemeasurements. It consists of two hollow tunnels with axis parallel to the Btor: oneis upstream (facing the ion current) and the second one is downstream oriented(facing the opposite side). One tunnel has the diameter and depth of 5 mm. It isended with a copper back plate, the inner sides are made of two copper rings asdepicted in figure 3.19 in the left panel. Each of this part is negatively chargedto measure the ion saturation current. In the proximity of the probe orifice, fourLangmuir probes are installed to measure the floating potential. An overview pictureis in figure 3.19 in the right panel.
The segmented tunnel probe is inserted from the top of the chamber. The ionsflowing into the probe are demagnetized by a strong electric field and redistributedamong the back plate and the rings. The ratio of the currents flowing to the segments(the inner copper rings) and to the back plate is a function of electron temperature.The sum of the currents to the individual conductors divided by the area of STPorifice gives the parallel ion current density. The ratio of the current flowing to thefirst and to the second inner ring is proportional to the parallel ion temperature.
Btor
4 Langmuirprobes
Figure 3.19: The segmented tunnel probe. Left panel: Schema of one tunnel, rightpanel: Picture of the whole probe.

Chapter 4
Edge plasma
In this chapter, we give a brief description of a basic informationabout two kinds of geometry of Scrape Off Layer in tokamaks andabout transport in this region. The specific geometry of the CAS-TOR edge plasma is described and the most important parameterscharacterizing the CASTOR edge plasma are shown.
33

34 EDGE PLASMA
The concept of magnetic confinement is to keep plasma inside a vacuum chamberwith a help of a strong magnetic field. In reality, the plasma will always escapefrom the trap due to various drifts, diffusion processes and turbulence. The plasmacolumn will decay to the vessel inner walls and the particles of the plasma willinteract with the wall.
The plasma-surface interaction (PSI) is an important issue in the magnetic fusionresearch since it is responsible for:
1. recycling of the fuel (hydrogen) atoms,
2. bringing impurities into the plasma,
3. erosion of the inner vessel walls,
4. cooling the edge plasma.
As noted in section 2.2.1, the helical magnetic field creates concentric mag-netic flux surfaces (see figure 2.6). The surfaces which are not connected with anysolid material are called closed while the magnetic surfaces which come throughsolid surfaces (wall, limiter) are called open. The Last Closed (magnetic) Flux Sur-face (LCFS) is important in the edge plasma physics terminology: it divides theplasma boundary into the confinement region with closed flux surfaces (inwards ofthe LCFS), and the Scrape Off Layer (SOL) with open flux surfaces.
4.1 Scrape Off Layer
The shape of the edge plasma region is different for different magnetic confinementdevices. In general we distinguish two main types: the limiter and the divertorconfiguration. The limiter as well as the divertor act as a plasma sink.
4.1.1 Limiter configuration
The simplest configuration is made by using some kind of limiter. Inserting a limiterinto the chamber enables to determine the shape of the plasma and the connectionlength in the SOL and in the limiter shadow. Using a limiter also enables to influencethe plasma-wall interaction by choosing a suitable material. For example, in the caseof the CASTOR tokamak, the limiter is made of molybdenum. If the limiter wasnot there, the plasma would pollute itself by massive sputtering the iron walls.
The most often used shapes of limiters are the poloidal or toroidal. A poloidallimiter is a metal annulus placed in one or more poloidal positions. It is usedin devices with circular cross-sections such as the CASTOR tokamak or the FTUtokamak. A typical distance, which a particle has to travel in the SOL before hittingthe limiter, is termed the connection length and it is equal to
L ≈ πR
nlim
(4.1)
where nlim is the number of poloidal limiters. The distance in between two solidsurfaces of the limiter(s) is 2L. A picture of a poloidal limiter of the FTU tokamakis shown in figure 4.1.

EDGE PLASMA 35
Figure 4.1: Poloidal limiter of the FTU tokamak pointed up by red lines.
A toroidal limiter is a rail, covered by protecting plates, inserted into the plasmain the toroidal direction, usually from the bottom of the vessel, as in the tokamaksTore Supra or TEXTOR. The toroidal limiter of Tore Supra is shown in figure 4.2.The connection length L is longer with this configuration, as the particles need togo around the chamber several times before hitting the solid surface. L depends onthe pitch angle via the safety factor q and we can be expressed it as
L = πRq. (4.2)
Any object inserted into plasma can play the role of a limiter, if it is largeenough to close the magnetic field lines on itself. Another type of limiter is so-calledwall-limiter, means that the plasma touches directly the walls. Advantage of thisconfiguration is the distribution of power to a large surface.
Figure 4.2: Toroidal limiter of the Tore Supra tokamak placed at the bottom of thechamber.

36 EDGE PLASMA
4.1.2 Divertor configuration
The characteristic feature of the arrangement using a divertor configuration is thatthe LCFS does not touch any material surface as in the case of limiter.
The divertor configuration is schematically shown in figure 4.3. It is formedby a toroidal conductor carrying a current Id, parallel with the plasma current Ip.These two currents create an eight-shaped magnetic surfaces. In between these twoconductors, a magnetic X-point exists, it is the place where the poloidal magneticfield is equal to zero. The Last Closed Flux Surface passing through this point istermed separatrix. The mostly used configuration shown in figure 4.3 is called apoloidal divertor and corresponds to the toroidal limiter.
majorradius
Ip
Id strike point
legs
X-point
separatrix
core
vacuumvessel
divertor plates
divertor
privateregion
Figure 4.3: Principle of divertor.
As the confined plasma is separated from solid surfaces (which play role of thesource or impurities) and therefore remains purer, the divertor configuration is betterthan the limiter one. Divertor configuration permits us to reach so-called plasmadetachment [25, 39], moreover, the strong magnetic shear around X-point is a veryefficient ingredient for transition into H-mode (improved confinement) [25, 39].
A construction of a divertor is more difficult than the construction of a limitersince it requires an external poloidal coil conducting high current (comparable withthe plasma current). This configuration is therefore used in the European facilitiessuch as JET, COMPASS, ASDEX, TCV and MAST, and it is designed also for thetokamak ITER. For large devices with high energy stored in plasma, the geometryof divertor tiles must be done in a special way, in order to maximize surface touchedby plasma and thus to minimize the energy flux to divertor plates. A detail of theITER divertor is shown in the figure 4.4.

EDGE PLASMA 37
Dome
Vertical targets
Annular flow vertical target option
Cassettebody
Inner cassetteto vessel
attachment
V-shapeddivertor
slot
Pumping channel
OuterCassette to
VesselAttachment
Figure 4.4: Scheme of a divertor designed for ITER.
4.1.3 Geometry of SOL
The SOL can be unfolded and straightened into an orthogonal block as shown infigure 4.5. The shape is bounded by:
• Opposite solid surfaces. These can be two surfaces of poloidal limiters ortwo sides of a single one, or two sides of the flux tube touching the poloidallimiter or entering the divertor. The surface is usually not perpendicular tothe magnetic field lines. In this case, we need to take the orthogonal projectionof the surface. The distance between the two solid surfaces is 2L.
• The LCFS or separatrix on the top of the block, and chamber wall at thebottom.
• The last two sides can be defined in an arbitrary way. One can for exampletake w = 1 m to have a “unit” portion of SOL or w equal to one tile extent.They are always perpendicular to both the B and the radial direction. Wewill use this boundary as two sides of one cut, in order to include the wholeplasma volume in our cube.
For a tokamak with circular poloidal cross-section, single poloidal limiter and cen-tralized plasma column, the dimensions of the block are: w = 2πa, 2L, and thewidth of the limiter, as depicted in figure 4.6.
4.2 Transport in Scrape Off Layer
4.2.1 Characteristic time in SOL
The projection of the particle velocity in the direction of toroidal magnetic field issimilar when compared to the ion sound speed cS. The characteristic particle dwell

38 EDGE PLASMA
2L
w
LCFS (top)
chamber wall(bottom)
Figure 4.5: Scheme of unfolded SOL.
chamber
limiter
major radius R minorradius a
w=2 apL= Rp
Figure 4.6: SOL of a tokamak with one poloidal limiter and a circular cross-section.
time in the SOL is
τSOL =L
cS
. (4.3)
For the tokamak CASTOR in the shadow of limiter, the L = πR. The L ≃ 1.3 msince the major radius R = 0.4 m. The temperature in the SOL is ∼ 10 eV, thusthe cS ≈ 4 · 104 m s−1. The τSOL ≃ 0.03 ms. For JET-sized tokamaks with toroidaldivertor, L = πRq. For the major radius of ∼ 3 m and q = 4, L ≈ 40 m. Thetemperature in the SOL is typically 1− 100 eV, then the cS ≈ 104 − 105 m s−1. TheτSOL ≈ 0.4 − 4 ms.
4.2.2 Diffusion coefficient in SOL
Diffusion across the magnetic field lines is very important for plasma confinement.While the diffusion coefficient in the confined region is an empirical value, not pos-sible to be calculated theoretically, the diffusion in the SOL can be estimated fromsimple principles.
For a rough estimation of the diffusion coefficient in the SOL DSOL⊥ , we can use
the following consideration. In the SOL, the velocity of particles along the magneticfield lines (in the toroidal direction) dominates the velocity in the perpendiculardirection. Thus, the source of particles is the LCFS - the particles are penetratingfrom the confined area. Once they reach the SOL, they leave in the parallel directionto the limiter or the divertor tiles.

EDGE PLASMA 39
The total particle flux coming from the confined area through LCFS is
γ⊥ = −DSOL⊥
dn
dr
∣
∣
∣
∣
∣
LCFS
S (4.4)
where S = 2Lw is the surface of LCFS (see figure 4.5). Defining the characteristiclength of radial density decay λn as
λn ≡ −(
1
n
dn
dr
)−1
, (4.5)
the decrease of the density in the SOL can be expressed as
dn
dr= − n
λn
(4.6)
andγ⊥ = −DSOL
⊥
nLCFS
λn
S. (4.7)
The total particle flux in the parallel direction is
γ‖ = 2w
∞∫
r=LCFS
ncSdr (4.8)
with using Bohm/Chodura sheath criteria [25]. Assuming that the n(r) is exponen-tial
n(r) = nLCFSe−r/λn (4.9)
and the cS(r) is constant, the particle flow (4.7) can be written as
γ‖ = 2w1
2nLCFScSλn. (4.10)
The particle balance says that all the particles coming from the SOL in the perpen-dicular direction (γ⊥) leave to the limiter in the parallel direction (γ‖) due to highervelocity in the parallel direction, thus we can write γ⊥ = γ‖. It gives
DSOL⊥ =
cSλ2n
2L. (4.11)
It is worth noting that the introduced model has certain limitations. Recentresearch shows that the transport is significantly influenced by turbulence. Blobsand ELMs present in the edge plasma can increase the convection and consequentlyraise the transport by order of magnitude. As the turbulence is developed in theinner layers of plasma, the diffusion coefficient is not a local variable anymore, itdepends also on parameters in the confinement area. The model described in theequations (4.4)–(4.11) is thus only a rough approximation.
40 EDGE PLASMA
4.3 CASTOR edge plasma
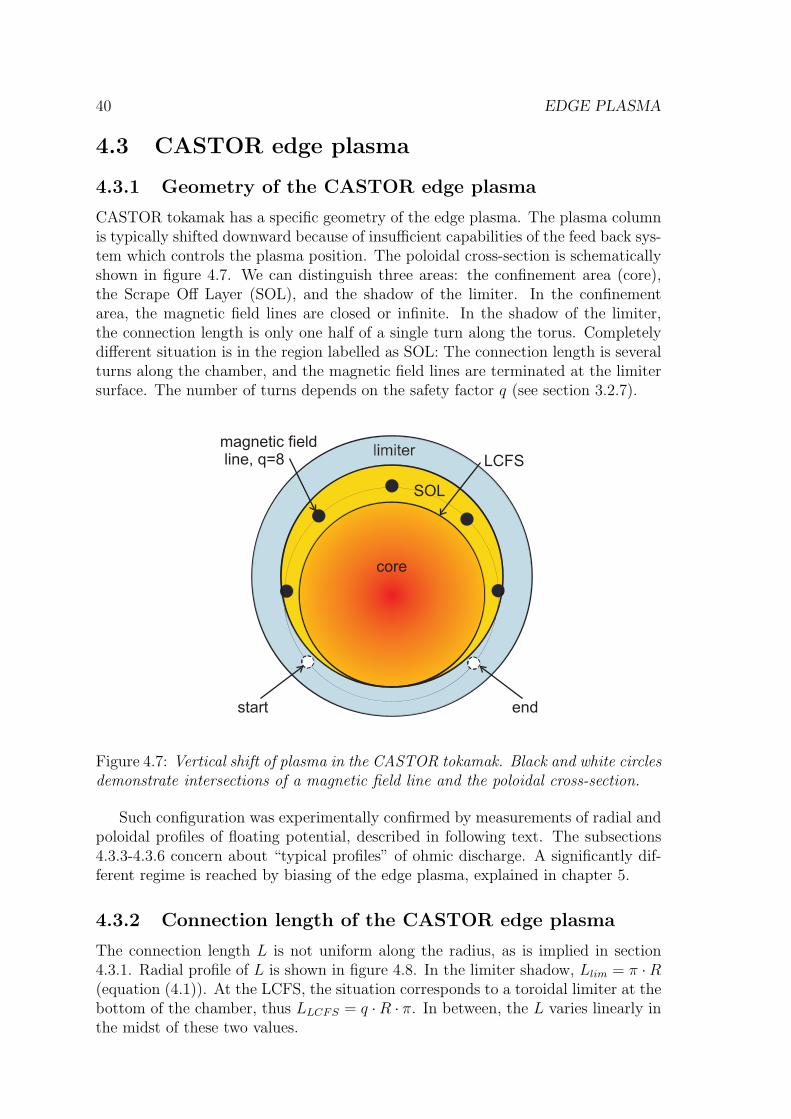
4.3.1 Geometry of the CASTOR edge plasma
CASTOR tokamak has a specific geometry of the edge plasma. The plasma columnis typically shifted downward because of insufficient capabilities of the feed back sys-tem which controls the plasma position. The poloidal cross-section is schematicallyshown in figure 4.7. We can distinguish three areas: the confinement area (core),the Scrape Off Layer (SOL), and the shadow of the limiter. In the confinementarea, the magnetic field lines are closed or infinite. In the shadow of the limiter,the connection length is only one half of a single turn along the torus. Completelydifferent situation is in the region labelled as SOL: The connection length is severalturns along the chamber, and the magnetic field lines are terminated at the limitersurface. The number of turns depends on the safety factor q (see section 3.2.7).
limiter
core
SOL
LCFS
magnetic fieldline, q=8
start end
Figure 4.7: Vertical shift of plasma in the CASTOR tokamak. Black and white circlesdemonstrate intersections of a magnetic field line and the poloidal cross-section.
Such configuration was experimentally confirmed by measurements of radial andpoloidal profiles of floating potential, described in following text. The subsections4.3.3-4.3.6 concern about “typical profiles” of ohmic discharge. A significantly dif-ferent regime is reached by biasing of the edge plasma, explained in chapter 5.
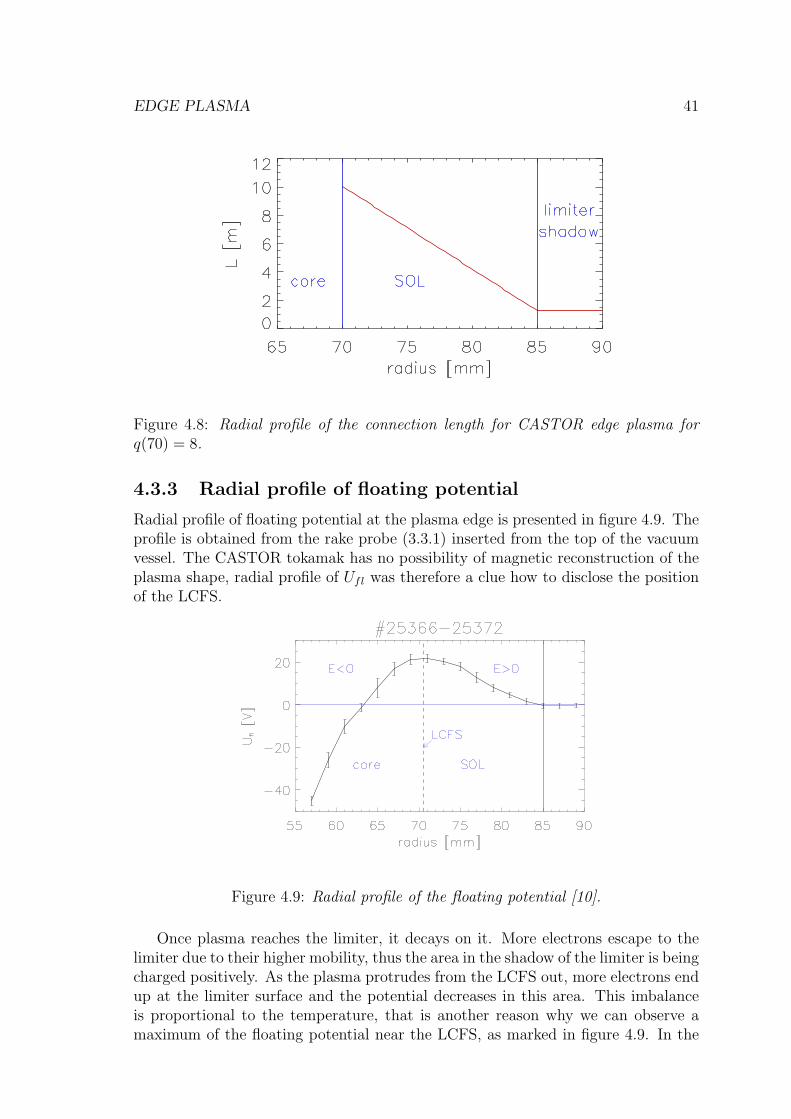
4.3.2 Connection length of the CASTOR edge plasma
The connection length L is not uniform along the radius, as is implied in section4.3.1. Radial profile of L is shown in figure 4.8. In the limiter shadow, Llim = π ·R(equation (4.1)). At the LCFS, the situation corresponds to a toroidal limiter at thebottom of the chamber, thus LLCFS = q ·R · π. In between, the L varies linearly inthe midst of these two values.
EDGE PLASMA 41
Figure 4.8: Radial profile of the connection length for CASTOR edge plasma forq(70) = 8.
4.3.3 Radial profile of floating potential
Radial profile of floating potential at the plasma edge is presented in figure 4.9. Theprofile is obtained from the rake probe (3.3.1) inserted from the top of the vacuumvessel. The CASTOR tokamak has no possibility of magnetic reconstruction of theplasma shape, radial profile of Ufl was therefore a clue how to disclose the positionof the LCFS.
Figure 4.9: Radial profile of the floating potential [10].
Once plasma reaches the limiter, it decays on it. More electrons escape to thelimiter due to their higher mobility, thus the area in the shadow of the limiter is beingcharged positively. As the plasma protrudes from the LCFS out, more electrons endup at the limiter surface and the potential decreases in this area. This imbalanceis proportional to the temperature, that is another reason why we can observe amaximum of the floating potential near the LCFS, as marked in figure 4.9. In the
42 EDGE PLASMA
direction to the core, the floating potential drops and it gets negative values in theplasma bulk. It is caused by ion orbit losses: due to larger Larmor radius, the ionsescape faster.
One more effect contributes to the shape of the radial profile of Ufl, which iscaused by a turbulent process. The Reynolds stress (also termed tilting instability)[26] generates a poloidal velocity shear dvpol/dr, yielding related radial electric field:Erad = Btor × vpol. The direction of this field depends on a trigger mechanism andcan be randomly positive or negative; the shape of the Ufl profile, however, does notqualitatively change. It implies that the ion orbit loss mechanism must dominate theErad profile. Quantifying this mechanism requires complex numerical simulations.
It is obvious from figure 4.9 (and figure 4.7) that in the upper part of the cham-ber, the position of the LCFS does not correspond to the limiter position. Thisdiscrepancy between the measurements with Langmuir probes and the feed backsystem was explained by measurements using Hall sensors: the feed back coils formeasurements of the plasma position are affected by an additional magnetic fieldgenerated by other sources than the plasma current [27].
4.3.4 Poloidal profiles of floating potential and velocity
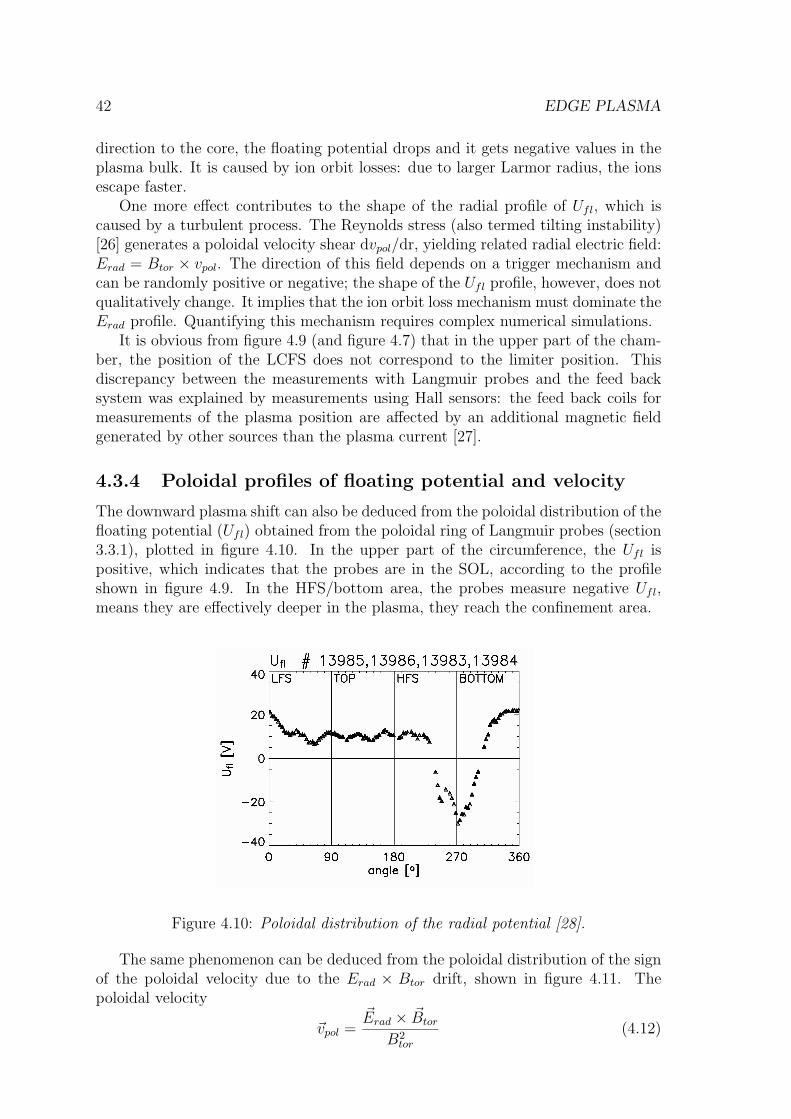
The downward plasma shift can also be deduced from the poloidal distribution of thefloating potential (Ufl) obtained from the poloidal ring of Langmuir probes (section3.3.1), plotted in figure 4.10. In the upper part of the circumference, the Ufl ispositive, which indicates that the probes are in the SOL, according to the profileshown in figure 4.9. In the HFS/bottom area, the probes measure negative Ufl,means they are effectively deeper in the plasma, they reach the confinement area.
Figure 4.10: Poloidal distribution of the radial potential [28].
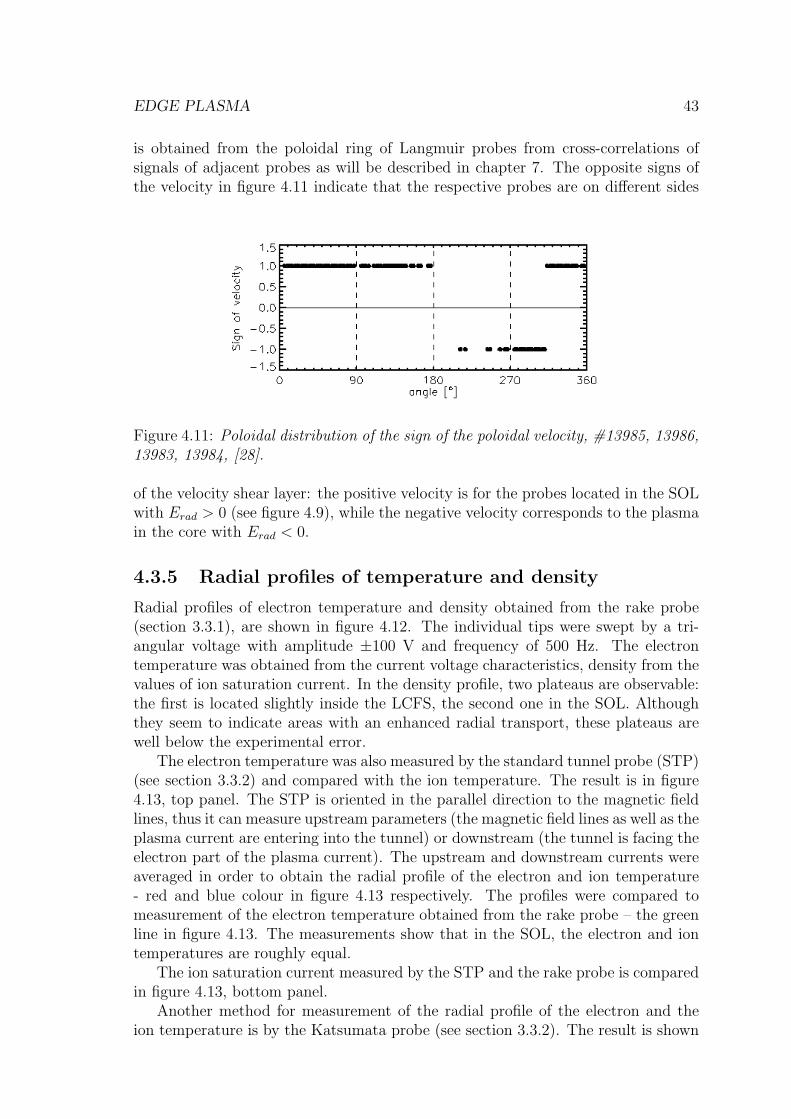
The same phenomenon can be deduced from the poloidal distribution of the signof the poloidal velocity due to the Erad × Btor drift, shown in figure 4.11. Thepoloidal velocity
~vpol =~Erad × ~Btor
B2tor
(4.12)
EDGE PLASMA 43
is obtained from the poloidal ring of Langmuir probes from cross-correlations ofsignals of adjacent probes as will be described in chapter 7. The opposite signs ofthe velocity in figure 4.11 indicate that the respective probes are on different sides
Figure 4.11: Poloidal distribution of the sign of the poloidal velocity, #13985, 13986,13983, 13984, [28].
of the velocity shear layer: the positive velocity is for the probes located in the SOLwith Erad > 0 (see figure 4.9), while the negative velocity corresponds to the plasmain the core with Erad < 0.
4.3.5 Radial profiles of temperature and density
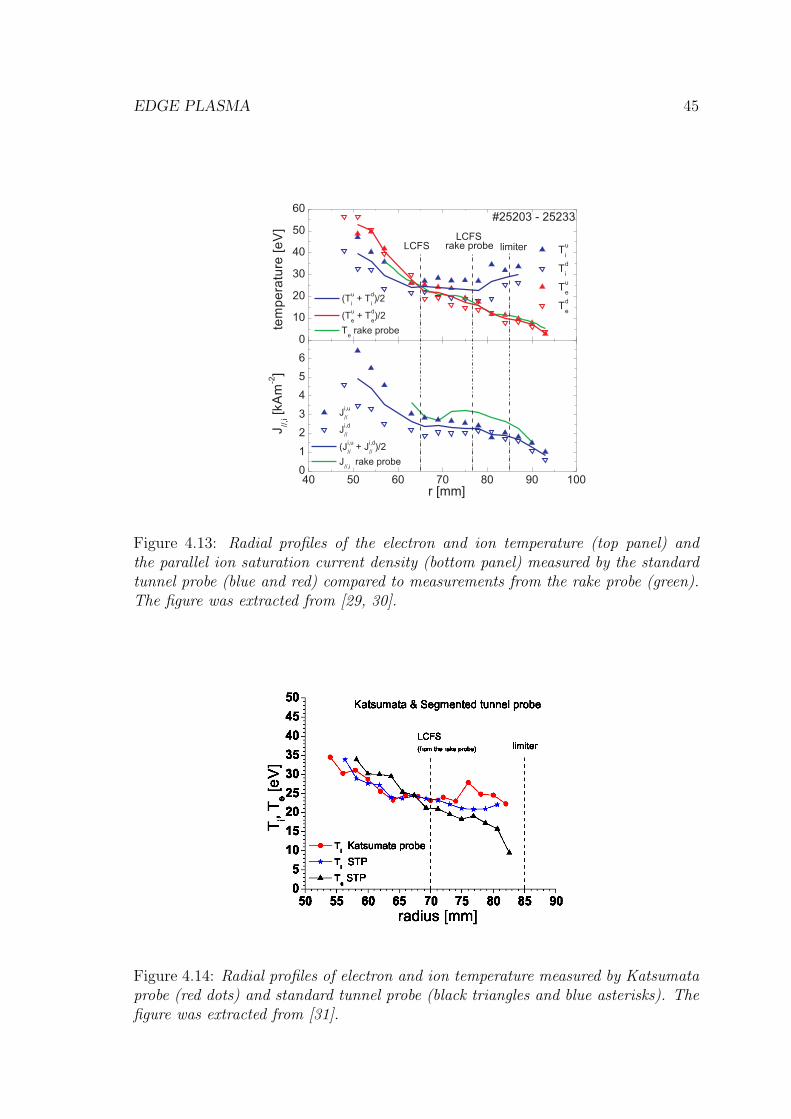
Radial profiles of electron temperature and density obtained from the rake probe(section 3.3.1), are shown in figure 4.12. The individual tips were swept by a tri-angular voltage with amplitude ±100 V and frequency of 500 Hz. The electrontemperature was obtained from the current voltage characteristics, density from thevalues of ion saturation current. In the density profile, two plateaus are observable:the first is located slightly inside the LCFS, the second one in the SOL. Althoughthey seem to indicate areas with an enhanced radial transport, these plateaus arewell below the experimental error.
The electron temperature was also measured by the standard tunnel probe (STP)(see section 3.3.2) and compared with the ion temperature. The result is in figure4.13, top panel. The STP is oriented in the parallel direction to the magnetic fieldlines, thus it can measure upstream parameters (the magnetic field lines as well as theplasma current are entering into the tunnel) or downstream (the tunnel is facing theelectron part of the plasma current). The upstream and downstream currents wereaveraged in order to obtain the radial profile of the electron and ion temperature- red and blue colour in figure 4.13 respectively. The profiles were compared tomeasurement of the electron temperature obtained from the rake probe – the greenline in figure 4.13. The measurements show that in the SOL, the electron and iontemperatures are roughly equal.
The ion saturation current measured by the STP and the rake probe is comparedin figure 4.13, bottom panel.
Another method for measurement of the radial profile of the electron and theion temperature is by the Katsumata probe (see section 3.3.2). The result is shown

44 EDGE PLASMA
Figure 4.12: Radial profiles of temperature (left panel) and density (right panel),#26398-26399 & #26402-26403 measured by Renaud Dejarnac in the CASTORtokamak. The error bars show the standard deviation of fluctuations.
in figure 4.14. It is clear that in the CASTOR tokamak Te ≃ Ti in the confinementregion and in the SOL near LCFS, while in the far SOL (limiter shadow) Ti > Te.This is consistent with many experimental observations summarized in [32].
4.3.6 Diffusion coefficient in the CASTOR SOL
Diffusion coefficient in the CASTOR SOL DSOL⊥ can be derived from formula (4.11):
DSOL⊥ =
cSλ2n
2L.
The ion sound speed is
cS =
√
kB(Te + Ti)
mi
(4.13)
where kB is the Boltzmann constant, Te and Ti are given in eV, and mi is the ionmass. Te ≃ Ti as was shown in figures 4.13 and 4.14, thus the cS can be approximatedas
cS ≈√
2kBTe
mi
. (4.14)
A typical radial profile of cS in the CASTOR tokamak is shown in figure 4.15.To estimate the radial profile of the characteristic length of radial density decay
λn according to the formula 4.5
λn ≡ −(
1
n
dn
dr
)−1
,
the density n(r) has to be fitted by the exponential function (4.9) at page 39. Thefit was performed in two ranges of radii as shown in figure 4.16 by the red lines:around r ≃ 73 mm and r ≃ 85 mm. The derived λn ≃ 3 cm (for r ≃ 73 mm) andλn ≃ 1.5 cm (for r ≃ 85 mm).
Finally, for the connection length L, the profile shown in figure 4.8 is used.
EDGE PLASMA 45
40 50 60 70 80 90 1000
1
2
3
4
5
6
0
10
20
30
40
50
60
r [mm]
J//
,i[k
Am
-2]
Ji,u
//
Ji,d
//
(Ji,u
//+ J
i,d
//)/2
J//,i
rake probe
Tu
i
Td
i
Tu
e
Td
e
#25203 - 25233
rake probeLCFS
limiter
tem
pe
ratu
re[e
V]
(Tu
i+ T
d
i)/2
(Tu
e+ T
d
e)/2
Te
rake probe
LCFS
Figure 4.13: Radial profiles of the electron and ion temperature (top panel) andthe parallel ion saturation current density (bottom panel) measured by the standardtunnel probe (blue and red) compared to measurements from the rake probe (green).The figure was extracted from [29, 30].
Figure 4.14: Radial profiles of electron and ion temperature measured by Katsumataprobe (red dots) and standard tunnel probe (black triangles and blue asterisks). Thefigure was extracted from [31].

46 EDGE PLASMA
Figure 4.15: Radial profile of the ion sound speed cS.
Figure 4.16: Radial profile of the electron density in logarithmic scale with an expo-nential fit in the SOL area according to the formula (4.9) depicted by the red lines.
Using these profiles, the diffusion coefficient in the CASTOR SOL DSOL⊥ is de-
rived in the two above mentioned points: DSOL⊥ ∼ 4 m2/s. This value is in agreement
with the diffusion coefficient calculated from the Bohm’s diffusion [33] and from theBall-pen probe measurements [33, 34]. These articles are in chapters 12 and 13.

Chapter 5
Biasing experiments
For improvement of plasma confinement, regimes with modified pro-files of edge electric field are used. It is usually achieved by imposingan electric field by an electrode immersed into the edge plasma andbiased at a DC voltage with respect to the vacuum vessel. Thischapter describes the method, the improved plasma parameters andshows the biasing electrodes used in the CASTOR tokamak.
47

48 BIASING EXPERIMENTS
Ohmic discharges do not enable to achieve regimes with confinement sufficient for afusion reactor. The fusion power is proportional to the particle confinement time τp
[39], hence we need to increase it by the means of creating transport barriers. Biasingof the edge plasma (called simply biasing) is a way how to improve confinement notonly in tokamaks, but also in other types of fusion devices such as stellarators. Itis used in small-size machines since inserting an electrode into the edge plasma oflarge facilities is not wise: it would not survive due to high temperatures and longdurations of the discharges. Biasing experiments enable us to study the influenceof the velocity shear caused by radial electric field imposed into the edge plasmato the structure of turbulences in this region and consequently the influence of theshear to the plasma confinement. These experiments are of high importance for theCASTOR tokamak since a significant part of the research programme is based onthem.
Typical arrangement of the biasing experiments is shown in figure 5.1. Thebiasing electrode is immersed from the top of the chamber into the confinementregion to the radial position up to 40 mm of the minor radius, and biased at positivevoltage up to +300 V with respect to the limiter. An electric field arises between thelayer at the radial position of the electrode and the LCFS, which is connected withlimiter. This electric field in combination with the strong toroidal magnetic fieldcreates Erad×Btor drift which rotates the plasma. A transport barrier is establishedas will be shown in following sections. Negative biasing does not have a significantinfluence on plasma since the current driven by the electrode is too small (∼ 5 A)to modify the edge plasma [35].
SOL
LCFSbiasingelectrode
Eradcore
VSL
vpol
Ipl Btor
+
+-
Figure 5.1: Position of the biasing electrode, poloidal cross-section. White ring de-picts the limiter. Toroidal magnetic field as well as plasma current are perpendicularto the plane of the picture.

BIASING EXPERIMENTS 49
Biasing electrodes at the CASTOR tokamak
• Massive biasing electrode (standard biasing electrode)
A commonly used electrode is a massive graphite mushroom-shaped electrode,shown in figure 5.2. It is radially thick 0.5 cm in the broadest place, 5 cm longin the poloidal extent and 3 cm in the toroidal one which determines its surfaceto be 15 cm2. A positive voltage of 100−300 V is applied between the electrodeand the tokamak vessel and the current −(10 − 30) A is driven.
Figure 5.2: Massive biasing electrode.
• Segmented biasing electrode
The segmented biasing electrode consists of five metal rings with diameter of16 mm and thickness of 1 mm, radially spaced by 3 mm on a PTFE supportas shown in figure 5.3. Each of the rings can be biased separately with respectto the vacuum vessel or can be left floating or grounded to the vessel. Thiselectrode was used in the first experimental campaign when the relaxationevents were observed (chapter 9).
Figure 5.3: Segmented biasing electrode.

50 BIASING EXPERIMENTS
5.1 Improvement of the global plasma parameters
During the biasing phase of the discharge, global plasma parameters change. Anexample is in figure 5.4. The temporal evolution of the line averaged electron densityne is plotted, showing a clear increase after the beginning of the biasing phase.During the whole discharge, there is a continuous inflow of the working gas intothe chamber which covers the particle loses during the discharge. As the transportbarrier raises during the biasing phase and these loses are reduced, the averageddensity increases. After the end of biasing phase, a significant amount of plasma isexpelled to the walls, and the ne returns to its original values.
Under favourable conditions (the amount of impurities is low, the imposed elec-tric field is high), we can observe a decrease of the Hα line intensity (further simplyHα) which is perceptible shown in figure 5.4. Hα is proportional to recycling of
Figure 5.4: Temporal evolution of main plasma parameters during discharge #23999with the biasing phase between 10 − 15 ms. From top to bottom: averaged plasmadensity ne, intensity of the Hα line emission, voltage and current carried by thebiasing electrode.

BIASING EXPERIMENTS 51
neutral hydrogen atoms knocked from the inner wall of the vacuum vessel. Thedecrease of Hα is another sign of improvement of global confinement. The bottompanels in figure 5.4 show the voltage applied to the biasing electrode with respectto the limiter (third panel) and the current driven by the electrode (bottom panel).
The increase of global particle confinement during the biasing phase of dischargecan be deduced from the temporal evolution of Hα and the line averaged density as[35]
τBp
τOHp
=nB
e
nOHe
· IOHHα
IBHα
(5.1)
where τBp and τOH
p is the particle confinement time during the biasing and the ohmicphase, nB
e and nOHe is the line averaged density during biasing and ohmic phase, and
IBHα
and IOHHα
is the intensity of emission of Hα during the biasing and the ohmic
phase. The temporal evolution of the ratioτBp
τOHp
for the same discharge as in figure
5.4 is plotted in figure 5.5. It is worth emphasizing that the particle confinementtime in some cases increases by the factor of 8. It is a high value in comparisonwith spontaneous L-H transitions in large tokamaks with X-point divertors, where
the ratioτBp
τOHp
raises typically only twice.
Figure 5.5: Temporal evolution of the ratio τBp /τOH
p , shot #23999. The vertical redlines indicate the beginning and the end of the biasing phase, the horizontal blue linedepicts the ratio τB
p /τOHp = 1.
5.2 Radial profiles of Ufl and Erad at the plasma
edge during biasing experiments
During ohmic discharges, the radial profile of the floating potential Ufl reaches itsmaximum near the LCFS [36] and then drops down to negative values towards theplasma centre as shown in figure 5.6, left panel. The Erad (plotted in the right panel)reverses its sign, this level is known as the Velocity Shear Layer (VSL).
When the biasing is on, the radial profile of Ufl changes from a hollow profileto a profile of a mesa (table). The maximum of Ufl is shifted to the position of theelectrode. The value of Ufl dramatically increases and a strong radial electric field

52 BIASING EXPERIMENTS
Figure 5.6: Radial profile of Ufl (left panel) and Erad (right panel): during ohmicregime (triangles) and during biasing of the edge plasma (stars). The biasing elec-trode is at the radial position of 40 mm.
is created as shown in figure 5.6. This radial electric field drives a strong poloidalrotation due to Erad×Btor drift as depicted in figure 5.1. The poloidal motion shearsturbulent structures in the edge plasma and the transport barrier is established.
The transport barrier established by the imposed electric field in the edge plasmadecreases the energy and particle loses. This effect is observable in a radial profile ofthe ion saturation current Isat (which is proportional to the electron density) shownin figure 5.7. During the biasing phase of the discharge, the Isat rises in the innerpart of the plasma, indicating an improvement of particle confinement.
Figure 5.7: Radial profile of Isat: during ohmic regime (triangles) and during biasingof the edge plasma (asterisks). The biasing electrode is at the radial position of40 mm.

Chapter 6
Statistical tools
This chapter gives a brief summary of the statistical methods usedfor evaluation of CASTOR edge plasma turbulences and describesthe ways of calculating them.
53

54 STATISTICAL TOOLS
Plasma turbulence in the CASTOR tokamak is measured mainly by means of Lang-miur probes. The signal contains a high level of noise, which needs to be filteredout. For this purpose, using of sophisticated statistic methods is necessary. Thedata are processed in the IDL programming language (Interactive Data Language).
In this thesis, mostly the turbulence of the floating potential and ion saturationcurrent is investigated. The turbulence part of the signal is obtained by subtractingof the smoothed signal (usually smoothing is done over 600 − 1000 µs). Usingone Langmuir probe only, several types of important information about the plasmaturbulence can be investigated: the moments, auto-correlation functions and powerspectra. Using arrays of probes, radial and poloidal profiles of these parameterscan be obtained. Moreover, space-resolved parameters can be obtained, like thecross-correlation functions, cross-power spectra, coherence, and phase-spectra.
6.1 Single point methods
6.1.1 Probability distribution function
Probability distribution function (PDF) of a random variable x is defined as
P (x) =
x∫
−∞
p(t)dt, (6.1)
and we express the density of probability as
p(x) =dP (x)
dx. (6.2)
The moments of the probability distribution function are defined as
M1 = E[x] =∞∫
−∞p(x)xdx
Mn = E[(x − M1)n] =
∞∫
−∞p(x)(x − M1)
ndx for n > 1,(6.3)
n is so-called order of the respective moment. For our analysis, the most importantmoments are the first four: mean value µ (n = 1), variance σ2 (n = 2), skewness S(n = 3) and kurtosis K (n = 4)1:
µ = E[x(t)] (6.4)
σ2 = E[(x(t) − µ)2] (6.5)
S =1
σ3E[(x(t) − µ)3] (6.6)
K =1
σ4E[(x(t) − µ)4] − 3. (6.7)
Variance (it’s square root is the standard deviation) indicates the variability of thedistribution. Skewness shows the dominating part of the data: the negative value
1For kurtosis, the definition is modified according to (6.7).

STATISTICAL TOOLS 55
of skewness indicates that the left tail of respective PDF is longer that the rightone. The skewness for a normal distribution is equal to zero. Kurtosis indicateshow “peaked” the distribution is. In order to have kurtosis of a normal distributionequal to zero, −3 is added in the definition (6.7). Thus, “peaked” distributions havepositive kurtosis while “flat” ones have negative values of kurtosis.
The IDL language uses the function MOMENT where the moments are definedas:
µ = x =1
N
N−1∑
j=0
xj (6.8)
σ2 =1
N − 1
N−1∑
j=0
(xj − x)2 (6.9)
S =1
N
N−1∑
j=0
(
xj − x√σ2
)3
(6.10)
K =1
N
N−1∑
j=0
(
xj − x√σ2
)4
− 3 (6.11)
where N is the number of elements of the data vector x ≡ (x0, x1, ..., xN).
6.1.2 Auto-correlation
Auto-correlation function is the second moment of the PDF of x(t):
R(τ) = E[x(t)x(t − τ)]. (6.12)
This function describes the agreements of the signal x(t) with itself shifted by a timelag τ . When we subtract the mean value from the analysed signal, we obtain theauto-covariance function
C(τ) = E[(x(t) − µ)(x(t − τ) − µ)]. (6.13)
Thus, we can write C(τ) = R(τ) − µ2.The auto-covariance function is used in a normalized form
ρ(τ) =C(τ)
C(0)(6.14)
termed as the auto-correlation coefficient. This function takes values from −1(anti-correlation) to +1 (perfect correlation) and is often mentioned simply as auto-correlation in the literature, which is also the case of this thesis.
The IDL language uses a function A-CORRELATE
ρ(Lag) = ρ(−Lag) =
N−Lag−1∑
k=0(xk − x)(xk+l − x)
N−1∑
k=0(xk − x)2
(6.15)
where Lag is the time lag τ .
56 STATISTICAL TOOLS
6.1.3 Power spectrum
The power spectrum is defined as the Fourier transform of the auto-correlation func-tion
S(f) =
+∞∫
−∞
R(τ)e−2πifτdτ. (6.16)
If x(t) is real, the S(f) as well as ρ(t) are real even functions. S(f) shows howthe mean square of x(t) is distributed over frequencies. The power spectrum ofthe fluctuating part of the signal indicates the type of turbulence (e.g., diffusionbehaviour if the power spectrum as a function of frequency shows an exponentialdecay) and can also reveal a dominant frequency caused by a physical phenomenonor by a parasitic signal. An example of power spectra from the RFX-mod reversedfield pinch and from the CASTOR tokamak are shown in figure 14.4 in section 14.3and in figure 2 in the article in chapter 12.
For the numerical evaluation, the experiment should be repeated M times. Sincethis is not possible for us, we realize it by dividing the signal x(t) into M slices x
(k)T
with length T (k = 1...M). Then, the power spectrum estimator will be
Sn =1
M
M∑
k=1
|X(k)n |2 (6.17)
where X(k)n is the n-th element of the discrete Fourier transform of the slice k.
6.2 Double point methods
6.2.1 Cross-correlation
The cross-correlation function is defined in a similar way as in (6.12)
Rxy(τ) = E[x(t)y(t − τ)]. (6.18)
It shows an agreement between two different signals as a function of the time lag.Further, cross-coherence is defined as
Cxy(τ) = E[(x(t) − µx)(y(t − τ) − µy)], (6.19)
so that Rxy and Cxy are related as Cxy(τ) = Rxy(τ) − µxµy. The cross-correlationcoefficient is defined as follows:
ρxy(τ) =Cxy(τ)
√
(Cxx(0)Cyy(0)). (6.20)
This cross-correlation coefficient is also called simply the cross-correlation. An ex-ample of cross-correlation is shown in figure 7.2 in section 7.3.
STATISTICAL TOOLS 57
The IDL language uses the function C-CORRELATE for evaluation of the cross-correlation:
ρxy(Lag) =
N−|Lag|−1∑
k=0(xk+|Lag| − x)(yk − y)
√
√
√
√
[
N−1∑
k=0(xk − x)2
] [
N−1∑
k=0(yk − y)2
]
for Lag < 0 (6.21)
ρxy(Lag) =
N−Lag−1∑
k=0(xk+Lag − x)(yk − y)
√
√
√
√
[
N−1∑
k=0(xk − x)2
] [
N−1∑
k=0(yk − y)2
]
for Lag ≥ 1
Here the symbols have the same meaning as in (6.15) at page 55.
6.2.2 Cross-power spectrum, coherence, phase spectrum
In a similar way as the power spectrum (6.16), we can define the cross-power spec-trum as the Fourier transform of the cross-correlation function (6.18):
Sxy(f) =
∞∫
−∞
Rxy(τ)e−2πifτdτ. (6.22)
If x(t) and y(t) are real then
Sxy(−f) = S∗xy(f), (6.23)
thus the part of the spectrum at positive frequencies is sufficient for determinationof Sxy(f) similarly as in the case of the power spectrum.
The cross-power spectrum is a complex function. Thus, it can be written as
Sxy(f) = Cxy(f) + iQxy(f) (6.24)
where Cxy(f) is termed as the co-spectrum and Qxy as the quad-spectrum. Using thepolar representation, the cross-power spectrum can be re-written as
Sxy(f) = |Sxy(f)|eiΘxy(f). (6.25)
Normalized amplitude of the cross-power spectrum is defined as
γxy(f) =|Sxy(f)|
√
Sx(f)Sy(f). (6.26)
Variable γxy(f) is termed the coherence spectrum (or coherence) and indicates thecorrelation of two signals in the frequency domain. It takes values from zero to one.
The quantity Θxy(f) in equation (6.25) is termed the phase spectrum and itgives the averaged phase difference for each frequency in the Fourier spectrum ofthe signals. An example of cross-power spectrum as well as the phase spectrum isin figure 7.3 in section 7.3.

58 STATISTICAL TOOLS
For the numerical estimation, the signals are (in similar manner as for the power
spectrum) divided into M slices: x(k)T (t), y
(k)T (t) and Fourier transformed into X(k)
n ,Y ∗(k)
n . Then, the cross-power spectrum estimator is
Sxy,n =1
M
M∑
k=1
Y (k)n X∗(k)
n . (6.27)
6.2.3 Wavenumber-frequency spectrum
In turbulent plasma, there is no clear relation between the frequency and thewavenumber. Thus, for an overall picture, it is worth to calculate the spectraldensity function for each couple of frequencies and wavenumber. Let us considera function of time and space g(x, t), which is stationary in both the time and thespace dimensions. The second order moment of this function will be
E[g(x, t)g(x − χ), t − τ)] = R(χ, τ). (6.28)
The wavenumber-frequency spectrum S(k, ω) is defined similarly to the powerspectrum: it is the Fourier transform of the second order moment of the functiong(x, t), but in both space and time:
S(k, ω) =
+∞∫
−∞
+∞∫
−∞
R(χ, τ)e−i(ωτ−kχ)dχdτ. (6.29)
Using this method for data from two probes only brings difficulty in summingover large space extent. The phase difference between the two signals is thus usedas an estimate of the wavenumber at each frequency. The signals are, as in previouscase, divided into M slices: x
(j)T (t), y
(j)T (t) and Fourier transformed into X(j)
n , Y ∗(j)n .
The local wavenumber for each slice j is
k(j)n =
arg(Y ∗(j)n X(j)
n )
∆x(6.30)
where the index n runs over frequencies. The two-dimensional function S(k, ω) willbe then approximated by a discrete two-dimensional histogram
S(j)n = |Y ∗(j)
n X(j)n | (6.31)
which is the power at frequency n in the slice attributed to the wavenumber k(j)n . An
example of the wavenumber-frequency spectra S(k, ω) from the RFX-mod reversedfield pinch and the CASTOR tokamak are shown in figure 6.1.
Finally, the numerical estimator can be expressed as
S(k, ω) = S(p∆k, 2πn∆f) =1
M
M∑
j=1
S(j)n Ip
[
k(j)n
]
(6.32)
where Ip is the histogram function defined as
Ip
[
k(j)n
]
=
1 for(
p − 12
)
∆k < k(j)n <
(
p + 12
)
∆k
0 elsewhere(6.33)
and p marks the wavenumber bins.

STATISTICAL TOOLS 59
Figure 6.1: Wavenumber-frequency spectra S(k, ω) of floating potential at the plasmaedge of RFX-mod (left panel) and CASTOR (right panel). The spectra were used asreference analyses for calculating the poloidal velocity in the CASTOR tokamak in[37, 38].

60 STATISTICAL TOOLS

Part II
Fluctuations measurements
61

Chapter 7
Measurements of sheared electricfields and flows at the plasma edgeof the CASTOR tokamak
Ion saturation current and floating potential are measured with hightemporal and spatial resolutions at the plasma edge of the CASTORtokamak by two poloidally spaced radial arrays of Langmuir probes.The radial electric field and the phase velocity of plasma fluctua-tions are determined. It is found that radial profiles of both of thesequantities are strongly sheared in the proximity of the Last ClosedFlux Surface. The position of the velocity shear layer is determinedwith a high precision. The shearing rate is determined. It was con-cluded that the system is in the state of marginal stability outside theVSL, while in the proximity of the VSL, the shear slightly dissipatesthe turbulent structures.
63

64 MEASUREMENTS OF SHEARED ELECTRIC FIELDS AND FLOWS
Poloidal velocity and radial electric field are measured at the plasma edge of theCASTOR tokamak by means of arrays of Langmuir probes. The shape of the radialprofile of the floating potential results in a shear of the radial electric field, causinga shear of plasma poloidal velocity [39]. Shear of poloidal velocity is one of themechanisms reducing turbulence at the plasma edge. It occurs naturally in magneticfusion devices, nevertheless it needs to exceed certain limiting value to suppressthe radial transport significantly. When this condition is fulfilled, the turbulentstructures are dissipated and a so-called transport barrier arises which improvesglobal plasma confinement.
7.1 Experimental set-up
The edge plasma parameters are measured by the double rake probe (described insection 3.3.1) which is immersed into plasma from the top of the tokamak chamber.The individual tips of the double rake probe measure either the floating potentialUfl or the ion saturation current Isat with sampling rate of 1 µs. The radial positionof the double rake probe was moved on the shot-to-shot basis to improve radialresolution. Two sets of reproducible shots were used for the following analysis:#27036 – #27045 for the Ufl measurements and #27046 – #27056 for the ionsaturation current measurements.
7.2 Radial profiles at the plasma edge
Radial profiles of the floating potential and ion saturation current are shown infigure 7.1 [40]. The maximum of the floating potential roughly corresponds to theradial position of the LCFS [25], as explained in section 4.3.
The radial electric field Erad is derived as
Erad = −dφ
dr(7.1)
where φ is the plasma potential which can be calculated for hydrogen plasma in theCASTOR tokamak as
φ.= Ufl + 2.5 · Te . (7.2)
Te was not measured in this experiment, instead, a typical profile from a campaignwith similar plasma parameters [41, 42] was used. This profile is shown in figure 7.1at page 43.
Radial electric field is positive in the SOL while it takes negative values insidethe LCFS. This electric field, in combination with the strong toroidal magnetic fieldBtor, causes Erad×Btor rotation in the poloidal direction. The poloidal rotation thusshould change sign at the LCFS. Therefore, the position of the LCFS is sometimeslabelled as the Velocity Shear Layer (VSL).

AT THE PLASMA EDGE OF THE CASTOR TOKAMAK 65
Figure 7.1: Radial profile of the floating potential (red dots) and the ion saturationcurrent (blue triangles). Green vertical lines show the position of the LCFS and thelimiter.
7.3 Determination of the poloidal velocity of plas-
ma fluctuations
The plasma flow velocity is not directly measured in this experiment. Instead, wedetermine the poloidal phase velocity of plasma fluctuations vph by means of twopoloidally spaced Langmuir probes, it means in the laboratory frame. In principal,the phase velocity of the turbulence with respect to the ambient rotating plasmamay be non-zero; previous studies (summarized in [43]) show that the propagationof the turbulent structures is dominated by the Erad × Btor shear and thus the vph
well represents the poloidal plasma velocity.Two statistical methods are exploited in order to estimate the poloidal phase ve-
locity vph: cross-correlation and cross-coherence techniques. The cross-correlations(see section 6.2.1) were calculated from the fluctuations of the Ufl or Isat measuredby poloidally spaced probes of the double rake probe. The sampling rate of themeasured data and thus the temporal resolution of the cross-correlations is 1 µs.The poloidal phase velocity of turbulent structures vph is identified with ratio ofmutual distance of poloidally adjacent probes d over the time delay of the signalappearing successively at these two probes. This delay was determined as the timelag of the maximum of the cross-correlation of two signals, lagmax. An example ofa cross-correlation is shown in figure 7.2.
The characteristic poloidal size of turbulent structures in the CASTOR edgeplasma λ is 1 cm [44, 45], which is higher than the poloidal distance of the probes.Thus, the maximum of the cross-correlation is rather broad and establishing oflagmax is not easy. Moreover, lagmax usually appears around 1 µs. In order toimprove the resolution of this technique below the sampling period (1 µs), the cross-
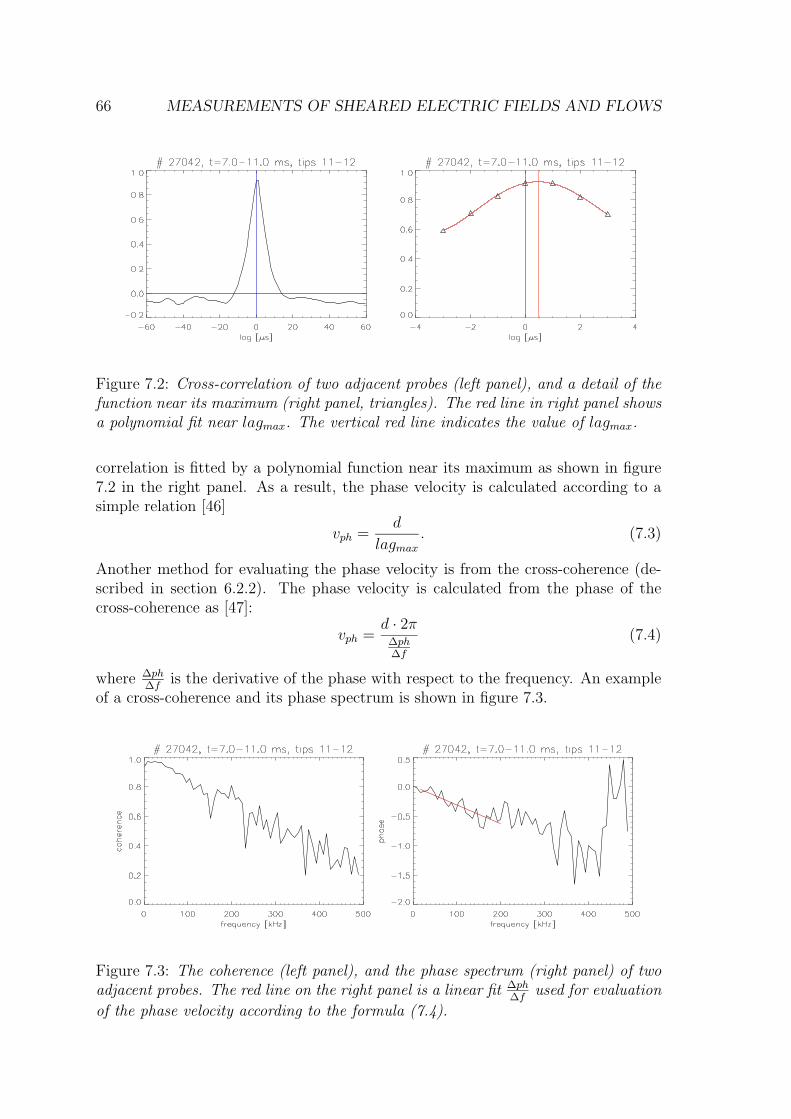
66 MEASUREMENTS OF SHEARED ELECTRIC FIELDS AND FLOWS
Figure 7.2: Cross-correlation of two adjacent probes (left panel), and a detail of thefunction near its maximum (right panel, triangles). The red line in right panel showsa polynomial fit near lagmax. The vertical red line indicates the value of lagmax.
correlation is fitted by a polynomial function near its maximum as shown in figure7.2 in the right panel. As a result, the phase velocity is calculated according to asimple relation [46]
vph =d
lagmax
. (7.3)
Another method for evaluating the phase velocity is from the cross-coherence (de-scribed in section 6.2.2). The phase velocity is calculated from the phase of thecross-coherence as [47]:
vph =d · 2π
∆ph∆f
(7.4)
where ∆ph∆f
is the derivative of the phase with respect to the frequency. An exampleof a cross-coherence and its phase spectrum is shown in figure 7.3.
Figure 7.3: The coherence (left panel), and the phase spectrum (right panel) of twoadjacent probes. The red line on the right panel is a linear fit ∆ph
∆fused for evaluation
of the phase velocity according to the formula (7.4).

AT THE PLASMA EDGE OF THE CASTOR TOKAMAK 67
Both the cross-correlation and cross-coherence methods were performed for eachpoloidally spaced couple of tips.
7.3.1 Radial profile of the phase velocity - double rake probe
The resulting radial profiles of the poloidal phase velocity, obtained from the doublerake probe, for Ufl (red dots) and Isat (blue triangles) fluctuations are shown infigure 7.4. Both the methods (equations (7.3) and (7.4)) gave the same results, thusthey are not distinguished in the figure. It can be clearly seen that the sign of vph
reverses at the radius of 70.5 mm corresponding to the LCFS (see figure 7.1): Inthe confinement region, the poloidal phase velocity is negative, while in the SOL ittakes positive values. The position of the velocity shear layer is established with ahigh precision in this experiment, as obvious from figure 7.4.
Figure 7.4: Radial profile of the poloidal phase velocity. Red circles denote Ufl, bluetriangles Isat. Yellow line: Erad × Btor drift velocity (7.5), pink line: the electronpart of the diamagnetic drift velocity vdiam (7.6), blue line: the sum of these two:vE×B + vdiam. The black vertical line depicts the VSL, the arrows indicate directionsof two components of the vdiam.
The values of vph were compared to Erad × Btor drift estimation (yellow line):
~vE×B =~Erad × ~Btor
| ~Btor|2.=
−∇(Ufl + 2.5 · Te)
| ~Btor|(7.5)
according to (7.1). It is worth noting that a good agreement of the predicted velocityshear with the experimentally established one is observed when the electron part of
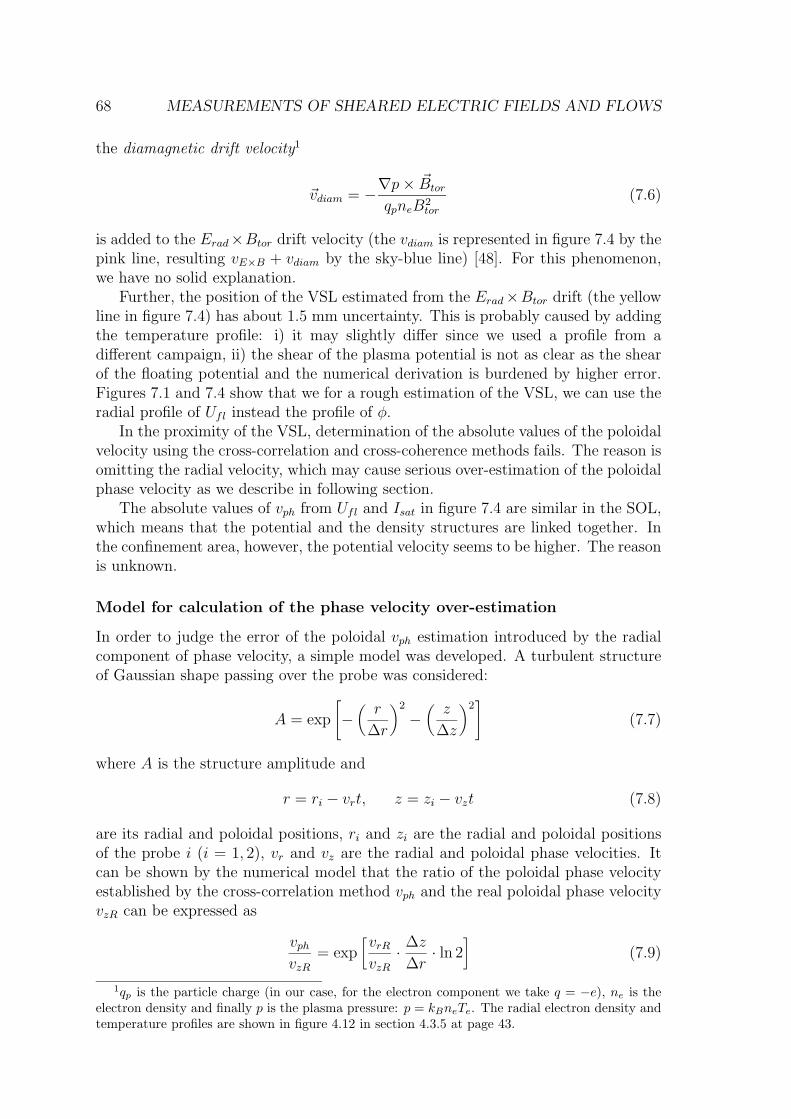
68 MEASUREMENTS OF SHEARED ELECTRIC FIELDS AND FLOWS
the diamagnetic drift velocity1
~vdiam = −∇p × ~Btor
qpneB2tor
(7.6)
is added to the Erad×Btor drift velocity (the vdiam is represented in figure 7.4 by thepink line, resulting vE×B + vdiam by the sky-blue line) [48]. For this phenomenon,we have no solid explanation.
Further, the position of the VSL estimated from the Erad×Btor drift (the yellowline in figure 7.4) has about 1.5 mm uncertainty. This is probably caused by addingthe temperature profile: i) it may slightly differ since we used a profile from adifferent campaign, ii) the shear of the plasma potential is not as clear as the shearof the floating potential and the numerical derivation is burdened by higher error.Figures 7.1 and 7.4 show that we for a rough estimation of the VSL, we can use theradial profile of Ufl instead the profile of φ.
In the proximity of the VSL, determination of the absolute values of the poloidalvelocity using the cross-correlation and cross-coherence methods fails. The reason isomitting the radial velocity, which may cause serious over-estimation of the poloidalphase velocity as we describe in following section.
The absolute values of vph from Ufl and Isat in figure 7.4 are similar in the SOL,which means that the potential and the density structures are linked together. Inthe confinement area, however, the potential velocity seems to be higher. The reasonis unknown.
Model for calculation of the phase velocity over-estimation
In order to judge the error of the poloidal vph estimation introduced by the radialcomponent of phase velocity, a simple model was developed. A turbulent structureof Gaussian shape passing over the probe was considered:
A = exp
[
−(
r
∆r
)2
−(
z
∆z
)2]
(7.7)
where A is the structure amplitude and
r = ri − vrt, z = zi − vzt (7.8)
are its radial and poloidal positions, ri and zi are the radial and poloidal positionsof the probe i (i = 1, 2), vr and vz are the radial and poloidal phase velocities. Itcan be shown by the numerical model that the ratio of the poloidal phase velocityestablished by the cross-correlation method vph and the real poloidal phase velocityvzR can be expressed as
vph
vzR
= exp[
vrR
vzR
· ∆z
∆r· ln 2
]
(7.9)
1qp is the particle charge (in our case, for the electron component we take q = −e), ne is theelectron density and finally p is the plasma pressure: p = kBneTe. The radial electron density andtemperature profiles are shown in figure 4.12 in section 4.3.5 at page 43.

AT THE PLASMA EDGE OF THE CASTOR TOKAMAK 69
where vrR is the real radial phase velocity and ∆r, ∆z are the radial and poloidalextent of the structure.
Relation (7.9) implies that even a small contribution of the radial velocity maycause a significant over-estimation of vph. This effect is particularly visible in theproximity of the VSL where the radial velocity probably dominates the poloidal one.
In order to test the above mention hypothesis and to estimate the impact orthe radial component of velocity to the calculation of the poloidal velocity, we haveapplied the relation (7.9) to the experimental data. The left panel of figure 7.5 showsthe dependency of the measured vph on the real poloidal velocity vzR. This plot showsthat one value of the poloidal velocity can result in two different estimations usingthe cross-correlations.
Figure 7.5: Left: the relation (7.9): vph as a function of vzR. Right panel: exper-imentally obtained vph from cross-correlations applied to Isat data (blue triangles)compared to the correction according to the model 7.9: the violet crosses are for thehigh velocity branch (violet line in left panel), the green diamonds for the low one(green line in left panel).
The real poloidal velocity vzR was estimated by finding relevant values for eachvph and plotted into figure 7.5, right panel. The blue triangles are the experimentalvph, green diamonds show the vzR estimation coming from the low velocities partof the function 7.9 (green part of the curve in figure 7.5, left panel) and the violetcrosses show the vzR from the high velocities part (violet part of the curve). Thethree curves from figure 7.4 are over plotted for illustration: yellow for the Erad×Btor
drift velocity, pink for the electron part of the diamagnetic drift velocity, and sky-blue is the sum of these two. The radial velocity was assumed constant, the exponentvrR
vzR· ∆z
∆rwas considered as equal to 1.5. The velocities from ion saturation current
was used, the floating potential gives similar result.The left panel of figure 7.5 shows how the vph estimated from the cross-correlations
is over-estimated. Near the VSL, the low velocity branch (green) is meaningful, whilefurther, the experimental values as well as the estimations from the drifts agree withthe high velocities branch (violet). The method has certain limitations, for exampleit assumes that all the structures have Gaussian shape, they are symmetric in radialand poloidal direction, and they have equal amplitudes, while in reality, they maybe tilted and of a different shape (short rising time and a long tail). Nevertheless,
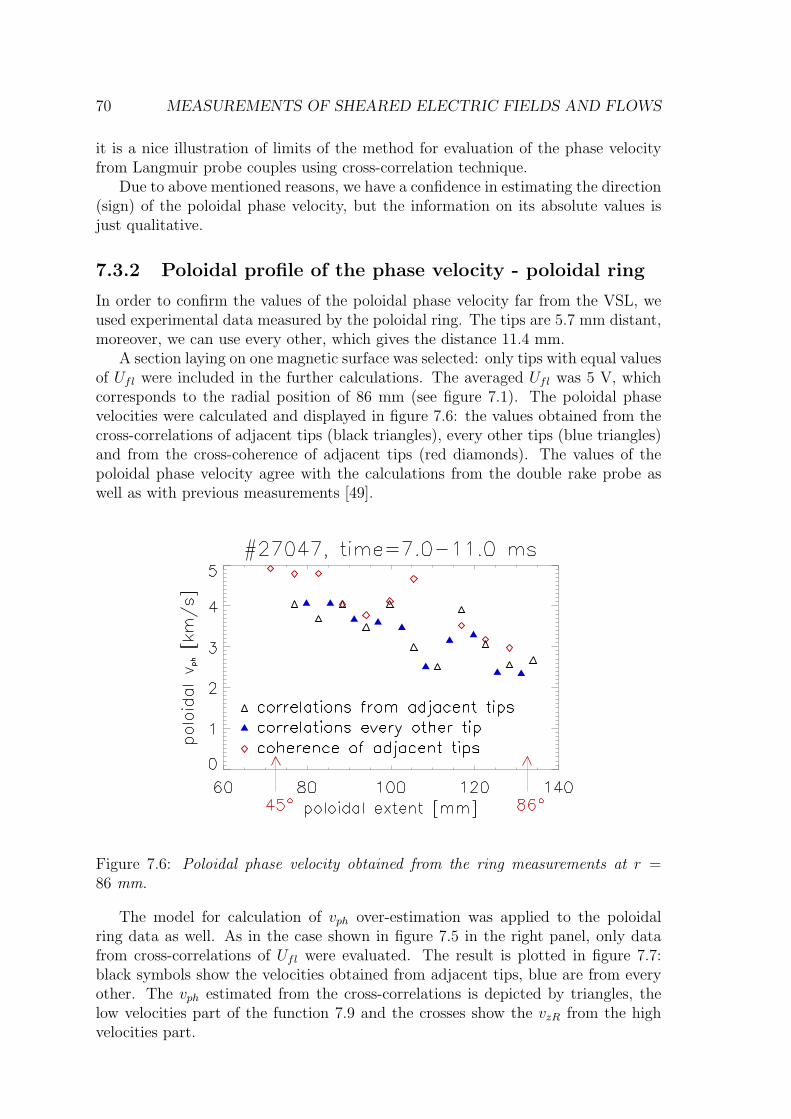
70 MEASUREMENTS OF SHEARED ELECTRIC FIELDS AND FLOWS
it is a nice illustration of limits of the method for evaluation of the phase velocityfrom Langmuir probe couples using cross-correlation technique.
Due to above mentioned reasons, we have a confidence in estimating the direction(sign) of the poloidal phase velocity, but the information on its absolute values isjust qualitative.
7.3.2 Poloidal profile of the phase velocity - poloidal ring
In order to confirm the values of the poloidal phase velocity far from the VSL, weused experimental data measured by the poloidal ring. The tips are 5.7 mm distant,moreover, we can use every other, which gives the distance 11.4 mm.
A section laying on one magnetic surface was selected: only tips with equal valuesof Ufl were included in the further calculations. The averaged Ufl was 5 V, whichcorresponds to the radial position of 86 mm (see figure 7.1). The poloidal phasevelocities were calculated and displayed in figure 7.6: the values obtained from thecross-correlations of adjacent tips (black triangles), every other tips (blue triangles)and from the cross-coherence of adjacent tips (red diamonds). The values of thepoloidal phase velocity agree with the calculations from the double rake probe aswell as with previous measurements [49].
Figure 7.6: Poloidal phase velocity obtained from the ring measurements at r =86 mm.
The model for calculation of vph over-estimation was applied to the poloidalring data as well. As in the case shown in figure 7.5 in the right panel, only datafrom cross-correlations of Ufl were evaluated. The result is plotted in figure 7.7:black symbols show the velocities obtained from adjacent tips, blue are from everyother. The vph estimated from the cross-correlations is depicted by triangles, thelow velocities part of the function 7.9 and the crosses show the vzR from the highvelocities part.
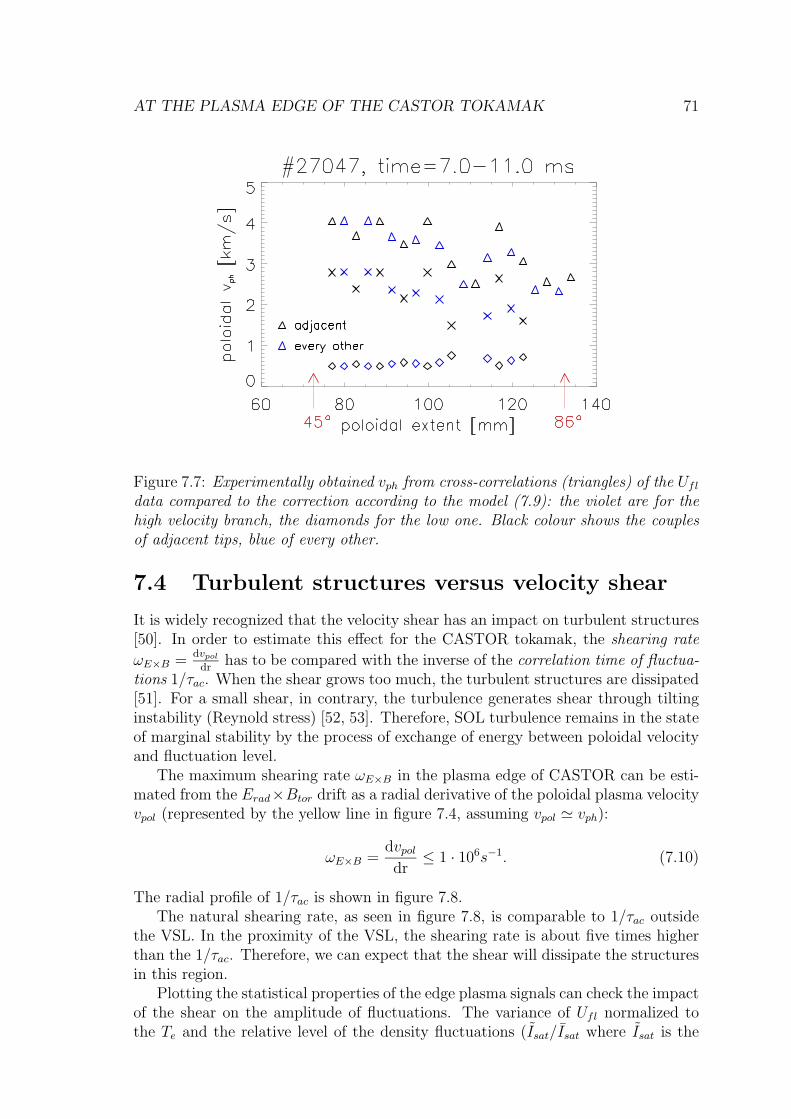
AT THE PLASMA EDGE OF THE CASTOR TOKAMAK 71
Figure 7.7: Experimentally obtained vph from cross-correlations (triangles) of the Ufl
data compared to the correction according to the model (7.9): the violet are for thehigh velocity branch, the diamonds for the low one. Black colour shows the couplesof adjacent tips, blue of every other.
7.4 Turbulent structures versus velocity shear
It is widely recognized that the velocity shear has an impact on turbulent structures[50]. In order to estimate this effect for the CASTOR tokamak, the shearing rate
ωE×B =dvpol
drhas to be compared with the inverse of the correlation time of fluctua-
tions 1/τac. When the shear grows too much, the turbulent structures are dissipated[51]. For a small shear, in contrary, the turbulence generates shear through tiltinginstability (Reynold stress) [52, 53]. Therefore, SOL turbulence remains in the stateof marginal stability by the process of exchange of energy between poloidal velocityand fluctuation level.
The maximum shearing rate ωE×B in the plasma edge of CASTOR can be esti-mated from the Erad×Btor drift as a radial derivative of the poloidal plasma velocityvpol (represented by the yellow line in figure 7.4, assuming vpol ≃ vph):
ωE×B =dvpol
dr≤ 1 · 106s−1. (7.10)
The radial profile of 1/τac is shown in figure 7.8.The natural shearing rate, as seen in figure 7.8, is comparable to 1/τac outside
the VSL. In the proximity of the VSL, the shearing rate is about five times higherthan the 1/τac. Therefore, we can expect that the shear will dissipate the structuresin this region.
Plotting the statistical properties of the edge plasma signals can check the impactof the shear on the amplitude of fluctuations. The variance of Ufl normalized tothe Te and the relative level of the density fluctuations (Isat/Isat where Isat is the

72 MEASUREMENTS OF SHEARED ELECTRIC FIELDS AND FLOWS
Figure 7.8: Radial profile of 1/τac of the edge fluctuations (orange line, circles). Thegreen line (triangles) shows absolute value of the shearing rate ωE×B. The verticalblack line depicts the position of the VSL.
fluctuating part of the ion saturation current and Isat is its mean value) is plottedin figure 7.9. We can observe a local minimum in the relative level of densityfluctuations near the VSL, which is a sign of a disturbance of the structures. Thiseffect is not so apparent in the potential fluctuations.
Figure 7.9: Radial profiles of the variance of the Ufl normalized to the electrontemperature (left panel) and the relative level of fluctuations Isat/Isat (right panel).

AT THE PLASMA EDGE OF THE CASTOR TOKAMAK 73
7.5 Summary
Fluctuations of the ion saturation current (proportional to plasma density) and thefloating potential (proportional to plasma potential) are measured at the edge ofthe CASTOR tokamak with high spatial resolution. The radial profile of the phasevelocity is determined by two statistical methods. With high precision (∼ 1 mm)we can determine the radial position of the velocity shear layer where the poloidalrotation changes the sign. A simple model was introduced to judge the error of thepoloidal vph estimation introduced by its radial component. The shearing rate isestimated in the proximity of the VSL as ωE×B ≤ 1 · 106 s−1. It has the same valuesas the inverse of the correlation time of fluctuations 1/τac outside the VSL, but it isabout five times higher in the proximity of the VSL. A small reduction of the relativelevel of fluctuatuations at the VSL is observed in the statistical parameters of theUfl and Isat signals. The system is in the state of marginal stability outside theVSL, while in the proximity of the VSL, the shear slightly dissipates the turbulentstructures.

74 MEASUREMENTS OF SHEARED ELECTRIC FIELDS AND FLOWS

Chapter 8
Investigation of the CASTOR SOLby means of 2D matrix ofLangmuir probes
Two probe arrays are used to characterize the edge plasma with ahigh temporal and spatial resolution: the 2D probe and the rakeprobe. Biased flux tubes formed by imposing a voltage to the edgeplasma region as well as toroidal structures occurring naturally inthe ohmic plasma, are investigated in this chapter.
75

76 INVESTIGATION OF THE CASTOR SOL
Control of the parallel and perpendicular fluxes in the Scrape Off Layer (SOL) is animportant issue for the fusion reactor. Plasma-wall interaction is the main source ofimpurities. This interaction can be suppressed be decreasing of the radial transportin the SOL. In the divertor region, on the contrary, the radial transport needs to behigh enough to spread the energy over a large area, avoiding a damage of divertorplates by focusing the plasma into hot spots. Inside the LCFS, a transport barrieris required for better plasma confinement.
An extensive experimental activity has been carried out on the CASTOR toka-mak, aimed at gaining a better understanding of the SOL properties and at findingways to control it [16, 18, 54]. Among the attempts which have been made, we cancite the creation of convective cells by means of a biasing electrode, exploiting theperiodic structure of the SOL due to the local safety factor [55]. In this part, we re-port results on the use of electrode and probe arrays for mapping the magnetic fieldlines periodicity in the SOL, and for determining the geometry of edge fluctuations.
8.1 Experimental set-up
Two kinds of Langmuir probe arrays were used for measurement of the edge plasmaparameters: the 2D matrix of Langmuir probes (shortly 2D probe) and the rakeprobe, both described in section 3.3.1. The edge electric field was in some dischargesmodified by the massive biasing electrode (chapter 5).
Both these probe arrays were inserted into the tokamak from the top and theirradial positions could be adjusted on the shot-to-shot basis. Typically, the range ofradii from 60 to 90 mm was investigated.
The experimental set-up is shown in scale in figure 8.1, which displays the toroidaland poloidal position of all key elements on an unfolded magnetic surface associatedwith the biasing electrode. Orientation of the 2D probe could be either parallel,
TOP
HFS
LFS
Bottom
Bottom
i-sidee-side
Bt, Ip
Electrode
RP2D
Downstream
Upstream
SAFETY FACTOR q=8
Figure 8.1: Unfolded magnetic surface: The surface is poloidally cut along the limiterand toroidally at the bottom. Toroidal and poloidal positions of the probe arrays andof the electrode are depicted. The flux tube emanating from the electrode eitherupstream or downstream along the magnetic field line is emphasized by differentcolour. RP indicates the position of the rake probe, 2D is the 2D probe.

BY MEANS OF 2D MATRIX OF LANGMUIR PROBES 77
or anti-parallel to the magnetic field lines (and also to the plasma current) whichhave the anti-clockwise direction when viewed from the top of the tokamak cham-ber. Thus, in the anti-parallel case, the tips of the 2D probe are oriented towardsthe biasing electrode while in the clockwise case they are oriented to the oppositedirection. For anti-parallel orientation, the 2D probe is poloidally in the middle ofthe chamber while for the parallel orientation it is shifted of about 4 cm to the LowField Side due to asymmetry of the probe holder.
8.2 Mapping of magnetic field lines in the SOL
First experiment was devoted to mapping the magnetic field lines at the plasmaedge of the CASTOR tokamak. It was performed by using the biasing electrode andthe 2D probe.
In order to “mark” the magnetic field lines, we have applied a harmonic voltage(±80 V) of different frequencies (1, 5 or 10 kHz – the results do not vary withfrequency) to the electrode. Power spectrum was evaluated from Ufl fluctuationsof individual 2D probe tips. The power spectra amplitude for driving frequency asa function of the radial and poloidal coordinates for the anti-parallel orientation ofthe 2D probe is plotted in figure 8.2, left panel.
Biased flux tubeUpstream
Biased flux tubeDownstream
Biasingelectrode
2D probe
Bpol
Btor
Figure 8.2: Left: Power spectrum amplitude from the 2D probe with anti-parallelorientation, calculated for the frequency of the voltage applied to the electrode. Right:Trace of the flux tube associated with the electrode depicted in a scheme of the top-view at the tokamak vessel.
The clear pattern observable in figure 8.2 corresponds to a projection of thebiasing electrode in the 2D probe from the distance of 30 cm. The poloidal (∼50 mm) and radial (∼ 5 mm) extent of the biased flux tube can be determined.They roughly correspond to the dimensions of the electrode.
Another kind of pattern can be observed in figure 8.3 (left panel) for the 2Dprobe turned to the opposite side and shifted poloidally. On the right-hand side,we see just a part of the upstream flux tube. The second pattern (on the left) is ashadow of the downstream flux tube coming from back of the probe (see the right

78 INVESTIGATION OF THE CASTOR SOL
Btor
Bpol
Biasingelectrode
2D probe
Biased flux tubeUpstream
Biased flux tubeDownstream
qq = 2 /p q
q ~ 4.7 => q = 7.9
Figure 8.3: Left: Power spectra from the 2D probe with parallel set-up. The bluearrows schematically point from the plasma column centre to the centre of the elec-trode projection. Right: Trace of the flux tube associated with the electrode depictedin a scheme of the top-view of the tokamak vessel.
panel). The virtual shift of the patterns in radial direction is caused by the shiftof the probe in the poloidal direction as is implied by tilting of the ellipses: the2D probe is misaligned to the left with respect to the vertical axis of the chamber,therefore one row of tips does not lay on one magnetic surface. The length of theupstream flux tube is ∼ 30 cm and of the downstream flux tube is ∼ 220 cm.
The safety factor q (see section 3.2.7) can be estimated from the projections ofthe electrode. Considering the size of the biased flux tube as obtained from theanti-parallel lay-out (figure 8.2) and the distance between two patterns from theparallel lay-out (figure 8.3), we can find out that the angle between them is equalto about 47. From this angle, we can estimate the edge safety factor q = 7.9. Thisvalue is in a good agreement with the value calculated in section 3.2.7.
8.3 Fluctuations measurements by the 2D probe
and the rake probe
Once we have checked the geometry of the edge plasma, we can trace the turbulentstructures using the 2D probe and the rake probe in ohmic regime. The toroidaldistance between the rake probe and the 2D probe was about 1 m, the biasingelectrode was retracted from the plasma. One reference tip of the rake probe wasselected and its signal was confronted with all the 2D probe tips by computing thecross-correlations with the time lag = 0 ms. The result is shown in figures 8.4 and8.5.
A pattern of a structure with high cross-correlation can be noticed in figure 8.4,

BY MEANS OF 2D MATRIX OF LANGMUIR PROBES 79
Biased flux tubeUpstream
Biased flux tubeDownstream
2D probe
Bpol
Rake probe
Btor
Figure 8.4: Left: Cross-correlations with lag = 0 of the 2D probe for the anti-parallelorientation with the rake probe tip 2 (radial position 72.5 mm). The ellipse marks a“projection” of a typical turbulent structure. Right: Trace of the structure depictedin a top-view of the tokamak vessel.
Figure 8.5: Left: Cross-correlations with lag = 0 of the 2D probe in parallel orien-tation with the rake probe tip 4 (radial position 77.6 mm). The red ellipse on theleft shows a “projection” of a typical turbulent structure, the blue ellipse shows ananti-correlation pattern. The filled red ellipse on the right side depicts an expectedposition of another maximum of cross-correlation for q = 8. Right: Trace of thestructure depicted in a top-view of the tokamak vessel.

80 INVESTIGATION OF THE CASTOR SOL
left panel1. Its poloidal extent can be estimated as 2.3 cm while the radial extentis 0.6 cm. The toroidal length of this structure is longer than 1 m, as follows fromthe experimental arrangement. The geometry of the lay-out is shown in figure 8.4in the right panel.
A similar pattern of a structure can be observed also in figure 8.5, left panel. Amaximum of cross-correlations can be recognized in the bottom left corner of thepicture. The other side of the structure is out of the range of the 2D probe but wecan see an anti-correlation pattern on the right. Such a bi-polar character of the edgeturbulence has been identified in CASTOR in [57]. If we mark the correlated andanti-correlated pattern as shown in figure 8.5 and compute the edge safety factor,we obtain q = 8, which is in good agreement with previous results.
8.4 Poloidal velocity of turbulent structures with
DC biasing
Now, we return to the experimental arrangement with the biasing electrode. Thistime, a DC voltage of 50 V is applied. It causes a high gradient of the plasmapotential and thus a strongly sheared electric field. This field creates the Erad×Btor
drift that rotates the plasma generating convective cells [55].Orientation of the 2D probe is anti-parallel, thus the magnetic field lines enter
the plane of the picture. Floating potential of the 2D probe tips is plotted in figure8.6 in the left panel. The pattern of the biasing electrode is well pronounced, thedirections of the Erad are shown by black arrows.
Btor
Erad
BtorBtor
EradErad
vpolvpolvpol
Figure 8.6: Left: 2D plot of the floating potential. Right: 2D plot of the poloidalvelocity. Red and blue colours represent two opposite directions of the velocity.
The Erad × Btor drift rotates plasma in the poloidal direction. The poloidalplasma velocity is not measured directly, instead, the poloidal phase velocity ofplasma fluctuations was evaluated in the same way as in chapter 7: the time lags ofthe maxima of the cross-correlations of adjacent tips were divided by the distance
1The pattern is more clear in the electronic version of the picture.
BY MEANS OF 2D MATRIX OF LANGMUIR PROBES 81
of the tips. The resulting velocities are plotted in figure 8.6 in the right panel. Thered and blue colour show different directions of the plasma motion.
Values of the poloidal velocity were established as < 6 km/s. It is in a goodagreement with the close study in chapter 7. The 2D probe is very large and it’sdisturbance to the edge plasma can not be neglected. Thus, for proper analysis,using of smaller probe arrays is more suitable.
Evaluation of the radial velocity is burdened by a high error since the poloidalcomponent of the phase velocity significantly influences the process as we discuss inchapter 7.
8.5 Summary
Magnetic field configuration of the edge plasma region of the CASTOR tokamakwas investigated by means of biasing flux tubes by imposing a harmonic voltage inthe plasma. Furthermore, turbulent structures can be characterized by the cross-correlation analysis between two toroidally spaced probe arrays. This allows us toestablish the radial and poloidal extent of turbulent structures in the SOL. Poloidalvelocities driven by Erad × Btor drift were calculated. The values are ∼ 6 km/s inthe shear region. The results of this experiment are linked up with the previousones [56], [57], chapter 7, where the velocities reached values 4−6 km/s in the sameregion.

82 INVESTIGATION OF THE CASTOR SOL

Chapter 9
Analysis of relaxation events inthe CASTOR tokamak usingdeeply immersed biasing electrode
A strong radial electric field is generated by a biasing the plasmaedge of the CASTOR tokamak. If the Erad is strong enough, theedge plasma parameters relax with periodicity of about 100 µs. Thisphenomenon is experimentally studied by a complex system of elec-tric and magnetic diagnostics.
83

84 ANALYSIS OF RELAXATION EVENTS IN THE CASTOR TOKAMAK
Transport of plasma to the walls is one of the crucial topics in magnetic confinementfusion research. Large tokamaks operate in regimes with high confinement (H-mode)[39], which will be also the reference regime for the future fusion reactor (ITER).The H-mode is characterized by a steep gradient of plasma pressure at the edgeresponsible for creation of a transport barrier. This barrier periodically collapsesand rises again, which is manifested by relaxation events termed Edge LocalizedModes (ELMs [58]). ELMs are connected with degradation of plasma confinementand consequent release of energy and particles to the wall. Since the amount ofenergy and particles can be quite high, ELMs can cause a serious damage of thevacuum vessel and of divertors of large tokamaks.
Tokamak CASTOR does not operate in H-mode, which is typical for tokamakswith divertor configuration (section 4.1.2). Nevertheless, during discharges withstrong biasing of plasma, we observe relaxation events which can resemble ELMs.Arrays of diagnostics with exceptionally high spatial and temporal resolution makeCASTOR a unique facility to study these relaxation phenomena in detail.
9.1 Experimental set-up
Two kinds of sets-up were used for the biasing experiments: First, with the seg-mented electrode, and second, with the massive carbon mushroom-shaped electrode(the standard electrode). Both the electrodes (described in chapter 5) were immerseddeep into the plasma from the top of the chamber, in all the presented cases at theradial position of 40 mm. A positive voltage of 100 − 300 V was applied betweenthe electrode and the tokamak vessel during the flat top phase of the discharge, andconsequently the current 10 − 30 A was driven.
Toroidal distribution of the diagnostics in the tokamak chamber for the experi-ments is depicted in figure 9.1. Radial profiles of the electric fields and Isat (whichis proportional to the density) are measured by the rake probe (the first campaign)and from the double rake probe (the second campaign). During the second cam-
Gundestrupprobe
BIASINGELECTRODE
SK Ring
LIMITER
double rakeprobe
Tunnelprobe
B, I
Figure 9.1: Set-up of the experiment: top view of the tokamak vessel.

USING DEEPLY IMMERSED BIASING ELECTRODE 85
paign, toroidal and poloidal flows are measured by the Gundestrup probe (section3.3.2). All these probes are immersed from the top of the torus. All the data fromthe electric and magnetic probes are acquired with the frequency up to 1 MHz.
Moreover, poloidal profiles of the electric field, ion saturation current, and mag-netic field is monitored by the SK ring1 during the second campaign. This ring islocated slightly behind the poloidal limiter (r = 87 mm), the poloidal distance ofthe tips is 5.7 mm. The Langmuir probes can measure local values of Ufl and Isat
while the coils monitor poloidal magnetic field from the plasma volume.
9.2 Relaxation events
The relaxation phenomena were first monitored in a campaign with the segmentedelectrode and the single rake probe. For the next campaign, appropriate diagnosticswere inserted in order to obtain additional plasma characteristics. The relaxationphenomena are reproducible, though, these two campaigns showed some interestingdifferences.
Texture of a probe signal
When the biasing electrode is immersed deep enough into the plasma (r/a ≃ 0.5)and biased to high enough voltage (more than +220 V), periodic oscillations can beobserved in signal of Langmuir probes.
Examples of signals from a single tip of the rake probes is shown in figure 9.2.During the biasing phase of discharge, the floating potential Ufl is clearly modulatedwith the frequency of approximately 10 kHz. After the biasing is switched off, Ufl
drops and shows only a broadband fluctuations.In some discharges, the relaxation events occur through the whole biasing phase
of discharge (shot #29552, bottom panel of figure 9.2) while in another cases, theystart later, in the middle of the biasing phase of discharge only (middle panel).Another option is shown in the bottom panel: the relaxation events were generatedimmediately after the triggering of the biasing and they were soon damped; in someshots, at the end of this phase, new events with longer period raised.
Radial profiles of Ufl
Using the whole radial column of the rake probe, we can obtain a temporal evolutionof radial profile of the Ufl. An example is given in figure 9.3, during and after biasing.We can clearly see strong relaxations of the profiles with the characteristic frequencyof about 10 kHz.
A detail of temporal evolution of floating potential is given in figure 9.4. Onezoomed-in relaxation event is plotted in left panels. The red vertical lines depictthree different times, characterizing the phases of development of the transportbarrier; radial profiles of Ufl in these particular moments are plotted in the rightpanels. The top panels are devoted to the first campaign (segmented electrode,
1Poloidal ring of 96 Langmuir probes and of 16 magnetic coils, see section 3.3.1 for details.

86 ANALYSIS OF RELAXATION EVENTS IN THE CASTOR TOKAMAK
Figure 9.2: Raw signal of tips of the rake / double rake probe. The left panels showthe whole biasing phase of the discharge (10-15.2 ms); the right ones show details ofthe relaxation events. The top panels are from the first campaign (with the segmentedelectrode and the single rake probe) while the middle and bottom panels show the datafrom the second campaign (with the standard electrode and the double rake probe).

USING DEEPLY IMMERSED BIASING ELECTRODE 87
Figure 9.3: Temporal evolution of radial profile of the floating potential during thebiasing of the edge plasma, and after the biasing is switched off (15.3 ms).
Figure 9.4: One zoomed-in event of the relaxation of transport barrier. Left: Tem-poral evolution of Ufl. Right: Radial profiles of Ufl at the times depicted by the redvertical lines in the left panels. Top panels show the data from the first campaign,bottom panels from the second one. Biasing electrodes were inserted in the radialposition of 40 mm.

88 ANALYSIS OF RELAXATION EVENTS IN THE CASTOR TOKAMAK
single rake probe) while the bottom panels show events from the second campaign(standard electrode, double rake probe).
It is interesting that the shapes of the radial profiles of floating potential of therelaxation events are slightly different: In the first campaign, the gradient of Ufl
(Erad) is formed immediately after the relaxation event and slowly travels outward(t = 10.55 ms). When it reaches LCFS, it suddenly collapse (t = 10.62 ms) tobe formed again in the confinement region. On the other hand, the events fromthe second campaign are much broader at the beginning and the maximum of thegradient Ufl is established gradually. The radial movement of these events is higher.
Radial profile of Erad
Radial electric field Erad in combination with the strong magnetic field Btor rotatesplasma in poloidal direction by Erad × Btor drift as described in chapter 7. Atpositions with strong Erad, we can expect a strong shear of poloidal velocities, whichresults in dissipating turbulent structures and hence in decreasing of transport.
In the plot of temporal evolution of radial electric field (figure 9.5), we can observea strong transport barrier being periodically formed inside the LCFS, in the rangeof radii 50−60 mm in this particular case. The barrier is formed in the confinementregion (as was mentioned above) and after some time, it starts to propagate radiallytowards the wall with velocity up to 220 m/s. The barrier collapses, when it isapproaching the LCFS, which is located at r = 69 mm as depicted by the whitedashed line. Dissipating of the barrier is accompanied by fine modulation of electricfield which propagate radially quite fast, with the velocity of ∼ 1.5 km/s. Radialprofile of the floating potential is given in the bottom panel of figure 9.5 to illustratethe connection of Ufl and Erad.
Figure 9.5: Top panel: temporal evolution of radial electric field. Bottom panel:radial profile of floating potential. The white dashed line depicts LCFS.

USING DEEPLY IMMERSED BIASING ELECTRODE 89
Interplay between Erad and Epol
The poloidal electric field can be obtained from the floating potential of the doublerake probe. While the radial electric field rotates plasma in the poloidal direction,poloidal electric field Epol contributes to the radial velocity either inward or outward,depending on the sign of Epol.
Figure 9.6 shows the interplay between the radial and poloidal electric field.Values of Epol are about three times lower (∼ ±7 kV/m) than the values of theErad (∼ ±25 kV/m). During the relaxation event, Epol has positive value (yellowspots in the figure), the radial velocity according to the Epol ×Btor drift is directedinward the plasma which helps to steepen the plasma density profile as depictedby the black arrows pointing down. On the other hand, during the collapse of thetransport barrier (blue spots), the radial velocity points outward and contributes torepelling plasma to the wall.
The intensity of the Hα line emission (further only Hα) over-plotted by whitecurve starts to decrease, when the strong barrier is formed at 55 − 60 mm and thevelocity points inside the plasma column. This can be interpreted as a reduction ofconvective transport towards the wall and consequently the reduction of recycling.When the barrier starts decreasing (and the Epol × Btor drift velocity points out ofthe plasma), the plasma stream propagates towards the wall and the Hα (recycling)increases.
We have observed two types of patterns in the Epol. Maxima are always inside theLCFS, but the minima (negative values) may develop in different radial positions:inside in LCFS or even outside in the SOL. Also, the frequency of the relaxationevents varies. It seems to be dependent on the radial velocity of the barrier, also adependence on the distance of the biasing electrode and the LCFS was investigated[59]. There are no clear results so far.
Radial profile of Isat
Behaviour of the plasma density can be traced by examination of the ion saturationcurrent Isat. Temporal evolution of the radial profile of ion saturation current isshown in figure 9.7. Ufl and Erad are plotted in the first two panels to show thedynamics the transport barrier. The VSL is at the position of 69 mm, as depictedby white dashed lines. Third panel shows Isat, which is clearly modulated with thesame frequency as of the potential relaxations. During collapse of the barrier, plasmais repelled towards the wall as described in previous sections and well confirmedby Hα over-plotted by white curves. In the bottom panel, the ion fluctuations2
Isat− < Isat > is plotted to emphasize the structure of Isat.Ion saturation current is proportional to the density, the relaxation events are
thus connected with periodical expelling of plasma bursts towards the walls. Radialpropagation of the density bursts can be estimated from the bottom panel as ∼0.5 km/s, as depicted by the sky-blue arrows in figure 9.7, bottom panels.
2Isat− < Isat > is calculated for each probe separately, the time window for averaging the Isat
corresponds to the window in figure 9.7
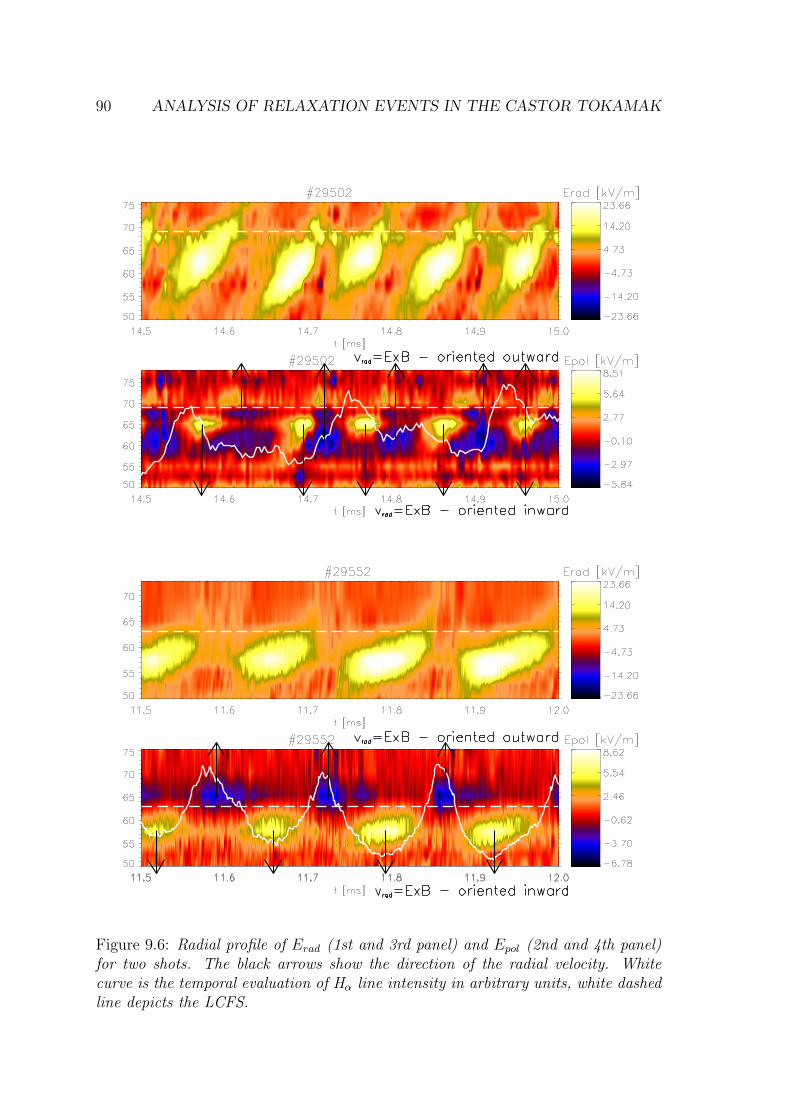
90 ANALYSIS OF RELAXATION EVENTS IN THE CASTOR TOKAMAK
Figure 9.6: Radial profile of Erad (1st and 3rd panel) and Epol (2nd and 4th panel)for two shots. The black arrows show the direction of the radial velocity. Whitecurve is the temporal evaluation of Hα line intensity in arbitrary units, white dashedline depicts the LCFS.

USING DEEPLY IMMERSED BIASING ELECTRODE 91
Figure 9.7: Temporal evolution of the ion saturation current. Ufl and Erad are plottedin first two panels. The third panel shows Isat, the bottom one depicts Isat− <Isat >. VSL is denoted by white dashed lines, Hα chamber is o-plotted by whitecurves (in arbitrary units). Sky-blue arrows show the direction of the plasma streamsmovement.

92 ANALYSIS OF RELAXATION EVENTS IN THE CASTOR TOKAMAK
Ion flow velocities
Toroidal and poloidal ion flow velocities can be obtained by calculating the Machnumbers. The parallel M‖ (toroidal) and perpendicular M⊥ (poloidal) Mach numbergive the ratio of parallel and perpendicular velocity, respectively, to the ion soundspeed.
Temporal evolution of M‖ and M⊥ (obtained using a validated 1D fluid probemodel [60]) are shown in figure 9.8. We can observe an interesting interplay betweenthese two flows: when the transport barrier is established and the poloidal flow takesthe highest values due to fast rotation in the poloidal direction, the toroidal flowdrops down to its minimum. Plasma rotates several times faster in the poloidaldirection than in the toroidal one. During the collapse of the barrier, the poloidalflow is transformed into the toroidal one. The poloidal ion flow velocity reachesvalues up to 25 km/s, which is about half of the ion sound velocity (50 km/s).
Figure 9.8: Temporal evolution of parallel (M‖, blue) and perpendicular (M⊥, green)Mach numbers of ion flow measured by the Gundestrup probe, #24076. Red line isan evolution of the Hα line intensity (in arbitrary units) [61].

USING DEEPLY IMMERSED BIASING ELECTRODE 93
Poloidal profile of Ufl and Erad
Radial character of the transport barrier is clearly described by the probes immersedinto the plasma from the top of the vessel. Now, we concern about the poloidal shape:whether the relaxations are poloidally symmetric, or whether it is a perturbationtravelling in the poloidal direction. Unfortunately, only a segment of the SK ringLangmuir probes was connected due to insufficient number of the data acquisitionsystem channels. In the following experiment, it was the upper HFS quarter ofpoloidal cross-section. Obtained time evolution of the floating potential poloidalprofile is presented in figure 9.9, top panel. It shows that the relaxation events arepoloidally symmetric (poloidal mode number m = 0).
Small periodical structures are also visible in temporal evolution of the poloidalprofile of poloidal electric field shown in figure 9.9, bottom panel. The amplitudeis not significant since the probes are located in the limiter shadow, at the radialposition of 87 mm. Still, the patterns are in agreement with previous investigationsand a clear poloidal symmetry of the poloidal electric field was confirmed. We canconclude that the barrier, though formed locally on one poloidal position, spreadsover the poloidal cross-section homogeneously, we say that the plasma is “breathing”.
Figure 9.9: Top panel: temporal evolution of the poloidal profile of floating potential.Bottom panel: temporal evolution of the poloidal profile of poloidal electric field. They-axis signifies angular position of the probes: 0 is the LFS mid plane, 90 is thetop of the chamber, 180 the HFS mid plane and finally 270 is the bottom. Onlythe upper HFS quarter of the poloidal cross-section is shown.

94 ANALYSIS OF RELAXATION EVENTS IN THE CASTOR TOKAMAK
Poloidal profile of Isat
Poloidal behaviour of the density can be traced by examination of the ion saturationcurrent Isat. It was measured by individual segments of the SK ring: at LFS, top,HFS and bottom. The result is plotted in figure 9.10. Maxima of Isat at the top ofthe chamber (bottom panel) agree with the profiles of Erad and Epol in figure 9.6 (toppanels): when the plasma is repelled to the walls, the ion saturation current nearthe wall increases. Hα is over-plotted to clarify the effect. The highest transport ofplasma is at HFS, the lowest one at LFS and bottom. The two top panels (LFS andbottom) have twice enlarged z-range (from 0 to 0.05 A) to emphasize the structures.
Figure 9.10: Temporal evolution of the ion saturation current poloidal profile. Foursegments were used for measurements: LFS, top, bottom and HFS. The white spacescorrespond to areas where we have no measurements. The two top panels (showingLFS and bottom) have twice enlarged z-range (from 0 to 0.05 A) to emphasize thestructures. The black and the white curve in the bottom panels shows the intensityof Hα line (chamber).

USING DEEPLY IMMERSED BIASING ELECTRODE 95
9.3 Magnetic activity of plasma
Transport barrier was described by means of local measurements of electric proper-ties at the plasma edge, namely by giving the radial and poloidal profiles of floatingpotential and ion saturation current. An interplay between Erad and Epol and be-tween M‖ and M⊥ was demonstrated as well. The electric probes are sensitiveneither to the magnetic activity of plasma, nor to phenomena acting deeper insidethe plasma. In order to uncover an impact of the transport barrier on the magneticcharacteristic, magnetic coils enclosing the plasma column were connected.
Magnetic coils of the SK ring measure the time derivative of the poloidal compo-nent of magnetic field. The provided measurements are of non-local character. Plotof the poloidal mode number intensity as a function of the poloidal number m ver-sus frequency is given in figure 9.11 (S(f,m) spectra). The S(f,m) spectra duringohmic phase (left panel) show a magnetic island with m ≃ 3 − 4 and the frequencyof 80 kHz, localized in the plasma centre at the magnetic surface with the safetyfactor q = 3. The magnetic coils are not at the same radius due to the downwardshift of the plasma, which is the reason of uncertainty of the determination of thepoloidal mode number.
When the relaxation events are present (right panel of figure 9.11), a strong peakin S(f,m) spectra appears with m = 0 and with the frequency equal to the frequencyof the relaxations (∼ 10 kHz), while the original magnetic activity is suppressed.This indicates a significant redistribution of the current density profile. It is notclear yet why the relaxation events located at the very edge modify the magneticactivity deep inside of the plasma column.
Figure 9.11: S(f,m) spectra during the ohmic phase (left panel) and during the biasingphase (right panel) of the discharge.

96 ANALYSIS OF RELAXATION EVENTS IN THE CASTOR TOKAMAK
9.4 Summary
An onset of relaxation events is observed at the plasma edge of the CASTOR toka-mak, during regimes with sufficiently strong biasing. These relaxations were studiedwith high spatial and temporal resolution by using a sophisticated system of plasmadiagnostics.
The transport barrier raises and relaxes periodically with frequency ∼ 10 kHz.The maximal radial electric field is up to 30 kV/m, which causes Erad×Btor rotationin poloidal direction up to 25 km/s, comparable with the ion sound velocity (50 m/s).
An interplay between the parallel and perpendicular flows is observed. Radialtransport of plasma towards the wall and consequent enhancement of influx of neu-trals into the plasma is observed. Relaxation events are poloidally symmetric (both,the electric and the magnetic components).

Chapter 10
Study of statistical properties offluctuations in the plasmaboundary region of the TJ-IIstellarator
Improved confinement regimes are reached whenever turbulenttransport is reduced and a highly sheared plasma flow is observed.This behaviour is interpreted as turbulence suppression occurringwhen the shearing rate of Erad×Btor velocity drift exceeds a criticalvalue related to broadband turbulence frequency. The investigationof the influence of Erad×Btor sheared velocities and magnetic topo-logy on the statistical properties of turbulence in the plasma bound-ary region of fusion devices is a topic of great interest. This chapterpresents results from the TJ-II stellarator.
97

98 STUDY OF STATISTICAL PROPERTIES OF FLUCTUATIONS
Statistical properties of fluctuations have been investigated in different toroidal andlinear devices [62]. Analysis of skewness and time asymmetry of floating potentialand ion saturation current is described in [63]. This analysis was performed forseveral fusion devices (tokamaks, stellarators) and non-fusion low temperature de-vices. A clear deviation from Gaussianity was observed in the SOL while in theproximity of the VSL, the statistical properties of the fluctuations show near Gaus-sian character. It was concluded in [63] that this behaviour was probably caused byErad×Btor shear effects. This conclusion was later called into question in [66], show-ing that magnetic topology might play a leading role to explain the modification inthe statistical properties of fluctuations in the proximity of the LCFS.
The task of this chapter is to assess the role of both magnetic topology andsheared flows on the statistical properties of fluctuations in the plasma boundaryregion of fusion plasmas. For this purpose, experimental data from the TJ-II stel-larator were analysed.
10.1 Stellarator
A stellarator is a magnetic device which serves for heating and confinement of plasmaas well as tokamak. The main difference is in the way how the magnetic field, whichis encharged to confine plasma, is generated.
Toroidal magnetic field of a tokamak is generated by external coils while thepoloidal magnetic field is generated by the strong toroidal plasma current. In stel-larator, in contrast, both the toroidal and poloidal magnetic fields are generated byexternal coils. The main difficulty of a construction of a stellarator lays in manu-facturing the magnetic field coils since even a small error in the shape of the coilsmay result in a major error of the magnetic field encharged in confinement of theplasma.
The need of the toroidal current in tokamak imposes a limitation on operationof the machine. The current can not be induced an unlimited time which makes theregime pulsed. This is not convenient for a fusion reactor, moreover, the materialsof the first wall must deal with high and fast changes of temperature. For thesereasons, methods of driving the current after the transformer is saturated, are beingdeveloped. Stellarator, in contrast, is a steady-state device from its principle. On theother hand, stellarator miss the ohmic heating at the beginning of the discharge, theplasma must be generated by additional heating systems such as Electron CyclotronResonance Heating or injecting of neutral beams.
10.2 TJ-II
The TJ-II stellarator (shown in figure 10.1) is a facility with high degree of magneticconfiguration flexibility, operating in CIEMAT in Madrid, Spain since 1998 [67, 68,69]. A scheme of the magnetic field coils is in figure 10.2. Heating of the TJ-IIplasma is achieved by an Electron Cyclotron Resonance Heating (ECRH) systemand an Neutral Beam Injection (NBI) system [68, 69]. The ECRH system consistsof two gyrotrons, each of them delivering microwave power up to 300 kW for thepulse length up to 1 s with the frequency of 53.2 GHz, which is the second harmonic

IN THE PLASMA BOUNDARY OF THE TJ-II STELLARATOR 99
Figure 10.1: TJ-II stellarator.
Figure 10.2: Scheme of magnetic field coils of the TJ-II stellarator.
of the electron cyclotron frequency in the TJ-II plasma. The NBI system includestwo hydrogen beams of the power of 1 MW each, with the beam energy 40 keV andthe maximal pulse length of 300 ms.
The physical programme of the TJ-II stellarator is focused mainly in plasmaconfinement [70, 71] and transport studies [69, 71, 72, 73], including the influenceof heating of the plasma [74], and including modelling studies. Another topics arethe studies in magnetohydrodynamics and basic theory. Its high magnetic configu-ration flexibility enables detailed description of the influence of magnetic topologyon plasma confinement [69].
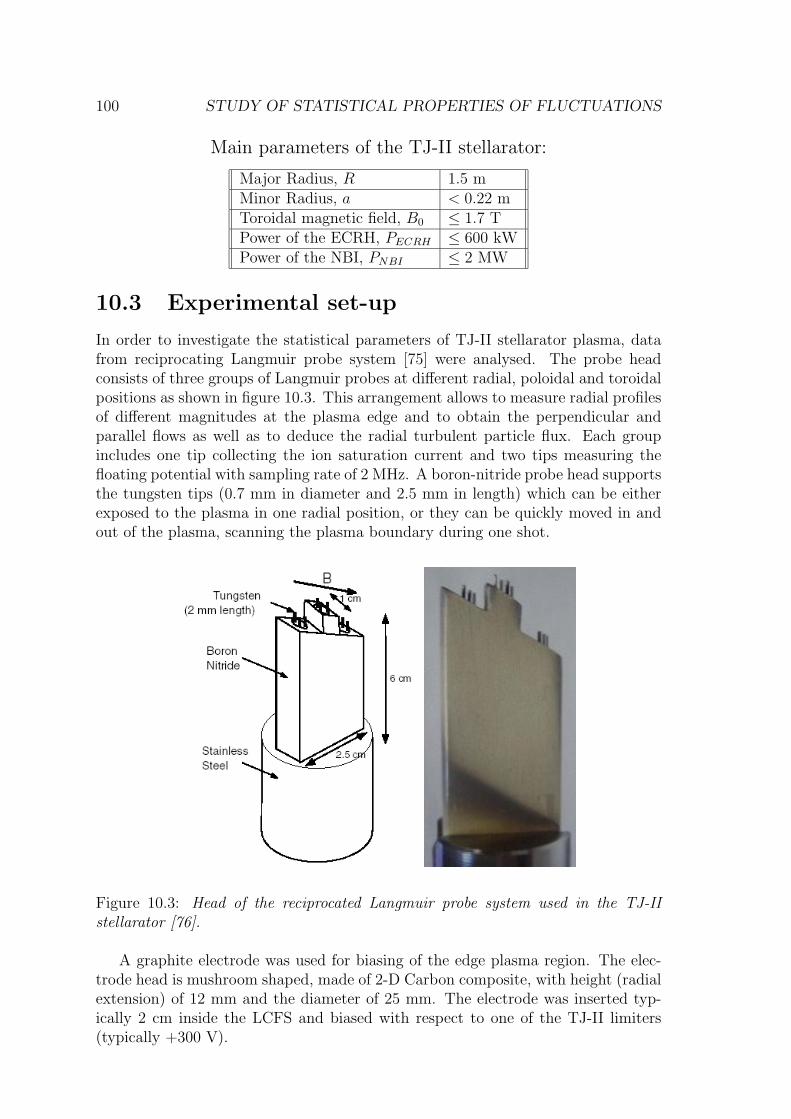
100 STUDY OF STATISTICAL PROPERTIES OF FLUCTUATIONS
Main parameters of the TJ-II stellarator:
Major Radius, R 1.5 mMinor Radius, a < 0.22 mToroidal magnetic field, B0 ≤ 1.7 TPower of the ECRH, PECRH ≤ 600 kWPower of the NBI, PNBI ≤ 2 MW
10.3 Experimental set-up
In order to investigate the statistical parameters of TJ-II stellarator plasma, datafrom reciprocating Langmuir probe system [75] were analysed. The probe headconsists of three groups of Langmuir probes at different radial, poloidal and toroidalpositions as shown in figure 10.3. This arrangement allows to measure radial profilesof different magnitudes at the plasma edge and to obtain the perpendicular andparallel flows as well as to deduce the radial turbulent particle flux. Each groupincludes one tip collecting the ion saturation current and two tips measuring thefloating potential with sampling rate of 2 MHz. A boron-nitride probe head supportsthe tungsten tips (0.7 mm in diameter and 2.5 mm in length) which can be eitherexposed to the plasma in one radial position, or they can be quickly moved in andout of the plasma, scanning the plasma boundary during one shot.
Figure 10.3: Head of the reciprocated Langmuir probe system used in the TJ-IIstellarator [76].
A graphite electrode was used for biasing of the edge plasma region. The elec-trode head is mushroom shaped, made of 2-D Carbon composite, with height (radialextension) of 12 mm and the diameter of 25 mm. The electrode was inserted typ-ically 2 cm inside the LCFS and biased with respect to one of the TJ-II limiters(typically +300 V).

IN THE PLASMA BOUNDARY OF THE TJ-II STELLARATOR 101
10.4 Shears in the TJ-II stellarator
Previous experiments have shown that the plasma density (or density gradient) playsa crucial role in establishing the Erad × Btor shear in the TJ-II stellarator [76]–[81].A threshold density has been identified to trigger the development of edge shearedflows. On the contrary, in plasmas with density below this threshold value, there isno natural shear.
The natural shear development mechanism can be described in the followingway. With increasing density the floating potential at the edge decreases. Whenthe density is above a critical value, the floating potential becomes negative and theshape of the radial electric field Erad develops: it becomes oriented radially inward.The Erad × Btor drift develops a poloidal velocity shear, the level of fluctuationsdecreases, the edge gradients increase and a transport barrier is established. Thesituation is shown in figure 10.4, where the radial profiles of the ion saturationcurrent (proportional to the density) and the floating potential for different valuesof the line averaged plasma density are plotted.
A similar effect can be obtained by imposing a radial electric field at the edgeplasma externally [82]. Experiments with biasing of the edge plasma by means ofan immersed electrode charged to a DC voltage with respect to the limiter haveshown a reduction of the turbulent transport and improvement of confinement. Theconfiguration enables reaching stronger Erad than in the case of the natural shearwhich results in establishing a higher transport barrier and better confinement.
-80
-40
0
40
0.85 0.9 0.95 1 1.05
Floa
ting
Pote
ntia
l (V
)
r/a
0
0.04
0.08
0.12
0.160.570.60.70.90.550.350.40.750.451
Ion
satu
ratio
n cu
rren
t (A
) ne (x 1019 m-3)
# 11152# 11154# 11155# 11156# 11157# 11158# 11159# 11168# 11170# 11172
Figure 10.4: Radial profiles of ion saturation current and the floating potential fordifferent values of the plasma density [77].

102 STUDY OF STATISTICAL PROPERTIES OF FLUCTUATIONS
10.5 Experimental results
To shed more light on the previous results, regimes with and without the naturalshear as well as regimes with imposed Erad×Btor shear were investigated. The mainoutstanding questions are:
• What is the role of the natural Erad ×Btor shear in the statistical parametersof fluctuations?
• How the situation changes by imposing an Erad × Btor shear externally?
• What is the role of the magnetic topology?
Radial profiles of the floating potential of evaluated shots in ohmic regime (bluetriangles) and during biasing (red diamonds) are presented in figure 10.5.
Figure 10.5: Radial profile of the floating potential during ohmic regime (blue trian-gles) and during biasing (red diamonds). The radial position r/a = 1 is the LCFS.
A broad spectrum of statistical properties was investigated: skewness, kurtosis1
and time asymmetry A of both ion saturation current and floating potential. Theclearest results of the statistical analyses come from the time asymmetry of thefloating potential A(Ufl), thus only this parameter will be discussed in the following.
Parameter A is defined as the skewness of time derivative of the fluctuating partof the signal [63]:
A =1
N
N−1∑
j=0
(
x′j − x′
√σ′2
)3
(10.1)
where N is the number of samples, x′j = dx/dt is the j-th element of the time deriva-
tive of the signal (x′j = [xj+1 − xj]/∆t where ∆t is time between two samples), and
x′j = xj+1−xj
∆tare defined as the mean value of x′ and the variance of x′, respectively,
according to (6.11) at page 55.
1See section 6.1.1 for the definitions.

IN THE PLASMA BOUNDARY OF THE TJ-II STELLARATOR 103
The A parameter shows the time asymmetry of the fluctuating part of the signal.For a signal symmetric in time, A = 0 and consequently the time derivative has aGaussian distribution. On the other hand, A < 0 is for the signal with structureswith, in average, shorter rising time than the decay time (in average). Finally, A > 0shows patterns which rise slower than they decay.
Let us see how to interpret the parameter A: In the SOL, blobs propagate fromthe LCFS outwards. We consider them to be mushroom-like shaped, consisting oftwo lobes, one with positive potential and one with negative, as described in [64, 65].They have a steep front edge and they carry high temperature and density. Whensuch blob passes over a probe, the floating potential shows a steep decrease in thestructure, since Ufl = Φ− 2.5Te and the overall plasma potential Φ does not changeon average. Fast drop and slow raise of the structures in Ufl corresponds to negativevalues of A(Ufl). In the context of our analysis, negative A implies the presence ofblobs.
Time evolution of the time asymmetry of floating potential (A(Ufl)) in differentradial positions is plotted in figure 10.6. The data were obtained on the shot-to-shotbasis, each panel thus corresponds to one shot and one radial position. The left twocolumns show shots with high density (natural shear). In fact, it is one columndivided in two running from the deepest position (top left plot) to the edge position(bottom right) of the probe. The right column shows low density data. The biasingphase of discharge is depicted by vertical lines. From the figure, we can concludefollowing:
1. Natural shear - high density regimes (n > nthreshold): A(Ufl) is negativeinside the VSL and tends to zero around the shear location. It is demonstratedin figure 10.6 in the left and centre panel, during the ohmic phase of thedischarge. According to our interpretation, this behaviour corresponds to thepresence of blobs inside the VSL, which are dissipated at the proximity of theVSL.
2. No natural shear - low density regimes (n < nthreshold): A(Ufl) is negativeat all radii, inside plasma it tends to come to zero as shown in figure 10.6 inthe right panel, during the ohmic phase of the discharge. Number of blobsincreases in the direction outwards.
3. Biasing induced shear flow: For the high density shots (n > nthreshold), thecharacteristics of A(Ufl) changes systematically in the radial direction. In theplasma region (r/a ≈ 0.83 − 0.91), it rises to positive values whereas outside(r/a ≈ 0.99 − 1.03) it becomes negative as shown in figure 10.6. Aroundthe shear layer, A(Ufl) remains unchanged, around zero. Similar trends havebeen found at low density. These experiments clearly show the importance ofelectric fields on the statistical properties (parameter A) of fluctuations. Thissituation is shown in figure 10.6 in the left and centre column (for high densityshots) and in the right column (for the low density shots), both during thebiasing phase of the discharge (depicted by black vertical lines). The drop ofthe A in the SOL implies an increase of blobs.
4. The role of magnetic topology: Previous investigations [66] were wellreproduced, showing that the time asymmetry of floating potential changes

104 STUDY OF STATISTICAL PROPERTIES OF FLUCTUATIONS
Figure 10.6: Time evolution of the time asymmetry of floating potential (A(Ufl))for different radial positions (r/a). Black diamonds correspond to the probe 1, whileblue one to the probe 2 of the central top group (see figure 10.3). Left and centrecolumns: regime with high density shots (n > nthreshold), radial positions of the probesrun from outward: from the top left panel to the bottom right one. Right column:regime with low density shots (n < nthreshold). The biasing phase is depicted by thevertical lines.

IN THE PLASMA BOUNDARY OF THE TJ-II STELLARATOR 105
with the magnetic topology, increasing significantly from the open field linesregion (SOL) to the region inside the LCFS as shown in figure 10.7. Insidethe plasma bulk, the development of Erad × Btor shear does not change thebehaviour of A(Ufl). The lower amplitudes of A in the SOL during the highdensity regimes (red lines) point to decrease of the number of blobs. This isan action which we expect from the natural shear.
Figure 10.7: Radial profile of time asymmetry of floating potential (named as Φf inthe original work) [66]. Blue lines: low density (no shear). Red lines: high density(natural shear).
10.6 Summary
In conclusion, the investigation of the statistical properties of fluctuations in theplasma boundary region of the TJ-II stellarator shows that the time asymmetry ofturbulent bursts is affected both by magnetic topology and the radial electric fields.This means that the mechanism leading to changes in the shape of turbulence inthe edge plasma is caused not only by the Erad × Btor shear, but it is also relatedto the magnetic topology.

106 STUDY OF STATISTICAL PROPERTIES OF FLUCTUATIONS

Part III
Ball-pen probe
107


Chapter 11
Introduction to the Ball-pen probemeasurements
A new probe, so-called “Ball-pen probe”, was developed in IPPPrague and used in the CASTOR tokamak, the RFX-mod reversedfield pinch and also in the ASDEX Upgrade tokamak. The probeis an innovative type of probe which is able to measure directly theplasma potential in magnetized plasmas. Moreover, plasma poten-tial fluctuations measurements can be used for evaluation of thediffusion coefficient using a technique presented in following chap-ters.
109

110 INTRODUCTION TO THE BALL-PEN PROBE MEASUREMENTS
Understanding the electric field and its turbulence in magnetic confinement devicesis a very important tasks in the fusion research as explained in previous chapters.Proper knowledge of the plasma potential is required for calculation of the electricfield and also for verification of numerical simulations of SOL [84, 85].
So far, we discussed only floating potential (Ufl) of the Langmuir probes in thisthesis. The electric field was estimated from Ufl, usually neglecting the gradient ofthe electron temperature. This step was justified in chapter 7. Precise values of theplasma potential and electron temperature can be obtained from swept Langmuirprobes (a harmonic voltage is applied to the probe in order to obtain the currentvoltage characteristics), which is a method with a poor time resolution. Anotherways of direct measurement of plasma potential are by means of emissive probes [86]and heavy ion beam probes [87], though these methods are also burdened by varioustechnical problems and peculiarities in measured data interpretation. The Ball-penprobe (BPP) is able to provide the plasma potential and the electron temperaturewith high time resolution.
Another important feature of the BPP is ability to estimate the plasma diffusioncoefficient. The diffusion coefficient is also one of demanding topics since its calcu-lation requires knowledge of the density gradient, the ion sound speed and furtherqualities as described in section 4.3.6.
The Ball-pen probe was developed in the Institute of Plasma Physics AS CRin Prague [19, 20, 88, 89]. It was used in several fusion facilities: in the CASTORtokamak [19, 20, 88, 89], in the ASDEX Upgrade tokamak [90], and in the reversedfield pinch RFX-mod [91].
11.1 Principle of the Ball-pen probe
The Ball-pen probe takes advantage of the difference between the electron and ionLarmor radii. It was developed on the basis of the Katsumata probe concept [92].The BPP is made of a ceramic tube with a metal collector of a conical shape insideas shown in figure 11.1. The axis of the probe head is oriented perpendicularly to
collector-stainless steel
tube-boron nitride
corundum-plasma sprayingh = 0 mmh = 0 mm
Figure 11.1: Ball-pen probe developed for the CASTOR tokamak. Left panel: aschematic illustration of the probe principle. Right panel: picture of the probe head.

INTRODUCTION TO THE BALL-PEN PROBE MEASUREMENTS 111
the magnetic field lines. The ions can penetrate deep into the ceramic shaft due totheir larger gyro-radii, while a certain part of the electrons is shielded. The collectorcan be used for measurements of either floating potential, or ion saturation current;it is movable with respect to the ceramic shaft.
According to the Langmuir probe theory for Maxwellian plasmas, the floatingpotential of the collector Ufl can be expressed as
Ufl = Φ − kBTe
eln
(
I−sat
I+sat
)
(11.1)
where Φ is the plasma potential, Te is the electron temperature, I−sat and I+
sat isthe electron and ion saturation current, respectively. For a certain position of thecollector within the shielding tube, the I−
sat and I+sat are balanced and the potential
of the floating BPP is equal to the plasma potential [19, 93].The diffusion coefficient is evaluated from the spatial decay of power spectra of
the BPP collector during ohmic discharge. The spectrum decays as the collector ispulled inside the shielding shaft; the decay is faster for higher frequencies. This isa typical behaviour of a diffusion process inside the probe. A model was developedand applied on experimental data, the results are published in articles presented innext two chapters.

112 INTRODUCTION TO THE BALL-PEN PROBE MEASUREMENTS

Chapter 12
A probe-based method formeasuring the transport coefficientin the tokamak edge region
Czechoslovak Journal of Physics, Vol. 56 (2006), No. 12.
113

114 CJoP 2006

Chapter 13
Novel Technique for DirectMeasurement of the PlasmaDiffusion Coefficient inMagnetized Plasma
Contributions to Plasma Physics, Vol. 48 (2008), No. 5-7.
123

124 CPP 2008

Chapter 14
Measurements with Ball-penprobe on RFX-mod
The Ball-pen probe was installed and tested in the RFX-mod re-versed field pinch in order to verify the behaviour of the probe inlow magnetic field (∼ 0.1 T). In this chapter, we give a short intro-duction to the RFX-mod facility, the new system for measurementsthe edge plasma parameters. Finally, we introduce the Ball-penprobe designed for the RFX-mod and we show preliminary resultsof calculations of the diffusion coefficient.
131

132 MEASUREMENTS WITH BALL-PEN PROBE ON RFX-MOD
14.1 The reversed field pinch configuration
A reversed field pinch (RFP) is a magnetic device of the same principle as tokamak:the plasma is confined by a strong magnetic field of helical shape and driven by astrong toroidal current induced by a transformer. The main difference is the shapeof the magnetic field and its temporal evolution.
While the toroidal magnetic field in tokamak is produced by external coils only,being ten times higher than the poloidal magnetic field and stationary during thedischarge, the situation in RFP is more complex. The plasma confinement in RFPsis achieved by both the toroidal and the poloidal magnetic fields which are of thesame order. Moreover, the toroidal magnetic field changes during the start-up phaseof the discharge; during the flat-top phase it remains constant.
At the beginning of the discharge, the Btor is generated by external coils only.When the plasma is formed, the poloidal component of the plasma current generatesan additional Btor in the inner part of the plasma column. It is worth noting thatthe helicity of RFP is much higher than of tokamak, thus this effect is negligible fortokamak, but significant for RFP. As the toroidal winding acts as a flux conservant,they respond to the rising toroidal field in the plasma core by decreasing and evenreversing it at the edge. The level of reversing is adjusted by the value of theplasma current, but it can be also controlled by external circuits. The magneticfield configuration is schematically shown in figure 14.1.
TOROIDAL
FIELD
POLOIDAL
FIELD
TOROIDAL
FIELD
POLOIDAL
FIELD
Figure 14.1: A scheme of magnetic field in RFP during the flat-top phase of dis-charge. The toroidal magnetic field in edge region has the opposite direction than inthe centre of the vessel.
Parameters describing the RFP configuration are the pinch parameter
Θ =Bpol(a)
< Btor >(14.1)
and the reversal parameter
F =Btor(a)
< Btor >(14.2)

MEASUREMENTS OF THE BALL-PEN PROBE ON RFX-MOD 133
where Bpol(a) and Btor(a) are the poloidal and the toroidal components of the mag-netic field at the wall position and < Btor > is the toroidal magnetic field averagedover the plasma cross-section.
14.2 RFX-mod experiment
The Reversed Field eXperiment (RFX) reversed field pinch, operating in the Con-sorzio RFX in Padova, Italy, was recently modified (RFX-mod, see figure 14.2) inorder to increase the passive and active control of magnetohydrodynamic modes[94]. For this, the former aluminium shell was replaced by a new copper one, withsignificantly lower time constant [95]. The new system consisting of 192 saddle coilsinstalled inside the machine. It provides the active control of magnetic instabilities.Moreover, a new integrated system of internal sensors (ISIS) has been installed inorder to detect the electrostatic and magnetic fluctuations [95, 96].
Main parameters of the RFX-mod:
Major Radius, R 2.0 mMinor Radius, a 0.5 mMaximum plasma current, I 2.0 MAMaximum applied toroidal field 0.7 TCurrent rise time 15 − 50 msFlat top time 250 msCore flux swing 15 V·sInductive storage 72.5 MJ
Figure 14.2: RFX-mod experiment.

134 MEASUREMENTS WITH BALL-PEN PROBE ON RFX-MOD
14.3 Characteristics of turbulence in RFX-mod
Set-up and parameters of the ISIS system
The ISIS system [96, 97] consists of a large set of Langmuir probes placed on thefirst wall of the RFX-mod device [98] and of magnetic probes installed 16 mm belowthe tiles covering the first wall: 131 magnetic pick-up coils, 97 electrostatic probes,8 saddle coils and 8 calorimetric sensors. The probe layout is complex; the mainfeatures are the presence of one full toroidal array of 72 Langmuir probes and of twotoroidal arrays of 96 magnetic probes each. One poloidal array of each kind of probesis also present. As another diagnostics for detecting the plasma turbulence, the gas-puffing imaging (GPI) diagnostics [99] with range of 40 mm is used. A picture ofthe RFX-mod chamber inner walls with depicted positions of some electrostatic andmagnetic probes is in figure 14.3.
electrostaticsensors
magneticpick-up coils
Figure 14.3: RFX-mod vacuum vessel from inside. The magnetic pick-up coils arebelow the carbon tiles, the electric sensors are protruding from apertures in the tiles.
Example of the power spectra in RFX-mod
An example of typical power spectra in the SOL of the RFX-mod is in figure 14.4.The spectra were obtained from the electrostatic probes and magnetic sensors ofISIS and from the GPI system. The power spectra show similar characteristics toother fusion facilities as described in [100, 101]. This fact implies universality of theturbulence and turbulent transport in spite of the one order lower magnetic field.
14.4 Experimental set-up of the Ball-pen probe
measurements
The Ball-pen probe for the RFX-mod experiment consists of four collectors at fixedpositions placed inside a single ceramic holder (boron nitride) as shown in figure14.5. Radial profile of plasma potential and electron temperature was obtainedfrom averaged values of the collector potential inside the shaft and published in

MEASUREMENTS OF THE BALL-PEN PROBE ON RFX-MOD 135
Figure 14.4: Typical power spectra, #16247 (normalized). Black curve representsan electrostatic probe, green and blue are from magnetic probes and red is from theGPI.
[91]. The decay of the plasma potential fluctuations inside the shaft was used forevaluation of the diffusion coefficient [33].
Two shot series with different F parameter were performed for the measurementsof floating potential of the Ball-pen collectors. First series was performed withF = −0.2, the second one with F = −0.04.
The Ball-pen probe was inserted from the LFS at the mid plane. The measure-ments were taken with different radial positions of the Ball-pen probe on shot-to-shotbasis.
Ball-pen probes(collectors)
boron nitride
stainless steelholder
10
0 m
m
Figure 14.5: Ball-pen probe head for the experiment on RFX-mod.

136 MEASUREMENTS WITH BALL-PEN PROBE ON RFX-MOD
14.5 Evaluation of the diffusion coefficient
Fluctuations of the plasma potential decrease for deeper positions of the collector.The power spectra of the potential fluctuations show an exponential decay withfrequency as shown in figure 14.6. In some cases, however, the behaviour of thepower spectra has a different character than diffusion (higher frequencies drop fasterfor more shallow positions of the collector). Further analyses connected with otherdiagnostics (mainly magnetic) must be performed to explain this phenomenon.
Figure 14.6: Example of power spectra obtained by the Ball-pen probe collectors withdifferent depth h. Measurement was performed at the RFX-mod.
The diffusion coefficient (D) was evaluated by the method described in chapters12, 13 for both series. To do so, we combined many parameters, like frequencyintervals and number of slices used for the statistical evaluation of power spectra.We obtained radial profiles of the diffusion coefficient.
For the F = −0.2, D ranges from 10 m2/s to 120 m2/s as shown in figure 14.7.Close to the limiter, D takes the lowest values and increases to the centre. Inside theplasma, after 30 − 40 mm, D tends to drop again. In the area behind the limiter,D increases in the direction outwards. The increase of D in the edge plasma isconsistent with evaluation of D by other methods, namely by Langmuir probes anda homodyne reflectometer [102].
For F = −0.04, the situation is less clear. D varies from 10 to 50 m2/s in theedge, in the positions deeper than 10 mm, D tends to increase to values around100. It is problematic to use our method in this discharge regime since behaviour ofthe power spectra showing opposite trend than diffusion occurs more often in thisseries. More experiments and analyses need to be done to clarify this phenomenon,as mentioned above.

MEASUREMENTS OF THE BALL-PEN PROBE ON RFX-MOD 137
Figure 14.7: Radial profile of diffusion coefficient for the reversal parameter F =−0.2 obtained by several combinations of the fitting parameters: asterisks are for5 ms of time window and the signal divided into 50 slices for evaluation of powerspectra. Rectangles denote 10 ms, 50 slices, crosses are for 15 ms, 50 slices andtriangles represent 5 ms, 40 slices. Frequency interval used for evaluation of D is30 − 90 kHz. The vertical line depicts the limiter position.

138 MEASUREMENTS WITH BALL-PEN PROBE ON RFX-MOD

Part IV
Conclusions
139


Chapter 15
Conclusions
The main results of the work carried out in the scope of my PhDstudies are summarized in this chapter.
141

142 CONCLUSIONS
Work on this PhD thesis was carried out mainly at the Institute of Plasma Physicsof the Academy of Sciences of Czech Republic, part of it was done at the TJ-IIstellarator in Madrid and at the RFX-mod reversed field pinch in Padova. It wasfocused on the study of the edge plasma turbulence by means of electric probesand on the development of new diagnostic tools for measurements in the plasmaboundary region. The thesis can be summarized in the following points. Referencesto the relevant publications are given in chapter 16: section 16.1 lists the journalarticles, section 16.2 the conference proceedings and section 16.3 my own presenta-tions at international conferences - presentations of my colleagues on similar topicsare not included. The journal articles and conference proceedings where I am thefirst author are emphasized in bold font.
Part I - Introduction
The first part is devoted to an overview of fusion research and to some basics abouttokamak configurations. The CASTOR tokamak was introduced along with thediagnostic tools used for measurements in this thesis. The geometry of the edgeplasma and transport at the edge was briefly described, targeting the special featuresof the CASTOR tokamak.
Experiments with improved confinement were compared with experiments instandard regimes. The global plasma parameters were shown as well as the radialprofiles of the floating potential, radial electric field and ion saturation current atthe plasma edge.
In the last section, the statistical tools used for the experimental data analyseswere described.
The results with my participation relevant to the Part I were published in [16.1-10], [16.2-1], [16.2-8] and [16.2-13].
Part II - Fluctuation measurements
In this part, the measurements of edge plasma fluctuations mainly by means of arraysof electric probes are presented. The results were presented at several internationalconferences and published in journals.
1. Measurements of sheared electric fields and flows at theplasma edge of the CASTOR tokamak
• The experimental data were collected by the double rake probe and thepoloidal ring of Langmuir probes.
• Two methods for evaluation of the phase velocity were used: exploitingthe cross-correlation and the cross-coherence.
• The poloidal phase velocity of fluctuations was established from signalsof adjacent Langmuir probes placed in different poloidal positions.
• A radial profile of the velocity was obtained and compared to a theoreticalcalculation from the Erad × Btor drift.
CONCLUSIONS 143
• The radial position of the velocity shear layer was determined with highprecision (∼ 1 mm).
• A simple model was introduced to judge the error of the poloidal phasevelocity estimation introduced by its radial component.
• A radial profile of the inverse of the correlation time of fluctuations 1/τac
was calculated and compared to the Erad ×Btor shearing rate in order toexamine the impact of the velocity shear on the turbulence.
• The shearing rate was found to be of the same values as the 1/τac outsidethe VSL, but about five times higher in the proximity of the VSL.
• A small reduction of the relative level of fluctuatuations at the VSL isobserved in the statistical parameters of the Ufl and Isat signals.
• It was concluded that the system is in the state of marginal stabilityoutside the VSL, while in the proximity of the VSL, the shear slightlydissipates the turbulent structures.
• The results were published in [16.1-4], [16.1-6], [16.1-7], [16.1-8], [16.2-17] and presented in conferences [16.3-10], [16.3-12].
2. Investigation of the CASTOR SOL by means of 2D ma-trix of Langmuir probes
• Magnetic field lines in the edge plasma region of the CASTOR tokamakwere mapped by the biasing electrode and the 2 dimensional matrix ofLangmuir probes: an alternating voltage was applied to the electrodeand the power spectrum for this particular frequency clearly showed theprojection of the biasing electrode in the 2D array of probes.
• The safety factor q was established in agreement with a theoretical cal-culation.
• Toroidal structures were mapped by evaluation of cross-correlations ofthe tips of the rake probe and the 2D array of probes. The poloidal andradial extents of turbulent structures were established.
• Formation of a convective cell around a biased flux tube was explored.The poloidal phase velocity was evaluated around the convective cell fromthe data from the 2D array of probes to show the impact of the stronglocal Erad × Btor drift.
• The results were published in [16.2-1], [16.2-2] and presented in confer-ence [16.3-2].
3. Analyses of relaxation events in the CASTOR tokamakusing deeply immersed biasing electrode
• It was found that a strong transport barrier is established during certainregimes with improved confinement. The barrier periodically collapsesand rises with the frequency of approximately 10 kHz.

144 CONCLUSIONS
• The transport barrier was described in detail by temporal evolution ofradial profiles of the floating potential, radial and poloidal electric fieldand the ion saturation current. The poloidal symmetry of the barrier wasdemonstrated.
• The flow velocities showed an interplay between the toroidal and thepoloidal flow.
• The magnetic activity indicated a significant redistribution of the currentdensity profile deep inside the plasma column.
• The results were published in [16.1-1], [16.1-5], [16.1-8], [16.1-9], [16.2-3],[16.2-6], [16.2-7], [16.2-12] and presented in conference [16.3-5].
4. Study of statistical properties of fluctuations in the plasmaboundary region of the TJ-II stellarator
• Statistical parameters of the fluctuations at the plasma boundary of theTJ-II stellarator were studied in detail in order to clarify what is therole of the natural and the imposed Erad × Bpol shear and the magnetictopology in properties of the statistical parameters.
• The analyses have shown that the mechanism leading to changes in theshape of turbulence in the edge plasma is caused not only by the Erad ×Bpol shear, but is also related to the magnetic topology.
• The results were published in [16.2-11], and presented in conference[16.3-7].
Part III - Ball-pen probe
In the IPP Prague, a new diagnostic tool called “Ball-pen probe” (BPP) for directmeasurements of the plasma potential and electron temperature with high temporalresolution has been developed. Apart of this, the probe enables also an estimation ofthe diffusion coefficient by means of calculating a decrease of high frequencies insidethe BPP shaft. A method for evaluating the diffusion coefficient was developed andpublished in two journal articles. Radial profiles of the diffusion coefficient for severalregimes (different magnetic field) were obtained for the CASTOR tokamak andcompared with the Bohm’s diffusion derived from the electron temperature profile.Preliminary calculations at the RFX-mod reversed field pinch were performed anda radial profile of the diffusion coefficient was obtained as well. The results werepublished in [16.1-2], [16.1-3], [16.1-11], [16.1-12], [16.1-13], [16.2-4], [16.2-5],[16.2-15], [16.2-16] and presented in conferences [16.3-3], [16.3-4], [16.3-8], [16.3-11].
Fusion research is a team work owing to the complexity of the investigated problems.So it was also in my case. Apart from the visits abroad, where I was a guest in ex-perimental campaigns, I had participated in a number of domestic and internationalcampaigns at the CASTOR tokamak. My task was not only to process the data, but

CONCLUSIONS 145
also to take care of the experiment: To connect the diagnostics to the data acqui-sition system, to run the machine, to solve minor problems with discharge regimesas well as with the probes and to arrange the configuration of experiment accordingto current needs during the campaigns. This flexibility makes measurements at theCASTOR tokamak very efficient and desirable also for scientists from large facilitiesabroad. All this work was, of course, possible only with help of the technicians, whowere taking care of the vacuum, fabricating the probes and installing them into thediagnostic ports, and of my colleagues, mainly my supervisor, who taught me howto control the machine and who was always helpful in cases of major problems withthe discharge.
A new tokamak – COMPASS – was moved and reinstalled at the Institute ofPlasma Physics AS CR, v.v.i. in Prague [103]. The COMPASS (COMPact ASSem-bly), originally working at Culham in Great Britain as COMPASS-C (with circularplasma cross-section in 1989–1991) and as COMPASS-D (with divertor in 1992–2001), was offered to our institute and transferred in autumn 2007. I was partici-pating in reinstallation, namely in development of a new high resolution Thomsonscattering diagnostics. The results were published in [16.2-9], [16.2-10], [16.2-14]and presented in conferences [16.3-6], [16.3-9].
Finally, a part of my work was devoted to education of new scientists. TokamakCASTOR is a place where students from Czech universities and from abroad cometo gain experience and to collect experimental data for their bachelor, master andPhD theses and where Summer schools in plasma physics take place. I was involvedin these activities as well. The results were published in [16.1-7], [16.2-13] andpresented in conference [16.3-1]. During the Summer Training Course SUMTRAIC2004, a conclusion was made which fully reflects my personal attitude to the plasmaphysics research, as shown in figure 15.1.
Figure 15.1: My personal approach to the research of plasma turbulence at the edgeof fusion facilities as concluded in the Summer Training Course SUMTRAIC 2004.

146 CONCLUSIONS

Chapter 16
List of publications
147

148 LIST OF PUBLICATIONS
16.1 Publications in scientific journals
1. M. Spolaore, E. Martines, J. Brotankova, J. Stockel, J. Adamek, E. Dufkova,I. Duran, M. Hron, V. Weinzettl, P. Peleman, G. Van Oost, P. Devynck,H. Figueiredo, G. Kirnev, Relaxation phenomena during edge plasma biasingin the CASTOR tokamak, Czechoslovak Journal of Physics Vol. 55, No.12,p. 1597-1606, 2005.
2. R. Schrittwieser, J. Adamek, C. Ionita, J. Stockel, J. Brotankova, E. Martines,G. Popa, C. Costin, L. Van de Peppel, G. Van Oost, Direct measurementsof the plasma potential by katsumata-type probes, Czechoslovak Journal ofPhysics, Suppl. B., Vol. 56, p. 145-150, 2006.
3. J. Brotankova, E. Martines, J. Adamek, J. Stockel, G. Popa, C. Costin, R.Schrittwieser, C. Ionita, G. Van Oost, A probe-based method for measuringthe transport coefficient in the tokamak edge region, Czechoslovak Journal ofPhysics, Vol. 56, No.12, p. 1321-1327, 2006.
4. P. Devynck, J. Brotankova, P. Peleman, M. Spolaore, H. Figueiredo, M. Hron,G. Kirnev, E. Martines, J. Stockel, G. Van Oost, V. Weinzettl, Dynamics ofturbulent transport in the scrape-off layer of the CASTOR tokamak, Physicsand Plasmas, Vol. 13, No. 10, 102505-102513, 2006.
5. J. Stockel, M. Spolaore, J. Brotankova, J. Horacek, R. Dejarnac, P. Devynck,I. Duran, J.P. Gunn, M. Hron, M. Kocan, E. Martines, R. Panek, P. Peleman,A. Sharma, G. Van Oost, Dynamics of the edge transport barrier at plasmabiasing on the CASTOR tokamak, Voprosy Atomnoj Nauki I Tekhniky (Prob-lems of Atomic Science and Technology: Plasma Physics), No. 6, p. 9-23, 2006.
6. G. Van Oost, V.V. Bulanin, A.J.H. Donne, E.Z. Gusakov, A. Kraemer-Flecken,L.I. Krupnik, A. Melnikov, S. Nanobashvili, P. Peleman, K.A. Razumova,J. Stockel, V. Vershkov, J. Adamek, A.B. Altukov, V.F. Andreev, L.G. Ask-inazi, I.S. Bondarenko, J. Brotankova, A. Yu. Dnestrovskij, I. Duran, L.G.Eliseev, L.A. Esipov, S.A. Grashin, A.D. Gurchenko, G.M.D. Hogeweij, M.Hron, C. Ionita, S. Jachmich, S.M. Khrebtov, D.V. Kouprienko, S.E. Lysenko,E. Martines, S.V. Perfilov, A.V. Petrov, A.Yu. Popov, D. Reiser, R. Schrit-twieser, S. Soldatov, M. Spolaore, A.Yu. Stepanov, G. Telesca, A.O. Urazbaev,G. Verdoolaege, F. Zacek, O. Zimmermann, Multi-machine studies of the roleof turbulence and electric fields in the establishment of improved confinementin tokamak plasmas, Plasma Physics and Controlled Fusion Vol 49 (5A): A29-A44, 2007.
7. G. Van Oost, M. Berta, J. Brotankova, R. Dejarnac, E. Del Bosco, E. Dufkova,I. Duran, M.P. Gryaznevich, M. Hron, A. Malaquias, G. Mank, P. Peleman,J. Sentkerestiova, J. Stockel, V. Weinzettl, S. Zoletnik, J. Ferrera, A. Fonseca,H. Hegazy, Y. Kuznetsov, A. Ossyannikov, A. Sing, M. Sokholov, A. Talebita-her, Joint experiments on small tokamaks: edge plasma studies on CASTOR,Nuclear Fusion Vol. 47 (5): p. 378-386, May 2007.
LIST OF PUBLICATIONS 149
8. J. Stockel, J. Adamek, P. Balan, O. Bilyk, J. Brotankova, R. Dejarnac, P. De-vynck, I. Duran, J.P. Gunn, M. Hron, J. Horacek, C. Ionita, M. Kocan,E. Martines, R. Panek, P. Peleman, R. Schrittwieser, G. Van Oost, F. Za-cek, Advanced probes for edge plasma diagnostics on the CASTOR tokamak,Journal of Physics: Conference Series 63, 012001, 2007.
9. P. Peleman, Y. Xu, M. Spolaore, J. Brotankova, P. Devynck, J. Stockel, G. VanOost, C. Boucher, Highly resolved measurements of periodic radial electric fieldand associated relaxations in edge biasing experiments, Journal of NuclearMaterials Vol. 17 363-365, p. 638-642, 2007.
10. R. Dejarnac, J.P. Gunn, J. Stockel, J. Adamek, J. Brotankova, C. Ionita,Study of ion sheath expansion and anisotropy of the electron parallel energydistribution in the CASTOR tokamak, Plasma Physics and Controlled FusionVol. 49, No. 10, p. 1791-1808, 2007.
11. J. Brotankova, E. Martines, J. Adamek, J. Stockel, G. Popa, C. Costin, R.Schrittwieser, C. Ionita, G. Van Oost, Novel technique for direct measure-ment of the plasma diffusion coefficient in magnetised plasma, Contributionsto Plasma Physics Vol. 48, No. 5-7, p. 418-423, 2008.
12. J. Adamek, M. Kocan, R. Panek, J. P.Gunn, E. Martines, J. Stockel, C. Ionita,G. Popa, C. Costin, J. Brotankova, R. Schrittwieser, G. Van Oost, Simultane-ous Measurements of Ion Temperature by Katsumata and Segmented TunnelProbe, Contributions to Plasma Physics Vol. 48, No. 5-7, p. 395-399, 2008.
13. J. Adamek, V. Rohde, H.W. Muller, A. Herrmann, C. Ionita, R. Schrittwieser,F. Mehlmann, J. Stockel, J. Horacek, J. Brotankova a and ASDEX UpgradeTeam, Direct measurements of the plasma potential in ELMy H-mode plasmawith ball-pen probes on ASDEX Upgrade tokamak, Journal of Nuclear Mate-rials, doi:10.1016/j.jnucmat.2009.01.286, 2009.
16.2 Publications in conference proceedings
1. J. Stockel, P. Devynck, J. Gunn, E. Martines, G. Bonhomme, G. Van Oost, M.Hron, J. Adamek, J. Brotankova, R. Dejarnac, I. Duran, T. Gorler, T. Hansen,R. Panek, P. Stejskal, V. Svoboda, F. Zacek, Formation of convective cells inthe scrape-off layer of the CASTOR tokamak, 12th ICPP, Nice (France), 2004.
2. J. Brotankova, J. Stockel, E. Martines, G. Van Oost, V. Svoboda, T. Gorler,T. Hansen, Fluctuation measurements with 2D matrix of Langmuir probeson the CASTOR tokamak, 32th EPS Plasma Physics Conference, EPC, 29C,P5.018 (4 pages), Tarragona (Spain), 2005.
3. M. Spolaore, J. Brotankova, P. Peleman, P. Devynck, H. Figueiredo, G. Kirnev,E. Martines, J. Stockel, G. Van Oost, J. Adamek, E. Dufkova, I. Duran,M. Hron, V. Weinzettl, Relaxation phenomena during edge plasma biasing

150 LIST OF PUBLICATIONS
in the CASTOR tokamak, 32th EPS Plasma Physics Conference, EPC, 29C,P4.031 (4 pages), Tarragona (Spain), 2005.
4. J. Brotankova, E. Martines, J. Adamek, G. Popa, C. Costin, R. Schrittwieser,C. Ionita, J. Stockel, G. Van Oost, L. van de Peppel, A new probe-basedmethod for measuring the diffusion coefficient in the tokamak edge region,33rd EPS Plasma Physics Conference, EPC, 30I, P2.195 (4 pages), Roma(Italy), 2006.
5. R. Schrittwieser, J. Adamek, C. Ionita, J. Stockel, E. Martines, J. Brotankova,G. Popa, C. Costin, G. Van Oost, L. van de Peppel, Direct Measurements ofthe Plasma Potential by Katsumata-type Probes, 33rd EPS Plasma PhysicsConference, EPC, 30I, P4.196 (4 pages), Roma (Italy), 2006.
6. M. Hron, P. Peleman, M. Spolaore, R. Dejarnac, O. Bilykova, J. Brotankova,J. Sentkerestiova, I. Duran, L. van de Peppel, J. Gunn, J. Stockel, G. Van Oost,J. Horacek, J. Adamek, M. Stepan, Detailed measurements of momentumbalance during the periodic collapse of a transport barrier, 33rd EPS PlasmaPhysics Conference, EPC, 30I, P4.076 (4 pages), Roma (Italy), 2006.
7. J. Brotankova, J. Stockel, M. Hron, M. Stepan, M. Peterka, J. Horacek, I. Du-ran, M. Spolaore, P. Peleman, Deep analysis of relaxation events in the CAS-TOR tokamak using deeply immersed biasing electrode, WDS’06 Proceed-ings of Contributed Papers: Part II - Physics of Plasmas and Ionized Media,Prague, Matfyzpress, p. 127–132, 2006.
8. J. Stockel, J. Brotankova, M. Hron, J. Adamek, I. Duran, G. Van Oost, P.Peleman, J. Gunn, P. Devynck, E. Martines, R. Schrittwieser, M. Kocan,Edge plasma diagnostics in tokamaks, Proceedings of the Sixth Internationalworkshop and school ”Towards Fusion Energy – Plasma Physics, Diagnostics,Spin-offs”, Kudowa Zdroj (Poland), p. 910-935, 2006.
9. J. Brotankova, P. Belsky, R. Barth, H. van der Meiden, V. Weinzettl, P. Bohm,M. Aftanas, New High Resolution Thomson Scattering system for the COM-PASS tokamak, WDS’07 Proceedings of Contributed Papers: Part II - Physicsof Plasmas and Ionized Media, Matfyzpress, p. 218–223, 2007.
10. M. Aftanas, P. Belsky, P. Bohm, V. Weinzettl, J. Brotankova, R. Barth, H. vander Meiden, Exploitation of Avalanche Photodiodes for Thomson ScatteringDiagnostics in Tokamaks, WDS’07 Proceedings of Contributed Papers: Part II- Physics of Plasmas and Ionized Media, Matfyzpress, p. 224–228, 2007.
11. J. Brotankova, R.O. Orozco, M.A. Pedrosa, C. Hidalgo, E. Sanchez, J. Stockel,Study of the statistical properties of fluctuations in the plasma boundary re-gion of the TJ-II stellarator, Proceedings of 34th EPS Conference on PlasmaPhysics (Plasma Physics Reports), P1.086 (4 pages), Warsaw (Poland), 2007.
12. J. Stockel, J. Adamek, J. Brotankova, R. Dejarnac, P. Devynck, I. Duran,J. Gunn, J. Horacek, M. Hron, M. Kocan, E. Martines, P. Peleman, R. Panek,

LIST OF PUBLICATIONS 151
M. Spolaore, G. Van Oost, Survey of results on plasma biasing in the CASTORtokamak, Proceedings of 34th EPS Conference on Plasma Physics (PlasmaPhysics Reports), P2–031–P2–031, Warsaw (Poland), 2007.
13. M.P. Gryaznevich, G. Van Oost, E. Del Bosco, M. Berta, J. Brotankova, R. De-jarnac, E. Dufkova, I. Duran, M. Hron, J. Zajac, A. Malaquias, G. Mank, P.Peleman, J. Sentkerestiova, J. Stockel, V. Weinzettl, S. Zoletnik, B. Tal, J.Ferrera, A. Fonseca, H. Hegazy, Y. Kuznetsov, L. Ruchko, G.M. Vorobjev,A. Ossyannikov, E. Sukhov, A. Sing, B. Kuteev, A. Melnikov, V. Vershkov,N. Kirneva, G. Kirnev, V. Budaev, M. Sokolov, A. Talebitaher, P. Khorsid,R. Gonzales, I. El Chama Neto, A.E. Kraemer-Flecken, V. Soldatov, A.M.Marques Fonseca, C.R. Gutierrez-Tapia, L.I. Krupnik, Progress on joint ex-periments on small tokamaks, Proceedings of 34th EPS Conference on PlasmaPhysics (Plasma Physics Reports), P1.070 (4 pages), Warsaw (Poland), 2007.
14. J. Brotankova, P. Belsky, R. Barth, H. van der Meiden, V. Weinzettl, P. Bohm,M. Aftanas, Development of New High Resolution Thomson Scattering systemfor the COMPASS tokamak, Proceedings of the 13th International Symposiumon LASER-AIDED PLASMA DIAGNOSTICS: NIFS-PROC-68, Takayama(Japan), p. 130–133, 2007.
15. J. Brotankova, J. Adamek, E. Martines, J. Stockel, M. Spolaore, R. Cavazzana,G. Serianni, N. Vianello, M. Zuin, Measurements of plasma potential andelectron temperature by Ball-pen probes in RFX-mod, Problems of AtomicScience and Technology No. 1, Series: Plasma Physics (15), p. 16-18, January2009.
16. J. Brotankova, J. Stockel, I. Duran, M. Hron, G. Van Oost, Measurement ofSheared Flows at the Plasma Edge of the CASTOR Tokamak, Proceedings ofthe 18th IAEA Technical Meeting on Research Using Small Fusion Devices,submitted for publication.
17. J. Brotankova, J. Stockel, M. Hron, I. Duran, J. Horacek, G. Van Oost, De-tailed measurements of poloidal velocity of density and floating potential fluc-tuations in the edge plasma of the CASTOR tokamak, WDS’08 Proceedingsof Contributed Papers: Part II - Physics of Plasmas and Ionized Media, Mat-fyzpress, p. 94-99, 2008.
16.3 Presentations at international conferences
1. Arun K. Sarma, I. Uytdenhouwen, S. Yordanova, E. Dufkova, E. El-demerdash,S. Shalaby, F. Valk, T. Szepesi, M. Sziberth, M. Kocan, M. Tarana, J. Brotan-kova, poster at the SUMTRAIC 2004, 22th Symposium on Plasma Physicsand Technology, Prague (Czech Republic), 2004.
2. J. Brotankova, J. Stockel, E. Martines, G. Van Oost, V. Svoboda, T. Gorler,T. Hansen, Fluctuation measurements with 2D matrix of Langmuir probes on

152 LIST OF PUBLICATIONS
the CASTOR tokamak, poster at the 32th EPS Plasma Physics Conference,Tarragona (Spain), 27 June – 1 July, 2005.
3. J. Brotankova, E. Martines, J. Adamek, G. Popa, C. Costin, R. Schrittwieser,C. Ionita, J. Stockel, G. Van Oost, L. van de Peppel, A new probe-basedmethod for measuring the diffusion coefficient in the tokamak edge region,poster at the 33rd EPS Plasma Physics Conference, Roma (Italy), June 19–23, 2006.
4. J. Brotankova, E. Martines, J. Adamek, G. Popa, C. Costin, R. Schrittwieser,C. Ionita, J. Stockel, G. Van Oost, L. van de Peppel, A new probe-basedmethod for measuring the diffusion coefficient in the tokamak edge region,oral contribution at the 9th wokshop on the Electric Fields, Structures, andRelaxation in Plasmas, Roma (Italy), June 26–27, 2006.
5. J. Brotankova, M. Spolaore, J. Stockel, P. Peleman, M. Hron, Stepan, Deepanalysis of relaxation events on the CASTOR tokamak, oral contributionat the WDS’06, Prague (Czech Republic), June 6–9, 2006.
6. J. Brotankova, P. Belsky, R. Barth, H. van der Meiden, V. Weinzettl, P. Bohm,M. Aftanas, New High Resolution Thomson Scattering system for the COM-PASS tokamak, oral contribution at the WDS’07, Prague (Czech Republic),June 5–8, 2007.
7. J. Brotankova, R.O. Orozco, M.A. Pedrosa, C. Hidalgo, E. Sanchez, J. Stockel,Study of the statistical properties of fluctuations in the plasma boundary re-gion of the TJ-II stellarator, poster at the 34th EPS Plasma Physics Confer-ence, Warsaw (Poland), July 2-6, 2007.
8. J. Brotankova, E. Martines, J. Adamek, J. Stockel, G. Popa, C. Costin, R.Schrittwieser, C. Ionita, G. Van Oost, Novel technique for direct measurementof the plasma diffusion coefficient in magnetised plasma, oral contribution atthe 7th International Workshop on Electrical Probes in Magnetized Plasmas,Prague (Czech Republic), July 22–25, 2007.
9. J. Brotankova, P. Belsky, R. Barth, H. van der Meiden, V. Weinzettl, P. Bohm,M. Aftanas, Development of New High Resolution Thomson Scattering sys-tem for the COMPASS tokamak, oral contribution at the 13th InternationalSymposium on Laiser-Aided Plasma Diagnostics, Takayama (Japan), Septem-ber 18–21, 2007.
10. J. Brotankova, J. Stockel, M. Hron, I. Duran, J. Horacek, G. Van Oost, De-tailed measurements of poloidal velocity of density and floating potential fluc-tuations in the edge plasma of the CASTOR tokamak, oral contribution atthe WDS’08, Prague (Czech Republic), June 3–6, 2008.
11. Presented by J. Stockel: J. Brotankova, J. Adamek, E. Martines, J. Stockel,M. Spolaore, R. Cavazzana, G. Serianni, N. Vianello, M. Zuin, Measurementsof plasma potential and electron temperature by Ball-pen probes in RFX-mod, oral contribution at the 3-rd International Workshop on the Role of
LIST OF PUBLICATIONS 153
Electric Fields in Plasma Confinement in Stellarators and Tokamaks, Alushta(Crimea, Ukraine), September 22–27, 2008.
12. Presented by J. Stockel: J. Brotankova, J. Stockel, I. Duran, M. Hron, G. VanOost, Measurement of Sheared Flows at the Plasma Edge of the CASTORTokamak, poster at the 18th IAEA Technical Meeting on Research UsingSmall Fusion Devices, Alushta (Crimea, Ukraine), September 25–27, 2008.
16.4 Stays abroad
• September 2003 (2 weeks): 5th Carolus Magnus Summer School on Plasmaand Fusion Energy Physics, Bruxelles, Belgium.
• May, June 2005 (6 weeks): reversal field pinch RFX-mod, Consorzio RFX,Padova, Italy.
• November 2006 (5 weeks): stellarator TJ-II, CIEMAT, Madrid, Spain.
• March 2007 (1 week): FOM Institute of Plasma Physics Rijnhuizen, Nether-lands.
• October 2007 (2 weeks): reversal field pinch RFX-mod, Consorzio RFX, Padova,Italy.

154 LIST OF PUBLICATIONS

APPENDIX
A-1 Toroidal magnetic field
In the frame of my thesis, I have performed a detailed analyses of the generation ofthe toroidal magnetic field Btor.
The toroidal magnetic field (Btor) is induced via 28 poloidal field coils each with11 turns (Ltot = 2.8 mH as shown in following) connected in series to the capacitorbank (C = 0.229 F). Capacitors can be charged to voltage U up to 2000 V. In thestandard regime, U = 1084 V which generates Btor = 1 T. The parameters, however,allow to operate with Btor up to 1.2 T. Current flowing through the coils is up to20 kA. The maximum of Btor is at the axis of the torus and it decreases with themajor radius as 1/R, as illustrated in figure 16.1 by the blue line. The part of thechamber close to the main axis is thus called High Field Side (HFS), while the partfarther is indicated as Low Field Side (LFS).
limiter
core
chamber axis
R0 0.4m
B ~1/Rtor
HFS LFS
Figure 16.1: The 1/R decrease of Btor.
In the standard regime (Btor = 1 T), the total electrostatic energy stored inthe capacitor bank is WC = 1/2 CU2 = 134.5 kJ. Total energy of the magneticfield (for Btor = 1 T) inside of the LCFC (Last Closed Flux Surface) is WBtor
=(V/2µ0)B
2tor = 44 kJ, where V = 0.11 m3 is a volume of the region of the vacuum
vessel. That means that only about 33 % of energy stored in the Btor capacitorbanks are efectively used for particle confinement.
The Btor is measured with a single coil (active area S = 0.0283 m2) placed in the
155
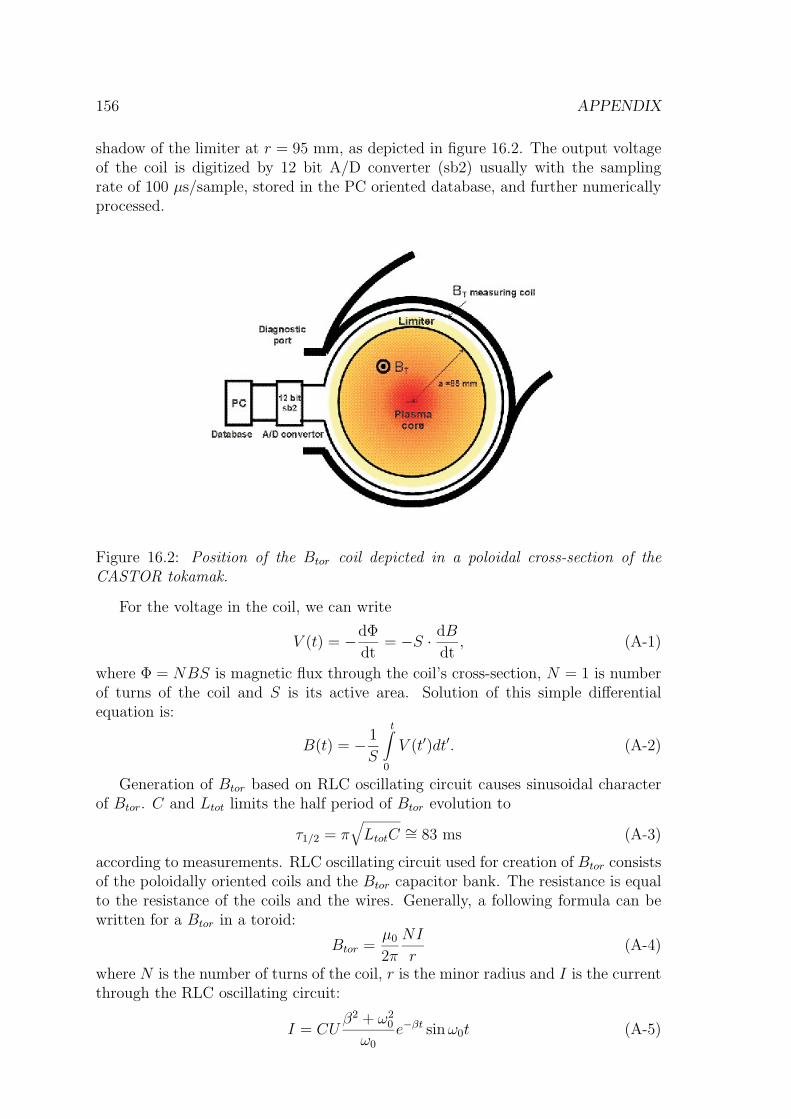
156 APPENDIX
shadow of the limiter at r = 95 mm, as depicted in figure 16.2. The output voltageof the coil is digitized by 12 bit A/D converter (sb2) usually with the samplingrate of 100 µs/sample, stored in the PC oriented database, and further numericallyprocessed.
Figure 16.2: Position of the Btor coil depicted in a poloidal cross-section of theCASTOR tokamak.
For the voltage in the coil, we can write
V (t) = −dΦ
dt= −S · dB
dt, (A-1)
where Φ = NBS is magnetic flux through the coil’s cross-section, N = 1 is numberof turns of the coil and S is its active area. Solution of this simple differentialequation is:
B(t) = − 1
S
t∫
0
V (t′)dt′. (A-2)
Generation of Btor based on RLC oscillating circuit causes sinusoidal characterof Btor. C and Ltot limits the half period of Btor evolution to
τ1/2 = π√
LtotC ∼= 83 ms (A-3)
according to measurements. RLC oscillating circuit used for creation of Btor consistsof the poloidally oriented coils and the Btor capacitor bank. The resistance is equalto the resistance of the coils and the wires. Generally, a following formula can bewritten for a Btor in a toroid:
Btor =µ0
2π
NI
r(A-4)
where N is the number of turns of the coil, r is the minor radius and I is the currentthrough the RLC oscillating circuit:
I = CUβ2 + ω2
0
ω0
e−βt sin ω0t (A-5)

APPENDIX 157
where
β =1
2
R
Ltot
and ω0 =
√
1
LtotC− 1
4
R2
L2tot
. (A-6)
Substituting (A-5) into (A-4), we obtain
Btor =µ0
2π
N
r· CU
β2 + ω20
ω0
e−βt sin ω0t. (A-7)
If we define
α1 =µ0
2π
N
r· CU
β2 + ω20
ω0
(A-8)
α2 = β (A-9)
α3 = ω0, (A-10)
we can re-write formula (A-7) as
Btor = α1 · e−α2t sin(α3t). (A-11)
This formula was fitted to experimental data of Btor with free parameters α1, α2,α3. We obtained the values α1 = 1.622, α2 = 10.922, α3 = 37.914. Final formulafor the time evolution of Btor is
Btor = 1.622 · e−10.922·t sin 37.914 · t. (A-12)
From formulae (A-8), (A-9), and (A-10) we obtained the values R = 0.061 Ω, C =0.229 F, U0 = 1084 V.

158 APPENDIX
A-2 Integrals of ne and Te
Central electron density, averaged electron density
The electron density ne is measured by an interferometer as one of the main plasmaparameters, shown in figure 3.3. It is a chord averaged density, normalized to 1 m3.For some calculations, we need the central plasma electron density ne(0) or thevolume averaged electron density 〈ne〉.
Central electron density
The measured electron density ne meas is a line averaged value:
ne meas =
a∫
−a
ne(r)dr · 1
2a(A-13)
where 2a is the chord length. Assuming a parabolic density profile
ne(r) = ne(0)
(
1 − r2
a2
)
, (A-14)
we can write
ne meas = ne(0)
a∫
−a
(
1 − r2
a2
)
dr · 1
2a. (A-15)
The integral is equal to 43a, thus the central density can be easily calculated as
ne(0) =3
2ne meas. (A-16)
Volume averaged electron density
The volume averaged electron density can be derived from
〈ne〉 =
a∫
0
ne(r) · 2πrdr · 1
πa2(A-17)
where πa2 is the surface of the poloidal cross-section (since we integrate over thecross-section). Again, assuming a parabolic temperature profile (equation (A-14)),we can write
〈ne〉 = ne(0)
a∫
0
(
1 − r2
a2
)
2πrdr · 1
πa2. (A-18)
The integral is equal to 2π · 14a2, thus the volume averaged electron density is from
(A-18) and (A-16)
〈ne〉 =1
2ne(0) =
3
4ne meas. (A-19)

APPENDIX 159
Volume averaged electron temperature
The volume averaged electron temperature can be derived in the same manner asthe density from
〈Te〉 =
a∫
0
Te(r)2πrdr · 1
πa2(A-20)
where πa2 is the surface of the poloidal plasma cross-section. Assuming the profile
Te(r) = Te(0)
(
1 − r2
a2
)α
(A-21)
where α = 2, the averaged electron temperature can be written as
〈Te〉 = Te(0)
a∫
0
(
1 − r2
a2
)2
2πrdr · 1
πa2. (A-22)
The integral is equal to 2π · a2
6, thus the volume averaged electron temperature can
be easily calculated as
〈Te〉 =1
3Te(0). (A-23)
Average of the product of electron temperature and density
The average of electron temperature and density can be written as
〈Te(r)ne(r)〉 =
a∫
0
Te(r) · ne(r) · 2πrdr · 1
πa2. (A-24)
Assuming the profiles of Te as (A-21) and ne as (A-14), we can write
〈Te(r)ne(r)〉 = Te(0) · ne(0)
a∫
0
(
1 − r2
a2
)2
·(
1 − r2
a2
)
2πrdr · 1
πa2. (A-25)
After integration (the integral is 2π · a2
8):
〈Te(r)ne(r)〉 =1
4Te(0) · ne(0). (A-26)

160 APPENDIX
Bibliography
[1] F. Francis Chen, Introduction fo Plasma Physics, Plenum Press, New York(1974).
[2] H. Prinzler, P. Heymann, J. Stockel, J. Badalec, F. Zacek, K. Jakubka,V. Kopecky, Investigation of the start up phase in the TM 1 tokamak,Czechoslovak Journal of Physics, Vol. B34, p. 665–679 (1984).
[3] M. Valovic, J. Badalec, K. Jakubka, V. Kopecky, J. Stockel, F. Zacek, A start-up discharge phase in a CASTOR tokamak, Proceedings of the 12th EPS Con-ferencce on Plasma Physics, Budapest, (September 1985).
[4] I. Duran, Fluktuace magnetickeho pole na tokamku CASTOR (Fluctuations ofthe magnetic field of the CASTOR tokamak), PhD Thesis, KEVF, MFF UK,Prague (2003).
[5] M. Valovic, Control of plasma position in the CASTOR tokamak, CzechoslovakJournal of Physics, Vol. B39, p. 1111–1119 (1989).
[6] M. Valovic, Magnetic diagnostics on the CASTOR tokamak, Czechoslovak Jour-nal of Physics, Vol. B38, p. 65-71 (1988).
[7] V. Weinzettl, Prostorove a casove chovanı lehkych necistot ve vysokoteplotnımplazmatu tokamaku CASTOR (Spatial and temporal behaviuor of light impu-rities in a high-temperature plasma of the CASTOR tokamak), PhD Thesis,FNSPE CTU, Prague (2005).
[8] A. Raicu, Th. Ionescu-Bujor, A. Pantea, V. Valeanu, J. Badalec, K. Jakubka,Vl. Kopecky, J. Stockel, M. Valovic, F. Zacek, The thermal ionization phaseduring the plasma formation in TM-1-MH tokamak, Czechoslovak Journal ofPhysics, Vol. B 37, p. 850-861 (1987).
[9] I. Duran, Runaway electrons in tokamaks, resersnı prace, KFE CVUT, Prague(1995).
[10] R. Dejarnac, J.P. Gunn, J. Stockel, J. Adamek, J. Brotankova, C. Ionita, Studyof ion sheath expansion and anisotropy of the electron parallel energy distri-bution in the CASTOR tokamak, Plasma Physics and Controlled Fusion 49,1791-1808 (2007).
[11] J. Brotankova, V. Weinzettl, H-alpha line measurements and Te profile estima-tion, Czechoslovak Journal of Physics, Suppl. S3, Vol. 50, p. 71–74 (2000).
161

162 BIBLIOGRAPHY
[12] K. S. Dyabilin, J. Badalec, A. A. Borschegovski, J. Datlov, K. Jakubka,V. Kopecky, A. A. Korotkov, J. Stockel, M. Valovic, F. Zacek, Global en-ergy balance and density limit on CASTOR tokamak, Czechoslovak Journal ofPhysics, Vol. B 37, p. 713–724 (1987).
[13] M. Hron, Transport castic v okrajovem plazmatu na tokamaku Castor (Particlestransport in the edge plasma of the tokamak CASTOR), Diploma Thesis, KFE,FJFI CVUT, Prague (1996).
[14] J. Brotankova, K. Jakubka, L. Kryska, J. Stockel, F. Zacek, Measurement of en-ergy confinement in CASTOR tokamak regimes with edge plasma polarization,Czechoslovak Journal of Physics, Suppl. S3, Vol. 50, p. 75–80 (2000).
[15] E. Martines, M. Hron, J. Stockel, Coherent structures in the edge turbulence ofthe CASTOR tokamak, Plasma Physics and Controlled Fusion 44, p. 351-359(2002).
[16] J. Stockel, P. Devynck, J. Gunn, E. Martines, G. Bonhomme, G. Van Oost,M. Hron, I. Duran, R. Panek, P. Stejskal, J. Adamek, Edge plasma physics andrelevant diagnostics on the CASTOR tokamak, Schriften des Forschungszen-trums Jlich, Vol. 3, p. 1-6 (2004).
[17] I. Duran, O. Hronova, J. Stockel, J. Sentkerestiova, J. Havlicek, Magnetic mea-surements using array of integrated Hall sensors on the CASTOR tokamak,Review of Scientific Instruments 79, 10F123 (2008).
[18] J. Stockel, P. Devynck, G. Bonhomme, E. Martines, G. Van Oost, M. Hron,I. Voitsekhovitch, J. Adamek, F. Doveil, I. Duran, J. Gunn, P. Stejskal,V. Weinzettl, Poloidal structure of the scrape off layer turbulence in the CAS-TOR tokamak, Proceedings of the 30th EPS Conference, ECA Vol. 27A, P-1.179 (2003).
[19] J. Adamek, J. Stockel, M. Hron, J. Ryszawy, M. Tichy, R. Schrittwieser,C. Ionita, P. Balan, E. Martines, G. Van Oost, A novel approach to direct mea-surement of the plasma potential Czechoslovak Journal of Physics 54, C95–C99(2004).
[20] J. Adamek, J. Stockel, I. Duran, M. Hron, R. Panek, M. Tichy, R. Schrittwieser,C. Ionita, P. Balan, E. Martines, G. Van Oost, Comparative measurements ofthe plasma potential with the ball-pen and emissive probes on the CASTORtokamak, Czechoslovak Journal of Physics 55, 235-242 (2005).
[21] R. Schrittwieser, J. Adamek, J. Stockel, J. Brotankova, E. Martines, G. Popa,C. Costin, L. van de Peppel, G. Van Oost, Direct measurements of the plasmapotential by Katsumata–type probes, Czechoslovak Journal of Physics 56,Suppl. B (145–150) (2006).
[22] J. Gunn, J. Stockel, J. Adamek, I. Duran, J. Horacek, M. Hron, K. Jakubka,L. Kryska, F. Zacek, G. Van Oost, Direct measurements of E × B flow andits impact on edge turbulence in the CASTOR tokamak using an optimizedGundestrup probe, Czechoslovak Journal of Physics 51, p. 1001-1010 (2001).

BIBLIOGRAPHY 163
[23] J. Adamek, M. Kocan, R. Panek, J.P. Gunn, E. Martines, J. Stockel, C. Ionita,G. Popa, C. Costin, J. Brotankova, R. Schrittwieser, G. Van Oost, SimultaneousMeasurements of Ion Temperature by Katsumata and Segmented Tunnel Probe,Contributions to Plasma Physics 48, No. 5-7, p. 395-399 (2008).
[24] P. Balan, J. Adamek, O. Barina, P. DeBeule, I. Duran, J.P. Gunn, M. Hron,C. Ionita, E. Martines, R. Panek, R. Schrittwieser, J. Stockel, G. Van DenBerge, G. Van Oost, T. Van Rompuy, Simultaneous Measurement of Electronand Ion Temperatures with a New Kind of Langmuir Probe, Proceedings of the30th EPS Conference, ECA Vol. 27A, P-1.84 (2003).
[25] Peter C. Stangeby, The plasma boundary of magnetic fusion devices, PlasmaPhysics Series, 1999.
[26] M. Berta, B. Tal, A. Bencze, S. Zoletnik, J. Stockel, M. Hron, R. Dejarnac,J. Zajac, The spatial structure of flows, Reynolds stress and turbulence in theCASTOR tokamak, 33rd EPS Conference, Rome, ECA Vol.30I, P-4.074 (2006).
[27] I. Duran, O. Hronova, J. Stockel, J. Sentkerestiova, J. Havlicek, Magnetic mea-surements using array of integrated Hall sensors on the CASTOR tokamak,Review of Scientific Instruments 79, 1 (2008).
[28] J. Stockel, P. Devynck, J. Gunn, E. Martines, G. Bonhomme, G. Van Oost,M. Hron, J. Adamek, J. Brotankova, R. Dejarnac, I. Duran, T. Gorler,T. Hansen, R. Panek, P. Stejskal, V. Svoboda, F. Zacek, Formation of convec-tive cells in the scrape-off layer of the CASTOR tokamak, 12th InternationalCongress on Plasma Physics, Nice (2004).
[29] M. Kocan, R. Panek, J. Stockel, M. Hron, J.P. Gunn, R. Dejarnac, Ion tem-perature measurements in the tokamak scrape-off layer, Journal of NuclearMaterials, 363-365, p. 1436-1440 (2007).
[30] J. Stockel, J. Adamek, P. Balan, O. Bilyk, J. Brotankova, R. Dejarnac, P. De-vynck, I. Duran, J. P. Gunn, M. Hron, J. Horacek, C. Ionita, M. Kocan,E. Martines, R. Panek, P. Peleman, R. Schrittwieser, G. Van Oost, F. Za-cek, Advanced probes for edge plasma diagnostics on the CASTOR tokamak,Journal of Physics, Conference Series, 63 No. 0 (2006).
[31] J. Adamek, M. Kocan, R. Panek, J.P. Gunn, E. Martines, J. Stockel, C. Ionita,G. Popa, C. Costin, J. Brotankova, R. Schrittwieser, G. Van Oost, SimultaneousMeasurements of Ion Temperature by Segmented Tunnel and Katsumata Probe,Contributions to Plasma Physics 48, No. 5-7, p. 395-399 (2008).
[32] M. Kocan, J.P. Gunn, J.-Y. Pascal, G. Bonhomme, C. Fenzi, E. Gauthier, J.-L. Segui, Edge ion-to-electron temperature ratio in the Tore Supra tokamak,Plasma Physics and Controlled Fusion, 50, 125009 (10pp) (2008).
[33] J. Brotankova, E. Martines, J. Adamek, J. Stockel, G. Popa, C. Costin,R. Schrittwieser, C. Ionita, G. Van Oost, A probe-based method for measuringthe transport coefficient in the tokamak edge region, Czechoslovak Journal ofPhysics, Vol. 56 (12), No.12, p. 1321–1327 (2006).
164 BIBLIOGRAPHY
[34] J. Brotankova, E. Martines, J. Adamek, J. Stockel, G. Popa, C. Costin,R. Schrittwieser, C. Ionita, G. Van Oost, Novel technique for direct measure-ment of the plasma diffusion coefficient in magnetised plasma, Contributions toPlasma Physics 48, No. 5-7, p. 418–423 (2008).
[35] M. Hron, Turbulence plazmatu na tokamaku Castor (Plasma turbulence in theCASTOR tokamak), PhD Thesis, KEVF, MFF UK, Prague (2002).
[36] P.C. Stangeby, A tutorial on some basic aspects of divertor physics, PlasmaPhysics and Controlled Fusion, 42, B271-B291 (2000).
[37] J. Stockel, E. Martines, G. Van Oost, V. Svoboda, T. Gorler, T. Hansen, Fluc-tuation measurements with 2D matrix of Langmuir probes on the CASTORtokamak, Proceedings of the 32nd EPS Conference, EPC Vol. 29C, P-5.018(2005).
[38] J. Brotankova, J. Stockel, M. Hron, I. Duran, G. Van Oost, Measurement ofSheared Flows at the Plasma Edge of the CASTOR Tokamak, Proceedings ofthe 18th IAEA Technical Meeting on Research Using Small Fusion Devices,submitted for publication.
[39] J. A. Wesson et al.: Tokamaks, Clarendon Press, Oxford, 3rd edition, 2004.
[40] G. Van Oost, M. Berta, J. Brotankova, R. Dejarnac, E. Del Bosco, E. Dufkova,I. Duran, M.P. Gryaznevich, J. Horacek, M. Hron, A. Malaquias, G. Mank,P. Peleman, J. Sentkerestiova, J. Stockel, V. Weinzettl, S. Zoletnik, B. Tal,J. Ferrera, A. Fonseca, H. Hegazy, Y. Kuznetsov, A. Ossyannikov, A. Singh,M. Sokholov, A. Talebitaher, Joint experiments on small tokamaks: edgeplasma studies on CASTOR, Nuclear fusion 47 (5): 378-386 (May 2007).
[41] J. Stockel, J. Adamek, P. Balan, O. Bilyk, J. Brotankova, R. Dejarnac, P. De-vynck, I. Duran, J.P. Gunn, M. Hron, J. Horacek, C. Ionita, M. Kocan, E. Mar-tines, R. Panek, P. Peleman, R. Schrittwieser, G. Van Oost, F. Zacek, Ad-vanced probes for edge plasma diagnostics on the CASTOR tokamak, Journalof Physics, conference series, 63, 012001 (2007).
[42] R. Dejarnac, J.P. Gunn, J. Stockel, J. Adamek, J. Brotankova, C. Ionita, Studyof ion sheath expansion and anisotropy of the electron parallel energy distri-bution in the CASTOR tokamak, Plasma Physics and Controlled Fusion 491791-1808 (2007).
[43] J. Schirmer, G.D. Conway, H. Zohm, W. Suttrop and the ASDEX UpgradeTeam, The radial electric field and its associated shear in the ASDEX Upgradetokamak, Nuclear Fusion Vol. 46, S780S791 (2006).
[44] L. Krlin, J. Stockel, V. Svoboda, Stochastic (E ×B) diffusion of ions in a spa-tially periodical potential field, Plasma Physics and Controlled Fusion, Vol. 41,No. 3, p. 339–353 (1999).
BIBLIOGRAPHY 165
[45] J. Stockel, J. Badalec, I. Duran, M. Hron, J. Horacek, K. Jakubka, L. Kryska,J. Petrzilka, F. Zacek, M.V.P. Heller, Z.A. Brazilio, I.L. Caldas, Magnetic andelectrostatic fluctuations in the CASTOR tokamak, Plasma Physics and Con-trolled Fusion 41 (1999) A577-A585.
[46] G. Vayakis, Anomalous Transport in the Tokamak Edge, PhD thesis, Depart-ment of Engineering Science, Oxford, (1991).
[47] Bendat, Piersol: Random Data: Analysis and Measurements Procedures, Wileyand Sons, p. 148 (2000).
[48] Ch.P. Ritz, D. Roger, S. Bengtson, S.J. Levinson, E.J. Powers, Turbulent struc-ture in the edge plasma of the TEXT tokamak, Physics of Fluids Vol. 27, No. 12,p. 2956–2959 (December 1984).
[49] G.Van Oost, J. Stockel, M. Hron, P. Devynck, K. Dyabilin, J.P. Gunn, J. Ho-racek, E. Martines, M. Tendler, Potential structures and flow measurementswith separatrix biasing in the CASTOR tokamak, J. Plasma Fusion Res. SE-RIES Vol. 4, p 29-35 (2001).
[50] P. Devynck, J. Brotankova, P. Peleman, M. Spolaore, H. Figueiredo, M. Hron,G. Kirnev, E. Martines, J. Stockel, G. Van Oost, V. Weinzettl, Dynamics ofturbulent transport in the scrape-off layer of the CASTOR tokamak, Physicsof Plasmas, 13 (10), 102505-102513 (2006).
[51] C. Hidalgo, B. Goncalves, M.A. Pedrosa, C. Silva, R. Balbin, M. Hron,A. Loarte, K. Erents, G.F. Matthews, R. Pitts, Experimental evidence of fluc-tuations and flows near marginal stability and dynamical interplay betweengradients and transport in the JET plasma boundary region, Journal of Nu-clear Materials, 313316 (2003) 863867.
[52] O.E. Garcia, N.H. Bian, V. Naulin, A.H. Nielsen, J. Juul Rasmussen, Two-dimensional convection and interchange motions in fluids and magnetized plas-mas, Physica Scripta T122, p. 104-124 (2006).
[53] J. Horacek, A.H. Nielsen, O.E. Garcia, R.A. Pitts, Spatio-temporal correlationsin edge tokamak plasma fluctuations in both experiment and modelling, Ab-stract in the Bulleting of APS 52, DPP07-2007-000077, APS Meeting, Florida,(November 2007).
[54] M. Hron, E. Martines, P. Devynck, G. Bonhomme, E. Gravier, J. Adamek,F. Doveil, I. Voitsekchovich, J. Stockel, A. Azeroul, I. Duran, G. Van Oost,F. Zacek, Probe array diagnostics for spatially resolved fluctuation measure-ments, Proceedings of the 29th EPS conference, Vol. C, P-5.043 (2002).
[55] J. Stockel, P. Devynck, J. Gunn, E. Martines, G. Bonhomme, I. Voitsekhovitch,G. Van Oost, M. Hron, I. Duran, P. Stejskal, J. Adamek, V. Weinzettl, F. Zacek,Formation of convective cells during scrape-off layer biasing in the CASTORtokamak, Plasma Physics Controlled Fusion, 47 No. 4, p. 635-643 (April 2005).
166 BIBLIOGRAPHY
[56] E. Martines, M. Hron and J. Stockel, Coherent structures in the edge turbulenceof the CASTOR tokamak, Plasma Physics and Controlled Fusion 44 No. 3,p. 351-359 (March 2002).
[57] P. Devynck, G. Bonhomme, E. Martines, J. Stockel, G. Van Oost, I. Voit-sekhovitch, J. Adamek, A. Azeroual, F. Doveil, I. Duran, E. Gravier, J. Gunn,M. Hron, Spatially resolved characterization of electrostatic fluctuations in thescrape-off layer of the CASTOR tokamak, Plasma Physics and Controlled Fu-sion, 47, No. 2, p. 269-280 (2005).
[58] J.W. Connor, R.J. Hastie, H.R. Wilson Connor, R. L. Miller, Magnetohydro-dynamic stability of tokamak edge plasmas, Physics of Plasmas, Vol. 5, No. 7,p. 2687 (1998).
[59] J. Stockel, M. Spolaore, P. Peleman, J. Brotankova, J. Horacek, R. Dejarnac,P. Devynck, I. Duran, J.P. Gunn, M. Hron, M. Kocan, E. Martines, R. Panek,A. Sharma, G. Van Oost, Dynamics of the edge transport barrier at plasmabiasing on the CASTOR tokamak, Problems of Atomic Science and Technology,Vol. 12, No. 6, p. 19-23 (2006).
[60] P. Peleman, S. Jachmich, M. Van Schoor, G. Van Oost, W. Knaepen,C. Boucher, Comparative Study of Flat and Round Collectors Using a Vali-dated 1D Fluid Probe Model, Contributions to Plasma Physics 46, No. 5-6,p. 422–426 (2006).
[61] P. Peleman, Y. Xu, M. Spolaore, J. Brotankova, P. Devynck, J. Stockel, G. VanOost, C. Boucher, Highly resolved measurements of periodic radial electricfield and associated relaxations in edge biasing experiments, Book of Abstracts,Hefei, Anhui, 314/ P3-23 (2006).
[62] S.J. Zweben, J.A. Boedo, O. Grulke, C. Hidalgo, B. LaBombard, R.J. Maqueda,P. Scarin, J.L. Terry, Edge turbulence measurements in toroidal fusion devices,Plasma Physics and Controlled Fusion 49, S1-S23 (2007).
[63] E. Sanchez, C. Hidalgo, D. Lopez-Bruna, I. Garcia-Cortes, R. Balbin, M.A. Pe-drosa, B. van Milligen, C. Riccardi, G. Chiodini, J. Bleuel, M. Endler, B.A. Car-reras, D.E. Newman, Statistical characterization of fluctuation wave forms inthe boundary region of fusion and nonfusion plasmas, Physics of Plasma, Vol. 7,No. 5. (2000).
[64] O.E. Garcia, J. Horacek, R.A. Pitts, A.H. Nielsen, W. Fundamenski, V. Naulin,J. Juul Rasmussen, Fluctuations and transport in the TCV scrape-off layer,Nuclear Fusion 47 p. 667-676 (2007).
[65] O.E. Garcia, Collective motions in non-uniformly magnetized plasmas, Euro-pean Journal of Physics 24, p. 331–339 (2003).
[66] R.O. Orozco, E. Faleiro, C. Hidalgo, M.A. Pedrosa, C. Silva, E. Sanchez,J.M. Gomez, E. Calderon, On the influence of ExB sheared flows in the statis-tical properties of turbulence in the plasma boundary of the TJ-II stellarator,Proceedings of the 32nd EPS conference, Vol. 29C, P-5.031 (2005).

BIBLIOGRAPHY 167
[67] C. Alejaldre, J. Alonso, L. Almoguera, E. Ascasibar, A. Baciero, R. Balbin,M. Blaumoser, J. Botija, B. Branas, E. de la Cal, A. Cappa, R. Carrasco,F. Castejon, J.R. Cepero, C. Cremy, J. Doncel, C. Dulya, T. Estrada, A. Fer-nandez, M. Frances, C. Fuentes, A. Garcia, I. Garcia-Cortes, J. Guasp, J. Her-ranz, C. Hidalgo, J.A. Jimenez, I. Kirpitchev, V. Krivenski, I. Labrador, F. La-payese, K. Likin, M. Liniers, A. Lopez-Fraguas, A. Lopez-Sanchez, E. de laLuna, R. Martin, A. Martinez, L. Martinez-Laso, M. Medrano, P. Mendez,K. McCarthy, F. Medina, B. van Milligen, M. Ochando, L. Pacios, I. Pastor,M.A. Pedrosa, A. de la Pena, A. Portas, J. Qin, L. Rodriguez-Rodrigo, A. Salas,E. Sanchez, J. Sanchez, F. Tabares, D. Tafalla, V. Tribaldos, J. Vega, B. Zurro,First plasmas in the TJ-II Flexible Heliac, Plasma Physics and Controlled Fu-sion 41, A539 (1999).
[68] E. Ascasibar, C. Alejaldre, J. Alonso, L. Almoguera, A. Baciero, R. Balbin,M. Blaumoser, J. Botija, B. Branas, E. de la Cal, A. Cappa, J. Castellano,R. Carrasco, F. Castejon, J.R. Cepero, C. Cremy, J. Doncel, S. Eguilior,T. Estrada, A. Fernandez, C. Fuentes, A. Garcia, I. Garcia-Cortes, J. Guasp,J. Herranz, C. Hidalgo, J.A. Jimenez, I. Kirpitchev, V. Krivenski, I. Labrador,F. Lapayese, K. Likin, M. Linier, A. Lopez-Fraguas, A. Lopez-Sanchez, E. de laLuna, R. Martin, L. Martinez-Laso, M. Medrano, P. Mendez, K.J. McCarthy,F. Medina, B. van Milligen, M. Ochando, L. Pacios, I. Pastor, M.A. Pedrosa,A. de la Pena, A. Portas, J. Qin, L. Rodriguez-Rodrigo, J. Romero, A. Salas,E. Sanchez, J. Sanchez, F. Tabares, D. Tafalla, V. Tribaldos, J. Vega, B. Zurro,Overview of TJ-II flexible heliac results, Fusion Engineering and Design 56-57,145-154 (2001).
[69] C. Hidalgo, C. Alejaldre, A. Alonso, J. Alonso, L. Almoguera, F. de Aragon,E. Ascasibar, A. Baciero, R. Balbin, E. Blanco, J. Botija, B. Branas,E. Calderon, A. Cappa, J.A. Carmona, R. Carrasco, F. Castejon, J.R. Cepero,A.A. Chmyga, J. Doncel, N.B. Dreval, S. Eguilior, L. Eliseev, T. Estrada,J.A. Ferreira, A. Fernandez, J.M. Fontdecaba, C. Fuentes, A. Garcia, I. Garcia-Cortes, B. Goncalves, J. Guasp, J. Herranz, A. Hidalgo, R. Jimenez,J.A. Jimenez, D. Jimenez-Rey, I. Kirpitchev, S.M. Khrebtov, A.D. Komarov,A.S. Kozachok, L. Krupnik, F. Lapayese, M. Liniers, D. Lopez-Bruna, A. Lopez-Fraguas, J. Lopez-Razola, A. Lopez-Sanchez, E. de la Luna, G. Marcon, R. Mar-tin, K.J. McCarthy, F. Medina, M. Medrano, A.V. Melnikov, P. Mendez, B. vanMilligen, I.S. Nedzelskiy, M. Ochando, O. Orozco, J.L. de Pablos, L. Pacios,I. Pastor, M.A. Pedrosa, A. de la Pena, A. Pereira, A. Petrov, S. Petrov, A. Por-tas, D. Rapisarda, L. Rodriguez-Rodrigo, E. Rodriguez-Solano, J. Romero,A. Salas, E. Sanchez, J. Sanchez, M. Sanchez, K. Sarksian, C. Silva, S. Schchep-etov, N. Skvortsova, F. Tabares, D. Tafalla, A. Tolkachev, V. Tribaldos, I. Var-gas, J. Vega, G. Wolfers, B. Zurro, Overview of TJ-II experiment, NuclearFusion 45, S266S275 (2005).
[70] C. Alejaldre, J. Alonso, L. Almoguera, E. Ascasibar, A. Baciero, R. Balbin,M. Blaumoser, J. Botija, B. Branas, E. de la Cal, A. Cappa, R. Carrasco,F. Castejon, J.R. Cepero, C. Cremy, J.M. Delgado, J. Doncel, C. Dulya,T. Estrada, A. Fernandez, C. Fuentes, A. Garcia, I. Garcia-Cortes, J. Guasp,

168 BIBLIOGRAPHY
J. Herranz, C. Hidalgo, J.A. Jimenez, I. Kirpitchev, V. Krivenski, I. Labrador,F. Lapayese, K. Likin, M. Linier, A. Lopez-Fraguas, A. Lopez-Sanchez, E. de laLuna, R. Martin, A. Martinez, L. Martinez-Laso, M. Medrano, P. Mendez,K.J. McCarthy, F. Medina, B. van Milligen, M. Ochando, L. Pacios, I. Pastor,M.A. Pedrosa, A. de la Pena, A. Portas, J. Qin, L. Rodriguez-Rodrigo, A. Salas,E. Sanchez, J. Sanchez, F. Tabares, D. Tafalla, V. Tribaldos, J. Vega, B. Zurro,D. Akulina, O.I. Fedyanin, S. Grebenshchikov, N. Kharchev, A. Meshcheryakov,K.A. Sarksian, R. Barth, G. van Dijk, H. van der Meiden, Confinemet studiesin the TJ-II stellarator, Plasma Physics and Controlled Fusion 41, B109-B117(1999).
[71] E. Ascasibar, C. Alejaldre, J. Alonso, L. Almoguera, A. Baciero, R. Balbin,I. Blanco, M. Blaumoser, J. Botija, B. Branas, A. Cappa, R. Carrasco, F. Caste-jon, J.R. Cepero, A.A. Chmyga, J. Doncel, N.B. Dreval, S. Eguilior, L. Eliseev,T. Estrada, O. Fedyanin, A. Fernandez, J.M. Fontdecaba, C. Fuentes, A. Gar-cia, I. Garcia-Cortes, B. Goncalves, J. Guasp, J. Herranz, A. Hidalgo, C. Hi-dalgo, J.A. Jimenez, I. Kirpitchev, S.M. Khrebtov, A. Komarov, A.S. Kozachok,L. Krupnik, F. Lapayese, K. Likin, M. Liniers, A. Lopez-Bruna, A. Lopez-Fraguas, J. Lopez-Razola, A. Lopez-Sanchez, E. de la Luna, A. Malaquias,R. Martin, M. Medrano, A. Melnikov, P. Mendez, K.J. McCarthy, F. Medina,B. van Milligen, I.S. Nedzelskiy, M. Ochando, L. Pacios, I. Pastor, M.A. Pe-drosa, A. de la Pena, A. Petrov, S. Petrov, A. Portas, J. Romero, L. Rodriguez-Rodrigo, A. Salas, E. Sanchez, J. Sanchez, K. Sarksian, S. Schchepetov,N. Skvortsova, F. Tabares, D. Tafalla, V. Tribaldos, C.F.A. Varandas, J. Vega,B. Zurro, Confinement and stability on the TJ-II stellarator, Plasma Physicsand Controlled Fusion 44, B307-B322 (2002).
[72] C. Alejaldre, L. Almoguera, J. Alonso, E. Ascasibar, A. Baciero, R. Balbin,M. Blaumoser, J. Botija, B. Branas, E. de la Cal, A. Cappa, R. Carrasco,F. Castejon, J. Castellano, J.R. Cepero, C. Cremy, J. Doncel, S. Eguilior,T. Estrada, A. Fernandez, C. Fuentes, A. Garcia, I. Garcia-Cortes, J. Guasp,J. Herranz, C. Hidalgo, J.A. Jimenez, I. Kirpitchev, V. Krivenski, I. Labrador,F. Lapayese, K. Likin, M. Liniers, A. Lopez-Fraguas, A. Lopez-Sanchez, E. de laLuna, R. Martin, L. Martinez-Laso, K.J. McCarthy, F. Medina, M. Medrano,P. Mendez, B. van Milligen, M. Ochando, L. Pacios, I. Pastor, M.A. Pedrosa,A. de la Pena, A. Portas, J. Qin, L. Rodriguez-Rodrigo, J. Romero, A. Salas,E. Sanchez, J. Sanchez, F. Tabares, D. Tafalla, V. Tribaldos, J. Vega, B. Zurro,Review of confinement and transport studies in the TJ-II flexible heliac, NuclearFusion 41, 1449 (2001).
[73] F. Castejon, C. Alejaldre, J. Alonso, L. Almoguera, E. Ascasibar, A. Baciero,R. Balbin, M. Blaumoser, J. Botija, B. Branas, E. de la Cal, A. Cappa, R. Car-rasco, J. R. Cepero, C. Cremy, J. Doncel, S. Eguilior, T. Estrada, A. Fernan-dez, C. Fuentes, A. Garcia, I. Garcia-Corts, J. Guasp, J. Herranz, C. Hidalgo,J.A. Jimenez, I. Kirpitchev, V. Krivenski, I. Labrador, F. Lapayese, K. Likin,M. Liniers, A. Lopez-Fraguas, A. Lopez-Snchez, E. de la Luna, R. Martin,L. Martinez-Laso, M. Medrano, P. Mndez, K.J. McCarthy, F. Medina, B. vanMilligen, M. Ochando, L. Pacios, I. Pastor, M.A. Pedrosa, A. de la Pena, A. Por-

BIBLIOGRAPHY 169
tas, J.Qin, L. Rodriguez-Rodrigo, A. Salas, E. Sanchez, J. Sanchez, F. Tabares,D. Tafalla, V.Tribaldos, J. Vega, B. Zurro, Latest Physics Results of TJ-II Flex-ible Heliac, Problems of Atomic Science and Technology N 6, Series: PlasmaPhysics 6.3 p. 3–7 (2000).
[74] F. Castejon, V. Tribaldos, I. Garcia-Cortes, E. de la Luna, J. Herranz, I. Pastor,T. Estrada, TJ-II Team, Enhanced heat confinement in the flexible heliac TJ-II,Nuclear Fusion 42, 271280 (2002).
[75] M.A. Pedrosa, A. Lopez-Sanchez, C. Hidalgo, A. Montoro, A. Gabriel, J. En-cabo, J. de la Gama, L.M. Martinez, E. Sanchez, R. Perez, C. Sierra, Fastmovable remotely controlled Langmuir probe system, Review of Scientific In-struments, Vol. 70, No. 1. (1999).
[76] C. Hidalgo, M.A. Pedrosa, E. Sanchez, B. Goncalves, J.A Alonso, E. Calderon,A.A Chmyga, N.B. Dreval, L. Eliseev, T. Estrada, L. Krupnik, A.V. Melnikov,R.O. Orozco, J.L. de Pablos, C. Silva, Physics of sheared flow developmentin the boundary of fusion plasmas, Plasma Physics and Controlled Fusion 48,S169S176 (2006).
[77] M.A. Pedrosa, C. Hidalgo, E. Calderon, A. Alonso, R.O. Orozco, J.L. De Pab-los, and the TJ-II team, Spontaneous edge E × B sheared flow developmentstudies in the TJ-II stellarator, Czechoslovak Journal of Physics 55, 1579-1587(2005).
[78] M.A. Pedrosa, R.O. Orozco, C. Hidalgo, J.A. Alonso, J.L. de Pablos andC. Silva, On the time scales and statistical properties of turbulence duringExB sheared flow development in the TJ-II stellarator, 33rd EPS Conference,ECA Vol. 30I, P-1.139 (2006).
[79] C. Hidalgo, M.A. Pedrosa, L. Garcia, A. Ware, Experimental evidence of cou-pling between sheared-flow development and an increase in the level of turbu-lence in the TJ-II stellarator, Physical Review E 70, 067402 (2004).
[80] M.A. Pedrosa, C. Hidalgo, E. Calderon, T. Estrada, A. Fernandez, J. Herranz,I. Pastor and the TJ-II team, Threshold for sheared flow and turbulence de-velopment in the TJ-II stellarator, Plasma Physics and Controlled Fusion 7,p. 777-788, (2005).
[81] B.Ph. van Milligen, T. Kalhoff, M.A. Pedrosa, C. Hidalgo, Bicoherence dur-ing confinement transitions in the TJ-II stellarator, Nuclear Fusion 48, 11503(2008).
[82] C. Hidalgo, M.A. Pedrosa, N. Dreval, K.J. McCarthy, L. Eliseev,M.A. Ochando, T. Estrada, I. Pastor, E. Ascasibar, E. Calderon, A. Cappa,A.A. Chmyga, A. Fernandez, B. Goncalves, J. Herranz, J.A. Jimenez,S.M. Khrebtov, A.D. Komarov, A.S. Kozachok, L. Krupnik, A. Lopez-Fraguas,A Lopez-Sanchez, A.V. Melnikov, F. Medina, B. van Milligen, C. Silva,F. Tabares, D. Tafalla, Improved confinement regimes induced by limiter bias-ing in the TJ-II stellarator, Plasma Physics and Controlled Fusion 46, 287297(2004).

170 BIBLIOGRAPHY
[83] J. Horacek, Measurement of edge electrostatic turbulence in the TCV tokamakplasma boundary, PhD Thesis, Faculte Sciences de Base, Ecole PolytechniqueFederale de Lausanne, Lausanne (2006).
[84] J. Horacek, R.A. Pitts, A.H. Nielsen, O.E. Garcia, Understanding SOL plasmaturbulence by interchange motions, Bulletin of the American Physical Society(52), Vol. 16, p. 192–193 (2007).
[85] A.V. Chankin, D.P. Coster, N. Asakura, G.D. Conway, Corrigan, S.K. Erents,W. Fun-damenski, Gunter, J. Horacek, A. Kallenbach, M. Kaufmann, C. Konz,K. Lackner, H.W. Muller, J. Neuhauser, R.A. Pitts, M. Wischmeier, A possiblerole of radial electric field in driving parallel ion flow in scrape-off layer ofdivertor tokamaks, Nuclear Fusion (47), p. 762–772 (2007).
[86] R. Schrittwieser, J. Adamek, P. Balan, M. Hron, C. Ionita, K. Jakubka,L. Kryska, E. Martines, J. Stockel, M. Tichy, G. Van Oost, Measurements withan emissive probe in the CASTOR tokamak, Plasma Physics and ControlledFusion 44, No. 5, p. 567–578 (2002).
[87] A.V. Melnikov, L.G. Eliseev, The direct measurements of the plasma electricpotential by heavy ion beam probe on T-10 tokamak. Does T-10 obtain theH-mode?, Czechoslovak Journal of Physics 49 Suppl. 3, 35–40 (1999).
[88] J. Adamek, C. Ionita, R. Schrittwieser, J. Stockel, M. Tichy, G. Van Oost,Direct Measurements of the Electron Temperature by a Ball-pen/Langmuirprobe, Proceedings of the 32nd EPS Conference, ECA Vol. 27A, P-1.179 (2003).
[89] R. Schrittwieser, C. Ionita, J. Adamek, J. Brotankova, J. Stockel, E. Martines,C. Costin, G. Popa, L. van de Peppel, G. Van Oost, Direct measurements of theplasma potential by katsumata-type probes, Czechoslovak Journal of Physics(56), p. B145–B150 (2006).
[90] J. Adamek, V. Rohde, H.W. Muller, A. Herrmann, C. Ionita, R. Schrittwieser,F. Mehlmann, J. Stockel, J. Horacek, J. Brotankova a and ASDEX UpgradeTeam, Direct measurements of the plasma potential in ELMy H-mode plasmawith ball-pen probes on ASDEX Upgrade tokamak, Journal of Nuclear Mate-rials, doi:10.1016/j.jnucmat.2009.01.286 (2009).
[91] J. Brotankova, J. Adamek, E. Martines, J. Stockel, M. Spolaore, R. Cavazzana,G. Serianni, N. Vianello, M. Zuin, Measurements of plasma potential and elec-tron temperature by Ball-pen probes in RFX-mod, Problems of Atomic Scienceand Technology No. 1, Series: Plasma Physics (15), p. 16-18 (January 2009).
[92] I. Katsumata, M. Okazaki, Ion Sensitive Probe-A New Diagnostic Method forPlasma in Magnetic Fields, Japanese Journal of Applied Physics (6), p. 123–124(1967).
[93] V.I. Demidov, S.V. Ratynskaia, K. Rydpal, Electric probes for plasmas: Thelink between theory and instrument, Review of Scientific Instruments, Vol. 73,No. 10, p. 3409 (October 2002).

BIBLIOGRAPHY 171
[94] T. Bolzonella, N. Pomaro, G. Serianni, D. Marcuzzi, New wide bandwidth in-vessel magnetic measurement system for RFX, Review of Scientific InstrumentsVol. 74, No. 3 (March 2003).
[95] P. Sonato, G. Chitarin, P. Zaccaria, F. Gnesotto, S. Ortolani, A. Buffa,M. Bagatin, W.R. Baker, S. Dal Bello, P. Fiorentin, L. Grando, G. Marchiori,D. Marcuzzi, A. Masiello, S. Peruzzo, N. Pomaro, G. Serianni, Machine modifi-cation for active MHD control in RFX, Fusion Engineering and Design, 66-68,161-168 (2003).
[96] G. Serianni, T. Bolzonella, R. Cavazzana, G. Marchiori, N. Pomaro, L. Lotto,M. Monari, C. Taliercio, Development, tests, and data acquisition of the in-tegrated system of internal sensors for RFX, Review of Scientific InstrumentsVol. 75, No. 10 (October 2004).
[97] G. Serianni, T. Bolzonella, R. Cavazzana, G. Marchiori, N. Pomaro, L. Lotto,M. Monari, C. Taliercio, Development, tests and data acquisition of the In-tegrated System of Internal Sensors for RFX, Proccedings of the 15th topicalconference on high temperature plasma diagnostics: Review of Scientific Instru-ments Vol. 75, 3381 (2004).
[98] G. Serianni, W. Baker, S. Dal Bello, High-spatial resolution edge electrostaticprobe system for RFX, Review of Scientific Instruments Vol. 74, No. 3 (March2003).
[99] R. Cavazzana, P. Scarin, G. Serianni, M. Agostini, F. Degli Agostini, V. Cer-varo, L. Lotto, Y. Yagi, H. Sakakita, H. Koguchi, Y. Hirano, Optical and elec-trical diagnostics for the investigation of edge turbulence in fusion plasmas,Review of Scientific Instruments Vol. 75, No. 10 (October 2004).
[100] B. A. Carreras, R. Balbin, B. van Milligen, M.A. Pedrosa, I. Garcia-Cortes,E. Sanchez, C. Hidalgo, J. Bleuel, M. Endler, H. Thomsen, A. Chankin,S. Davies, K. Erents, G.F. Matthews, Characterization of the frequency rangesof the plasma edge fluctuation spectra, Physics of Plasmas Vol. 6, No. 12 (De-cember 1999).
[101] M.A. Pedrosa, C. Hidalgo, B.A. Carreras, R. Balbin, I. Garcia-Cortes, D. New-man, B. van Milligen, E. Sanchez, J. Bleuel, M. Endler, S. Davies, G.F.Matthews, Empirical Similarity of Frequency Spectra of the Edge-Plasma Fluc-tuations in Toroidal Magnetic-Confinement Systems, Physical Review Letters,Vol. 82, No. 18, (May 1999).
[102] V. Antoni, R. Cavazzana, D. Desideri, E. Martines, G. Serianni, L. Tramon-tin, Electrostatic Turbulence and Transport in the Velocity Shear Layer of aReversed Field Pinch Plasma, Physical review letters, Vol. 80, No. 19, p. 4185-4188, (1998).
[103] R. Panek, O. Bilykova, V. Fuchs, M. Hron, P. Chraska, P. Pavlo, J. Stockel,J, Urban, V. Weinzettl, J. Zajac, F. Zacek, Reinstallation of the COMPASS-Dtokamak in IPP ASCR, Czechoslovak Journal of Physics Vol. 56, Suppl. B,p. 125-137 (2007).

172 BIBLIOGRAPHY

Contents
I Introduction 1
1 Aims of the thesis 3
2 Introduction to nuclear fusion 52.1 Fusion . . . . . . . . . . . . . . . . . . . . . . . . . . . . . . . . . . . 6
2.1.1 Nuclear fusion reactions . . . . . . . . . . . . . . . . . . . . . 62.1.2 Lawson criterion . . . . . . . . . . . . . . . . . . . . . . . . . 72.1.3 Approaches to nuclear fusion . . . . . . . . . . . . . . . . . . . 8
2.2 Tokamaks . . . . . . . . . . . . . . . . . . . . . . . . . . . . . . . . . 92.2.1 Magnetic field of tokamak . . . . . . . . . . . . . . . . . . . . 9
3 CASTOR tokamak and diagnostic tools 113.1 Basic parameters . . . . . . . . . . . . . . . . . . . . . . . . . . . . . 123.2 Discharge in the CASTOR tokamak . . . . . . . . . . . . . . . . . . . 14
3.2.1 Plasma generation . . . . . . . . . . . . . . . . . . . . . . . . 143.2.2 Electron density, gas filling . . . . . . . . . . . . . . . . . . . . 153.2.3 Plasma current . . . . . . . . . . . . . . . . . . . . . . . . . . 163.2.4 Plasma resistivity, ohmic power . . . . . . . . . . . . . . . . . 163.2.5 Equilibrium position of plasma column . . . . . . . . . . . . . 173.2.6 Plasma radiation . . . . . . . . . . . . . . . . . . . . . . . . . 213.2.7 Safety factor q . . . . . . . . . . . . . . . . . . . . . . . . . . . 233.2.8 Determination of electron temperature and density . . . . . . 253.2.9 Electron confinement time . . . . . . . . . . . . . . . . . . . . 27
3.3 Diagnostics . . . . . . . . . . . . . . . . . . . . . . . . . . . . . . . . 283.3.1 Langmuir probe arrays . . . . . . . . . . . . . . . . . . . . . . 283.3.2 Advanced probes . . . . . . . . . . . . . . . . . . . . . . . . . 31
4 Edge plasma 334.1 Scrape Off Layer . . . . . . . . . . . . . . . . . . . . . . . . . . . . . 34
4.1.1 Limiter configuration . . . . . . . . . . . . . . . . . . . . . . . 344.1.2 Divertor configuration . . . . . . . . . . . . . . . . . . . . . . 364.1.3 Geometry of SOL . . . . . . . . . . . . . . . . . . . . . . . . . 37
4.2 Transport in Scrape Off Layer . . . . . . . . . . . . . . . . . . . . . . 374.2.1 Characteristic time in SOL . . . . . . . . . . . . . . . . . . . . 374.2.2 Diffusion coefficient in SOL . . . . . . . . . . . . . . . . . . . 38
4.3 CASTOR edge plasma . . . . . . . . . . . . . . . . . . . . . . . . . . 404.3.1 Geometry of the CASTOR edge plasma . . . . . . . . . . . . 40
173

174 CONTENTS
4.3.2 Connection length of the CASTOR edge plasma . . . . . . . . 404.3.3 Radial profile of floating potential . . . . . . . . . . . . . . . . 414.3.4 Poloidal profiles of floating potential and velocity . . . . . . . 424.3.5 Radial profiles of temperature and density . . . . . . . . . . . 434.3.6 Diffusion coefficient in the CASTOR SOL . . . . . . . . . . . 44
5 Biasing experiments 475.1 Improvement of the global plasma parameters . . . . . . . . . . . . . 505.2 Radial profiles of Ufl and Erad at the plasma edge during biasing
experiments . . . . . . . . . . . . . . . . . . . . . . . . . . . . . . . . 51
6 Statistical tools 536.1 Single point methods . . . . . . . . . . . . . . . . . . . . . . . . . . . 54
6.1.1 Probability distribution function . . . . . . . . . . . . . . . . . 546.1.2 Auto-correlation . . . . . . . . . . . . . . . . . . . . . . . . . 556.1.3 Power spectrum . . . . . . . . . . . . . . . . . . . . . . . . . . 56
6.2 Double point methods . . . . . . . . . . . . . . . . . . . . . . . . . . 566.2.1 Cross-correlation . . . . . . . . . . . . . . . . . . . . . . . . . 566.2.2 Cross-power spectrum, coherence, phase spectrum . . . . . . . 576.2.3 Wavenumber-frequency spectrum . . . . . . . . . . . . . . . . 58
II Fluctuations measurements 61
7 Measurements of sheared electric fields and flows at the plasmaedge of the CASTOR tokamak 637.1 Experimental set-up . . . . . . . . . . . . . . . . . . . . . . . . . . . 647.2 Radial profiles at the plasma edge . . . . . . . . . . . . . . . . . . . . 647.3 Determination of the poloidal velocity of plasma fluctuations . . . . . 65
7.3.1 Radial profile of the phase velocity - double rake probe . . . . 677.3.2 Poloidal profile of the phase velocity - poloidal ring . . . . . . 70
7.4 Turbulent structures versus velocity shear . . . . . . . . . . . . . . . 717.5 Summary . . . . . . . . . . . . . . . . . . . . . . . . . . . . . . . . . 73
8 Investigation of the CASTOR SOL by means of 2D matrix of Lang-muir probes 758.1 Experimental set-up . . . . . . . . . . . . . . . . . . . . . . . . . . . 768.2 Mapping of magnetic field lines in the SOL . . . . . . . . . . . . . . . 778.3 Fluctuations measurements by the 2D probe and the rake probe . . . 788.4 Poloidal velocity of turbulent structures with DC biasing . . . . . . . 808.5 Summary . . . . . . . . . . . . . . . . . . . . . . . . . . . . . . . . . 81
9 Analysis of relaxation events in the CASTOR tokamak using deeplyimmersed biasing electrode 839.1 Experimental set-up . . . . . . . . . . . . . . . . . . . . . . . . . . . 849.2 Relaxation events . . . . . . . . . . . . . . . . . . . . . . . . . . . . . 859.3 Magnetic activity of plasma . . . . . . . . . . . . . . . . . . . . . . . 959.4 Summary . . . . . . . . . . . . . . . . . . . . . . . . . . . . . . . . . 96

CONTENTS 175
10 Study of statistical properties of fluctuations in the plasma bound-ary region of the TJ-II stellarator 9710.1 Stellarator . . . . . . . . . . . . . . . . . . . . . . . . . . . . . . . . . 9810.2 TJ-II . . . . . . . . . . . . . . . . . . . . . . . . . . . . . . . . . . . . 9810.3 Experimental set-up . . . . . . . . . . . . . . . . . . . . . . . . . . . 10010.4 Shears in the TJ-II stellarator . . . . . . . . . . . . . . . . . . . . . . 10110.5 Experimental results . . . . . . . . . . . . . . . . . . . . . . . . . . . 10210.6 Summary . . . . . . . . . . . . . . . . . . . . . . . . . . . . . . . . . 105
III Ball-pen probe 107
11 Introduction to the Ball-pen probe measurements 10911.1 Principle of the Ball-pen probe . . . . . . . . . . . . . . . . . . . . . 110
12 A probe-based method for measuring the transport coefficient inthe tokamak edge region 113
13 Novel Technique for Direct Measurement of the Plasma DiffusionCoefficient in Magnetized Plasma 123
14 Measurements with Ball-pen probe on RFX-mod 13114.1 The reversed field pinch configuration . . . . . . . . . . . . . . . . . . 13214.2 RFX-mod experiment . . . . . . . . . . . . . . . . . . . . . . . . . . . 13314.3 Characteristics of turbulence in RFX-mod . . . . . . . . . . . . . . . 13414.4 Experimental set-up of the Ball-pen probe measurements . . . . . . . 13414.5 Evaluation of the diffusion coefficient . . . . . . . . . . . . . . . . . . 136
IV Conclusions 139
15 Conclusions 141
16 List of publications 147
Appendix 155A-1 Toroidal magnetic field . . . . . . . . . . . . . . . . . . . . . . . . . . 155A-2 Integrals of ne and Te . . . . . . . . . . . . . . . . . . . . . . . . . . . 158
Bibliography 161