University System of Maryland Fiscal 2014 Budget...
56
Note: Numbers may not sum to total due to rounding. For further information contact: Sara J. Baker Phone: (410) 946-5530 Analysis of the FY 2014 Maryland Executive Budget, 2013 1 University System of Maryland Fiscal 2014 Budget Overview Department of Legislative Services Office of Policy Analysis Annapolis, Maryland February 2013
Transcript of University System of Maryland Fiscal 2014 Budget...

Note: Numbers may not sum to total due to rounding. For further information contact: Sara J. Baker Phone: (410) 946-5530
Analysis of the FY 2014 Maryland Executive Budget, 2013 1
University System of Maryland
Fiscal 2014 Budget Overview
Department of Legislative Services
Office of Policy Analysis
Annapolis, Maryland
February 2013

R30B00 – University System of Maryland – Fiscal 2014 Budget Overview
Analysis of the FY 2014 Maryland Executive Budget, 2013 2
Operating Budget Data
University of Maryland Overview ($ in Thousands)
FY 12
Actual
FY 13
Working
FY 14
Allowance
FY 13-14
Change
% Change
Prior
Year
General Funds $1,008,636 $980,447 $1,080,476 $100,029 10.2%
Contingent & Back of the Bill Reductions 0 0 -$1,233 -$1,233
Adjusted General Funds $1,008,636 $980,447 $1,079,243 $98,797 10.1%
Special Funds $54,735 $94,021 $76,304 -$17,717 -18.8%
Adjusted Special Funds $54,735 $94,021 $76,304 -$17,717 -18.8%
Other Unrestricted Funds $2,374,230 $2,474,508 $2,534,215 $59,907 2.5%
Adjusted Other Unrestricted Funds $2,374,230 $2,474,508 $2,534,215 $59,907 2.5%
Total Unrestricted Funds $3,437,601 $3,548,975 $3,690,994 $142,019 4.0%
Adjusted Total Unrestricted Funds $3,437,601 $3,548,975 $3,689,762 $140,787 4.0%
Restricted Funds $1,170,320 $1,264,432 $1,263,643 -$789 -0.1%
Adjusted Restricted Funds $1,170,320 $1,264,432 $1,263,643 -$789 -0.1%
Adjusted Grand Total $4,607,921 $4,813,407 $4,953,405 $139,998 2.9%
General funds increase $98.8 million, or 10.1%, in fiscal 2014 after adjusting for the
$1.2 million back of the bill reduction. However, when accounting for $47.7 million in
Budget Restoration Funds created during the 2012 first special session, general funds increase
5.0%, or $51.1 million.
The Higher Education Investment Fund increases 64.6%, or $29.9 million, a portion of which
is related to the use of fund balance from overattainment in fiscal 2012 and 2013. The overall
growth in State funds is 7.5%, or $81.1 million, above fiscal 2013.

R30B00 – University System of Maryland – Fiscal 2014 Budget Overview
Analysis of the FY 2014 Maryland Executive Budget, 2013 3
Personnel Data
FY 12 FY 13 FY 14 FY 13-14
Actual Working Allowance Change
Regular Positions
22,731.80
22,974.76
22,974.76
0.00
Contractual FTEs
5,809.03
5,616.77
5,786.33
169.56
Total Personnel
28,540.83
28,591.53
28,761.09
169.56
Vacancy Data: Regular Positions
Turnover and Necessary Vacancies, Excluding New
Positions
486.94
2.12%
Positions and Percentage Vacant as of 12/31/12
922.85
4.00%
The fiscal 2014 allowance provides for an additional 169.56 contractual positions but no new
regular positions; however, the University System of Maryland (USM) has personnel
autonomy and may create new positions during the fiscal year.
Analysis in Brief
Major Trends
Enrollment: Undergraduate enrollment at USM institutions increased 0.5% to 111,674 in fall 2012.
Second- and Third-year Retention Rates: Overall, when comparing the retention rates of the 2005
and 2009 cohorts, the second-year rate remained fairly constant, only increasing, on average,
0.8 percentage points. However, institutions appeared to have made strides to improve the retention
of students beyond the second year, with the third-year rate increasing, on average, 3.8 percentage
points.
Graduation Rates: When comparing the graduation rates of the 2001 and 2005 cohorts, a majority of
institutions showed improvements in their four-year graduation rates. The same cannot be said of the
six-year rate, which declined at five institutions.
Maryland Community College Transfer Students: In fiscal 2012, 20,611 students transferred to a
USM institution, of which 11,033 came from Maryland community colleges. Four community
colleges accounted for 58.2% of all transfers, while four USM institutions enrolled approximately
77.0% of all community college transfers.
Science, Technology, Engineering, and Mathematics (STEM) Degree Production: Since fiscal
2010, STEM enrollment has grown, on average, 7.5%, resulting in an increase of 6,785 students. In

R30B00 – University System of Maryland – Fiscal 2014 Budget Overview
Analysis of the FY 2014 Maryland Executive Budget, 2013 4
terms of the number of graduates, since falling to a low point of 4,996 in fiscal 2010, the number has
steadily climbed, reaching a high point of 6,086 degrees in fiscal 2012.
Undergraduate Degrees Awarded: Overall, degree production at USM institutions increased 20.7%
between 2008 and 2012. The highest growth rates of 57.0%, or 167 degrees, and 40.0%, or 179
degrees, occurred at Coppin State University and the University of Maryland Eastern Shore,
respectively.
Issues
University of Maryland Center for Environmental Science Seeks to Grant Degrees: In June 2012,
the Board of Regents (BOR) approved a request from the University of Maryland Center for
Environmental Science (UMCES) to seek accreditation from the Middle States Commission on
Higher Education to jointly award a graduate degree in Marine-Estuarine-Environmental Sciences
with other USM institutions. However, as a research institute in current law, UMCES does not have
the degree-granting authority.
Strengthening Oversight and Accountability of Athletic Programs: There has been increasing
concern among BOR that institutions have not recognized their responsibility to provide a full and
complete statement of all revenues and expenditures of their Intercollegiate Athletics (ICA)
programs. In response, BOR revised the ICA policy that provides for increased financial
transparency and updates and improves the information reported on the academic performance of
student athletes. Additionally, information is provided regarding the deficit situation at the Division I
programs.
Status of MPowering: MPowering, an alliance between University of Maryland, Baltimore (UMB)
and University of Maryland, College Park was approved by BOR in March 2012. Under this
framework, the resources of each institution will be leveraged to improve and enhance academic
programs, research, technology transfer, and commercialization.
Effectiveness and Efficiency Hits 10-year Mark – What Is Next?: In the 10 years since USM
implemented its Effectiveness and Efficiency initiative, which sought to change USM’s business
model to effectively deal with increasing fiscal and enrollment demands, a total of $731.6 million in
savings and revenues has been achieved between fiscal 2004 and 2012.
Recommended Actions
1. Add language to reduce the University System of Maryland general fund appropriation made
for the purpose of current services costs.
2. Add language to reduce the University of Maryland, Baltimore and the University of Maryland,
College Park appropriation made for the purpose of the Collaborative School of Public Health.

R30B00 – University System of Maryland – Fiscal 2014 Budget Overview
Analysis of the FY 2014 Maryland Executive Budget, 2013 5
3. Add language to reduce the University System of Maryland appropriation made for the
purpose of program enhancements.
4. Add language to reduce the University of Maryland, College Park appropriation made for the
purpose of the College Park Academy Public Charter School.
5. Add language to restrict the University System of Maryland general fund appropriation.
6. Adopt committee narrative requesting the submission of an annual report on faculty
workload.
7. Adopt committee narrative requesting the submission of a report on institutional aid by
Expected Family Contribution.
8. Adopt committee narrative requesting the submission of an annual report on loan data by
Expected Family Contribution.
Updates
Program Incentive Funding: The 2013 budget bill included language restricting $1 million of
USM’s appropriation to be used only to provide incentive funding to USM institutions that choose to
offer new programs at any of the non-USM regional higher education centers.
New Initiative for Funds Restricted to Maryland Farms: Language in the fiscal 2013 budget bill
restricted $250,000 of UMB’s appropriation and made these funds available to other USM
institutions to assist farmers in the State with estates and trusts issues, compliance with environmental
laws, and other matters necessary to preserve family farms.
Faculty Workload Report: Annual language in the Joint Chairmen’s Report requires USM to submit
a report on the faculty workload. The faculty instruction workload target at comprehensive and
research institutions are 7.5 and 5.5 course units, respectively. Six of the nine USM institutions met
or exceeded the workload target in fiscal 2012.

R30B00 – University System of Maryland – Fiscal 2014 Budget Overview
Analysis of the FY 2014 Maryland Executive Budget, 2013 6

R30B00
University System of Maryland Overview
Analysis of the FY 2014 Maryland Executive Budget, 2013 7
Operating Budget Analysis
Program Description
Title 12 of the Education Article establishes the University System of Maryland (USM) to
“foster the development of a consolidated system of public higher education, to improve the quality
of education, to extend its benefits, and to encourage the economical use of the State’s resources.”
USM consists of 11 degree-granting institutions, a research center, and the system office, which
operates two regional higher education centers. Exhibit 1 illustrates the structure of the system.
Exhibit 1
University System of Maryland
Regional
Centers
Governor
University System
of Maryland Board
of Regents
System Office
UM, Baltimore UM, College
Park
UM Eastern
Shore Bowie State Coppin
State
UM Baltimore
County
University of
Baltimore Frostburg
State
Salisbury
Towson
UM University College UM Center for
Environmental Science
UM: University of Maryland
Source: Department of Legislative Services

R30B00 – University System of Maryland – Fiscal 2014 Budget Overview
Analysis of the FY 2014 Maryland Executive Budget, 2013 8
The Board of Regents (BOR) is the governing body of USM. The board consists of
17 members, including a full-time student and the State Secretary of Agriculture (ex officio). Except
for the Agriculture Secretary, each member is appointed by the Governor with the advice and consent
of the Senate. The board appoints the Chancellor, who serves as the chief executive officer of the
system and the chief of staff to the board. The Chancellor and staff coordinate system planning;
advise the board of systemwide policy; coordinate and arbitrate among system institutions; and
provide technical, legal, and financial assistance.
The board reviews, modifies, and approves a system strategic plan developed by the
Chancellor in consultation with institution presidents. The board is charged with assuring that
programs offered by the institutions are not unproductive or unreasonably duplicative. Other board
activities include reviewing and approving new programs, reviewing existing programs, setting
minimum admission standards, and determining guidelines for tuition and fees. The board monitors
the progress of each system institution toward its approved goals and holds each president
accountable for the progress toward the goals. Furthermore, the board may delegate any of its
responsibilities to the Chancellor.
USM goals, consistent with the State Plan for Higher Education, are to:
create and maintain a well-educated workforce;
promote economic development;
increase access for economically disadvantaged and minority students; and
achieve and sustain national eminence in providing quality education, research, and public
service.
Performance Analysis
1. Enrollment
Creating a well-educated workforce is a goal of USM and a State priority. To that end,
undergraduate enrollment at USM institutions increased 0.5% to 111,674 in fall 2012. Exhibit 2
shows the composition of enrollment by institution. Overall, continuing students comprise 74.9% of
undergraduate enrollment, transfer students account for 12.9%, and the remaining portion consists of
first-time, full-time (FT/FT), and part-time students. In contrast to the growth in undergraduate
enrollment, graduate enrollment decreased 1.3% in fall 2012. This resulted in an overall decline in
enrollment of 0.1%.

R30B00 – University System of Maryland – Fiscal 2014 Budget Overview
Analysis of the FY 2014 Maryland Executive Budget, 2013 9
Exhibit 2
Composition of Fall 2012 Undergraduate Headcount Enrollment
BSU: Bowie State University UMB: University of Maryland, Baltimore
CSU: Coppin State University UMBC: University of Maryland Baltimore County
FSU: Frostburg State University UMCP: University of Maryland, College Park
SU: Salisbury University UMES: University of Maryland Eastern Shore
TU: Towson University UMUC: University of Maryland University College
UB: University of Baltimore
Source: Maryland Higher Education Commission
2. Second- and Third-year Retention Rates
Student persistence, or retention, provides insight into student progression, showing if
students are on track to graduate in a timely manner. Higher rates indicate that students are moving
faster through the pipeline, freeing up space for more students and leading to increased degree
production. Improving the retention of students is a key component of USM’s efforts to double the
number of undergraduate degrees awarded by 2020, one of the four key goals of USM’s strategic
plan. Exhibit 3 shows the second- and third-year retention rates for the 2005 and 2009 cohorts by
institution, excluding the University of Maryland, Baltimore (UMB). The second-year rate increased
at four institutions – the University of Maryland, College Park (UMCP), Towson
0 5,000 10,000 15,000 20,000 25,000 30,000
UMB
UMCP
BSU
TU
UMES
FSU
CSU
UB
SU
UMUC
UMBC
Continuing Students First-time, Full- and Part-time Transfers

R30B00 – University System of Maryland – Fiscal 2014 Budget Overview
Analysis of the FY 2014 Maryland Executive Budget, 2013 10
Exhibit 3
Undergraduate Second- and Third-year Retention Rates 2005 and 2009 Cohort
BSU: Bowie State University UB: University of Baltimore
CSU: Coppin State University UMBC: University of Maryland Baltimore County
FSU: Frostburg State University UMCP: University of Maryland, College Park
SU: Salisbury University UMES: University of Maryland Eastern Shore
TU: Towson University
Note: UB did not enroll undergraduate freshmen until 2007.
Source: Maryland Higher Education Commission
University (TU), Frostburg State University (FSU), and University of Maryland Baltimore County
(UMBC) – while declining at the other four institutions – Bowie State University (BSU), the
University of Maryland Eastern Shore (UMES), Coppin State University (CSU), and Salisbury
University (SU). Institutions appear to have made strides in improving the retention of students
beyond the second year with the third-year rate increasing, on average, 3.8 percentage points. Only
BSU experienced a decline of 1.3 percentage points. TU showed the most improvement with the
second- and third-year rates, increasing 5.5 and 5.6 percentage points, respectively.
3. Graduation Rates
Completion rates are greatly influenced by time – the longer it takes a student to graduate, the
more likely (s)he will dropout as other priorities compete with classes. Longer completion times
translate into increased costs not only for the student but the institution and State as well. A major
academic initiative of the BOR Effectiveness and Efficiency (E&E) initiative is to improve the time
30%
40%
50%
60%
70%
80%
90%
100%
UMCP BSU TU UMES FSU CSU UB SU UMBC
2005 Cohort Second Year 2005 Cohort Third Year
2009 Cohort Second Year 2009 Cohort Third Year

R30B00 – University System of Maryland – Fiscal 2014 Budget Overview
Analysis of the FY 2014 Maryland Executive Budget, 2013 11
to degree. According to USM’s Annual Faculty Workload Report, the latest data available for the
2002 FT/FT cohort showed an increase in the time to degree from 8.6 to 8.7 semesters.
In terms of how well institutions are graduating students, Exhibit 4 compares the four- and
six-year rates of the 2001 and 2005 cohorts and shows there are opportunities for institutions to
improve their performance. The four-year rate declined at three institutions – UMES, FSU, and CSU
– with the largest decline of 7.2 percentage points occurring at UMES. While the majority of
institutions showed improvements in their four-year rates, the same cannot be said of the six-year
rate, which declined at five institutions – UMES, FSU, CSU, SU, and UMBC. Once again, UMES
had the largest decline of 9.1 percentage points. Overall, on average, the six-year rate declined
2.0 percentage points indicating more FT/FT students are not persisting to a degree. However, this
measure does not reflect the changing nature of the student population who are not taking a
traditional pathway to obtain a degree, such as those who change their enrollment status from full- to
part-time student and back again.
Exhibit 4
Four- and Six-year Graduation Rates 2001 and 2005 Cohort
BSU: Bowie State University TU: Towson University
CSU: Coppin State University UMBC: University of Maryland Baltimore County
FSU: Frostburg State University UMCP: University of Maryland, College Park
SU: Salisbury University UMES: University of Maryland Eastern Shore
Source: Maryland Higher Education Commission
0%
10%
20%
30%
40%
50%
60%
70%
80%
90%
UMCP BSU TU UMES FSU CSU SU UMBC
2001 Cohort Four-year Rate 2001 Cohort Six-year Rate
2005 Cohort Four-year Rate 2005 Cohort Six-year Rate

R30B00 – University System of Maryland – Fiscal 2014 Budget Overview
Analysis of the FY 2014 Maryland Executive Budget, 2013 12
4. Maryland Community College Transfer Students
USM tracks the number of community college students transferring to USM institutions as a
measure of meeting the goal of promoting access to its institutions, and increasing the number of
transfers is a key component to meeting the State’s degree completion goal. In fiscal 2012, 20,611
students transferred to a USM institution, representing approximately 18.5% of all undergraduate
students attending USM institutions. Of these students, 11,033 came from Maryland community
colleges with four community colleges accounting for 58.2% of all transfers: Montgomery College;
Community College of Baltimore County; Anne Arundel Community College; and Prince George’s
Community College, approximately 77.0% of the transfers enrolled at four institutions, which is
expected given these institutions account for 74.6% of USM’s total undergraduate enrollment in
fiscal 2011, as depicted in Exhibit 5. In fiscal 2012, UMUC and TU accounted for almost half the
total transfer enrollments with 5,427 students. UMCP and UMBC enrolled 27.8% of all transfers.
TU experienced a 40.8% increase in transfers with the addition of 823 students from fiscal 2010 to
2012.
Exhibit 5
Institutions Receiving Maryland Community College Transfer Students Fiscal 2010-2012
BSU: Bowie State University UMB: University of Maryland, Baltimore
CSU: Coppin State University UMBC: University of Maryland Baltimore County
FSU: Frostburg State University UMCP: University of Maryland, College Park
SU: Salisbury University UMES: University of Maryland Eastern Shore
TU: Towson University UMUC: University of Maryland University College
UB: University of Baltimore
Source: Maryland Higher Education Commission
0
500
1,000
1,500
2,000
2,500
3,000
3,500
UMB UMCP BSU TU UMES FSU CSU UB SU UMUC UMBC
2010 2012

R30B00 – University System of Maryland – Fiscal 2014 Budget Overview
Analysis of the FY 2014 Maryland Executive Budget, 2013 13
Exhibit 6 compares the two- and four-year graduation rates in fiscal 2003 and 2008 of
Maryland community college transfer students, which are equivalent to the four- and six-year rates of
FT/FT students. In general, while the two- and four-year rates are lower than the rates of the FT/FT
students, the two-year rate is significantly lower, which is expected, given a majority of the transfers
are part-time students and, therefore, will take longer to graduate.
Exhibit 6
Two- and Four-year Graduation Rates of
Maryland Community College Transfers Fiscal 2003 and 2008
BSU: Bowie State University UB: University of Baltimore
CSU: Coppin State University UMBC: University of Maryland Baltimore County
FSU: Frostburg State University UMCP: University of Maryland, College Park
SU: Salisbury University UMES: University of Maryland Eastern Shore
TU: Towson University UMUC: University of Maryland University College
Source: University System of Maryland, Patterns of Enrollment and Success updated through fiscal 2011
While the four-year graduation rate for transfer students tends to be lower than that of the
FT/FT students, three institutions – CSU, FSU, UMES – do better at graduating transfer students than
their “native” students. CSU’s two- and four-rates for fiscal 2008 were 9.0 and 40.0%, respectively,
0%
10%
20%
30%
40%
50%
60%
70%
80%
UMCP BSU TU UMES FSU CSU UB SU UMUC UMBC
Fiscal 2003 Two-year Rate Fiscal 2003 Four-year Rate
Fiscal 2008 Two-year Rate Fiscal 2008 Four-year Rate

R30B00 – University System of Maryland – Fiscal 2014 Budget Overview
Analysis of the FY 2014 Maryland Executive Budget, 2013 14
while the four- and six-year rates for the 2005 FT/FT cohort, as shown in Exhibit 4, were 4.2 and
18.0%, respectively. There was significant improvement at UMES, with the four-year rate increasing
20 percentage points to 52.0% in fiscal 2008. This is a higher rate than UMES’ FT/FT students in
which the average six-year rates over the past three cohorts (2003 to 2005) was 37.3%. This trend is
also seen at FSU in which the four-year rate increased 11 percentage points to 64.0% while the
six-year rate for the past three cohorts of FT/FT averaged 56.6%. USM partly attributes this increase
to these institutions having a relatively small number of transfer students.
5. Science, Technology, Engineering, and Mathematics Degree Production
USM’s strategic plan calls for increasing degree production in high need areas of science,
technology, engineering, and mathematics (STEM) by 40% by 2020. In order to meet this goal,
institutions will need to increase production of STEM degrees by approximately 2,200; there is a
related goal that 320 will be STEM teacher graduates.
Prior to fiscal 2009, STEM enrollment grew at a moderate rate and then jumped up, increasing
6.4%, or 1,707 students, in fiscal 2009, as shown in Exhibit 7. Since fiscal 2010 enrollment has
grown, on average, 7.5%, resulting in an increase of 6,785 students. In terms of the number of
graduates, since falling to a low point of 4,996 in fiscal 2010, the number has steadily climbed
reaching a high point of 6,086 degrees in fiscal 2012. USM attributes the overall trend in enrollments
and degrees to the computer and information science (CIS) programs, which tend to have more
students than other programs and, therefore, are a primary driver behind the numbers. USM notes
that recent improvements in the computer science job market led to a 45.0% increase in CIS, which
overshadows growth in other STEM areas. As shown in Exhibit 8, CIS programs account for 38.0%
of the STEM degrees, followed by biological sciences and engineering at 26.0 and 24.0%,
respectively.
USM also plans to triple the number of STEM teacher graduates to at least 321 per year.
According to the Maryland State Department of Education’s (MSDE) teacher staffing report, there
were 116 STEM teacher certifications in fiscal 2011 and 99 in fiscal 2012. This decrease is mostly
attributed to an expected decline of 13 graduates at UMCP. USM notes that MSDE data does not
include individuals participating in alternative certification programs or those who are certified in one
area such as elementary education and seek additional certification in STEM.

R30B00 – University System of Maryland – Fiscal 2014 Budget Overview
Analysis of the FY 2014 Maryland Executive Budget, 2013 15
Exhibit 7
Students Enrolled and Graduates in STEM Programs Fiscal 2007-2012
STEM: science, engineering, mathematics, and technology
Note: STEM includes bachelor, master, and doctoral programs in biological sciences, computer and information sciences,
engineering, mathematics, physical sciences, and natural sciences programs.
Source: Governor’s Budget Books, Fiscal 2014
5,276 5,218 5,121 4,996 5,496
6,086
2.8% 2.3%
6.4%
7.7% 7.9%
6.7%
0%
1%
2%
3%
4%
5%
6%
7%
8%
9%
0
1,000
2,000
3,000
4,000
5,000
6,000
7,000
2007 2008 2009 2010 2011 2012
Graduates % Change Enrollment

R30B00 – University System of Maryland – Fiscal 2014 Budget Overview
Analysis of the FY 2014 Maryland Executive Budget, 2013 16
Exhibit 8
Portion of STEM Degrees by Program Fiscal 2012
STEM: science, technology, engineering, and mathematics
Source: University System of Maryland
6. Undergraduate Degrees Awarded
In order to produce a well-educated workforce and meet completion goals, USM will need to
increase the number of undergraduate degrees awarded. Exhibit 9 compares the number of
undergraduate degrees conferred by institution between fiscal 2008 and 2012. Overall, degree
production at institutions increased 20.7% from 18,719 in fiscal 2008 to 22,585 in fiscal 2012. The
highest growth rates of 57.0%, or 167 degrees, and 40.0%, or 179 degrees, occurred at CSU and
UMES, respectively. USM states this may be the result of a growth in the number of graduating
transfer students coupled with an increase in the number of students completing their degrees within 7
to 10 years. According to USM, this seems to have coincided with a period of enrollment growth at
both institutions; therefore, this appears to be an anomaly. After CSU and UMES, UMUC and TU
experienced the highest growth rates, which is more in line with expectations.
Computer and
Information
Science
38%
Biological
Sciences
26%
Engineering
24%
Mathematics
5%
Physical Sciences
7%

R30B00 – University System of Maryland – Fiscal 2014 Budget Overview
Analysis of the FY 2014 Maryland Executive Budget, 2013 17
Exhibit 9
Total Undergraduate Degrees Awarded Fiscal 2008 and 2012
BSU: Bowie State University UMB: University of Maryland, Baltimore
CSU: Coppin State University UMBC: University of Maryland Baltimore County
FSU: Frostburg State University UMCP: University of Maryland, College Park
SU: Salisbury University UMES: University of Maryland Eastern Shore
TU: Towson University UMUC: University of Maryland University College
UB: University of Baltimore
Source: University System of Maryland
At UMB, the number of degrees declined 2.9% due to a transition from an accelerated
undergraduate nursing program to a master’s level program for entry-level students with a prior
bachelor’s degree in a non-nursing field. UMB notes that the reduction in the number of bachelor’s
degrees is offset by an increase in master’s degrees.
-2.9%
11.6%
11.7%
28.0%
40.0% 12.9% 57.0%
20.9%
15.1%
39.0%
16.1%
0
1,000
2,000
3,000
4,000
5,000
6,000
7,000
8,000
UMB UMCP BSU TU UMES FSU CSU UB SU UMUC UMBC
2008 2012

R30B00 – University System of Maryland – Fiscal 2014 Budget Overview
Analysis of the FY 2014 Maryland Executive Budget, 2013 18
Fiscal 2013 Actions
The Budget Reconciliation and Financing Act of 2012 allowed USM to increase salaries in
order to retain faculty and “operationally critical staff.” USM developed policies and procedures
similar to those implemented in prior years to increase salaries to retain faculty. A total of 240
personnel were classified as operationally critical: 44 staff and 196 faculty received salary raises
totaling $3.7 million. Of the 44 staff deemed critical, most are administrators and managers in the
financial, information technology, and health care fields. Once again, a significant portion of faculty,
41.3%, is in health-related fields at UMB. All institutions used this option to help retain personnel, as
shown in Exhibit 10. USM notes 53.0% of the increased funding came from non-State sources with
the remaining 47.0% from State sources.
Exhibit 10
Positions and Salary Increased to Retain Personnel July 1 to October 31, 2012
Institution Faculty Staff Total
Total
Increase
University of Maryland, Baltimore 81 9 90 $2,007,855
University of Maryland, College Park 49 3 52 931,682
Bowie State University 0 3 3 28,275
Towson University 2 1 3 19,525
University of Maryland Eastern Shore 14 0 14 61,148
Frostburg State University 1 1 2 22,500
Coppin State University 0 5 5 40,094
University of Baltimore 7 1 8 95,496
Salisbury University 18 0 18 90,051
University of Maryland University College 0 1 1 14,850
University of Maryland Baltimore County 23 18 41 341,409
University of Maryland Center for Environmental Science 1 0 1 5,000
University System of Maryland Office 0 2 2 22,547
Total 196 44 240 $3,680,432
Source: University System of Maryland

R30B00 – University System of Maryland – Fiscal 2014 Budget Overview
Analysis of the FY 2014 Maryland Executive Budget, 2013 19
Proposed Budget
The general fund allowance for fiscal 2014 is 10.1%, or $98.8 million, higher than in
fiscal 2013, after adjusting for the across-the-board reduction of $1.2 million, as shown in Exhibit 11.
However, when accounting for $47.7 million in Budget Restoration Funds created during the
2012 first special session, general funds increase $51.1 million, or 5.0%, over fiscal 2013. The
Higher Education Investment Fund (HEIF) increases 64.6%, or $29.9 million, a portion of which is
related to the use of fund balance from overattainment in fiscal 2012 and 2013. The overall growth in
State funds is 7.5%, or $81.1 million, over fiscal 2013, to $1.16 billion.
Exhibit 11
Proposed Budget University System of Maryland
($ in Thousands)
FY 12
Actual
FY 13
Working
FY 14
Adjusted
FY 13-14
Change
% Change
Prior Year
General Funds $1,008,636 $980,447 $1,079,243 $98,797 10.1%
HEIF $54,735 46,363 76,304 29,940 64.6%
Budget Restoration Funds
47,657 0 -47,657
Total State Funds 1,063,371 1,074,467 1,155,547 81,080 7.5%
Other Unrestricted Funds 2,374,230 2,474,508 2,534,215 59,707 2.4%
Total Unrestricted Funds 3,437,601 3,548,975 3,689,762 140,787 4.0%
Restricted Funds 1,170,320 1,264,432 1,263,643 -789 -0.1%
Total Funds $4,607,921 $4,813,407 $4,953,405 $139,998 2.9%
HEIF: Higher Education Investment Fund
Note: Fiscal 2014 general funds are adjusted by $1.2 million to reflect across the board reductions. Numbers may not
sum to total due to rounding.
Source: Governor’s Budget Book, Fiscal 2014; Department of Legislative Services
For a fourth consecutive year, the Governor’s allowance assumes a resident undergraduate
tuition rate increase of 3% at most USM institutions. The allowance provides $4.6 million to hold
tuition increases to this level. In regards to personnel expenses, the allowance provides $9.3 million
for three months of merit increases (beginning in April 2014), consistent with the merit pay provided
in the budget for all State employees. In addition, funds for a 3% cost-of-living adjustment (COLA)
effective January 1, 2014, are included in the Department of Budget and Management’s budget. The
COLA totals $33.1 million of which the general fund portion is $20.3 million. The remaining
$12.8 million is to be funded from other current unrestricted revenues.

R30B00 – University System of Maryland – Fiscal 2014 Budget Overview
Analysis of the FY 2014 Maryland Executive Budget, 2013 20
Other current unrestricted funds increase 2.5%, or $60.9 million, over fiscal 2013. This is
mainly due to tuition and fee revenues growing 2.5%, or $36.1 million, and 2.2%, or $12.6 million,
growth in auxiliary revenues.
Current Services Costs
Overall, USM’s current services costs (CSC) are estimated to increase $83.6 million, as
shown in Exhibit 12. These costs are typically funded with unrestricted revenues e.g., general funds,
the HEIF, and tuition and fee revenues. Personnel costs comprise 58.9% of the increase with health
insurance and benefits accounting for 30.9% of the CSC. The annualization of the fiscal 2013 COLA
and the fiscal 2014 merit increase account for $23.4 million of the CSC.
Exhibit 12
University System of Maryland
Increase in Current Services Costs Fiscal 2014
Amount
Health, Retirement, and Other Fringes $25,834,397
Annualization of the Fiscal 2013 Cost-of-living Adjustment 14,068,644
Facilities Renewal 12,028,221
New Facilities 11,981,400
Fiscal 2014 Merit Increase 9,320,119
Institutional Aid 4,906,321
Fuel and Utilities 2,834,343
Academic Revenue Bond Debt Service 2,660,000
Total Current Services Costs $83,633,445
Note: The University System of Maryland (USM) estimated the current services cost to increase $90.2 million.
However, USM includes a systemwide increase in undergraduate and graduate financial aid of $11.5 million, of which
$4.9 million is attributed to a 3% growth in undergraduate and graduate aid. The remaining $6.6 million is better
categorized as enhancement funding and, therefore, deducted from USM’s cost of current services.
Source: University System of Maryland

R30B00 – University System of Maryland – Fiscal 2014 Budget Overview
Analysis of the FY 2014 Maryland Executive Budget, 2013 21
When accounting for the fiscal 2014 COLA and adjusting for the $1.2 million in savings in
health insurance, expenditures total $115.4 million, as shown in Exhibit 13. On the revenue side,
new State funds total $101.4 million, which includes $20.3 million budgeted elsewhere to fund the
State portion of the COLA. Other new revenues include $36.1 million in new tuition and fee
revenues. Additionally, in fiscal 2014, USM will transfer $10.0 million from the fund balance to
supplement the State funds for initiatives and program enhancements. This will provide USM with
$34.8 million to fund program enhancements. However, this is an understatement of the available
revenues.
Exhibit 13
USM State-supported Revenues Available for Program Enhancements Fiscal 2014
$ Amount
Expenditures
Current Services Cost Increase1
$82,400,784
Employee COLA
33,051,719
Total Expenditures
$115,452,503
Revenues
General Funds and HEIF
New General Funds and HEIF1 $81,079,557
COLA Funds Received through DBM Budget 20,277,945
Total New State Funds $101,357,502
New Tuition and Fee Revenues
36,118,028
Other New Unrestricted Revenues2
2,776,875
New General Fund, Tuition, and Other Revenues
$140,252,405
Other Funds
Transfer from Fund Balance
$10,000,000
Funds Available for Enhancements/Enrollment Growth
$34,799,902
(Revenues Less Expenditures)
COLA: cost-of-living adjustment
DBM: Department of Budget and Management
HEIF: Higher Education Investment Fund
1Current services costs and general funds are adjusted by $1.2 million to reflect the across-the-board reduction due to
savings in health insurance. 2Does not include auxiliary or restricted revenues.
Note: The University System of Maryland (USM) estimated the current services cost to increase $90.2 million.
However, USM estimates a systemwide increase in undergraduate and graduate financial aid of $11.5 million, of which
$4.9 million is attributed to a 3% growth in undergraduate and graduate aid. The remaining $6.6 million is better
categorized as enhancement funding and, therefore, deducted from USM’s cost of current services.
Source: Governor’s Budget Books, Fiscal 2014; University System of Maryland; Department of Legislative Services

R30B00 – University System of Maryland – Fiscal 2014 Budget Overview
Analysis of the FY 2014 Maryland Executive Budget, 2013 22
As shown in Exhibit 14, over the past three years, tuition and fee revenues have been
consistently underestimated, particularly in fiscal 2010 and 2011, when revenues exceeded the
appropriation by $172.7 million. During this time period, USM projected only a slight growth in
enrollment but actually experienced a growth of over 3.0%. While revenues were modestly
underestimated in fiscal 2012 and 2013 to date, they still notably exceeded the allowance by
$82.9 million. The increases in tuition and fee rates in fiscal 2014, coupled with modest enrollment
growth of 1.1%, will very likely result in new tuition and fee revenues exceeding the $36.1 million in
the allowance.
Exhibit 14
Comparison of Appropriated and Actual
Tuition and Fee Revenues Fiscal 2010-2014
($ in Millions)
2010 2011 2012 2013 2014
Appropriated $1,168.0 $1,230.8 $1,376.0 $1,416.3 $1,498.52
Actual 1,244.2 1,327.2 1,412.8 1,462.41
$ Difference $76.2 $96.4 $36.8 $46.1
% Difference 6.5% 7.8% 2.7% 3.3%
1Reflects the fiscal 2013 working appropriation to date. USM typically brings in additional revenues in the spring each
year. 2Reflects the fiscal 2014 allowance.
Source: Governor’s Budget Books
Given that revenues are very likely underestimated, USM will have additional funds to put
toward CSC and/or program enhancements. As will be further discussed in this analysis, over the
past three years, general funds/HEIF comprised about 30% of USM’s unrestricted revenues. USM
estimated that CSC in fiscal 2014 totals $90.2 million, with State funds comprising 64.2%, or
$57.9 million, and the remaining 35.8% coming from other unrestricted revenue. Therefore, given
these factors, the Department of Legislative Services (DLS) recommends reducing USM’s
fiscal 2014 general fund appropriation made for the purpose to fund CSC by $10.0 million.
State funds for CSC will still be covering more than its share of current unrestricted revenues.
The fiscal 2014 allowance provides $24.4 million in general funds and HEIF to fund program
enhancements and initiatives, with $10.0 million from fund balance and $1.7 million of tuition and
fee revenues totaling $36.1 million for program enhancements. The allocation by initiative and
institution is shown in Exhibit 15. The largest single component is $12.0 million to fund
STEM/health and workforce initiatives, which include:

R3
0B
00
– U
niversity S
ystem
of M
aryla
nd
– F
iscal 2
01
4 B
ud
get O
verview
An
alysis o
f the F
Y 2
014 M
aryla
nd E
xecu
tive Bu
dget, 2
013
23
Exhibit 15
Program Initiative Funding Fiscal 2014
MPowering
and
Technology
Transfer
STEM/Health
and Workforce
Academic
Transformation
Achievement
Gap/
Completion
UMCP
Charter
School/
Hughes
Center
UMES
Extension Total
Univ. of Maryland, Baltimore $4,514,607 $799,288 $1,000,000
$6,313,895
Univ. of Maryland, College Park 4,700,000 7,170,000 1,626,540 $950,000 $700,000
15,146,540
Bowie State University
22,902 1,012,467
1,035,369
Towson University
560,518 1,210,171 1,358,805
3,129,494
Univ. of Maryland Eastern Shore
534,151 125,000 577,169
$300,000 1,536,320
Frostburg State University
218,442 134,000 167,000
519,442
Coppin State University
690,000
710,000
1,400,000
Univ. of Baltimore 97,553
107,500 301,500
506,553
Salisbury University
443,500
774,670
1,218,170
Univ. Maryland University College
778,169
778,169
Univ. Maryland Baltimore County 250,000 825,000 600,000 1,660,553
3,335,553
Univ. of Maryland Center for
Environmental Science
798,964
798,964
University System of Maryland Office
300,000 36,635
336,635
Total $9,562,160 $12,039,863 $5,904,282 $7,548,799 $700,000 $300,000 $36,055,104
STEM: science, technology, engineering, and mathematics
UMCP: University of Maryland, College Park
UMES: University of Maryland Eastern Shore
Source: University System of Maryland

R30B00 – University System of Maryland – Fiscal 2014 Budget Overview
Analysis of the FY 2014 Maryland Executive Budget, 2013 24
hiring faculty and instructors (UMCP, UMES, FSU, UMBC);
renovating and expanding labs and classrooms (UMCP);
redesigning STEM courses (UMBC, CSU);
expanding programs (UMB, TU, SU);
purchasing equipment (UMES, FSU, CSU); and
enhancing fundraising for STEM students and facilities (UMCP).
UMCES receives $0.8 million to expand sponsored research, provide research and education
on sustainability, and commercialize technologies developed at the Institute of Marine and
Environment Technologies.
MPowering, which will be further discussed in Issue 3, and technology transfer activities
receive $9.6 million, which includes:
hiring an assistant director focusing on technology transfer and legal implications (UB);
expanding technology transfer and business creation (UMBC);
UM Ventures (UMB, UMCP);
Collaborative School of Public Health (UMB, UMCP); and
developing new academic model at Universities of Shady Grove.
DLS recommends reducing the general fund appropriation for UMB and UMCP, which
is to be used to fund the Collaborative School of Public Health, by $950,000. This is not the first
time these two universities sought to establish a joint School of Public Health. In 2007, BOR
approved the creation of a joint school. In support of this effort, the State provided $10.5 million to
UMCP: $3.0 million in general funds ($2.0 million in fiscal 2007 and $1.0 million in fiscal 2008) to
establish a School of Public Health and $7.5 million in HEIF funds in fiscal 2009 to renovate a
building to provide new space for the school. However, despite this investment, a Joint School of
Public Health was never realized.
Programs receiving a total of $7.5 million for closing the achievement gap and completion
include:
hiring faculty and advisors (UMES, UB);

R30B00 – University System of Maryland – Fiscal 2014 Budget Overview
Analysis of the FY 2014 Maryland Executive Budget, 2013 25
purchasing various software to assess student outcomes, serve as an early warning system, and
accommodate students with disabilities (FSU, CSU, TU);
expanding existing programs (BSU, TU, CSU, UB, SU, UMBC);
increasing financial aid (FSU, SU, UMBC); and
purchasing classroom equipment (UMES).
While most institutions are using enhancement funding to hire faculty, the allowance does not
provide any new regular positions but does include contractual positions. The Chancellor should
comment on the misalignment between use of funds and positions provided in the allowance.
Academic transformation (e.g., course redesign and other innovations and the assessment of
student outcomes and efficiencies gained if these projects are scaled up) receives $5.9 million, which
includes:
redesigning courses (all institutions except UB);
creating centers for academic transformation (TU, USM Office) and Mathematics Learning
(UB); and
renovations and facilities renewal to support changing instructional methods (UMBC).
Additionally, $1.0 million is designated to specific programs at UMCP and UMES. UMES
receives $0.3 million to meet federal matching fund requirements for the agriculture experiment
station program. At UMCP, $0.5 million is to fund the College Park Academy Public Charter
School, at which a student can graduate from high school with up to 60 college credits, and the
remaining $0.2 million funds the Harry R. Hughes Agro-Ecology Center that was previously funded
through the Maryland Higher Education Commission. DLS recommends reducing UMCP’s
fiscal 2014 general fund appropriation by $500,000, which is to be used to fund the College
Park Academy Public Charter School. Public charter schools have not received direct funding
from the State. Charter schools receive funding from the local school system out of the existing State
and local educational aid; therefore, the same methodology should be applied to funding the College
Park Academy.
DLS also recommends reducing USM’s fiscal 2014 general fund appropriation by
$8.0 million. This represents approximately one-third of the State dollars designated to fund various
initiatives. As previously discussed, USM has other sources of revenue it can draw upon or can
reallocate resources to fund these initiatives. Furthermore, DLS recommends restricting the
remaining $14.9 million of USM’s fiscal 2014 appropriation for program enhancements until
USM submits a report detailing specifically how these funds will be used and metrics that will
be used to measure the progress or results of the activities funded with State funds.

R30B00 – University System of Maryland – Fiscal 2014 Budget Overview
Analysis of the FY 2014 Maryland Executive Budget, 2013 26
USM is also funding other activities totaling $7.2 million with other funds which include:
$2.9 million to hire and implement systems to ensure compliance with federal regulations for
research and financial aid (UMCP, UMB);
$1.4 million for technology initiatives to improve business processes (UMUC);
$1.0 million for police and public safety enhancements (UMB);
$0.7 million to be used as seed money to fund institutions offering programs at non-USM
regional higher education centers (USM Office);
$0.6 million for program expansion at the Universities at Shady Grove;
$0.3 million to increase the capacity of data warehouse security cameras (SU); and
$0.3 million for information disaster recovery (BSU).
Current Unrestricted Fund Expenditures
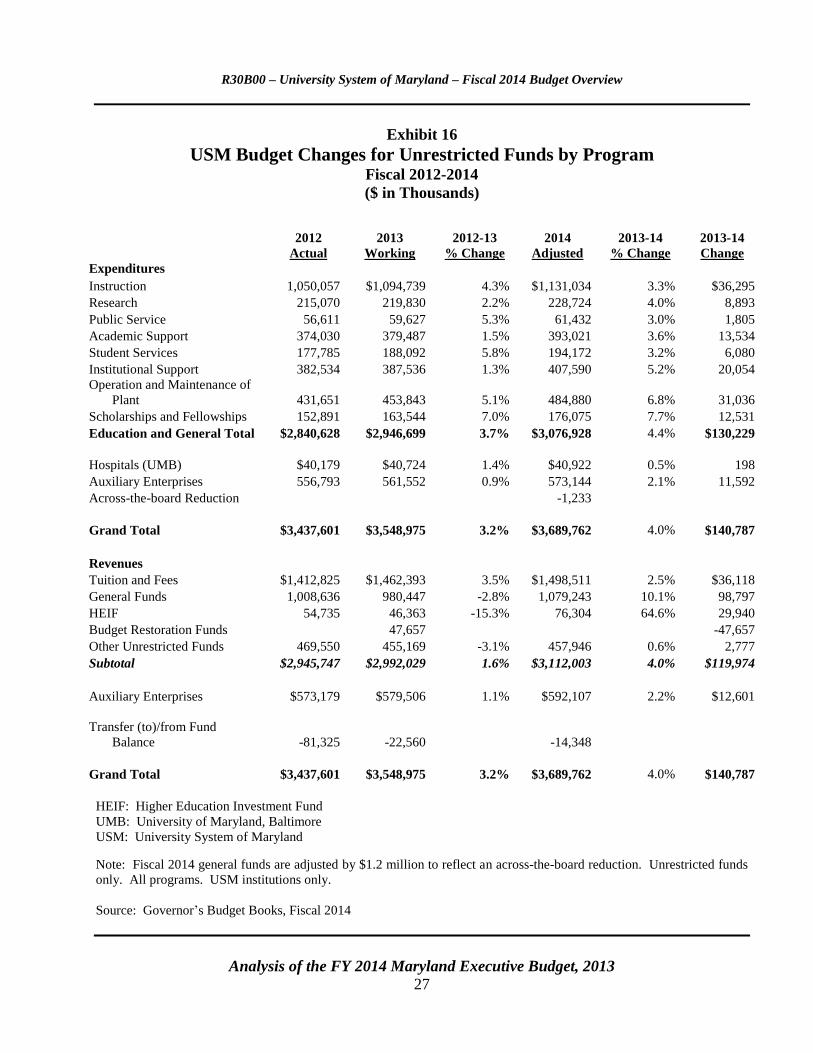
Budget changes by program area in the allowance are shown in Exhibit 16. This data
considers unrestricted funds only, the majority of which consist of general funds and tuition and fee
revenues. Expenditures on scholarships and fellowships increase at the highest rate of 7.7%, or
$12.5 million. Spending in other program areas is increasing due to a rise in personnel expenditures
relating to the annualization of the fiscal 2013 COLA, merit, and fringe benefits. The increase in
instruction of $36.6 million includes costs related to the academic transformation and STEM
initiatives. Operations and maintenance of plant grows by 6.8%, or $31.0 million, and includes the
opening of new facilities and increased spending on facilities renewal. Spending on institutional
support increases 5.2%, or $20.0 million, and is partly attributed to MPowering initiatives and
increasing campus security and grant compliance. Academic support increases $13.5 million, or
3.6%, partly due to technology enhancements at UMUC.
R30B00 – University System of Maryland – Fiscal 2014 Budget Overview
Analysis of the FY 2014 Maryland Executive Budget, 2013 27
Exhibit 16
USM Budget Changes for Unrestricted Funds by Program
Fiscal 2012-2014
($ in Thousands)
2012
Actual
2013
Working
2012-13
% Change
2014
Adjusted
2013-14
% Change
2013-14
Change
Expenditures
Instruction 1,050,057 $1,094,739 4.3% $1,131,034 3.3% $36,295
Research 215,070 219,830 2.2% 228,724 4.0% 8,893
Public Service 56,611 59,627 5.3% 61,432 3.0% 1,805
Academic Support 374,030 379,487 1.5% 393,021 3.6% 13,534
Student Services 177,785 188,092 5.8% 194,172 3.2% 6,080
Institutional Support 382,534 387,536 1.3% 407,590 5.2% 20,054
Operation and Maintenance of
Plant 431,651 453,843 5.1% 484,880 6.8% 31,036
Scholarships and Fellowships 152,891 163,544 7.0% 176,075 7.7% 12,531
Education and General Total $2,840,628 $2,946,699 3.7% $3,076,928 4.4% $130,229
Hospitals (UMB) $40,179 $40,724 1.4% $40,922 0.5% 198
Auxiliary Enterprises 556,793 561,552 0.9% 573,144 2.1% 11,592
Across-the-board Reduction -1,233
Grand Total $3,437,601 $3,548,975 3.2% $3,689,762 4.0% $140,787
Revenues
Tuition and Fees $1,412,825 $1,462,393 3.5% $1,498,511 2.5% $36,118
General Funds 1,008,636 980,447 -2.8% 1,079,243 10.1% 98,797
HEIF 54,735 46,363 -15.3% 76,304 64.6% 29,940
Budget Restoration Funds 47,657 -47,657
Other Unrestricted Funds 469,550 455,169 -3.1% 457,946 0.6% 2,777
Subtotal $2,945,747 $2,992,029 1.6% $3,112,003 4.0% $119,974
Auxiliary Enterprises $573,179 $579,506 1.1% $592,107 2.2% $12,601
Transfer (to)/from Fund
Balance -81,325 -22,560 -14,348
Grand Total $3,437,601 $3,548,975 3.2% $3,689,762 4.0% $140,787
HEIF: Higher Education Investment Fund
UMB: University of Maryland, Baltimore
USM: University System of Maryland
Note: Fiscal 2014 general funds are adjusted by $1.2 million to reflect an across-the-board reduction. Unrestricted funds
only. All programs. USM institutions only.
Source: Governor’s Budget Books, Fiscal 2014

R30B00 – University System of Maryland – Fiscal 2014 Budget Overview
Analysis of the FY 2014 Maryland Executive Budget, 2013 28
Sources of Revenue
Over the past seven years, total revenues increased $1.3 billion, or 34.3%, with three revenue
sources (tuition and fees, State funds (general and HEIF), and restricted funds) accounting for, on
average, 77.3% of the total revenues. As shown in Exhibit 17, despite a tuition freeze from
fiscal 2007 to 2010, tuition and fee revenues grew 46.6%, or $476.4 million. In fiscal 2014, these
revenues totaled $1.5 billion, accounting for 30.2% of USM’s total revenues. Prior to fiscal 2012,
tuition and fee revenues comprised roughly one-quarter of total revenues, but this started to change in
fiscal 2010. Overall, restricted revenues, which are comprised of primarily of research and grant
funding, have steadily increased and now account for about one quarter of total revenues.
Exhibit 17
University System of Maryland Primary Revenue Sources Fiscal 2007-2014
($ in Millions)
Source: Governor’s Budget Books
Positions
While the fiscal 2013 allowance did not provide USM with any new regular positions, the
number of filled positions, as of October 2012, increased 3.8%, or 805 full-time equivalent (FTE)
$0 $500 $1,000 $1,500
2007
2008
2009
2010
2011
2012
2013
2014
Restricted Funds State Funds Tuition and Fee

R30B00 – University System of Maryland – Fiscal 2014 Budget Overview
Analysis of the FY 2014 Maryland Executive Budget, 2013 29
positions, as shown in Exhibit 18. Of these positions, 730 are State-supported (funded with
unrestricted revenues excluding auxiliary), of which 41.2% are in instruction, which may be an
indication of an improving economy. Conversely, between 2009 and 2010 during the downturn in the
economy, the number of State-funded positions declined by 63.48. Since USM has statutory
authority to establish staffing levels within existing funds, it can create positions as needed. The
increase in the number of non-State-supported positions in 2009 and 2010 was driven by an average
growth of 10.4% in auxiliary. Since auxiliary includes self-supported activities, such as food
services, residences halls and intercollegiate athletics, it is expected that positions would increase
with enrollment growth of 9.7%. Prior to 2011, the rate of growth in non-State-funded positions
averaged 3.8%, which has since slowed to an average of 1.5%. This can be attributed to a moderate
growth in research positions, which account for approximately 17.0% of all positions compared to
9.0% for auxiliary, which, on average, grew 1.5% compared to 5.3% prior to 2011.
Exhibit 18
Change in USM Personnel State- and Non-State-supported Positions 2007-2012
USM: University System of Maryland
Note: Number of filled positions as of October of each year. Excludes the University of Maryland Center for
Environmental Science, the University of Maryland Biotechnology Institute, and USM Office.
Source: University System of Maryland Institutions; Department of Legislative Services
Exhibit 19 shows changes in filled FTE positions per 100 full-time equivalent students
(FTES) by program area. The total number of positions grew 20.3% relative to the 24.0% enrollment
growth between fiscal 2006 and 2012. The number of filled positions per 100 FTES declined in all
-200
0
200
400
600
800
1,000
1,200
2007 2008 2009 2010 2011 2012
State-supported Position Non-State-supported Position

R30B00 – University System of Maryland – Fiscal 2014 Budget Overview
Analysis of the FY 2014 Maryland Executive Budget, 2013 30
areas except academic support, research, and auxiliary, which is mainly comprised of non-State-
supported positions. Instruction declined at the highest rate of 8.4%, which suggests that in order to
meet the growing demand, institutions are relying on adjunct faculty to teach courses. Operations and
maintenance of plant declined 8.0%, which raises concerns about facility maintenance, particularly as
it relates to facility renewal. Auxiliary grew at the highest rate of 9.1%.
Exhibit 19
Total State and Non-State FTE Positions Per 100 FTES Fiscal 2006 and 2012
FTE: full-time equivalent
FTES: full-time equivalent student
Note: Number of filled positions as of October of each year. Excludes the University of Maryland Center for
Environmental Science, the University of Maryland Biotechnology Institute, and USM Office.
Source: University System of Maryland Institutions; Department of Legislative Services
-8.4%
12.9%
-20.4%
0.4%
-4.0%
-7.6%
-8.0% 9.1%
0
1
2
3
4
5
6
7
2006 2012 2006 2012 2006 2012 2006 2012 2006 2012 2009 2012 2006 2012 2006 2012
State Supported Non-State Supported
Instruction Research Public
Service
Academic
Support
Student
Services
Institutional
Support
Operations &
Maintenance Auxiliary

R30B00 – University System of Maryland – Fiscal 2014 Budget Overview
Analysis of the FY 2014 Maryland Executive Budget, 2013 31
Funding Per Full-time Equivalent Student
Exhibit 20 compares by institution State funds (general fund/HEIF) and tuition and fee
revenues per FTES for the 10-year period of fiscal 2004 to 2014. On average, State funds per FTES
increased 34.5%, while tuition and fee revenues per FTES grew 33.2%. In terms of State funding,
CSU’s funding grew at the highest rate of 108.2%, increasing from $6,582 in fiscal 2004 to $13,706
per FTES in fiscal 2014. BSU grew at the next highest rate of 63.6% with State funds per FTES
increasing $3,319. Being tuition driven, UMUC has the lowest State funds per FTES, at $1,392 in
fiscal 2014.
Exhibit 20
Comparison of USM State Funds and Tuition and Fee Revenues Per FTES Fiscal 2004 and 2014
BSU: Bowie State University UMB: University of Maryland, Baltimore
CSU: Coppin State University UMBC: University of Maryland Baltimore County
FSU: Frostburg State University UMCP: University of Maryland, College Park
FTES: full-time equivalent student UMES: University of Maryland Eastern Shore
SU: Salisbury University UMUC: University of Maryland University College
TU: Towson University USM: University System of Maryland
UB: University of Baltimore
Note: UMCP and UMES exclude funding for the Agriculture Cooperative Extension and Experimental Station.
Source: Governor’s Budget Books, Fiscal 2014
The highest growth rates of tuition and fee revenues per FTES of 53.9 and 51.0% occurred at
UMB and UB, respectively. CSU experienced a 0.9% decline, which can be attributed to a 35.8%, or
$4,600, reduction in the out-of-state tuition in fiscal 2012 so as to better align tuition rates to that
charged by peer institutions.
$0
$10,000
$20,000
$30,000
$40,000
$50,000
$60,000
2004 GF/FTES 2004 TF/FTES 2014 GF/FTES 2014 TF/FTES
UMB UMCP BSU FSUTU UMES CSU SUUB UMBCUMUC

R30B00 – University System of Maryland – Fiscal 2014 Budget Overview
Analysis of the FY 2014 Maryland Executive Budget, 2013 32
Issues
1. University of Maryland Center for Environmental Science Seeks to Grant
Degrees
In June 2012, BOR approved a request from UMCES to seek accreditation from the Middle
States Commission on Higher Education to jointly award a graduate degree in Marine-Estuarine-
Environmental Sciences (MEES) program with other USM institutions, specifically with UMCP.
The MEES program was established in 1978 as an interdisciplinary and inter-institutional graduate
program. The program offers master’s and doctoral degrees in six areas: oceanography, fisheries
science, ecology, environmental molecular biology, environmental chemistry, and environmental
science. Courses offered through the MEES program are available to any USM graduate student.
There are approximately 180 students enrolled in the program with about 200 faculty from five
institutions (UMCP, UMB, UMBC, UMES, and UMCES) participating in the program. The program
is administratively housed at UMCP which provides administrative services, including those related
to admissions, registration, and billing. Additionally, students have access to services provided by
the Graduate School, including assistantships and academic mentoring. The director is considered a
UMCP employee who has a half-time teaching appointment supported by UMCP and half-time
research appointment funded by UMCES.
BOR approval allows UMCES to begin the first phase of the accreditation process. However,
UMCES is currently statutorily authorized to operate as a research institute within USM that does not
grant degrees. The initial phase of the process involves an information session with the Middle States
Commission to determine if UMCES is ready to pursue accreditation or if institutional changes are
necessary in order to pursue accreditation. According to the commission’s website, a candidate must
demonstrate it meets certain requirements including that the institution awards postsecondary degrees
and provides “…written documentation that it is authorized to operate as an educational institution
and award postsecondary degrees…” Under State law, the Governor and General Assembly must
approve new institutions and grant them the authority to award degrees. However, as a research
institute in current law, UMCES does not have the degree-granting authority that the “constituent
institutions” of USM have. Therefore, based on advice from the Attorney General’s Office, UMCES
would not be able to grant degrees without legislative approval. HB 268 of 2013 was introduced to
include UMCES in the definition of “public senior higher education institution” that are authorized to
award degrees.
This change in UMCES’ mission raises several issues and concerns, including the benefits to
the State of having another degree granting institution, especially one specializing in a graduate
degree that does not help the State to achieve its completion goal. Additionally, the issue of whether
UMCES should continue as an independent research institute or be consolidated with another
institution has been the topic of discussion over the past few years. This action would be a move in
the opposite direction than the State has taken over the past years and would increase ongoing costs to
the students and State. There are concerns that the resources needed to become accredited will
impact the ability of UMCES to carry out its core mission, particularly when those resources could be

R30B00 – University System of Maryland – Fiscal 2014 Budget Overview
Analysis of the FY 2014 Maryland Executive Budget, 2013 33
used to enhance and strengthen the existing MEES program. Furthermore, there are questions of how
such a move would benefit current and future MEES students.
The Chancellor should discuss the benefits to the State of having another degree
granting institution, especially one offering a graduate degree in one specialized area. The
Chancellor should also comment on the cost not only of accreditation but of providing the
administrative functions currently provided by UMCP, if State funds will be used to cover these
costs, and if the MEES program would not be better served by using those funds to further
strengthen and enhance the current program.
2. Strengthening Oversight and Accountability of Athletic Programs
Over the past few years, there has been increasing concern among BOR that institutions have
not recognized their responsibility to provide a full and complete statement of all revenues and
expenditures of their Intercollegiate Athletics (ICA) programs. Concerns were further heightened
with media reports regarding the financial condition of programs at UMCP and TU and the direct
impact this has on the student athletes. Additionally, recent scandals at other national ICA programs
highlighted the need for increased BOR oversight. To that end, the Chancellor appointed a USM
Office task force to review current board policy, process, and practice and make recommendations to
improve transparency of financial disclosures and institutional accountability, as well as strengthen
board oversight over the management and finances of ICA programs.
Policy Changes
In September 2012, BOR revised the 10-year-old ICA policy that not only provides for
increased financial transparency of ICA programs but also updates and improves the information
reported on the academic performance of student athletes. Specifically, institutions are required to
disclose finances held by affiliated foundations on behalf of ICA, provide information on debt and
commitments of ICA programs, and report the nature and composition of bonus incentives afforded
to coaches and athletic directors. Additionally, programs are to report all developing or anticipated
fiscal shortfalls as these become known to the Chancellor and the Director of Internal Audits.
The policy expressly states programs are to be self-supporting in that all spending and
expenses are to be paid for by revenues and resources generated by the ICA program. Additionally, if
an institution seeks to support its ICA program through the use of other self-support activities, e.g.,
residence halls or dining services, approval must be sought from BOR prior to of the beginning of the
fiscal year.
BOR also established an Intercollegiate Athletics Workgroup that will review the information
submitted by the institutions. The workgroup will also refer financial and academic matters to the
appropriate standing committee, recommend adjustments to the policy to improve oversight, and
consider other issues that may arise in ICA.

R30B00 – University System of Maryland – Fiscal 2014 Budget Overview
Analysis of the FY 2014 Maryland Executive Budget, 2013 34
Current Deficit Situation
Eight USM institutions participate in ICA. Five have Division I programs – UMCP, TU,
CSU, UMES, and UMBC; BSU has a Division II program; and FSU and SU have Division III
programs, which cannot offer athletic scholarships. Currently, all of USM’s Division I programs are
operating in a deficit situation; however, this is not unique among Division I programs. According to
the National Collegiate Athletics Association (NCAA) 2004-2011 Revenues and Expenses Division I
Report, only 23 of the 120 programs in the Football Bowl Subdivision, which includes UMCP,
reported a net surplus in 2011 with a median surplus of $38.8 million, while the median net deficit at
the remaining institutions was $10.2 million. As in previous years, no institutions in the Football
Championship Subdivision, including TU, reported a surplus (the report only includes those revenues
generated directly by ICA and does not include other sources such as student fees). CSU, UMES,
and UMBC are in Division I without a football subdivision; according to the NCAA, no program in
this category has reported net generated revenues since 2004.
In 2011, UMCP disclosed its ICA program had been operating in a deficit situation since
fiscal 2004 and was only able to balance its budget through transfers from the reserves in an account
held by the Terrapin Club foundation. UMCP developed a plan to eliminate the deficit, which
included loans from other self-supporting programs in fiscal 2013 and 2014 and the elimination of
nine teams. However, the teams would not be cut if they could raise an amount equivalent to eight
years of expenditures or reach benchmarks toward achieving the goal. Due to successful fundraising
activities, men’s track and field will continue for at least another two years. Currently, UMCP’s
accumulated deficit totals $4.0 million.
In November 2012, the financial picture looked a lot brighter when UMCP accepted an
invitation to join the Big Ten on July 1, 2014. This will significantly enhance future revenues by
$100 million in the first six years according to Sports Illustrated. However, the Atlantic Coast
Conference (ACC) recently instituted a $52 million exit fee. In response to comments that the fee
was excessive and UMCP would negotiate a lower fee, the ACC filed a lawsuit to enforce the fee.
Maryland has since filed a complaint against the ACC alleging it violated antitrust laws, breached
contractual obligations, and interfered with the economic growth of the school. In the meantime,
UMCP has established a commission to study how to maximize the academic and athletic advantages
of joining the Big Ten.
TU ended fiscal 2012 with a $1.3 million deficit, higher than the anticipated debt of $850,000.
This situation came to light in September 2012 when TU garnered media attention when the athletic
director recommended the elimination of two men’s teams – baseball and soccer – and the
reinstatement of men’s tennis, to address the long-term financial stability, increase competiveness,
and maintain Title IX compliance. Subsequently, the President established a commission to review
the recommendations and examine alternatives for eliminating the deficit. This issue will be
discussed further in TU’s budget analysis.
An operating deficit of over $1.5 million at UMES came to light as a result of the revised
policy that requires an institution to seek BOR approval for use of other self-supporting funds to
cover ICA expenses. UMES sought approval to transfer $1.3 million of other auxiliary enterprise

R30B00 – University System of Maryland – Fiscal 2014 Budget Overview
Analysis of the FY 2014 Maryland Executive Budget, 2013 35
funds to the ICA program. In order to become self-sufficient, UMES will continue to subsidize the
program from other self-supported programs in fiscal 2014 and 2015 and will increase the student
athletic fee $150 over the next several years.
CSU reported that ICA has operated at a deficit since at least 2005, but the ICA fund balance
cannot be determined prior to 2005 due to a change of accounting software. By fiscal 2010, the
annual deficit was expected to be $876,015, and the shortfall was being covered by transferring
revenues from other auxiliary activities to ICA. In March 2010, CSU presented a plan to the
Education Policy Committee of BOR to balance ICA finances by fiscal 2014. In fiscal 2012 and
2013, the annual shortfall in the ICA program was smaller than anticipated, but overall, the program
is still running a significant deficit. Currently, CSU’s accumulated deficit is $7.0 million. This issue
will be discussed further in CSU’s budget analysis.
In fiscal 2009, UMBC’s ICA program had a negative fund balance of $1.2 million, which
started in fiscal 2004 with a change in athletic conference affiliation that came with additional costs
such as conference fees and increased travel costs. UMBC undertook several actions to decrease
expenses and increase revenues, and in fiscal 2008, ICA ended the year with a $15,923 surplus and
began the first year of a multi-year plan to pay back the deficit. In fiscal 2012, UMBC reported an
operating loss of $150,000, which was eliminated by a transfer of funds from an affiliated foundation.
Currently, UMBC’s accumulated deficit is $0.9 million.
The Chancellor should comment on the ICA deficit situations and ways to keep athletic
expenses in line with the revenue generated by the programs. The Chancellor should also
discuss the impact of UMCP joining the Big Ten conference.
3. Status of MPowering
In 2011, in response to restrictive language in Chapter 395 of 2011 (the budget bill), USM
examined the advantages and disadvantages of merging UMB and UMCP. In December 2011, USM
submitted a report which concluded the cost of merging the two institutions outweighed the benefits;
however, an alternative structure was proposed – a strategic alliance. Under this structure, each
institution remains a distinct, independent institution in which the resources of each will be leveraged
to improve and enhance academic programs, research, technology transfer, and commercialization.
The new alliance, MPowering, was approved by BOR in March 2012. It is governed by a
steering committee headed by the provosts of UMCP and UMB and reports to both presidents on the
progress in carrying out the nine initiatives laid out in the plan submitted to BOR. The steering
committee will also, at the direction of the presidents, implement any new initiatives. The presidents
will, in turn, report to the Chancellor and BOR. In addition, the Chancellor and presidents will
provide annual progress reports to BOR starting in March 2013.
In order to fully implement the initial nine initiatives, it was estimated an additional
$42.7 million will be required over a 10-year period. The fiscal 2014 allowance includes $9.2 million
to fund these activities. To date, accomplishments include:

R30B00 – University System of Maryland – Fiscal 2014 Budget Overview
Analysis of the FY 2014 Maryland Executive Budget, 2013 36
UM Ventures – UMB/UMCP investment: $1.6 million; fiscal 2014 allowance: $2.2 million
established an office combining the resources of the Offices of Technology Transfer
and Commercialization at UMCP and UMB, creating a unified licensing and patenting
process;
appointed a director who reports to the vice presidents for research at UMCP and
UMB;
appointed five site miners at UMB, UMCP, and UMBC who are tech
commercialization experts responsible for identifying and developing those
technologies with commercial potential;
increased invention disclosures 22% and technology licenses 18%; and
created seven new companies.
Health-Related Informatics Center – UMB/UMCP investment: $1.6 million; fiscal 2014
allowance: $2.6 million; Other: $0.5 million; pending National Institute of Health award:
$37.5 million over five years
established a center in which UMCP’s computer science faculty collaborate with
faculty at UMB with expertise in genomics and clinical medicine to understand
diseases and translating research into prevention and treatment methods.
Collaborative School of Public Health – UMB/UMCP investment: $0.3 million; fiscal 2014
allowance: $1.0 million
initiated the accreditation process and developing joint curricula to be offered in 2014.
Universities at Shady Grove – UMB/UMCP investment: $0.5 million; fiscal 2014 allowance:
$1.9 million
initiated planning for expansion of academic programs; and
recruitment underway for a jointly appointed director of the Institute for Bioscience
and Biotechnology Research.
Undergraduate and Graduate Programs – UMB/UMCP investment: $0.1 million;
fiscal 2014 allowance $0.9 million
launched a UM Scholars program with two UMCP students conducting research at the
School of Medicine.

R30B00 – University System of Maryland – Fiscal 2014 Budget Overview
Analysis of the FY 2014 Maryland Executive Budget, 2013 37
Identified Common Library Information and Knowledge Resources – UMB/UMCP
investment: $80,000; fiscal 2014 allowance: $0.8 million.
Center of Excellence in Regulatory Science and Innovation – UMB/UMCP investment:
$0.6 million; FDA award: $1.0 million per year for three years.
established a center focusing on modernizing and improving the ways drugs and
medical devices are reviewed and evaluated.
UM Research and Innovation Seed Grant Program – UMB/UMCP investment: $0.8 million
expanded program to target research that can be used to develop new technologies to
improve health care, resulted in $2 million grant.
Joint Appointment Process – UMB/UMCP investment: in-kind
established “University of Maryland Professor” and made several appointments.
Joint Grants and Submission – UMB/UMCP investment: $0.1 million
established a process and developed a single application and management system.
The Chancellor should comment on efforts to develop new educational offerings between
UMCP and UMB including establishing a 2+2 program for nursing; joint programs between
the Schools of Engineering, Pharmacy, and Medicine; and other academic collaborations. The
Chancellor should also discuss the impact on collaborative research, particularly if such
collaborations have led to grants or awards.
4. Effectiveness and Efficiency Hits 10-year Mark – What Is Next?
It has been 10 years since USM implemented its E&E initiative which sought to change
USM’s business model to effectively deal with increasing fiscal and enrollment demands. The
initiative was implemented during a time of declining State support and a demand from BOR to
improve quality while serving more students with only moderate increases in tuition. E&E started in
June 2003 with BOR undertaking a year-long study to examine how USM could optimize the use of
system resources. Activities included hiring a consultant, Accenture, to provide recommendations on
reducing operating expenditures and identifying alternative revenue sources. Accenture gathered and
analyzed data by institution in the areas of human resources, finance and accounting, procurement,
energy management, and selected areas of student services.
R30B00 – University System of Maryland – Fiscal 2014 Budget Overview
Analysis of the FY 2014 Maryland Executive Budget, 2013 38
E&E initiatives targeted administrative and academic efficiencies, which were tracked not
only in terms of money saved or cost avoided but also the number of additional students that could be
served at no additional cost to the State. Over the years, the E&E Workgroup, which in 2011
became a standing committee of BOR, continuously reviewed and elevated businesses processes and
policies ensuring the efficient use of resources while maintaining quality and access.
Administrative Initiatives
Data was collected over the years on individual administrative activities, which for reporting
purposes were grouped into 18 categories, as shown in Exhibit 21. Savings and revenue
enhancements of $731.6 million were achieved between fiscal 2004 and 2012. By leveraging its
purchasing power, USM was able to achieve savings in the procurement of a variety of goods and
services and energy of $83.0 million and $62.0 million, respectively. USM further identified E&E
activities by four types:
Cost Savings: reduction in current operating expenses;
Strategic Reallocation: reallocation of current resources to a campus priority or critical
need;
Cost Avoidance: applies to a demonstrable unmet need that is fulfilled, such as donation of
technology equipment; and
Revenue Enhancements: new funding streams excluding tuition and fee revenues.
Activities that resulted in a reduction of operating expenses yielded the most savings, totaling
$341.7 million between fiscal 2004 and 2012 with revenue enhancement netting $165.2 million, as
shown in Exhibit 22.

R30B00 – University System of Maryland – Fiscal 2014 Budget Overview
Analysis of the FY 2014 Maryland Executive Budget, 2013 39
Exhibit 21
Cumulative Total Savings and Revenues by General Category As of June 30, 2012
($ in Millions)
General Category Total
Partnership with External Entities $139,470
Reallocation Process 89,287
Competitive Contracting 82,991
Energy Conservation Program 61,987
Technology Improvements 52,512
Indirect Cost 52,321
Redefinition of Work 45,656
Entrepreneurial Initiative 41,424
Budget Reductions 36,699
Business Process Reengineering 35,568
E & E Workgroup Initiatives 27,241
In-sourcing/outsourcing 25,916
Space and Building Efficiencies 13,393
Equipment and Land Acquisitions/Donation 11,818
Collaboration with Academic Institutions 8,582
Distance Education 5,189
Credit Card Availability 1,301
Meeting Federal Requirements 215
Total $731,570
E&E: effectiveness and efficiency
Source: University System of Maryland

R30B00 – University System of Maryland – Fiscal 2014 Budget Overview
Analysis of the FY 2014 Maryland Executive Budget, 2013 40
Exhibit 22
Efficiency Initiatives Savings and Revenue by Category Fiscal 2004-2012
($ in Millions)
Source: University System of Maryland
Academic Initiatives
The goal of the academic initiatives is to serve a growing number of students while
maintaining quality and decreasing the time to degree, leading to an increase in the number of degrees
awarded. Some activities included TU’s trimester experiment, UMCP’s Freshman Connection
Program, UB’s expansion to include freshmen and sophomore students, and the expansion of formal
articulation agreements with community colleges.
Academic Policies
BOR approved three changes to academic policy in 2005 which became effective in fall 2006
that were aimed at decreasing the time to degree:
Encouraging first-time freshmen, whose admission may have been deferred to the spring
semester, to take 12 credits of coursework during the fall semester prior to spring admittance,
$0
$20,000
$40,000
$60,000
$80,000
$100,000
$120,000
2004 2005 2006 2007 2008 2009 2010 2011 2012
Cost Avoidance Cost Savings Revenue Strategic Reallocation
R30B00 – University System of Maryland – Fiscal 2014 Budget Overview
Analysis of the FY 2014 Maryland Executive Budget, 2013 41
helping students graduate in a timely manner and addressing capacity issues at some
institutions.
Encouraging students to take 12 credit hours through alternative means such as online,
independent study, and other non-traditional methods outside the traditional classroom,
thereby freeing up classroom space. In order to track implementation, a target was set for
each institution based on the progression of the fall 2005 cohort. USM reported in Update on
Effectiveness and Efficiency Initiatives: Alternative Means of Earning Academic Credit that
five of the seven institutions for whom the policy is applicable have met the benchmarks.
Establishing 120 credits as the standard number required for a bachelors degree except for
programs requiring five years of course work or programs fulfilling external accreditation
standards.
Faculty Workload
Another key component to improving academic efficiency was increasing the faculty
workload. BOR set standards for tenured/tenure-track faculty workload – faculty at comprehensive
institutions should carry a workload of 7.0 to 8.0 courses and faculty at research institutions a
workload of 5.0 to 6.0 courses. In the early years of E&E, analysis showed that while the teaching
loads were within these ranges but clustered at the lower ends. Therefore, in fiscal 2006, a target was
established that each institution will meet the mid-point of the workload standard – 7.5 course units at
comprehensive institutions and 5.5 course units for research institutions. Overall, USM as a whole
has continued to meet these targets.
Course Redesign
In 2006, USM implemented the Course Redesign Initiative, a systemwide effort focusing on
redesigning large, introductory courses or gateway courses by incorporating technology to improve
student learning outcomes and achieving cost savings. During the first year, an introductory course at
each USM institution was selected for redesign. The success of the initiative, which improved
student outcomes and generated cost savings, led to the creation of the Carnegie Course Redesign 2
funded with $500,000 from the Carnegie Foundation and $1.8 million from fundraising efforts. To
date, 37 courses have been redesigned.
What Is Next?
USM launched the E&E initiative to change the way USM does business so it can effectively
deal with fiscal challenges while increasing its capacity to enroll more students. E&E has proven
successful and now is a standard part of doing business. This raises questions if the efficiencies
achieved so far have been the easier activities or the “low hanging fruit.” Are there activities or
efforts that could garner more efficiencies and cost savings but require more effort and collaboration
among institutions? Instead, it appears current E&E efforts are focusing more on academic

R30B00 – University System of Maryland – Fiscal 2014 Budget Overview
Analysis of the FY 2014 Maryland Executive Budget, 2013 42
initiatives, such as academic transformation while there is less emphasis on garnering even more
administrative efficiencies.
The Chancellor should comment on what is next for the effectiveness and efficiency
initiative and, given that funding of higher education relies on State funds and tuition revenues,
how or what changes need to be made so as to “bend the cost curve.”

R30B00 – University System of Maryland – Fiscal 2014 Budget Overview
Analysis of the FY 2014 Maryland Executive Budget, 2013 43
Recommended Actions
1. Add the following language:
Provided that the appropriation herein for the University System of Maryland institutions
made for the purpose of current services costs shall be reduced by $10,000,000.
Explanation: The language reduces the University System of Maryland (USM) general fund
appropriation made for the purpose of current services costs (CSC) by $10.0 million. Over
the past three years, State funds comprised approximately 23% of USM’s total revenues and
30% of unrestricted revenues. USM estimated CSC for fiscal 2014 will total $90.2 million of
which the State-funded portion is $57.9 million, or 64.2%. State funds for CSC will still
cover more than its share of revenues after accounting for this reduction. Furthermore, given
that revenues are consistently underestimated, particularly tuition and fee revenues, USM will
have additional funds to put toward these costs.
2. Add the following language:
Further provided that the appropriation herein for the University of Maryland, Baltimore and
University of Maryland, College Park made for the purpose of the Collaborative School of
Public Health shall be reduced by $950,000.
Explanation: The language reduces the general fund appropriation for the University of
Maryland, Baltimore and the University of Maryland, College Park (UMCP), which is to be
used to fund the Collaborative School of Public Health, by a total of $950,000. In 2007, the
two institutions received Board of Regents approval to establish a joint School of Public
Health. In support of this effort, the State provided $10.5 million to UMCP to establish a
School of Public Health: $3.0 million in general funds and $7.5 million in Higher Education
Investment Funds to renovate a building to provide new space for the school. Despite this
investment, a joint school was never realized.
3. Add the following language:
Further provided that the appropriation herein for the University System of Maryland
institutions shall be reduced by $8,000,000.
Explanation: The language reduces the University System of Maryland (USM) general fund
appropriation by $8 million. These funds represent approximately one-third of the State
dollars designated for various initiatives and program enhancements above the current
services budget. USM has other revenue sources from which it can draw upon or reallocate
resources to fund initiatives.

R30B00 – University System of Maryland – Fiscal 2014 Budget Overview
Analysis of the FY 2014 Maryland Executive Budget, 2013 44
4. Add the following language:
, provided that the appropriation herein for the University of Maryland, College Park made
for the purpose of the College Park Academy Public Charter School shall be reduced by
$500,000.
Explanation: The language reduces the general fund appropriation for the University of
Maryland, College Park (UMCP) by $0.5 million, which is to be used to fund the College
Park Academy Public Charter School. Public charter schools have not received direct
funding from the State but rather from the local school system out of the existing State and
local education aid. Therefore, the same funding methodology should be applied to the
College Park Academy.
5. Add the following language to the general fund appropriation:
Further provided that $14,900,000 of this appropriation made for the purpose of funding
program initiatives at the University System of Maryland (USM) institutions may not be
expended until USM submits a report to the budget committees detailing how these funds
will be used and metrics to measure the progress or results of the activities funded by this
appropriation. The report shall be submitted to the budget committees by July 1, 2013, or 45
days prior to the release of funds. The budget committees shall have 45 days to review and
comment on the report. Funds restricted pending receipt of the report may not be transferred
by budget amendment or otherwise to any other purpose and shall revert to the General Fund
if the report is not submitted to the budget committees.
Explanation: The budget includes $24.3 million in general funds to fund program
enhancements or initiatives directed toward specific initiatives at USM institutions including
Mpowering and technology transfer; academic transformation; science, technology,
engineering, and mathematics and health-related workforce; and achievement gap and
completion. The language restricts $14.9 million of this appropriation until USM submits a
report detailing how these funds will be used and metrics to measure the progress and/or
results of the activities funded with the enhancement or initiative funds. The report is to be
submitted to the budget committees by July 1, 2013, or 45 days before the release of funds.
Information Request
Report on use and metrics to
measure progress and
programs funded with
initiative funds
A follow-up report on the
metric outcomes
Author
USM
USM
Due Date
July 1, 2013 or 45 days prior
to the release of funds
June 30, 2014

R30B00 – University System of Maryland – Fiscal 2014 Budget Overview
Analysis of the FY 2014 Maryland Executive Budget, 2013 45
6. Adopt the following narrative:
Faculty Workload Report: The committees request that the University System of Maryland
(USM) continue to provide annual instructional workload reports for tenured and tenure-track
faculty. By focusing on these faculty, the committees gain a sense of the teaching activities
for the regular core faculty at the institutions. Additional information may be included at
USM’s discretion. Furthermore, the report should include the percent of faculty meeting or
exceeding teaching standards for tenured and tenure-track faculty for the University of
Maryland, Baltimore.
Information Request
Annual report on
instructional workload for
tenured and tenure-track
faculty
Author
USM
Due Date
December 1, 2013
7. Adopt the following narrative:
Institutional Aid by Expected Family Contribution Category: The committees request
that data be submitted in an electronic format (Excel file) for each University System of
Maryland (USM) institution on undergraduate institutional aid awards. Data should include
the number of institutional aid awards and average award size by Expected Family
Contribution (EFC) for institutional grants, institutional athletic scholarships, and other
institutional scholarships as reported to the Maryland Higher Education Commission
(MHEC) for fiscal 2013. Data should also include the number of institutional aid awards and
average award size by EFC for tuition waivers/remissions of fees to employees and
dependents for fiscal 2013. The report is be submitted either by USM or MHEC.
Information Request
Report on institutional aid by
EFC category
Authors
MHEC or
USM
Due Date
December 15, 2013
8. Adopt the following narrative:
Loan Data by Expected Family Contribution Category: In order to more fully understand
all of the types of aid available to students, the committees request that undergraduate loan
data be submitted for each University System of Maryland (USM) institution. Data should
include, by Expected Family Contribution (EFC), the number of loans and average loan size
of federal subsidized and unsubsidized loans, and loans from private sources as reported to
the Maryland Higher Education Commission (MHEC) for fiscal 2013. Additionally, data
should be provided on Pell grants including the number and average award size by EFC for

R30B00 – University System of Maryland – Fiscal 2014 Budget Overview
Analysis of the FY 2014 Maryland Executive Budget, 2013 46
fiscal 2013. The report is be submitted in an electronic format (Excel file) either by USM or
MHEC.
Information Request
Report on loan data by EFC
category
Authors
MHEC or
USM
Due Date
December 15, 2013

R30B00 – University System of Maryland – Fiscal 2014 Budget Overview
Analysis of the FY 2014 Maryland Executive Budget, 2013 47
Updates
1. Program Incentive Funding
Chapter 148 of 2012 (the budget bill) included language restricting $1 million of USM’s
appropriation to be used only to provide incentive funding to USM institutions that choose to offer
new programs at any of the non-USM regional higher education centers and required that USM
submit a report on the use of these funds. USM submitted a report on December 4, 2012, identifying
the institutions and programs that will be offered at non-USM centers, as shown in Exhibit 23.
Exhibit 23
Program Offerings
Institution Regional Center Program Award
BSU Southern Maryland Higher
Education Center
(SMHEC)
Master of Science in Nursing – Nurse Educator
Track
$126,319
SU SMHEC
Masters in Social Work 241,503
SU Eastern Shore Higher
Education Center
Bachelor of Arts in Interdisciplinary Studies
180,374
UMCP SMHEC Bachelor of Science in Mechanical Engineering
451,804
Total $1,000,000
BSU: Bowie State University
SU: Salisbury University
UMCP: University of Maryland, College Park
Source: University System of Maryland
In order to fund these programs USM will reallocate the general fund appropriation among the
institutions as shown in Exhibit 24.

R30B00 – University System of Maryland – Fiscal 2014 Budget Overview
Analysis of the FY 2014 Maryland Executive Budget, 2013 48
Exhibit 24
Reallocation of General Funds
Allocation of
Restriction
Incentive
Grants
University of Maryland, Baltimore -$178,821
University of Maryland, College Park -401,794 $451,804
Bowie State University -34,796 126,318
Towson University -88,956
University of Maryland Eastern Shore -31,195
Frostburg State University -32,540
Coppin State University -36,920
University of Baltimore -29,462
Salisbury University -38,736 421,878
University Maryland University College -33,172
University Maryland Baltimore County -93,608
Total -$1,000,000 $1,000,000
Source: University System of Maryland
2. New Initiative for Funds Restricted to Maryland Farms
Language in the fiscal 2012 budget bill restricted $250,000 of general operating expenses at
UMB and authorized the funds to be transferred by budget amendment to the USM Office to leverage
State resources to assist farmers in the State with estates and trusts issues, compliance with
environmental laws, and other matters necessary to preserve family farms.
In December 2012, UMCP, UMES, and UMB proposed a joint program, the Agricultural
Services Support Initiative (ASSI), for the entire funding amount. ASSI seeks to provide a broad look
at legal issues facing all parts of the agricultural community. It consists of five parts:
legal consultation and referral through workshops on the Eastern Shore conducted by the
JustAdvice law clinic to explain legal issues to the public;
legal needs assessments through both “town hall” style and virtual meetings with rural
communities to identify areas of legal need;
legal resource development by encouraging UMB Carey School of Law alumni to provide pro
bono or reduced-fee services to rural communities;

R30B00 – University System of Maryland – Fiscal 2014 Budget Overview
Analysis of the FY 2014 Maryland Executive Budget, 2013 49
agriculture and natural resources management by assisting farmers in implementing new
technologies and to control point pollution sources; and
family and consumer science promotion through safe drinking water clinics and by providing
information on family nutrition.
This initiative will begin as soon as possible in 2013. The Eastern Shore Delegation will be
meeting with USMO and other stakeholders to discuss this project in February 2013.
3. Faculty Workload Report
Annual language in the Joint Chairmen’s Report requires USM to submit a report on the
faculty workload. BOR set standards of expectations for workload for tenured/tenure-track faculty
workload – faculty at comprehensive institutions should carry a workload of 7.0 to 8.0 courses and
faculty at research institutions a workload of 5.0 to 6.0 courses, with each institution charged with
meeting the mid-point of the workload standard. The faculty instruction workload targets at
comprehensive and research institutions are 7.5 and 5.5 course units, respectively.
Exhibit 25 shows the trends in the teaching workloads since fiscal 2005. Overall, TU and UB
consistently fell below the target of a least 7.0 courses. USM reports that the lower than expected
workload at TU reflects a number of factors, including increased research activity which rose 18%
between 2009 and 2011. At UB, the business and law school faculty are exempt due to accreditation
requirements limiting their course loads below these established targets, leaving a small number of
faculty covered by this policy. Conversely, CSU continues to exceed the maximum number of
courses, increasing from 8.1 to 8.3 course units.

R30B00 – University System of Maryland – Fiscal 2014 Budget Overview
Analysis of the FY 2014 Maryland Executive Budget, 2013 50
Exhibit 25
Average Course Units Taught by Full-time Equivalent
Tenured/Tenure-track Faculty Academic Year 2004-2012
2004-
2005
2005-
2006
2006-
2007
2007-
2008
2008-
2009
2009-
2010
2010-
2011
2011-
2012
Comprehensive Institutions
Bowie State University 8.2 7.5 7.9 7.9 7.5 7.3 8.2 7.5
Coppin State University 9.0 9.2 8.5 8.5 7.9 7.9 8.1 8.3
Frostburg State University 7.8 7.8 7.7 7.8 7.5 7.5 7.5 7.4
Salisbury University1 7.9 7.9 7.9 7.9 7.9 7.6 7.6 7.6
Towson University1 7.3 7.1 7.0 6.9 7.0 7.0 7.1 7.0
University of Baltimore1 6.9 6.9 6.7 7.3 7.1 7.1 6.8 6.6
University of MD Eastern Shore 7.5 7.8 7.8 7.4 7.7 8.4 7.7 7.6
All Comprehensive Institutions 7.7 7.7 7.5 7.5 7.4 7.4 7.5 7.4
Research Institutions
University of Maryland Baltimore
County 5.7 5.8 5.8 6.0 6.1 6.6 6.6 6.8
University of Maryland, College Park 5.1 6.1 5.9 5.8 5.7 5.8 5.9 5.6
All Research Institutions2 5.3 6.0 5.9 5.8 5.8 6.0 6.0 5.9
1Calculations for Salisbury University, Towson University, and the University of Baltimore omit the schools of business
and law because accreditation standards requires law faculty to teach 4 course units and business faculty to teach 6 course
units. 2State-supported full-time equivalent.
Source: University System of Maryland’s Faculty Workload Report, November 19, 2012
At the research institutions, UMCP and UMBC continue to exceed the target of 5.5 course
units. While the workload declined from 5.9 to 5.6 at UMCP, it increased from 6.6 to 6.8 course
units at UMBC. UMB reports on actual course units taught and the percentage of faculty meeting or
exceeding the institutions standard. This is a more appropriate measure due to UMB’s many
professional schools which may be subject to varying requirements from differing accrediting bodies.
UMB reports that 94% of all core faculty met or exceeded the institution’s standard.
The faculty workload report only provides information on tenured/tenure-track faculty. Some
institutions, particularly comprehensives, rely on full- and part-time non-tenured/non-tenure-track
faculty to carry some of the instruction workload, as shown in Exhibit 26.

R30B00 – University System of Maryland – Fiscal 2014 Budget Overview
Analysis of the FY 2014 Maryland Executive Budget, 2013 51
Exhibit 26
Instructional Faculty
Number and Percent of Total by Type Academic Year 2007-2011
Research Comprehensive
Faculty Type
2007-
2008
2008-
2009
2009-
2010
2010-
2011
2011-
2012
2007-
2008
2008-
2009
2009-
2010
2010-
2011
2011-
2012
Tenured/
Tenure-track
1,848
(42%)
1,866
(38.8%)
1,854
(37.5%)
1,845
(38.7%)
1,877
(39.0%)
1,563
(44.4%)
1,637
(42.6%)
1,668
(42.8%)
1,688
(42.2%)
1,683
(42.0%)
Full-time
Non-tenured/
Non-
tenure-track
Instructional
368
(8.4%)
386
(8.0%)
355
(7.2%)
385
(8.1%)
405
(8.4%)
485
(13.8%)
523
(13.6%)
545
(14.0%)
550
(13.7%)
458
(11.4%)
Full-time
Non-tenured/
Non-tenure-
track
Research
1,378
(31.3%)
1,396
(29%)
1,542
(31.2%)
1,660
(34.8%)
1,615
(33.5%)
14
(0.4%)
8
(0.2%)
4
(0.1%)
5
(0.1%)
4
(.01%)
Part-time 807
(18.3%)
1,163
(24.2%)
1,192
(24.1%)
877
(18.4%)
918
(19.1%)
1,457
(41.4%)
1,678
(43.6%)
1,680
(43.1%)
1,761
(44.0%)
1,865
(46.2%)
Total 4,401 4,811 4,943 4,767 4,815 3,519 3,846 3,897 4,004 4010
Source: University System of Maryland’s Faculty Workload Report, November 19, 2012
Focusing on tenured/tenure-track faculty does not accurately reflect the workload of instructional
faculty. As shown in Exhibit 27, when taking into account the workload of full-time
non-tenured/non-tenure-track faculty, the average course load increases from 7.4 to 7.6 course units for
comprehensive institutions suggesting non-tenured-track faculty are taking on more of the teaching
responsibilities, thereby decreasing the instructional workload of tenured/tenure-track faculty.

R30B00 – University System of Maryland – Fiscal 2014 Budget Overview
Analysis of the FY 2014 Maryland Executive Budget, 2013 52
Exhibit 27
Average Course Units Taught by Full-Time Equivalent Tenured/Tenure-track
and
Full-time Non-tenured/Non-tenure-track Instructional Faculty Academic Year 2006-2012
2006-
2007
2007-
2008
2008-
2009
2009-
2010
2010-
2011
2011-
2012
Comprehensive Institutions
Bowie State University 7.9 8.0 8.0 7.6 8.3 7.7
Coppin State University 8.8 9.0 8.2 10.5 9.0 9.0
Frostburg State University 8.0 8.1 7.6 7.5 7.5 7.4
Salisbury University 8.0 8.2 7.9 7.6 7.7 7.8
Towson University 7.3 7.3 7.4 7.3 7.7 7.4
University of Baltimore 7.0 7.5 7.5 7.6 7.8 6.5
University of Maryland Eastern Shore 7.9 7.6 7.9 9.3 8.1 7.6
All Comprehensive Institutions 7.7 7.8 7.7 7.9 7.9 7.6
Research Institutions
University of Maryland Baltimore County 6.1 6.3 6.5 6.5 6.9 6.9
University of Maryland, College Park 5.9 5.8 5.7 5.8 5.8 5.6
All Research Institutions 6.0 5.9 5.9 6.0 6.1 5.9
Note: Calculations for Salisbury University, Towson University, and the University of Baltimore omit the schools of
business and law; research universities include State-supported full-time equivalent in addition to full-time non-tenured
faculty.
Source: University System of Maryland’s Faculty Workload Report, November 19, 2012
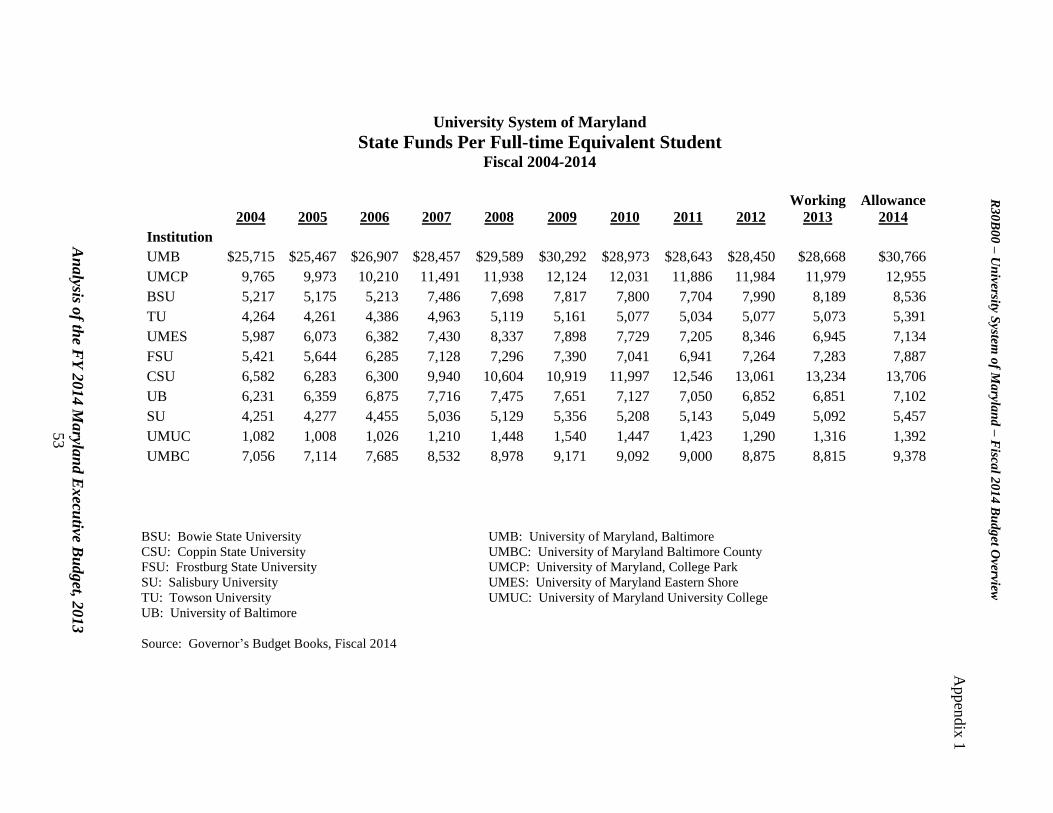
An
alysis o
f the F
Y 2
014 M
aryla
nd E
xecu
tive Bu
dget, 2
013
53
University System of Maryland
State Funds Per Full-time Equivalent Student Fiscal 2004-2014
2004 2005 2006 2007 2008 2009 2010 2011 2012
Working
2013
Allowance
2014
Institution
UMB $25,715 $25,467 $26,907 $28,457 $29,589 $30,292 $28,973 $28,643 $28,450 $28,668 $30,766
UMCP 9,765 9,973 10,210 11,491 11,938 12,124 12,031 11,886 11,984 11,979 12,955
BSU 5,217 5,175 5,213 7,486 7,698 7,817 7,800 7,704 7,990 8,189 8,536
TU 4,264 4,261 4,386 4,963 5,119 5,161 5,077 5,034 5,077 5,073 5,391
UMES 5,987 6,073 6,382 7,430 8,337 7,898 7,729 7,205 8,346 6,945 7,134
FSU 5,421 5,644 6,285 7,128 7,296 7,390 7,041 6,941 7,264 7,283 7,887
CSU 6,582 6,283 6,300 9,940 10,604 10,919 11,997 12,546 13,061 13,234 13,706
UB 6,231 6,359 6,875 7,716 7,475 7,651 7,127 7,050 6,852 6,851 7,102
SU 4,251 4,277 4,455 5,036 5,129 5,356 5,208 5,143 5,049 5,092 5,457
UMUC 1,082 1,008 1,026 1,210 1,448 1,540 1,447 1,423 1,290 1,316 1,392
UMBC 7,056 7,114 7,685 8,532 8,978 9,171 9,092 9,000 8,875 8,815 9,378
BSU: Bowie State University UMB: University of Maryland, Baltimore
CSU: Coppin State University UMBC: University of Maryland Baltimore County
FSU: Frostburg State University UMCP: University of Maryland, College Park
SU: Salisbury University UMES: University of Maryland Eastern Shore
TU: Towson University UMUC: University of Maryland University College
UB: University of Baltimore
Source: Governor’s Budget Books, Fiscal 2014
R3
0B
00
– U
niversity S
ystem
of M
aryla
nd
– F
iscal 2
01
4 B
ud
get O
verview
Appen
dix
1

R30B00 – University System of Maryland – Fiscal 2014 Budget Overview
Analysis of the FY 2014 Maryland Executive Budget, 2013 54
Appendix 2
University System of Maryland
Full-time Equivalent Personnel by Budget Program Fiscal 2002, 2012, and 2013
Fiscal 2002 Fiscal 2012 Fiscal 2013
FTEs
% of
Total
FTEs FTEs
% of
Total
FTEs FTEs
% of
Total
FTEs
Change in
Share of
Total
2012-2013
Instruction 5,858 33.5% 6,837.0 31.2% 7,070.5 31.6% -1.9%
Research 2,455 14.0% 3,883.7 17.7% 3,743.5 16.7% 2.7%
Public Service 689 3.9% 749.7 3.4% 742.8 3.3% -0.6%
Academic Support 1,937 11.1% 2,295.7 10.5% 2,424.6 10.8% -0.2%
Student Services 945 5.4% 1,177.5 5.4% 1,283.2 5.7% 0.3%
Institutional Support 2,427 13.9% 2,810.1 12.8% 2,837.8 12.7% -1.2%
Operations and Maintenance
of Plant 1,558 8.9% 1,623.0 7.4% 1,679.4 7.5% -1.4%
Auxiliary 1,368 7.8% 1,975.6 9.0% 2,035.8 9.1% 1.3%
Hospitals 248 1.4% 555.2 2.5% 570 2.5% 1.1%
Total 17,485 21,907 22,387
FTE: full-time equivalent
Note: Data are for filled positions only.
Source: University System of Maryland Institutions

R30B00 – University System of Maryland – Fiscal 2014 Budget Overview
Analysis of the FY 2014 Maryland Executive Budget, 2013 55
Appendix 3
Proposed Budget University System of Maryland (USM) Regional Higher Education Centers
Fiscal 2012-2014
Universities at Shady Grove
2012
Actual
2013
Budgeted
2014
Estimate
2013-14
Change
% Change
Prior Year
Expenditures
Salaries and Wages $5,041,740 $5,654,000 $6,036,864 $382,864 6.8%
Operating Expenses 9,070,079 8,376,000 8,703,000 327,000 3.9%
Total Operating Expenses $14,111,819 $14,030,000 $14,739,864 $709,864 5.1%
State-supported Revenues
General Funds $7,260,990 $7,260,990 $7,797,854 $536,864 7.4%
Enrollment Funding Iniatitive 3,262,847 3,262,000 3,262,000 0 0.0%
Institutional Partenrs Classroom and Office
fees 732,865 700,000 700,000 0 0.0%
Student Technology Fee 277,844 236,000 250,000 14,000 5.9%
Other Usage Revenue (copier, postage, etc.) 381,863 381,000 385,000 4,000 1.0%
Transfer from USM Office fund balance 0 0 100,000 100,000
Total State-supported Revenues $11,916,409 $11,839,990 $12,494,854 654,864 5.5%
Non-State-supported Revenues
Student Fees $1,238,286 $1,091,000 $1,145,000 $54,000 9.9%
Conference Center Revenues 1,022,374 1,099,010 1,100,010 1,000 0.1%
Transfer to Fund Balance -65,250 0 0
Total Non-State-supported Revenues $2,195,410 $2,190,010 $2,245,010 $55,000 2.5%
Total Revenues $14,111,819 $14,030,000 $14,739,864 $709,864 5.1%
University System of Maryland at Hagerstown
2012
Actual
2013
Budgeted
2014
Estimate
2013-14
Change
% Change
Prior Year
Expenditures
Salaries and Wages $598,623 $597,843 $613,445 $15,602 2.6%
Operating Expenses 1,286,950 1,333,749 1,322,465 -11,284 -0.8%
Total Operating Expenses $1,885,573 $1,931,592 $1,935,910 $4,318 0.2%
State-supported Revenues
General Funds $1,891,592 $1,891,592 $1,895,910 $4,318 0.2%
Non-State-supported Revenues
Rental, Testing, and Other 51,861 40,000 40,000 0 0.0%
Transfer to Fund Balance -59,880 0 0 0
Total Revenues $1,883,573 $1,931,592 $1,935,910 $4,318 0.2%
Source: Univerisities at Shady Grove, University System of Maryland at Hagerstown

An
alysis o
f the F
Y 2
014 M
aryla
nd E
xecu
tive Bu
dget, 2
013
56
University System of Maryland Regional Higher Education Centers
Full-time Equivalent Student Enrollment Fiscal 2005-2012
Universities at Shady Grove
2005 2006 2007 2008 2009 2010 2011 2012
Bowie State University 13.0 13.8 12.5 10.3 14.4 15.3 13.0 15.6
Salisbury University.
9.3 22.8 23.1 19.5
Towson University 62.8 69.2 79.5 70.1 97.5 108.8 107.8 129
University of Baltimore
12.1 37.0 43.6 61.7 69.4 78.2
University of Maryland, Baltimore 146.1 142.7 152.9 188.3 264.4 371.9 418.2 428.2
University of Maryland Baltimore County 90.4 109.6 111.9 135.2 175.5 215.0 243.8 292.5
University of Maryland, College Park 473.7 529.4 628.9 646.0 818.5 995.8 994.4 999.5
University. of Maryland Eastern Shore 32.2 33.6 34.8 38.0 48.2 66.7 74.8 79.3
University of Maryland University College 372.9 293.3 301.5 288.2 312.4 372.2 391.1 383.0
Total 1,191.1 1,191.6 1,334.1 1,413.1 1,783.8 2,230.2 2,335.6 2,424.8
The University System of Maryland at Hagerstown
2005* 2006 2007 2008 2009 2010 2011 2012
Frostburg State University 74.4 174.3 167.0 194.9 187.0 193.6 180.9 160.1
Salisbury University 0.0 0.0 0.0 8.6 20.3 28.5 29.0 33.9
Towson University 0.0 0.0 14.2 30.1 32.6 47.7 52.7 51.8
University of Maryland, Baltimore 0.0 4.6 0.0 0.0 0.0 0.0 0.0 0.0
University. of Maryland, College Park 0.0 0.3 1.2 2.0 1.5 1.1 7.2 9.0
University of Maryland University College 0.0 4.5 3.1 0.4 5.6 8.0 10.8 12.2
Total 74.4 183.7 185.5 236.0 247.0 278.9 280.6 267.0
*Fiscal 2005 is enrollment in spring semester only. The University System of Maryland Hagerstown opened in January 2005.
Source: Universities of Shady Grove, The University System of Maryland at Hagerstown.
R3
0B
00
– U
niversity S
ystem
of M
aryla
nd
– F
iscal 2
01
4 B
ud
get O
verview
Appen
dix
4