
UNIVERSITY OF VICTORIA STATEMENT OF FINANCIAL INFORMATION MARCH …€¦ · The accompanying notes...
63
1 UNIVERSITY OF VICTORIA STATEMENT OF FINANCIAL INFORMATION MARCH 31, 2017 Published in accordance with the requirements of the Financial Information Act TABLE OF CONTENTS Financial Information Approval Statement of Administrative Responsibility for Financial Statements Independent Auditors' Report Audited Statements Consolidated Statement of Financial Position Consolidated Statement of Operations and Accumulated Surplus Consolidated Statement of Changes in Net Debt Consolidated Statement of Cash Flows Consolidated Statement of Remeasurement Gains and Losses Notes to Consolidated Financial Statements Schedule of Long Term Debt Schedule of Guarantee or Indemnity Agreements Statement of Severance Agreements Schedule of Board of Governors Remuneration and Expenses Schedule of Employees' Remuneration and Expenses Schedule of Payments for Goods and Services
Transcript of UNIVERSITY OF VICTORIA STATEMENT OF FINANCIAL INFORMATION MARCH …€¦ · The accompanying notes...
1
UNIVERSITY OF VICTORIA STATEMENT OF FINANCIAL INFORMATION
MARCH 31, 2017
Published in accordance with the requirements of the Financial Information Act
TABLE OF CONTENTS
Financial Information Approval Statement of Administrative Responsibility for Financial Statements Independent Auditors' Report Audited Statements Consolidated Statement of Financial Position Consolidated Statement of Operations and Accumulated Surplus Consolidated Statement of Changes in Net Debt Consolidated Statement of Cash Flows Consolidated Statement of Remeasurement Gains and Losses Notes to Consolidated Financial Statements Schedule of Long Term Debt Schedule of Guarantee or Indemnity Agreements Statement of Severance Agreements Schedule of Board of Governors Remuneration and Expenses Schedule of Employees' Remuneration and Expenses Schedule of Payments for Goods and Services
2
UNIVERSITY OF VICTORIA FINANCIAL INFORMATION APPROVAL
The undersigned represents the Board of Governors of the University of Victoria and approves all the statements and schedules included in this Statement of Financial Information, produced in accordance with the Financial Information Act of the Province of British Columbia. Daphne Corbett Gayle Gorrill Chair, Vice-President, Board of Governors Finance and Operations June 27, 2017

Consolidated Financial Statements of
UNIVERSITY OF VICTORIA
Year ended March 31, 2017

2
STATEMENT OF ADMINISTRATIVE RESPONSIBILITY FOR FINANCIAL STATEMENTS
The University is responsible for the preparation and presentation of the accompanying consolidated
financial statements, including responsibility for significant accounting judgments and estimates in
accordance with Canadian public sector accounting standards and Treasury Board direction outlined
in note 2 (a). This responsibility includes selecting appropriate accounting principles and methods and
making decisions affecting measurement of transactions in which objective judgment is required. In
fulfilling its responsibilities and recognizing the limits inherent in all systems, the University's
management has developed and maintains a system of internal controls designed to provide
reasonable assurance that the University assets are safeguarded from loss and that the accounting
records are a reliable basis for the preparation of financial statements. The system of internal controls
is monitored by the University's management.
The Board of Governors carries out its responsibility for review of the financial statements
principally through its audit committee. The members of the Audit Committee are not officers or
employees of the University. The Audit Committee meets with management and with the internal
and external auditors to discuss the results of audit examinations and financial reporting matters. The
auditors have full access to the Audit Committee, with and without the presence of management.
The consolidated financial statements have been examined by the Office of the Auditor General of
British Columbia. The Independent Auditors’ Report outlines the nature of the examination and the
opinion on the consolidated financial statements of the University for the year ended March 31, 2017.
On behalf of the University:
Chair, Board of Governors
Vice-President Finance and Operations

INDEPENDENT AUDITOR'S REPORT
To the Board of Governors of the University of Victoria, and
To the Minister of Advanced Education, Province of British Columbia
I have audited the accompanying consolidated financial statements of the University of Victoria
(“the entity”), which comprise the consolidated statement of financial position as at March 31,
2017, and the consolidated statements of operations and accumulated surplus, changes in net
debt, remeasurement gains and losses, and cash flows for the year then ended, and a summary of
significant accounting policies and other explanatory information.
Management's Responsibility for the Consolidated Financial Statements
Management is responsible for the preparation of these consolidated financial statements in
accordance with Canadian Public Sector Accounting Standards, and for such internal control as
management determines is necessary to enable the preparation of consolidated financial
statements that are free from material misstatement, whether due to fraud or error.
Auditor's Responsibility
My responsibility is to express an opinion on these consolidated financial statements based on
my audit. I conducted my audit in accordance with Canadian generally accepted auditing
standards. Those standards require that I comply with ethical requirements and plan and perform
the audit to obtain reasonable assurance about whether the consolidated financial statements are
free from material misstatement.
An audit involves performing procedures to obtain audit evidence about the amounts and
disclosures in the consolidated financial statements. The procedures selected depend on the
auditor's judgment, including the assessment of the risks of material misstatement of the
consolidated financial statements, whether due to fraud or error. In making those risk
assessments, the auditor considers internal control relevant to the entity's preparation of the
consolidated financial statements in order to design audit procedures that are appropriate in the
circumstances, but not for the purpose of expressing an opinion on the effectiveness of the
entity's internal control. An audit also includes evaluating the appropriateness of accounting
policies used and the reasonableness of accounting estimates made by management, as well as
evaluating the overall presentation of the consolidated financial statements.
In my view, the audit evidence I have obtained is sufficient and appropriate to provide a basis for
my qualified audit opinion.

UNIVERSITY OF VICTORIA Independent Auditor’s Report
Basis for Qualified Opinion
As described in Note 23 to the consolidated financial statements, the entity’s accounting
treatment for contributions received from governments and for externally restricted contributions
received from non-government sources is to initially record them as deferred contributions (a
liability) and then recognize revenue in the statement of operations and accumulated surplus
either on the same basis as the related expenditures occur or, in the case of funds for the purchase
or construction of capital assets, to recognize revenue on the same basis as the related assets are
amortized. The entity was required to adopt this accounting policy as prescribed by Province of
British Columbia Treasury Board Regulation 198/2011.
Under Canadian Public Sector Accounting Standards, the entity’s method of accounting for
contributions is only appropriate in circumstances where the funding meets the definition of a
liability. Otherwise, the appropriate accounting treatment is to record contributions as revenue
when they are received or receivable. In my opinion certain contributions of the entity do not
meet the definition of a liability, and as such the entity’s method of accounting for those
contributions represents a departure from Canadian Public Sector Accounting Standards.
This departure has existed since the inception of the standard, which applies to periods beginning
on or after April 1, 2012. When the cumulative effects of this departure to date are adjusted
through opening accumulated surplus, the entity’s records indicate that the effects of this
departure on the current year consolidated financial statements is an overstatement of the liability
for deferred contributions of $385 million, an understatement of opening accumulated surplus of
$371 million, and a current year understatement of revenue of $14 million. Accordingly, the
current year surplus is understated by $14 million and net debt is overstated by $385 million.
Qualified Opinion
In my opinion, except for the effects of the matter described in the Basis for Qualified Opinion
paragraph, the consolidated financial statements present fairly, in all material respects, the
financial position of the University of Victoria as at March 31, 2017, and the results of its
operations, changes in its net debt, remeasurement gains and losses, and its cash flows for the
year then ended in accordance with Canadian Public Sector Accounting Standards.
Victoria, British Columbia Russ Jones, FCPA, FCA
July 6, 2017 Deputy Auditor General

UNIVERSITY OF VICTORIA Consolidated Statement of Financial Position
As at March 31, 2017
(in thousands of dollars)
5
The accompanying notes are an integral part of these financial statements.
Contractual Obligations (Note 18) Contingent Liabilities (Note 19)
On behalf of the Board:
Chair, Board of Governors Vice President, Finance and Operations
2017 2016 Financial Assets Cash and cash equivalents (Note 3) $ 91,913 $ 87,422
Accounts receivable 20,106 15,740 Due from governments (Note 4) 5,921 1,420 Inventories for resale 1,678 1,444 Portfolio investments (Note 6) 197,905 160,771 Loans receivable (Note 5) 26,610 27,793
Investments in government business enterprises (Note 7) 6,295 6,536
350,428 301,126 Liabilities Accounts payable and accrued liabilities (Note 9) 31,625 28,860 Derivatives (Note 6) 1,913 2,444 Due to governments 4,871 4,566 Employee future benefits (Note 10) 18,333 18,431 Deferred revenue 14,673 13,351 Deferred contributions (Note 11) 167,023 129,100 Deferred capital contributions (Note 12) 384,497 371,232 Long‑term debt (Note 13) 50,799 52,829 673,734 620,813
Net debt (323,306) (319,687)
Non‑financial Assets Tangible capital assets (Note 14) 710,970 700,295 Restricted endowment investments (Note 6) 329,614 319,353 Inventories held for use 1,806 1,078 Prepaid expense 16,991 15,325 1,059,381 1,036,051
Accumulated surplus (Note 16) $ 736,075 $ 716,364
Accumulated surplus is comprised of:
Endowments (Note 17) $ 316,621 $ 306,472 Invested in capital assets 292,622 293,119 Internally restricted 88,598 81,984 Unrestricted 21,913 20,627
Accumulated operating surplus 719,754 702,202 Accumulated remeasurement gains 16,321 14,162 Accumulated surplus $ 736,075 $ 716,364

6
UNIVERSITY OF VICTORIA Consolidated Statement of Operations and Accumulated Surplus
Year ended March 31, 2017
(in thousands of dollars)
The accompanying notes are an integral part of these financial statements.
Budget 2017 2016
(Note 2(m))
Revenue:
Province of British Columbia grants $ 184,700 $ 178,174 $ 184,604
Government of Canada grants 58,000 58,755 61,606
Other government grants 19,000 20,921 18,414
Student tuition ‑ credit courses 132,747 136,369 130,935
Student tuition ‑ non‑credit courses 19,253 19,052 19,821
Donations, non‑government grants and contracts 19,000 18,670 15,371
Sales of services and products 68,161 70,527 66,661
Investment income 19,400 19,846 21,717
Income from business enterprises 600 486 958
Other revenue 6,000 7,953 5,917
Revenue recognized from deferred capital contributions 26,556 26,473 31,299
553,417 557,226 557,303
Expenses: (Note 20)
Instruction and non‑sponsored research 213,911 223,785 212,017
Academic and student support 135,418 139,453 134,219
Administrative support 18,225 19,139 18,064
Facility operations and maintenance 50,679 47,139 50,230
Sponsored research 113,947 107,104 112,938
External engagement 11,048 13,203 10,950
543,228 549,823 538,418
Operating surplus before restricted funding 10,189 7,403 18,885
Restricted endowment contributions
Endowment principal donations 4,000 5,285 6,708
Net investment income & donations capitalized 4,864 4,232
Net restricted endowment contributions 4,000 10,149 10,940
Annual operating surplus 14,189 17,552 29,825
Accumulated operating surplus, beginning of year 702,202 702,202 672,377
Accumulated operating surplus, end of year $ 716,391 $ 719,754 $ 702,202

7
UNIVERSITY OF VICTORIA Consolidated Statement of Changes in Net Debt
Year ended March 31, 2017
(in thousands of dollars)
The accompanying notes are an integral part of these financial statements.
Budget 2017 2016
(Note 2(m))
Annual surplus $ 14,189 $ 17,552 $ 29,825
Acquisition of tangible capital assets (52,436) (56,164) (56,994)
Amortization of tangible capital assets 46,058 45,536 51,378
(6,378) (10,628) (5,616)
Restricted endowment investments (10,261) (10,822)
Acquisition of inventories held for use (2,578) (2,528)
Acquisition of prepaid expense (16,826) (11,568)
Consumption of inventories held for use 1,850 3,144
Use of prepaid expense 15,113 11,614
(12,702) (10,160)
Net remeasurement gains (losses) 2,159 (3,162)
Decrease (increase) in net debt 7,811 (3,619) 10,887
Net debt, beginning of year (319,687) (319,687) (330,574)
Net debt, end of year $ (311,876) $ (323,306) $ (319,687)

8
UNIVERSITY OF VICTORIA Consolidated Statement of Remeasurement Gains and Losses
Year ended March 31, 2017
(in thousands of dollars)
The accompanying notes are an integral part of these financial statements.
2017 2016
Accumulated remeasurement gains, beginning $ 14,162 $ 17,324
Unrealized gains (losses) attributed to:
Portfolio investments 1,134 (3,332)
Derivatives 531 (34)
Foreign currency translation 494 204
Net remeasurement gains (losses) for the year 2,159 (3,162)
Accumulated remeasurement gains, end of year $ 16,321 $ 14,162

9
UNIVERSITY OF VICTORIA Consolidated Statement of Cash Flows
Year ended March 31, 2017
(in thousands of dollars)
The accompanying notes are an integral part of these financial statements.
2017 2016 Cash provided by (used in):
Operations:
Annual surplus $ 17,552 $ 29,825
Items not involving cash Amortization of tangible capital assets 45,536 51,378
Revenue recognized from deferred capital contributions (26,473) (31,299)
Change in deferred contributions 37,923 (17,062)
Change in employee future benefits (98) (1,815)
Equity in (income) losses of government business enterprises 241 (246)
Unrealized foreign exchange gain 494 204
Changes in non-cash operating working capital:
Increase in accounts receivable (4,366) (6,028) Decrease in loans receivable 1,183 783
Decrease (increase) in inventories (962) 660
Decrease (increase) in prepaid expenses (1,666) 47
Increase (decrease) in accounts payable and accrued liabilities 2,765 (5,487)
Decrease (increase) in due to/from government organizations (4,196) 7,087
Increase (decrease) in deferred revenue 1,322 (1,527)
Net change from operating activities 69,255 26,520
Capital activities:
Cash used to acquire tangible capital assets (56,211) (56,995) Investing activities:
Purchase of portfolio investments (10,467) (5,223)
Disposal (acquisition) of endowment investments (35,794) 1,200
Net change from investing activities (46,261) (4,023)
Financing activities:
Repayment of long-term debt (2,030) (1,910)
Cash proceeds from deferred capital contributions 39,738 23,105
Net change from financing activities 37,708 21,195
Net change in cash and cash equivalents 4,491 (13,303)
Cash and cash equivalents, beginning of year 87,422 100,725
Cash and cash equivalents, end of year $ 91,913 $ 87,422

10
UNIVERSITY OF VICTORIA Notes to Consolidated Financial Statements
Year ended March 31, 2017
(tabular figures in thousands of dollars)
1. Authority and Purpose
The University of Victoria (the “University”) operates under the authority of the University Act of British Columbia. The University is a not‑for‑profit entity governed by a 15 member Board of Governors, eight of whom are appointed by the government of British Columbia including two on the recommendation of the Alumni Association. The University is a registered charity and is exempt from income taxes under section 149 of the Income Tax Act.
2. Summary of significant accounting policies The consolidated financial statements of the University are prepared by management in accordance with the basis of accounting described below. Significant accounting policies of the University are as follows: (a) Basis of accounting
The consolidated financial statements have been prepared in accordance with Section 23.1 of the Budget Transparency and Accountability Act of the Province of British Columbia supplemented by Regulations 257/2010 and 198/2011 issued by the Province of British Columbia Treasury Board.
The Budget Transparency and Accountability Act requires that the consolidated financial statements be prepared in accordance with the set of standards and guidelines that comprise generally accepted accounting principles for senior governments in Canada, or if the Treasury Board makes a regulation, the set of standards and guidelines that comprise generally accepted accounting principles for senior governments in Canada as modified by the alternate standard or guideline or part thereof adopted in the regulation.
Regulation 257/2010 requires all tax‑payer supported organizations in the Schools, Universities, Colleges and Hospitals sectors to adopt Canadian public sector accounting standards without any PS4200 elections related to not‑for‑profit accounting standards.
Regulation 198/2011 requires that restricted contributions received or receivable for acquiring or developing a depreciable tangible capital asset or contributions in the form of a depreciable tangible capital asset are to be deferred and recognized in revenue at the same rate that amortization of the related tangible capital asset is recorded.
For British Columbia tax‑payer supported organizations, these contributions include government transfers and externally restricted contributions.
The accounting policy requirements under Regulation 198/2011 are significantly different from the requirements of Canadian public sector accounting standards which requires that:
government transfers, which do not contain a stipulation that creates a liability, be recognized as revenue by the recipient when approved by the transferor and the eligibility criteria have been met in accordance with public sector accounting standard PS3410; and

11
UNIVERSITY OF VICTORIA Notes to Consolidated Financial Statements
Year ended March 31, 2017
(tabular figures in thousands of dollars)
2. Summary of significant accounting policies (continued)
(a) Basis of accounting (continued)
externally restricted contributions be recognized as revenue in the period in which the resources are used for the purpose or purposes specified in accordance with public sector accounting standard PS3100.
As a result, revenue recognized in the statement of operations and certain related deferred capital contributions would be recorded differently under Canadian public sector accounting standards. (See note 23)
(b) Basis of consolidation
(i) Consolidated entities
The consolidated financial statements reflect the assets, liabilities, revenues, and expenses of organizations which are controlled by the University. Controlled organizations are consolidated except for government business enterprises which are accounted for by the modified equity method. Inter‑organizational transactions, balances, and activities have been eliminated on consolidation.
The following organizations are controlled by the University and fully consolidated in these financial statements:
UVic Industry Partnerships (formerly University of Victoria Innovation and Development Corporation) which facilitates research partnerships between the private sector and the University.
University of Victoria Properties Investments Inc. which manages the University’s real estate holdings including the Vancouver Island Technology Park Trust.
Ocean Networks Canada Society which manages the University’s VENUS and NEPTUNE ocean observatories.
Pacific Climate Impacts Consortium which stimulates collaboration to produce climate information for education, policy and decision making.
University of Victoria Long‑Term Disability Trust which administers an employee benefit plan on behalf of the University’s faculty and administrative professional staff.
University of Victoria Foundation, the Foundation for the University of Victoria, and the U.S. Foundation for the University of Victoria which encourage the financial support of the University and administer the University's endowment funds.
GSB Executive Education Inc. provides executive training and other non‑credit education.
Byron Price & Associates Ltd. which holds land in North Saanich.

12
UNIVERSITY OF VICTORIA Notes to Consolidated Financial Statements
Year ended March 31, 2017
(tabular figures in thousands of dollars)
2. Summary of significant accounting policies (continued)
(b) Basis of consolidation (continued) (ii) Investment in government business enterprises
Government business enterprises are accounted for by the modified equity method. Under this method, the University’s investment in the business enterprise and its net income and other changes in equity are recorded. No adjustment is made to conform the accounting policies of the government business enterprise to those of the University other than if other comprehensive income exists, it is accounted for as an adjustment to accumulated surplus (deficit). Inter‑organizational transactions and balances have not been eliminated, except for any profit or loss on transactions between entities of assets that remain within the entities controlled by the University. The following organizations are controlled by the University and consolidated in these financial statements using the modified equity basis:
Heritage Realty Properties Ltd. which manages the property rental and downtown hotel and brew‑pub operation donated by the late Michael C. Williams.
Vancouver Island Technology Park Trust which provides leased space to high‑technology companies on Vancouver Island.
(iii) Investment in government partnerships
Government partnerships that are not wholly controlled business partnerships are accounted for under the proportionate consolidation method. The University accounts for its share of the partnership on a line by line basis on the financial statements and eliminates any inter‑organizational transactions and balances. Accounting policies of the partnership, which is not a business partnership, are conformed to those of the University before it is proportionately consolidated.
The following organizations are government partnerships and are proportionately consolidated in these financial statements:
Tri‑Universities Meson Facility (TRIUMF) which operates a research facility for sub‑atomic physics located at the University of British Columbia. These financial statements include the University’s 8.33% interest.
Western Canadian Universities Marine Sciences Society (WCUMSS) which operates a marine research facility at Bamfield on the west coast of Vancouver Island. These financial statements include the University’s 20% interest.

13
UNIVERSITY OF VICTORIA Notes to Consolidated Financial Statements
Year ended March 31, 2017
(tabular figures in thousands of dollars)
2. Summary of significant accounting policies (continued)
(b) Basis of consolidation (continued) (iv) Funds held in trust
Funds held in trust by the University as directed by agreement or statute for certain beneficiaries are not included in the University’s consolidated financial statements.
(c) Cash and cash equivalents
Cash and cash equivalents include highly liquid investments readily convertible to known amounts of cash and subject to insignificant risk of changes in value. They are held for the purpose of meeting short term cash commitments rather than investing.
(d) Financial instruments
Financial instruments are classified into two categories: fair value or cost.
(i) Fair value category
Portfolio instruments that are quoted in an active market and derivative instruments are reflected at fair value as at the reporting date. Other financial instruments designated to be recorded at fair value are endowment and portfolio investments. Transaction costs related to the acquisition of investments are recorded as an expense. Sales and purchases of investments are recorded at trade date. Unrealized gains and losses on financial assets are recognized in the statement of remeasurement gains and losses until such time that the financial asset is derecognized due to disposal or impairment. At the time of derecognition, the related realized gains and losses are recognized in the statement of operations and accumulated surplus and related balances reversed from the statement of remeasurement gains and losses. Unrealized gains and losses in endowment investments, where earnings are restricted as to use, are recorded as deferred contributions and recognized in revenue when disposed and when related expenses are incurred. Restricted unrealized gains spent to meet current year endowment expenses or capitalization transfers are recorded in the statement of remeasurement gains and losses.
The Standards require an organization to classify fair value measurements using a fair value hierarchy, which includes three levels of information that may be used to measure fair value:
Level 1 – Unadjusted quoted market prices in an active market for identical assets or liabilities,
Level 2 – Observable or corroborated inputs, other than level 1, such as quoted prices for similar assets or liabilities in inactive markets or market data for substantially the full term of the assets or liabilities; and
Level 3 – Unobservable inputs that are supported by little or no market activity and that are significant to the fair value of the assets and liabilities.

14
UNIVERSITY OF VICTORIA Notes to Consolidated Financial Statements
Year ended March 31, 2017
(tabular figures in thousands of dollars)
2. Summary of significant accounting policies (continued)
(d) Financial instruments (continued)
(ii) Cost category
Gains and losses are recognized in the statement of operations when the financial asset is derecognized due to disposal or impairment and the gains and losses are recognized at amortized cost using the effective interest method; accounts payable and accrued liabilities and long‑term debt are measured at amortized cost using the effective interest method.
(e) Short term investments
Short-term investments are comprised of money market securities and other investments with maturities that are capable of prompt liquidation. Short-term investments are cashable on demand and are recorded at cost based on the transaction price on the trade date. All interest income, gains and losses are recognized in the period in which they arise.
(f) Inventories for resale
Inventories held for resale, including books, merchandise and food are recorded at the lower of cost or net realizable value. Cost includes the original purchase cost, plus shipping and applicable duties. Net realizable value is the estimated selling price less any costs to sell.
(g) Non‑financial assets
Non‑financial assets are not available to discharge existing liabilities and are held for use in the provision of services. They have useful lives extending beyond the current year and are not intended for sale in the ordinary course of operations.
(i) Tangible capital assets
Tangible capital assets are recorded at cost, which includes amounts that are directly attributable to acquisition, construction, development or betterment of the asset. Interest is not capitalized whenever external debt is issued to finance the construction of tangible capital assets. The cost, less residual value of the tangible capital assets, are amortized on a straight line basis over their estimated useful lives. Land is not amortized as it is deemed to have a permanent value. Donated assets are recorded at fair value at the date of donation. In unusual circumstances where fair value cannot be reasonably determined, the tangible capital asset would be recorded at a nominal value.

15
UNIVERSITY OF VICTORIA Notes to Consolidated Financial Statements
Year ended March 31, 2017
(tabular figures in thousands of dollars)
2. Summary of significant accounting policies (continued)
(g) Non-financial assets (continued) (i) Tangible capital assets (continued)
Assets under construction are not amortized until the asset is available for productive use.
Tangible capital assets are written down when conditions indicate that they no longer contribute to the University’s ability to provide goods and services, or when the value of future economic benefits associated with the tangible capital assets are less than their net book value.
(ii) Works of art and historic assets
Works of art and historic assets are not recorded as assets in these financial statements.
(iii) Leased capital assets
Leases which transfer substantially all of the benefits and risks incidental to ownership of property are accounted for as leased tangible capital assets. All other leases are accounted for as operating leases and the related payments are charged to expenses as incurred.
(iv) Inventories held for use
Inventories held for use are recorded at the lower of cost and replacement cost.
(h) Employee future benefits
The costs of pension and other future employee benefits are recognized on an accrual basis over the working lives of employees as detailed in Note 10.
Asset Straight line Rate
Buildings ‑ Concrete 50 years
Buildings ‑ Woodframe 30 years
Buildings ‑ Heritage 35 years
Site Improvements 30 years
Equipment ‑ Computing 3 years
Equipment ‑ Other 8 years
Information Systems 8 years
Furnishings 8 years
Library Holdings 10 years
Ships/Vessels 25 years

16
UNIVERSITY OF VICTORIA Notes to Consolidated Financial Statements
Year ended March 31, 2017
(tabular figures in thousands of dollars)
2. Summary of significant accounting policies (continued)
(i) Revenue recognition
Tuition and student fees and sales of goods and services are reported as revenue at the time the services are provided or the products are delivered, and collection is reasonably assured.
Unrestricted donations and grants are recorded as revenue when receivable if the amounts can be estimated and collection is reasonably assured.
Restricted donations and grants are reported as revenue depending on the nature of the restrictions on the use of the funds by the contributors as follows:
(i) Contributions for the purpose of acquiring or developing a depreciable tangible capital asset or in the form of a depreciable tangible capital asset, in each case for use in providing services are recorded and referred to as deferred capital contributions and recognized in revenue at the same rate that amortization of the tangible capital asset is recorded. The reduction of the deferred capital contributions and the recognition of the revenue are accounted for in the fiscal period during which the tangible capital asset is used to provide services.
(ii) Contributions restricted for specific purposes other than for those to be held in perpetuity or the acquisition or development of a depreciable tangible capital asset are recorded as deferred contributions and recognized in revenue in the year in which the stipulation or restriction on the contribution have been met.
(iii) Contributions restricted to be retained in perpetuity, allowing only the investment income earned thereon to be spent are recorded as restricted endowment contributions in the statement of operations and accumulated surplus for the portion to be held in perpetuity and as deferred contributions for any restricted investment income earned thereon.
Investment income includes interest recorded on an accrual basis and dividends recorded as declared, realized gains and losses on the sale of investments, and writedowns on investments where the loss in value is determined to be other-than-temporary.
(j) Pledges, gifts-in-kind and contributed services
Pledges from donors are recorded when payment is received by the University or the transfer of property is completed since their ultimate collection cannot be reasonably assured until that time. Gifts‑in‑kind include securities and equipment which are recorded in the financial statements at their fair market value at the time of donation.
The value of contributed services is not determinable and is not recorded in the financial statements.

17
UNIVERSITY OF VICTORIA Notes to Consolidated Financial Statements
Year ended March 31, 2017
(tabular figures in thousands of dollars)
2. Summary of significant accounting policies (continued)
(k) Use of estimates Preparation of the financial statements in accordance with Canadian public sector accounting standards requires management to make estimates and assumptions. These estimates and assumptions affect the reported amounts of assets, liabilities, and related disclosures. Key areas where management has made estimates and assumptions include those related to the amortization period of tangible capital assets, valuation allowances for receivables and inventories, the valuation of financial instruments and assets and obligations related to employee future benefits. Where actual results differ from these estimates and assumptions, the impact will be recorded in future periods when the difference becomes known.
(l) Foreign currency translation
Transactions in foreign currencies are translated into Canadian dollars at the exchange rate in effect on the transaction date. Monetary assets and liabilities denominated in foreign currencies and non‑monetary assets and liabilities which were designated in the fair value category under the financial instrument standard are reflected in the financial statements in equivalent Canadian dollars at the exchange rate in effect on the statement of financial position date. Any gain or loss resulting from a change in rates between the transaction date and the settlement date or statement of financial position date is recognized in the statement of remeasurement gains and losses. In the period of settlement, any exchange gain or loss is reversed out of the statement of remeasurement gains and losses, and reflected in the statement of operations and accumulated surplus.
(m) Budget figures
Budget figures have been provided for comparative purposes and have been derived from the 2016/ 2017 to 2018/2019 Planning and Budget Framework approved by the Board of Governors of the University on March 30, 2016 and the University’s first quarter forecast provided to the Province. The budget is reflected in the statement of operations and accumulated surplus and the statement of changes in net debt.

18
UNIVERSITY OF VICTORIA Notes to Consolidated Financial Statements
Year ended March 31, 2017
(tabular figures in thousands of dollars)
3. Cash and cash equivalents
Restricted cash is comprised of an escrow account balance related to TRIUMF’s asset retirement obligations.
4. Due from governments
5. Loans receivable
2017 2016
Cash $ 14,273 $ 8,562
Short term investments 76,723 77,956
Restricted cash 917 904
$ 91,913 $ 87,422
2017 2016
Federal government $ 3,466 $ 640
Provincial government 2,368 743
Other 87 37
$ 5,921 $ 1,420
2017 2016
BCNET
Interest at 4.5%, due April 2019, unsecured $ 237 $ 348
Various faculty and senior administrators
Home relocation loans, interest free for 5 years with option for further
renewal unless employment ceases, secured by second mortgages 3,285
3,662
Heritage Realty Properties Ltd.
Promissory note receivable, interest at Royal Bank Prime + 5.0%, due
May 31, 2021, secured by an unregistered equitable mortgage 9,608
9,608
Vancouver Island Technology Park Trust loans receivable
Interest at 5.13%, due April 2030, unsecured 10,819 11,386
Interest at 6.13%, due April 2030, unsecured 2,661 2,789
$ 26,610 $ 27,793

19
UNIVERSITY OF VICTORIA Notes to Consolidated Financial Statements
Year ended March 31, 2017
(tabular figures in thousands of dollars)
6. Financial instruments
Financial assets and liabilities recorded at fair value are comprised of the following:
(a) Portfolio investments
Fair Value Hierarchy 2017 2016
Portfolio investments carried at fair value: Bonds Level 2 $ 12,351 $ 8,635
Various pooled bond and mortgage funds Level 1 102,349 92,554
Canadian equities Level 1 28,196 20,937
Global equities Level 1 33,896 25,457
Infrastructure and real estate Level 3 19,022 11,143
195,814 158,726
Portfolio investments at cost:
Short‑term investments 1,659 1,656
Cash 343 301
Other 89 88
Total portfolio investments $ 197,905 $ 160,771
(b) Restricted endowment investments
Fair Value Hierarchy 2017 2016
Restricted endowment investments carried at fair value:
Bonds Level 2 $ 40,398 $ 36,678
Various pooled bond and mortgage funds Level 1 30,042 44,297
Canadian equities Level 1 88,107 84,122
Global equities Level 1 102,361 98,545
Infrastructure and real estate Level 3 62,157 47,330
323,065 310,972
Restricted endowment investments at cost:
Short‑term investments 5,427 7,033
Cash 1,122 1,277
Other 70
Total restricted endowment investments $ 329,614 $ 319,352
20
UNIVERSITY OF VICTORIA Notes to Consolidated Financial Statements
Year ended March 31, 2017
(tabular figures in thousands of dollars)
6. Financial instruments (continued)
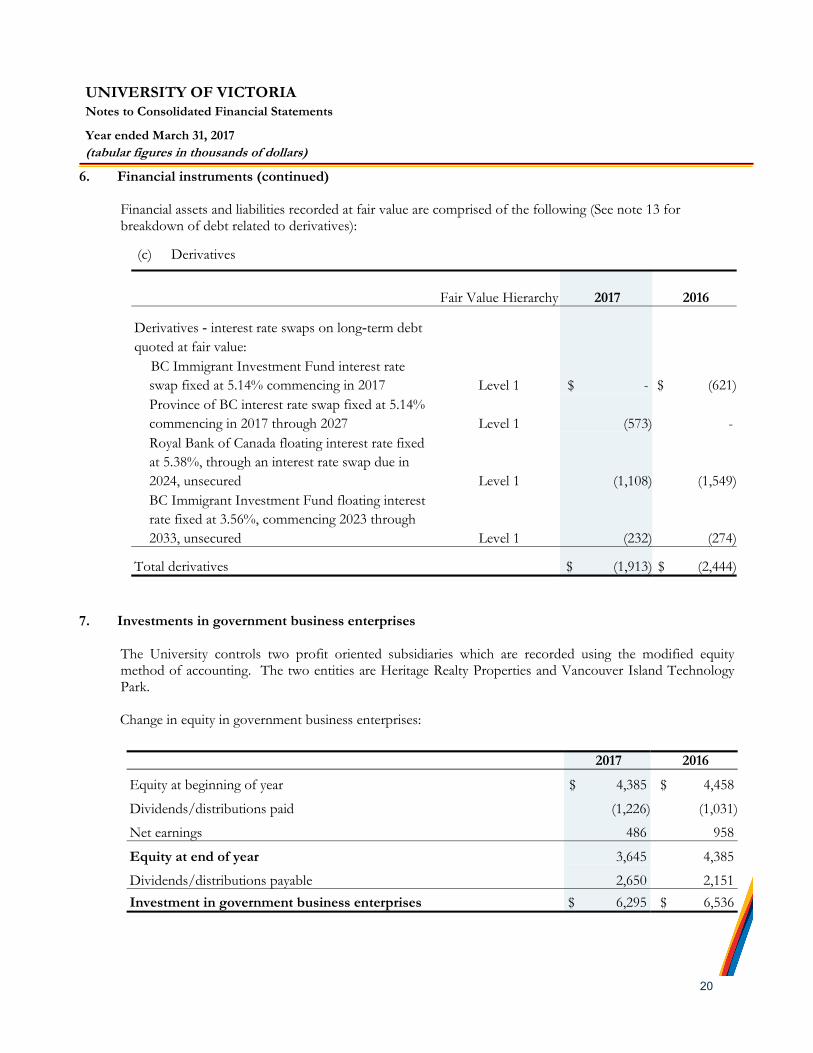
Financial assets and liabilities recorded at fair value are comprised of the following (See note 13 for breakdown of debt related to derivatives):
7. Investments in government business enterprises
The University controls two profit oriented subsidiaries which are recorded using the modified equity method of accounting. The two entities are Heritage Realty Properties and Vancouver Island Technology Park. Change in equity in government business enterprises:
(c) Derivatives
2017 2016 Fair Value Hierarchy
Derivatives ‑ interest rate swaps on long‑term debt
quoted at fair value:
BC Immigrant Investment Fund interest rate
swap fixed at 5.14% commencing in 2017 Level 1 $ - $ (621)
Province of BC interest rate swap fixed at 5.14%
commencing in 2017 through 2027 Level 1 (573) -
Royal Bank of Canada floating interest rate fixed
at 5.38%, through an interest rate swap due in
2024, unsecured Level 1 (1,108) (1,549)
BC Immigrant Investment Fund floating interest
rate fixed at 3.56%, commencing 2023 through
2033, unsecured Level 1 (232) (274)
Total derivatives $ (1,913) $ (2,444)
2017 2016
Equity at beginning of year $ 4,385 $ 4,458
Dividends/distributions paid (1,226) (1,031)
Net earnings 486 958
Equity at end of year 3,645 4,385
Dividends/distributions payable 2,650 2,151
Investment in government business enterprises $ 6,295 $ 6,536

21
UNIVERSITY OF VICTORIA Notes to Consolidated Financial Statements
Year ended March 31, 2017
(tabular figures in thousands of dollars)
7. Investments in government business enterprises (continued) Condensed financial information of these government business enterprises are as follows: Consolidated Statement of Financial Position
Consolidated Statement of Operations
8. Investments in government partnerships
The University is one of twelve university members of a consortium which manages the Tri‑Universities Meson Facility (TRIUMF) for research in sub‑atomic physics. The facility is funded by federal government grants and the University makes no direct financial contribution. TRIUMF’s financial results are proportionately consolidated with those of the University based upon the University’s share of its total ownership of 8.33% (2016 – 8.33%). The University is one of five university members of the Western Canadian Universities Marine Sciences Society (WCUMSS) for marine field research. The University provided a grant to the Society in 2017 of $273,400 (2016 – $273,400). WCUMSS financial results are proportionately consolidated with those of the University based upon the University’s share of its total contributions of 20% (2016 – 20%).
The proportionate amounts included in these consolidated financial statements are as follows:
Consolidated Statement of Financial Position
2017 2016
Assets $ 35,378 $ 36,447
Liabilities (31,733) (32,062)
Equity $ 3,645 $ 4,385
2017 2016
Financial assets $ 4,406 $ 2,837
Liabilities 2,023 1,098
Net assets 2,383 1,739
Non‑financial assets 1,172 1,103
Accumulated surplus $ 3,555 $ 2,842
2017 2016
Revenue $ 12,778 $ 12,838
Expenses (12,292) (11,880)
Surplus for the year $ 486 $ 958

22
UNIVERSITY OF VICTORIA Notes to Consolidated Financial Statements
Year ended March 31, 2017
(tabular figures in thousands of dollars)
8. Investments in government partnerships (continued)
Consolidated Statement of Operations 9. Accounts payable and accrued liabilities 10. Employee future benefits
Employee future benefit liabilities arise in connection with the University’s group life insurance, long‑term disability plans and accumulated sick leave plans. The University also maintains pension plans, and other retirement and supplementary benefit arrangements for substantially all of its continuing employees. Summary of employee future benefit obligations:
2017 2016
Revenue $ 7,360 $ 6,724
Expenses 6,647 6,383
Surplus for the year $ 713 $ 341
2017 2016
Accounts payable and accrued liabilities $ 18,371 $ 17,021
Salaries and benefits payable 3,905 4,242
Accrued vacation pay 9,349 7,597
$ 31,625 $ 28,860
2017 2016
Staff pension plan $ (13,700) $ (9,333)
Supplemental pension obligations 6,829 6,145
Special accumulated sick leave 3,164 3,149
Long term disability benefits 20,480 16,936
Basic group life insurance plan 1,560 1,534
$ 18,333 $ 18,431

23
UNIVERSITY OF VICTORIA Notes to Consolidated Financial Statements
Year ended March 31, 2017
(tabular figures in thousands of dollars)
10. Employee future benefits (continued)
(a) Pension benefits
(i) Combination plan The pension fund for full-time continuing faculty and administrative and academic professional staff is referred to as the Combination Plan. The plan’s benefits are derived primarily from defined contributions with a defined benefit minimum. The plan has been accounted for as a defined contribution plan. The employees make contributions equal to 4.35% of salary up to the year’s maximum pensionable earnings (“YMPE”) plus 6.35% of salary in excess of the YMPE. The university makes contributions equal to 6.02% of salary up to the YMPE plus 7.65% of salary in excess of the YPME. The university also contributes 5.05% of salary to fund the defined benefit minimum. The latest actuarial valuation for funding purposes as at December 31, 2015 showed that the accrued formula pension benefit liabilities of the Combination Plan were fully funded. The next valuation will be as at December 31, 2018. A solely defined contribution plan is available for part-time faculty and administrative and academic professional staff who meet certain eligibility criteria. The University has made contributions to these two plans during the year of $21,195,000 (2016 - $20,486,000) and recorded them as a pension expense. The University provides supplemental pensions in excess of those provided under registered plans. They are fully funded out of the general assets of the University. The accrued liabilities of these arrangements total $6,829,000 as at March 31, 2017 (2016 – $6,145,000). The University paid supplemental benefits of $89,000 in the year (2016 – $105,000) and recorded employee benefit expense of $102,000 (2016 – $115,000).
(ii) Staff plan
The Staff Pension Plan (the "Plan") is a contributory defined benefit pension plan made available to regular staff employees that are eligible to join the Plan. The Plan provides pensions based on credited service and final average salary. Based on membership data as at the last actuarial valuation as at December 31, 2013, the average age of the 1,152 active employees covered by the Plan is 47.8. In addition, there are 419 former employees who are entitled to deferred pension benefits averaging $289 per month. At December 31, 2013, there were 639 pensioners receiving an average monthly pension of $826. The employees make contributions equal to 4.53% of salary that does not exceed the YMPE plus 6.28% of salary in excess of the YMPE. A separate pension fund is maintained. The University makes contributions to the plan in line with recommendations contained in the actuarial valuation. Though the University and the employees both contribute to the pension fund, the University retains the full risk of the accrued benefit obligation. The pension fund assets are invested primarily in Universe bonds and equities. The University has made contributions to the Plan during the year of $5,739,000 (2016 –$5,668,000). The Plan paid benefits in the year of $10,130,000 (2016 – $8,700,000).

24
UNIVERSITY OF VICTORIA Notes to Consolidated Financial Statements
Year ended March 31, 2017
(tabular figures in thousands of dollars)
10. Employee future benefits (continued)
(a) Pension benefits (continued)
(ii) Staff plan (continued) The pension asset at March 31 includes the following components:
Actuarial valuations are performed triennially using the projected benefit prorate method. The latest triennial actuarial valuation completed as at December 31, 2013 reported a going concern surplus and a solvency deficiency (i.e. if the plan were to be wound up on that date) of $41,866,000. The B.C. Pension Benefits Standards Act requires minimum annual contributions or the use of letters of credit to fund a solvency deficiency. The University has chosen to arrange a letter of credit in the amount of $43.8 million at March 31, 2017 (2016 ‑ $40.8 million) to satisfy the contribution requirements through 2017. This letter of credit will be reassessed in conjunction with the December 31, 2016 plan valuation and updated solvency funding level. The accrued benefit obligation shown for 2017 is based on an extrapolation of that 2013 valuation. There is an unamortized gain to be amortized on a straight‑line basis over the expected average remaining service life of the related employee group (12 years). The actuarial valuation was based on a number of assumptions about future events, such as inflation rates, interest rates, wage and salary increases and employee turnover and mortality. The assumptions used reflect the University's best estimates. The expected inflation rate is 2%. The discount rate used to determine the accrued benefit obligation is 6%. Pension fund assets are valued at market value.
2017 2016
Accrued benefit obligation $ 210,816 $ 201,388
Pension fund assets (244,027) (231,799)
(33,211) (30,411)
Unamortized actuarial gains 19,511 21,078
Net asset $ (13,700) $ (9,333)

25
UNIVERSITY OF VICTORIA Notes to Consolidated Financial Statements
Year ended March 31, 2017
(tabular figures in thousands of dollars)
10. Employee future benefits (continued)
(a) Pension benefits (continued)
(ii) Staff plan (continued)
The expected rate of return on pension fund assets is 6%. The actual rate of return on Plan assets in 2016 was 6%. The total expenses related to pensions for the fiscal year ending, include the following components:
The Supplementary Retirement Benefit Account is a separate fund available to provide pensioners over the age of 65 with supplemental indexing against inflation beyond that provided by the basic plan above. It is accounted for as a defined contribution plan, with University contributions during the year of $120,000 (2016 – $118,000).
(b) Special accumulated sick leave benefit liability
Certain unionized employees of the University are entitled to a special vested sick leave benefit in accordance with the terms and conditions of their collective agreements. Employees who accumulate and maintain a minimum balance of regular sick leave may opt to transfer sick days into this special accumulating and vested benefit. The University recognizes a liability and an expense as days are transferred into this benefit. At March 31, 2017 the balance of this special accumulated sick leave was $3,164,000 (2016 – $3,149,000).
2017 2016
Current period benefit cost $ 7,365 $ 7,042
Amortization of actuarial gains (losses) (1,987) (1,785)
5,378 5,257
Less: Employee contributions (2,117) (2,086)
Pension benefit expense 3,261 3,171
Interest cost on the average accrued benefit obligation 11,962 11,391
Expected return on average pension plan assets (13,623) (12,792)
Pension interest income (1,661) (1,401)
Total pension expense $ 1,600 $ 1,770

26
UNIVERSITY OF VICTORIA Notes to Consolidated Financial Statements
Year ended March 31, 2017
(tabular figures in thousands of dollars)
10. Employee future benefits (continued)
(c) Long‑term disability benefits
The University administers an employee‑funded long‑term disability plan for faculty and administrative and academic professional staff. It is self‑insured and the liability for the discounted present value of estimated future payments to current claimants is recorded. Information about liabilities for the University’s long‑term disability plan includes:
Components of net benefit expense:
2017 2016
Accrued benefit obligation:
Beginning of year $ 16,936 $ 14,765
Current service cost 7,433 7,637
Interest cost 318 252
Benefits paid (2,764) (2,365)
Actuarial loss (1,443) (3,353)
Accrued benefit obligation, end of year $ 20,480 $ 16,936
2017 2016
Accrued benefit obligation:
Plan assets $ 13,870 $ 12,984
Accrued benefit obligation, end of year (20,480) (16,936)
Unfunded liability, end of year $ (6,610) $ (3,952)
2017 2016
Service cost $ 7,433 $ 7,637
Interest cost 318 252
Expected return on assets (248) (211)
Amortization of net actuarial gain (1,507) (3,110)
Net benefit expense $ 5,996 $ 4,568

27
UNIVERSITY OF VICTORIA Notes to Consolidated Financial Statements
Year ended March 31, 2017
(tabular figures in thousands of dollars)
10. Employee future benefits (continued)
(c) Long‑term disability benefits (continued)
The significant actuarial assumptions adopted in measuring the University’s accrued benefit obligation are as follows:
An insured long‑term disability plan funded entirely by the University was commenced for other staff on July 1, 2000. The University contribution for the year ending March 31, 2017 was $1,153,000 (2016 - $1,138,000).
11. Deferred contributions
Deferred contributions are comprised of funds restricted for the following purposes:
2017 2016
Discount rates 1.9% 1.9%
Expected future inflation rates 2.0% 2.0%
Salary increase assumption 2.0% 2.0%
Retirement age assumption 65 65
2017 2016
Specific purpose: (including endowment earnings) $ 108,233 $ 80,896
Research 56,170 46,402
Capital 2,620 1,802
$ 167,023 $ 129,100
2017
Specific
Purpose Research Capital Total 2016
Balance, beginning of year $ 80,896 $ 46,402 $ 1,802 $ 129,100 $ 146,162
Contributions and endowment
investment income 59,678 89,522 824 150,024 89,698
Revenue recognized from
deferred contributions
(32,341) (79,754) (6) (112,101) (106,760)
Balance, end of year $ 108,233 $ 56,170 $ 2,620 $ 167,023 $ 129,100

28
UNIVERSITY OF VICTORIA Notes to Consolidated Financial Statements
Year ended March 31, 2017
(tabular figures in thousands of dollars)
12. Deferred capital contributions
Contributions that are restricted for capital are referred to as deferred capital contributions. Amounts are recognized into revenue as the liability is extinguished over the useful life of the asset. Treasury Board provided direction on accounting treatment as disclosed in Note 2 (a). Changes in the deferred capital contributions balance are as follows:
13. Long-term debt
Long‑term debt reported on the consolidated statement of financial position is comprised of the following (see note 6(c) for related derivative information):
2017 2016
Balance, beginning of year $ 371,231 $ 379,426
Contributions received during the year 39,739 23,105
Revenue from amortization of deferred capital contributions (26,473) (31,300)
Balance, end of year $ 384,497 $ 371,231
2017 2016
Royal Bank of Canada
5.38% term loan due 2024, unsecured $ 7,630 $ 8,428
Province of British Columbia
5.14% term loan due 2027, unsecured 3,066 -
British Columbia Immigrant Investment Fund
4.75% term loan due 2017, unsecured - 3,315
British Columbia Immigrant Investment Fund
2.48% term loan due 2023, unsecured 8,483 8,902
Province of British Columbia
4.82% bond due 2027, unsecured,
with annual sinking fund payments of $327,000 10,800 10,800
Province of British Columbia
4.74% bond due 2038, unsecured,
with annual sinking fund payments of $302,000 10,000 10,000
Great West Life Insurance Company
5.13% term loan due 2030, unsecured 10,820 11,386
Long‑term debt $ 50,799 $ 52,829
Accumulated sinking fund payments (6,125) (5,496)
Remaining long-term debt principal repayments $ 44,674 $ 47,333

29
UNIVERSITY OF VICTORIA Notes to Consolidated Financial Statements
Year ended March 31, 2017
(tabular figures in thousands of dollars)
13. Long-term debt (continued) (a) Principal repayments
Anticipated annual principal repayments, including sinking fund instalments and maturities, due over the next five years and thereafter are as follows:
2017
Sinking Fund Other Total
2018 $ 629 $ 2,106 $ 2,735
2019 629 2,208 2,837
2020 629 2,314 2,943
2021 629 2,425 3,054
2022 629 2,542 3,171
Thereafter 11,530 18,404 29,934
$ 14,675 $ 29,999 $ 44,674

30
UNIVERSITY OF VICTORIA Notes to Consolidated Financial Statements
Year ended March 31, 2017
(tabular figures in thousands of dollars)
14. Tangible capital assets
Cost
Balance at
March 31, 2016
Additions Disposals Balance as at
March 31, 2017
Land $ 23,134 $ - $ - $ 23,134
Site Improvements 34,402 5,774 40,176
Buildings 763,378 24,934 788,312
Equipment and furnishings 209,206 19,413 (38,581) 190,038
Information systems 18,441 18,441
Computer equipment 16,982 3,431 (3,895) 16,518
Library holdings 40,384 2,659 (4,621) 38,422
Total $ 1,105,927 $ 56,211 $ (47,097) $ 1,115,041
Accumulated amortization
Balance at
March 31, 2016
Disposals Amortization Balance as at
March 31, 2017
Land $ - $ - $ - $ -
Site Improvements 17,942 943 18,885
Buildings 210,207 15,909 226,116
Equipment and furnishings 126,487 (38,581) 20,612 108,518
Information systems 18,168 192 18,360
Computer equipment 10,578 (3,895) 4,170 10,853
Library holdings 22,250 (4,621) 3,710 21,339
Total $ 405,632 $ (47,097) $ 45,536 $ 404,071
Net book value March 31, 2016 March 31, 2017
Land $ 23,134 $ 23,134
Site improvements 21,291 16,460
Buildings 562,196 553,171
Equipment and furnishings 81,520 82,719
Information systems 81 273
Computer equipment 5,665 6,404
Library holdings 17,083 18,134
Total $ 710,970 $ 700,295

31
UNIVERSITY OF VICTORIA Notes to Consolidated Financial Statements
Year ended March 31, 2017
(tabular figures in thousands of dollars)
14. Tangible capital assets (continued) Contributed tangible capital assets: Additions to equipment and furnishings and computers include the following contributed tangible capital
assets:
(a) Assets under construction
Assets under construction having a value of $ 5,187,000 (2016 – $ nil ) comprised of buildings have not been amortized. Amortization of these assets will commence when the asset is available for productive use.
(b) De-recognition of tangible capital assets
The de-recognition of tangible capital assets during the year was $ 47,097,000 (2016 – $31,851,000) related to fully amortized assets with a net book value of $ nil (2016 – $ nil) related to asset disposals.
15. Financial risk management
The University has exposure to the following risks from its use of financial instruments: credit risk, price risk and liquidity risk. The Board of Governors ensures that the University has identified major risks and management monitors and controls them. (a) Credit risk
Credit risk is the risk of financial loss to the University if a customer or counterparty to a financial instrument fails to meet its contractual obligations. Such risks arise principally from the amounts receivable and from fixed income assets held by the University. The University manages amounts receivable by using a specific bad debt provision when management considers that the expected recovery is less than the account receivable. The University limits the risk in the event of non‑performance related to fixed income holdings by dealing principally with counter‑parties that have a credit rating of A or higher as rated by the Dominion Bond Rating Service or equivalent. The credit risk of the University investments at March 31, 2017 is $262,137,000 (2016 – $261,323,000).
2017 2016
Equipment and furnishings $ 104 $ 23

32
UNIVERSITY OF VICTORIA Notes to Consolidated Financial Statements
Year ended March 31, 2017
(tabular figures in thousands of dollars)
15. Financial risk management (continued)
The following shows the percentage of fixed income holdings in the portfolio by credit rating:
(b) Price risk
Price risk includes market risk and interest rate risk.
Market risk relates to the possibility that the investments will change in value due to fluctuations in market prices. The objective of market risk management is to mitigate market risk exposures within acceptable parameters while optimizing the return on risk. This risk is mitigated by the investment policies for the respective asset mixes to be followed by the investment managers, the requirements for diversification of investments within each asset class and credit quality constraints on fixed income investments. Market risk can be measured in terms of volatility, i.e., the standard deviation of change in the value of a financial instrument within a specific time horizon. Based on the volatility of the University’s current asset class holdings, the net impact on market value of each asset class is shown below.
Credit Rating %
AAA 16.5%
AA 16.3%
A 7.8%
BBB 8.1%
BB and below 0.9%
Mortgages 14.8%
Cash and short term
R1 high 33.8%
R1 mid 0.7%
R1 low 1.2%
100.0%
Asset Class
Estimated Volatility
(% change)
Canadian equities +/- 21.0%
Foreign equities +/- 17.5%
Real estate +/- 10.1%
Bonds +/- 5.1%
Infrastructure +/- 17.7%
Benchmark for Investments Net Impact on
DEX Universe Bond index +/- $ 9,226
S&P/TSX Composite index +/- 24,159
MSCI World Index +/- 23,389
Canadian Consumer Price Index (Real Estate) +/- 3,760
Canadian Consumer Price Index (Infrastructure) +/- 7,770

33
UNIVERSITY OF VICTORIA Notes to Consolidated Financial Statements
Year ended March 31, 2017
(tabular figures in thousands of dollars)
15. Financial risk management (continued)
(b) Price risk (continued)
Interest rate risk is the risk that the fair value of future cash flows of a financial instrument will fluctuate because of changes in the market interest rates. The value of fixed‑income and debt securities, such as bonds, debentures, mortgages or other income‑producing securities is affected by interest rates. Generally, the value of these securities increases if interest rates fall and decreases if interest rates rise. It is management's opinion that the University is exposed to market or interest rate risk arising from its financial instruments. Duration is an appropriate measure of interest rate risk for fixed income funds as a rise (fall) in interest rates will cause a decrease (increase) in bond prices; the longer the duration, the greater the effect. Duration is managed by the investment manager at the fund level. At March 31, 2017, the modified duration of all fixed income in aggregate was 3.8 years. Therefore, if interest rates were to increase by 1% across all maturities, the value of the bond portfolio would drop by 3.8%; contrarily, if interest rates were to decrease by 1% across all maturities, the value of the bond portfolio would increase by 3.8%.
(c) Liquidity risk
Liquidity risk is the risk that the University will not be able to meet its financial obligations as they become due. The University manages liquidity risk by continually monitoring actual and forecasted cash flows from operations and anticipated investing and financing activities to ensure, as far as possible, that it will always have sufficient liquidity to meet its liabilities when due, under both normal and stressed conditions, without incurring unacceptable losses or risking damage to the University’s reputation.
16. Accumulated surplus
Accumulated surplus is comprised of the following: 2017 2016
Endowments $ 316,621 $ 306,472
Invested in capital assets 292,622 293,119
Internally restricted 88,598 81,984
Unrestricted 21,913 20,627
Accumulated remeasurement gains 16,321 14,162
$ 736,075 $ 716,364

34
UNIVERSITY OF VICTORIA Notes to Consolidated Financial Statements
Year ended March 31, 2017
(tabular figures in thousands of dollars)
16. Accumulated surplus (continued)
Endowments consist of restricted donations and capitalized investment income to be held in perpetuity. Invested in capital assets consist of unrestricted funds previously spent on capital assets and debt repayment. Internally restricted funds consist of balances set aside or appropriated by the Board of Governors for equipment replacement, capital improvements and other non‑recurring expenditures. Unrestricted funds consist primarily of balances arising from the University’s ancillary and specific purpose funds, and consolidated entities.
17. Endowments
Changes to the endowment principal balances, not including remeasurement gains/losses, are as follows:
The balance shown does not include endowment principal with fair value of $7,459,000 (2016 – $6,914,000) and book value of $4,820,000 (2016 – $4,820,000) held by the Vancouver Foundation. The excluded principal is not owned or controlled by the University, but income from it is paid to the University to be used for specific purposes.
2017 2016
Balance, beginning of year $ 306,472 $ 295,532
Contributions received during the year 5,285 6,708
Invested income and donations capitalized 4,864 4,232
Balance, end of year $ 316,621 $ 306,472

35
UNIVERSITY OF VICTORIA Notes to Consolidated Financial Statements
Year ended March 31, 2017
(tabular figures in thousands of dollars)
18. Contractual obligations
The nature of the University’s activities can result in multiyear contracts and obligations whereby the University will be committed to make future payments. Significant contractual obligations related to operations that can be reasonably estimated are as follows:
19. Contingent liabilities
The University may, from time to time, be involved in legal proceedings, claims, and litigation that arise in the normal course of business. It is management’s opinion that the aggregate amount of any potential liability is not expected to have a material adverse effect on the University’s financial position or results. The University is one of 58 Canadian university subscribers to CURIE, which has provided property and liability insurance coverage to most campuses other than Quebec and Prince Edward Island since 1988. The anticipated cost of claims based on actuarial projections is funded through member premiums. Subscribers to CURIE have exposure to premium retro‑assessments should the premiums be insufficient to cover losses and expenses.
20. Expenses by object The following is a summary of expenses by object: 2017 2016
Salaries and wages $ 292,277 $ 282,257
Employee benefits 53,919 49,689
Travel 13,393 14,396
Supplies and services 78,084 68,743
Equipment rental and maintenance 6,642 9,688
Utilities 8,711 8,905
Scholarships, fellowships and bursaries 35,873 37,157
Cost of goods sold 13,017 13,938
Interest on long‑term debt 2,371 2,267
Amortization of tangible capital assets 45,536 51,378
$ 549,823 $ 538,418
2018 2019 2020 2021 2022
Construction contracts $ 2,321 $ - $ - $ - $ -
Operating leases 276 66 60 30 -
Total $ 2,597 $ 66 $ 60 $ 30 $ -

36
UNIVERSITY OF VICTORIA Notes to Consolidated Financial Statements
Year ended March 31, 2017
(tabular figures in thousands of dollars)
21. Funds held in trust
Funds held in trust are funds held on behalf of autonomous organizations, agencies, and student societies having a close relationship with the University. These funds are not reported on the University’s consolidated statement of financial position (2017– $2,019,000 ; 2016 – $1,092,000).
22. Supplemental cash flow information 23. Differences between Financial Reporting Framework (FRF) and PSAS
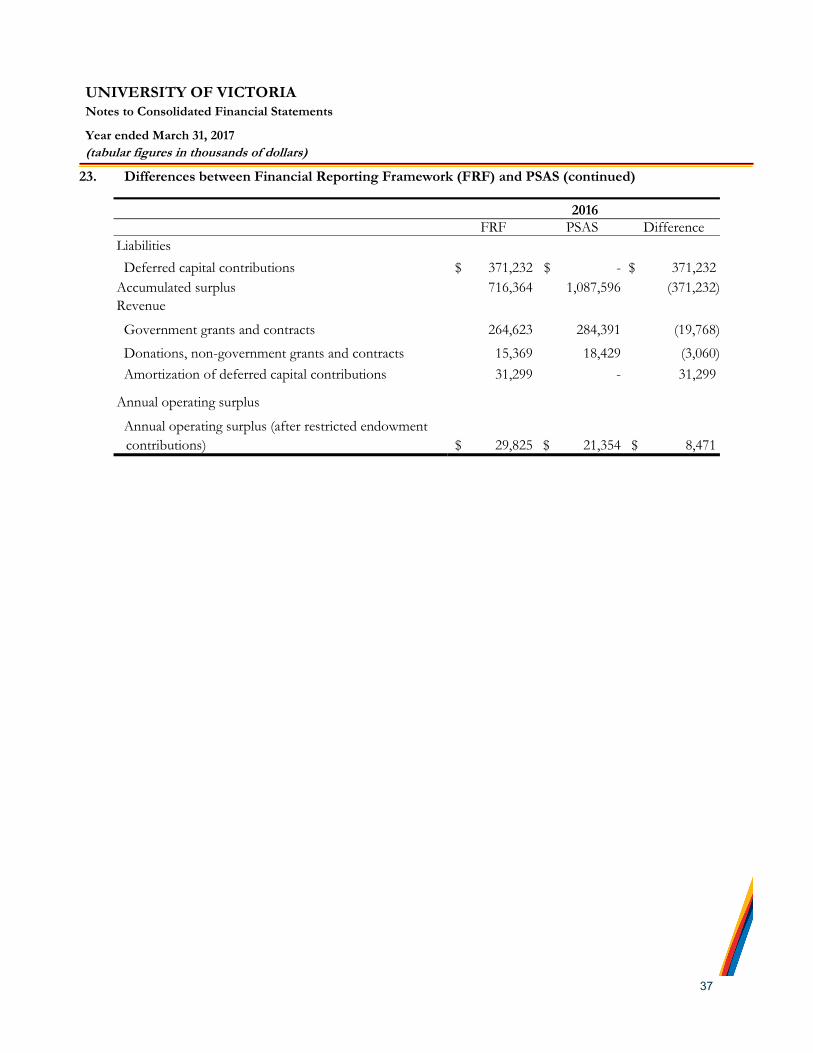
As noted in the significant accounting policies, per the Budget Transparency and Accountability Act of the Province of British Columbia and the Restricted Contribution Regulation 198/2011 issued pursuant to it, the university is required to account for government funding of tangible capital assets by deferring and amortizing deferred capital contributions to income on the same basis as the related amortization expense. If restricted government funding for tangible capital assets does not contain stipulations that create a liability, then PSAS requires it to be reported as income immediately. The impact of this difference on the consolidated financial statements of the university would be as follows:
2017 2016
Cash paid for interest $ 2,371 $ 2,466
2017
FRF PSAS Difference
Liabilities
Deferred capital contributions $ 384,497 $ - $ 384,497
Accumulated surplus 736,075 1,120,572 (384,497)
Revenue
Government grants and contracts 257,850 296,810 (38,960)
Donations, non-government grants and contracts 18,670 20,266 (1,596)
Amortization of deferred capital contributions 26,473 - 26,473
Annual operating surplus
Annual operating surplus (after restricted endowment
contributions) $ 17,552 $ 31,635 $ (14,083)
37
UNIVERSITY OF VICTORIA Notes to Consolidated Financial Statements
Year ended March 31, 2017
(tabular figures in thousands of dollars)
23. Differences between Financial Reporting Framework (FRF) and PSAS (continued)
2016
FRF PSAS Difference
Liabilities
Deferred capital contributions $ 371,232 $ - $ 371,232
Accumulated surplus 716,364 1,087,596 (371,232)
Revenue
Government grants and contracts 264,623 284,391 (19,768)
Donations, non-government grants and contracts 15,369 18,429 (3,060)
Amortization of deferred capital contributions 31,299 - 31,299
Annual operating surplus
Annual operating surplus (after restricted endowment
contributions) $ 29,825 $ 21,354 $ 8,471
38
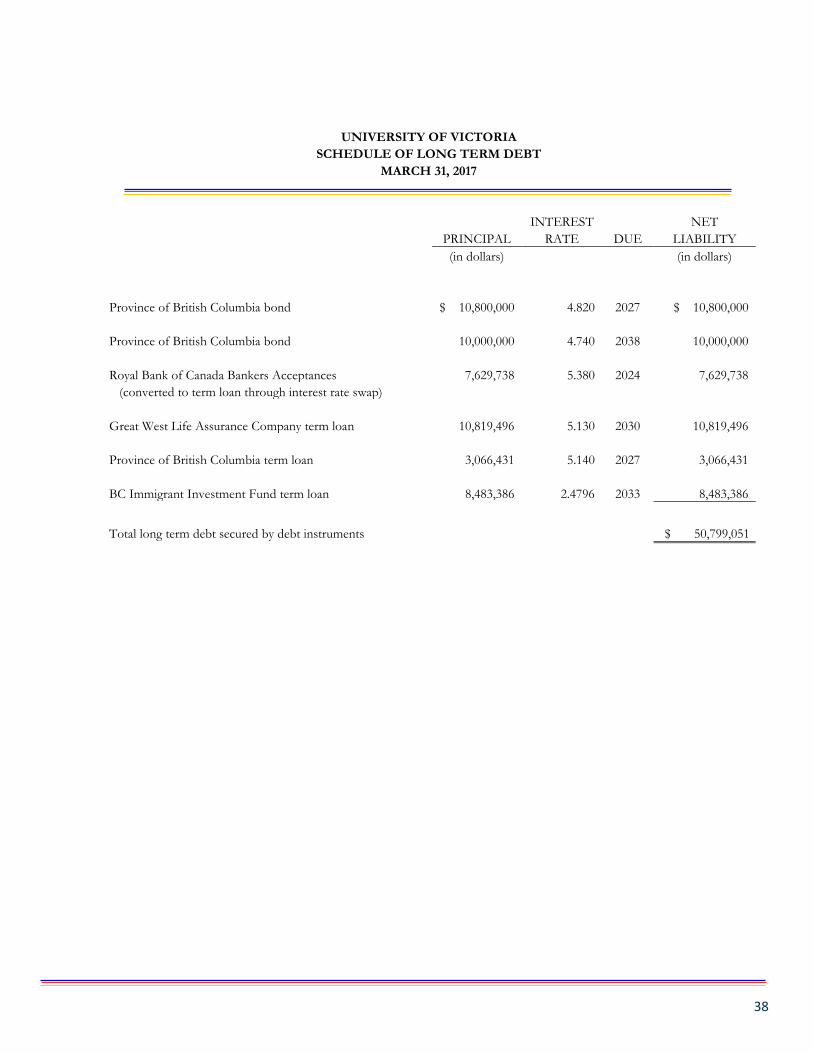
UNIVERSITY OF VICTORIA SCHEDULE OF LONG TERM DEBT
MARCH 31, 2017 INTEREST NET PRINCIPAL RATE DUE LIABILITY
(in dollars) (in dollars) Province of British Columbia bond $ 10,800,000 4.820 2027 $ 10,800,000 Province of British Columbia bond 10,000,000 4.740 2038 10,000,000 Royal Bank of Canada Bankers Acceptances 7,629,738 5.380 2024 7,629,738 (converted to term loan through interest rate swap) Great West Life Assurance Company term loan 10,819,496 5.130 2030 10,819,496 Province of British Columbia term loan 3,066,431 5.140 2027 3,066,431 BC Immigrant Investment Fund term loan 8,483,386 2.4796 2033 8,483,386
Total long term debt secured by debt instruments $ 50,799,051

39
UNIVERSITY OF VICTORIA SCHEDULE OF GUARANTEE OR INDEMNITY AGREEMENTS
This organization has not given any guarantees or indemnities, approved under the Guarantees and Indemnities Regulation during fiscal 2016-2017. This statement is produced under the Financial Information Regulation, Schedule 1, subsection 5.

40
UNIVERSITY OF VICTORIA STATEMENT OF SEVERANCE AGREEMENTS
There was one severance agreement representing two months compensation made between the University of Victoria and non-unionized employees during fiscal 2016-2017. This statement is produced under the Financial Information Regulation, Schedule 1, subsection 6 (7).
41
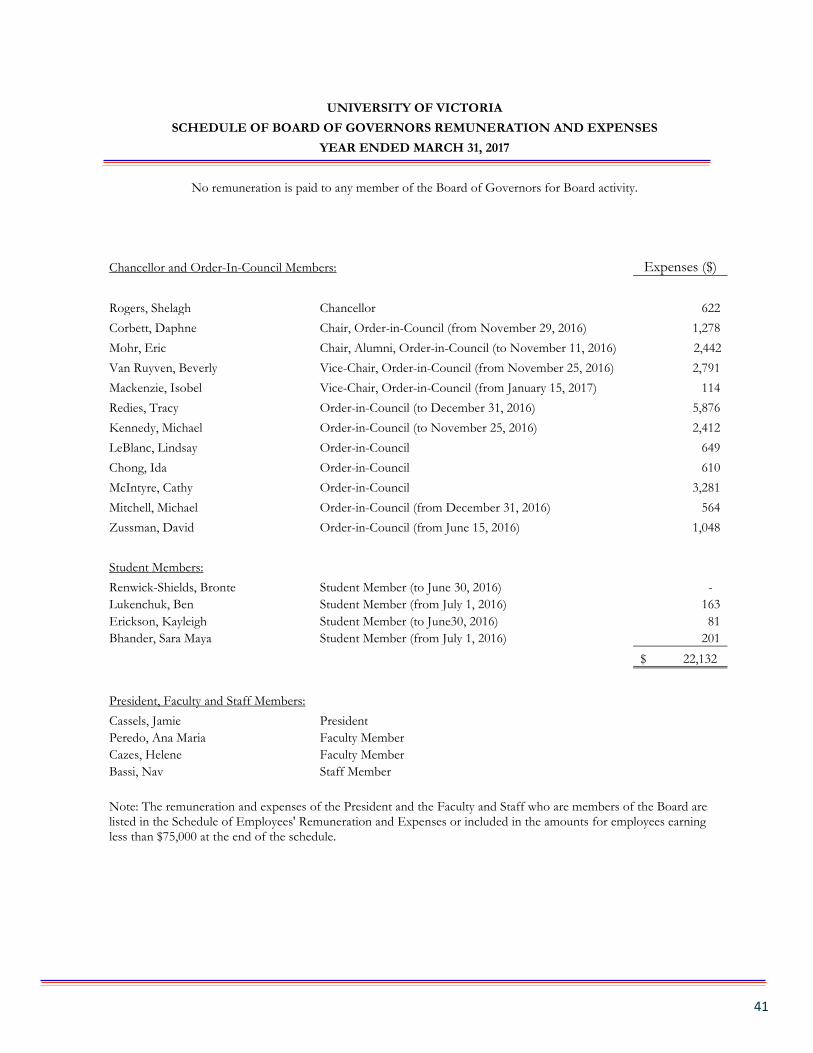
UNIVERSITY OF VICTORIA SCHEDULE OF BOARD OF GOVERNORS REMUNERATION AND EXPENSES
YEAR ENDED MARCH 31, 2017
No remuneration is paid to any member of the Board of Governors for Board activity.
Chancellor and Order-In-Council Members: Expenses ($)
Rogers, Shelagh Chancellor 622 Corbett, Daphne Chair, Order-in-Council (from November 29, 2016) 1,278 Mohr, Eric Chair, Alumni, Order-in-Council (to November 11, 2016) 2,442 Van Ruyven, Beverly Vice-Chair, Order-in-Council (from November 25, 2016) 2,791 Mackenzie, Isobel Vice-Chair, Order-in-Council (from January 15, 2017) 114 Redies, Tracy Order-in-Council (to December 31, 2016) 5,876 Kennedy, Michael Order-in-Council (to November 25, 2016) 2,412 LeBlanc, Lindsay Order-in-Council 649 Chong, Ida Order-in-Council 610 McIntyre, Cathy Order-in-Council 3,281 Mitchell, Michael Order-in-Council (from December 31, 2016) 564 Zussman, David Order-in-Council (from June 15, 2016) 1,048 Student Members: Renwick-Shields, Bronte Student Member (to June 30, 2016) - Lukenchuk, Ben Student Member (from July 1, 2016) 163 Erickson, Kayleigh Student Member (to June30, 2016) 81 Bhander, Sara Maya Student Member (from July 1, 2016) 201
$ 22,132
President, Faculty and Staff Members: Cassels, Jamie President Peredo, Ana Maria Faculty Member Cazes, Helene Faculty Member Bassi, Nav Staff Member Note: The remuneration and expenses of the President and the Faculty and Staff who are members of the Board are listed in the Schedule of Employees' Remuneration and Expenses or included in the amounts for employees earning less than $75,000 at the end of the schedule.

42
UNIVERSITY OF VICTORIA SCHEDULE OF EMPLOYEES' REMUNERATION AND EXPENSES
YEAR ENDED MARCH 31, 2017 Remuneration includes salary and wages of University employees, including payments to employees for services performed over and above their regular duties, and payments to employees in connection with retirement (*). Reimbursement of work-related expenses represents payments for costs incurred by employees in connection with their duties. These include travel expenses, memberships, tuition, relocation (**), vehicle expenses, extraordinary hiring expenses, registration fees and similar amounts. Both remuneration and expenses include amounts provided from grants and contracts administered by the University.
Remuneration ($)
Reimbursement of Work Related Expenses ($) Remuneration ($)
Reimbursement of Work Related Expenses ($)
Adam, Martin 98,042 1,360 Adam, Ruth 79,976 3,556 Adams, Michael 118,516 50 Adams, Sean 78,052 - Adjin-Tettey, Elizabeth 163,618 1,894
Agathoklis, Panajotis 178,824 1,756
Ahmadi, Keivan 99,357 6,171
Akbari, Mohsen 99,373 2,284
Albert, Jeff 94,979 1,452
Albert, Justin 104,481 6,387
Albu, Catalin 86,237 3,155
Alexander, Robert 117,128 4,338
Alexandrowicz, Conrad 95,390 1,480
Alfred, Gerald Taiaiake 147,001 12,479
Allen, Geraldine 132,927 3,665
Andersen, Carrie 101,438 3,018
Andersen, Leigh 104,437 406
Anderson, Debra 85,983 3,293
Andrachuk, Gregory 141,212 2,243
Anglin, James 201,327 5,301
Anholt, Bradley 173,156 - Anslow, Faron 88,334 2,945 Antliff, Allan 81,770 5,261 Aragon, Janni 120,706 18,356 Archibald, John 166,580 7,560 Arneil, Stewart 87,796 2,064
Atherton, Pat 110,627 1,594 Atkinson, David 115,882 15,484 Auld, M 140,511 - Ausio, Juan 159,083 7,573 Awatramani, Gautam 133,475 5,516
Baboula, Evanthia 96,832 1,699 Babul, Arif 131,526 20,017 Baer, Douglas 152,733 4,915 Baggs, Jen 101,929 2,007 Bailey, Kelly 75,464 1,824 Bain, Thomas 77,080 - Bakvis, Herman 95,964 - Balfour, Annemarie 87,459 301 Ball, Jessica 142,029 17,717 Ban, Natalie 93,815 14,528 Banerjee, Sikata 150,881 2,865 Baniasadi, Amirali 116,988 8,404 Banister, Elizabeth 140,541 1,050 Bardal, Stanley 80,365 1,035 Barnas, Laurie 95,791 1,254 Barnhardt, Don 188,725 5,041 Barnhardt, Laurie 98,677 12,410 Barr, Christopher 81,688 2,879 Bartlett, Kevin 84,099 8,991 Bartley, Uwe 90,310 - Bashir, Rizwan 86,415 2,557 Bassi, Navdeep 133,548 5,841 Batur, Levent 84,132 2,618 Baum, Julia 110,420 23,516 Bazalova, Magdalena 93,916 1,425 Beam, Sara 104,803 5,054 Beaucamp, Craig 82,926 4,404 Beaulieu, Gregory 114,963 1,708 Beaveridge, Chandra 78,127 4,916 Bebbington, Tina 95,779 3,567 Bedi, Shailoo 124,250 4,712 Beecroft, V Lynne 79,399 724

Remuneration ($)
Reimbursement of Work Related Expenses ($)
Remuneration ($)
Reimbursement of Work Related Expenses ($)
43
University of Victoria Schedule of Employees’ Remuneration and Expenses Year ended March 31, 2017
Begoray, Deborah 151,295 1,873 Bengtson, Jonathan 183,728 31,148 Bennett, Colin 135,707 9,902 Benoit, Cecilia 144,479 - Benson, Karla 80,612 167 Berg, David 128,082 1,231 Bergeret, Didier 76,633 1,314 Bergland, Donald 112,484 2,733 Berry, David 86,617 2,894 Bertoni, Katherine 102,726 11,707 Best, Tricia 78,553 7,456 Bettaglio, Maria 75,994 3,127 Bhat, Ashoka 161,332 10,386 Bhiladvala, Rustom 112,787 650 Biddiscombe, A Perry 119,511 - Biffard, Benjamin 79,683 4,043 Bird, Sonya 102,106 6,894 Biro, Daniel 106,626 1,283 Bjornson, Dora Leigh 82,508 - Black, Sarah 84,141 5,760 Black, Timothy 118,505 8,525 Blackburn, Arthur 100,443 4,040 ** Blackstone, Sarah 182,900 - Blades, David 151,077 3,758 Blair, William 105,618 2,364 Blank, G 137,866 1,319 Bligh, Sandra 121,885 5,016 Bluck, Gerald 87,800 - Boag, David 77,484 - Bodden, Michael 137,802 - Bohne, Cornelia 164,446 3,446 Bomford, Lionel 77,509 6,801 ** Bonner, Michelle 101,711 5,520 Boraston, Alisdair 135,950 9,014 Borchers, Christoph 215,219 92,925 Bornemann, Jens 176,865 7,559 Borrows, John 246,638 12,867 Borycki, Elizabeth 108,516 4,659 Bose, Christopher 135,353 10,702 Bose, Neilesh 107,286 30,525 ** Bosma, Jeffery 88,250 5,145 Boudreault-Fournier, Alexandrine 98,140 26,588 Boulanger, Martin 131,074 1,437 Bourguiba, Imen 82,920 3,985 Boutin, Brigitte 99,071 1,384 Bowman, Laurel 110,391 2,752 Boyd, Susan 145,333 - Boyer, Wanda 124,110 - Boyle, Patrick 89,312 - Bradley, Colin 147,238 8,374
Bradley, Maureen 117,204 1,804 Bradley, Nicholas 95,309 10,809 Bramadat, Paul 138,210 11,575 Brandes, Oliver 123,908 13,086 Branzan Albu, Alexandra 133,554 15,672 Brendle-Moczuk, Daniel 94,223 3,849 Brenton-Haden, Sally 94,024 375 Brewer, Bonny 81,101 - Briant, Douglas 95,596 2,723 Bridgens, Gary 114,136 3,576 Briggs, Alexander 106,859 3,605 Brimacombe, Caroline Anna 148,437 2,954 Brolo, Alexandre 137,584 8,192 Broome, David 82,688 5,250 Brown, Craig 134,458 6,840 Brown, Graham 155,367 3,011 Brown, Leslie 123,570 6,247 Bruce, Winnifred Anne 117,997 5,662 Brunet-Jailly, Emmanuel 132,158 23,053 Brunsdon, Wayne 86,423 2,307 Brunt, John 211,819 - Bryden, Penny 132,315 7,214 Brydon, Marni 99,548 15,319 Bub, Daniel 156,818 4,879 Buckham, Bradley 146,556 8,406 Budney, Ryan 95,170 4,092 Buie, Brad 75,478 368 Bultena, Bette 82,092 - Bunton, Martin 120,115 2,693 Burdett, Alexander 80,918 1,377 Burford, Neil 223,727 8,293 Burgess, Judith 106,020 4,780 Burke, John 107,981 11,025 Burke, R Brendan 110,878 4,353 Burke, Robert 170,789 1,957 Butler-Palmer, Carolyn 103,541 3,629 Butt, Leslie 124,630 10,968 Butterfield, Benjamin 114,865 1,402 Butterfield, Christopher 141,638 1,249 Butterfield, Jane 85,655 - Cai, Lin 131,461 9,377 Calder, Gillian 145,938 2,493 Cameron, Caroline 169,601 10,431 Cameron, Margaret 123,172 4,064 Campbell, Erin 116,522 4,024 Campbell, Scott 93,220 4,219 Canessa, Rosaline 122,615 7,557 Canil, Dante 144,178 6,482 Capson, David W 220,887 4,200 Carriere, Jeannine 135,960 3,568
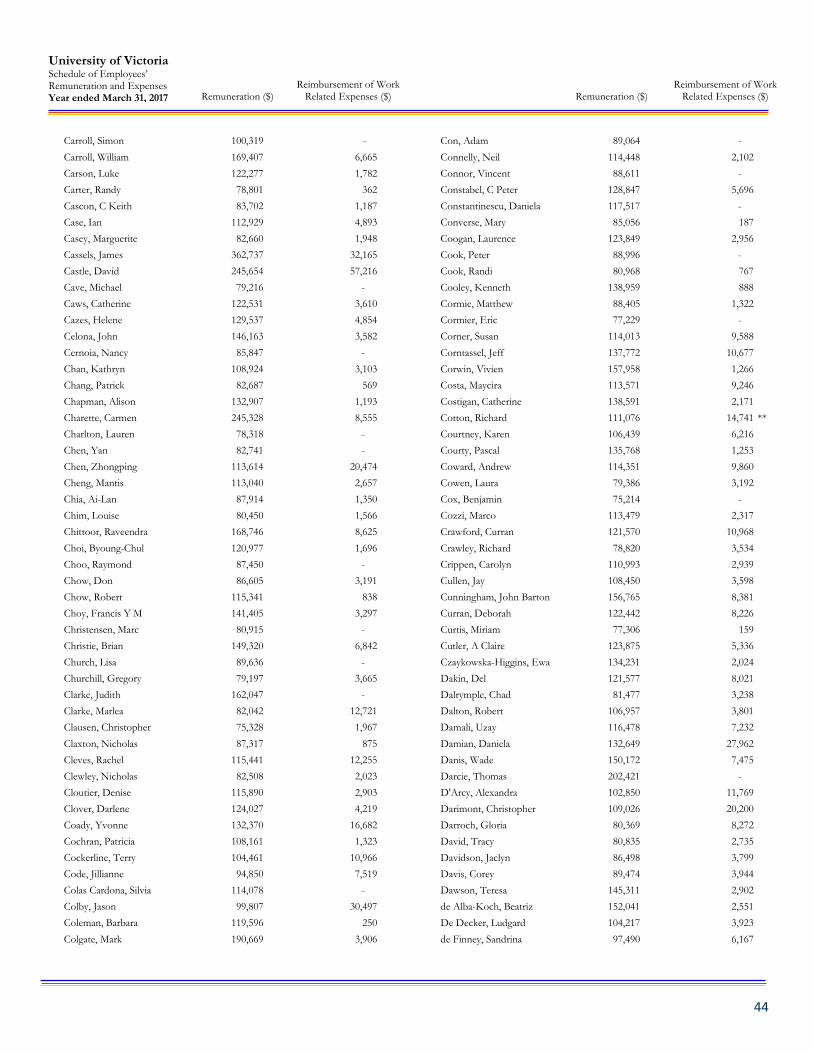
Remuneration ($)
Reimbursement of Work Related Expenses ($)
Remuneration ($)
Reimbursement of Work Related Expenses ($)
44
University of Victoria Schedule of Employees’ Remuneration and Expenses Year ended March 31, 2017
Carroll, Simon 100,319 - Carroll, William 169,407 6,665 Carson, Luke 122,277 1,782 Carter, Randy 78,801 362 Cascon, C Keith 83,702 1,187 Case, Ian 112,929 4,893 Casey, Marguerite 82,660 1,948 Cassels, James 362,737 32,165 Castle, David 245,654 57,216 Cave, Michael 79,216 - Caws, Catherine 122,531 3,610 Cazes, Helene 129,537 4,854 Celona, John 146,163 3,582 Cernoia, Nancy 85,847 - Chan, Kathryn 108,924 3,103 Chang, Patrick 82,687 569 Chapman, Alison 132,907 1,193 Charette, Carmen 245,328 8,555 Charlton, Lauren 78,318 - Chen, Yan 82,741 - Chen, Zhongping 113,614 20,474 Cheng, Mantis 113,040 2,657 Chia, Ai-Lan 87,914 1,350 Chim, Louise 80,450 1,566 Chittoor, Raveendra 168,746 8,625 Choi, Byoung-Chul 120,977 1,696 Choo, Raymond 87,450 - Chow, Don 86,605 3,191 Chow, Robert 115,341 838 Choy, Francis Y M 141,405 3,297 Christensen, Marc 80,915 - Christie, Brian 149,320 6,842 Church, Lisa 89,636 - Churchill, Gregory 79,197 3,665 Clarke, Judith 162,047 - Clarke, Marlea 82,042 12,721 Clausen, Christopher 75,328 1,967 Claxton, Nicholas 87,317 875 Cleves, Rachel 115,441 12,255 Clewley, Nicholas 82,508 2,023 Cloutier, Denise 115,890 2,903 Clover, Darlene 124,027 4,219 Coady, Yvonne 132,370 16,682 Cochran, Patricia 108,161 1,323 Cockerline, Terry 104,461 10,966 Code, Jillianne 94,850 7,519 Colas Cardona, Silvia 114,078 - Colby, Jason 99,807 30,497 Coleman, Barbara 119,596 250 Colgate, Mark 190,669 3,906
Con, Adam 89,064 - Connelly, Neil 114,448 2,102 Connor, Vincent 88,611 - Constabel, C Peter 128,847 5,696 Constantinescu, Daniela 117,517 - Converse, Mary 85,056 187 Coogan, Laurence 123,849 2,956 Cook, Peter 88,996 - Cook, Randi 80,968 767 Cooley, Kenneth 138,959 888 Cormie, Matthew 88,405 1,322 Cormier, Eric 77,229 - Corner, Susan 114,013 9,588 Corntassel, Jeff 137,772 10,677 Corwin, Vivien 157,958 1,266 Costa, Maycira 113,571 9,246 Costigan, Catherine 138,591 2,171 Cotton, Richard 111,076 14,741 ** Courtney, Karen 106,439 6,216 Courty, Pascal 135,768 1,253 Coward, Andrew 114,351 9,860 Cowen, Laura 79,386 3,192 Cox, Benjamin 75,214 - Cozzi, Marco 113,479 2,317 Crawford, Curran 121,570 10,968 Crawley, Richard 78,820 3,534 Crippen, Carolyn 110,993 2,939 Cullen, Jay 108,450 3,598 Cunningham, John Barton 156,765 8,381 Curran, Deborah 122,442 8,226 Curtis, Miriam 77,306 159 Cutler, A Claire 123,875 5,336 Czaykowska-Higgins, Ewa 134,231 2,024 Dakin, Del 121,577 8,021 Dalrymple, Chad 81,477 3,238 Dalton, Robert 106,957 3,801 Damali, Uzay 116,478 7,232 Damian, Daniela 132,649 27,962 Danis, Wade 150,172 7,475 Darcie, Thomas 202,421 - D'Arcy, Alexandra 102,850 11,769 Darimont, Christopher 109,026 20,200 Darroch, Gloria 80,369 8,272 David, Tracy 80,835 2,735 Davidson, Jaclyn 86,498 3,799 Davis, Corey 89,474 3,944 Dawson, Teresa 145,311 2,902 de Alba-Koch, Beatriz 152,041 2,551 De Decker, Ludgard 104,217 3,923 de Finney, Sandrina 97,490 6,167

Remuneration ($)
Reimbursement of Work Related Expenses ($)
Remuneration ($)
Reimbursement of Work Related Expenses ($)
45
University of Victoria Schedule of Employees’ Remuneration and Expenses Year ended March 31, 2017
de Sousa, Rogerio 104,660 8,290 Dean, Misao 139,591 2,347 Dearden, Philip 179,877 24,438 Dechev, Nikolai 124,667 215 Deckha, Maneesha 125,295 7,112 Deen, Eugene 88,405 3,139 Delaney, Kerry 149,814 1,099 Dempsey, Susan 89,921 738 Denisenkov, Pavel 75,800 7,845 Derry, Jonathan 92,666 7,999 Devereaux, Simon 111,770 1,769 Devor, Aaron 175,698 6,684 Dewey, Richard 126,314 20,425 Dewis, Cassbreea 100,147 3,387 Diacu, Florin 143,959 5,947 Dickie, Megan 79,584 363 Dildy, Clifton 83,774 1,631 Dimopoulos, Nikitas 180,132 4,977 Dixon, Janet 99,309 966 Djilali, Nedjib 203,035 14,258 Doane, Gweneth 138,553 3,798 Dobson, Warwick 133,777 455 Doig, Anthony 107,249 499 Dong, Xiaodai 122,890 - Dong, Zuomin 169,563 6,584 Dopp, James 113,576 3,460 Dorin, Kelly 101,279 2,794 Dorocicz, John 151,293 6,611 Dosso, Stanley 162,543 6,001 Dost, Sadik 204,783 5,179 Douglas, Christopher 118,471 4,882 Dower, John 126,012 1,526 Downey, Angela 151,663 2,008 Downie, Thomas 114,536 5,703 Doyle, Susan 117,647 1,784 Driessen, Peter 145,455 1,475 Duffus, David 96,391 2,446 Dukes, Peter 119,727 525 Duncan, Gary 88,390 - Duncan, Susan 93,660 4,769 Dunne, David 152,246 11,077 Dunsdon, James 198,101 8,415 Durno, John 117,572 4,782 Dyson, William 99,080 11,907 Eagle, Christopher 79,060 - Eastman, Julia 164,931 3,861 Eder, Karl 141,090 1,364 Edwards, Roderick 159,004 10,644 Ehlting, Juergen 98,084 - Ehrenberg, Marion 129,336 -
Eisenberg, Avigail 167,395 9,913 Ekeltchik, Serguei 128,872 4,707 Elangovan, A R 190,088 24,239 Elemans, Patricia 171,795 8,908 Ellerbeck, Erin 85,634 4,621 Elliott, Leslie 77,322 1,589 Elliott-Goldschmid, Ann 140,910 5,756 Ellison, Sara 140,581 13,292 El-Sabaawi, Rana 92,077 1,603 Emerson, Heath 103,606 10,057 Emme, Michael 127,506 2,024 Endo, Katsuhiko 85,532 - Enge, Ryan 98,757 2,804 Engineer, Merwan 147,104 150 Erikson, Bradley 82,093 7,195 Eshuys, Sally 104,162 4,896 Etwaroo, Jerome 78,142 1,685 Evans, Stephen 163,575 26 Evers-Fahey, Karen 103,509 6,051 Fargey, Shannon 82,403 783 Farnham, Martin 122,912 - Fawthorpe, Kim 93,440 2,694 Feddema, Johannes 160,539 6,518 Feir, Donna 93,429 6,945 Felix, James 99,548 9,404 Fennema, Norman 89,308 592 Ferguson, Gerard 192,836 3,463 Fetcas, Klaudia 94,910 5,553 Fiddler, Susan 83,158 1,325 Figursky, Mike 87,196 63 Fila, Robyn 80,865 19,599 Finlay, Andrew 95,833 466 Fisher, Barbara 81,372 1,197 Fisher, Lynne 86,618 4,591 Fitzsimmons, Stacey 111,593 10,120 Flagg, Ryan 82,035 30,214 Flaherty, Mark 129,457 18,941 Fleming, Robert 92,305 2,350 Flores, Christopher 75,230 3,322 Forbes, Jim 141,432 8,862 Foster, Kimberley 132,533 10,885 Fougner, Brent 78,986 3,128 Fox, Barbara 120,635 17,917 Foxgord, John 98,267 227 France, Yasuko 80,871 - France-Rodriguez, M Honore 122,543 7,394 Francis Pelton, Leslee 154,359 4,239 Frank, Charles 87,796 2,456 Frank, Natia 116,675 4,793 Franz, Catherine 83,016 1,737

Remuneration ($)
Reimbursement of Work Related Expenses ($)
Remuneration ($)
Reimbursement of Work Related Expenses ($)
46
University of Victoria Schedule of Employees’ Remuneration and Expenses Year ended March 31, 2017
Frisch, Noreen 181,409 3,203 Fromet de Rosnay, Emile 94,778 4,396 Fulton, Gordon 102,611 - Fyles, Thomas 167,817 365 Fyshe, Alona 98,085 4,138 Gagan, Rebecca 78,015 2,953 Gagne, Lynda 107,493 3,813 Gair, Jane 101,323 11,396 Galang, Maria Carmen 145,046 733 Gallins, Glenn 116,824 4,943 Galloway, J Donald 154,083 1,675 Ganley, Dale 122,552 - Ganti, Sudhakar 130,897 4,674 Gao, Huachao 89,715 8,647 ** Garcia-Barrera, Mauricio 98,223 2,646 Garlick, Stephen 94,678 1,618 Gaston, William 116,787 367 Gaul, Catherine 120,528 5,958 Gauthier, Melissa 81,329 2,531 Gawryluk, Jodie 88,396 4,520 Gebali, Fayez 181,266 3,936 Gebhard, Fran 88,222 6,209 Gemmrich, Johannes 133,669 15,652 German, Daniel 132,891 11,030 Gibbings, Corey 90,566 1,863 Gibbons, Sandra 159,540 1,751 Gibson, Maxine 75,591 259 Gifford, Robert 158,740 2,098 Giles, Andrea 93,909 2,735 Giles, David 185,662 2,068 Gillen, Mark 160,684 2,744 Gillezeau, Robert 94,756 10,337 ** Gillie, Joan 88,560 587 Gillis, Kathryn 173,529 2,721 Gleeson, Tom 122,702 6,782 Glezos, Simon 87,998 5,253 Gnucci, Susan 75,667 - Goddard, Lisa 123,777 4,944 Godfrey, Jane 101,272 588 Goldblatt, Colin 98,276 6,214 Golz, Peter 148,253 1,250 Gontier, Nella 95,471 1,168 Gordon, Carol 113,090 3,097 Gordon, John Alexander 88,212 - Gordon, Reuven 157,206 7,500 Gorham, Kevan 82,687 3,043 Gorham, Stephen 131,848 1,865 Gorrill, Gayle 258,153 32,736 Goto-Jones, Christopher 189,171 13,863 ** Gough, Janice 75,405 -
Gould, Lisa 122,424 3,788 Gounko, Tatiana 90,491 1,783 Gowen, Brent 78,902 113 Graham, Christopher 138,441 2,235 Granot, Ori 82,687 4,732 Grant, Lance 101,093 2,303 Grant, M L Mariel 112,107 5,349 Grant, Rebecca 171,987 8,179 Gray, Catherine 99,548 10,931 Gray, Garry 87,998 1,043 Green, Paul 75,312 2,497 Greengoe, Nicole 139,534 3,151 Greenshields, Marcus 101,093 492 Gregory, Patrick 153,659 10,103 Greschner, Donna 191,272 3,105 Griffith, Murray 147,336 7,637 Grouzet, Frederick 91,780 6,667 Grove-White, Elizabeth 128,875 3,592 Gugl, Elisabeth 127,716 1,704 Guillemot, Eric 116,281 - Guitouni, Adel 149,235 641 Gulliver, Thomas 188,791 3,914 Gupta, Rishi 105,960 7,047 Gutberlet, Jutta 119,486 12,949 Hadwin, Allyson 132,424 6,738 Haist, Yvonne 110,884 1,661 Hall, Budd 104,978 4,532 Hallgrimsdottir, Helga 114,902 5,359 Hamilton, R Clinton 138,970 11,172 Hammado, Ahmad 80,193 2,209 Hamme, Roberta 114,767 9,821 Hammond, Carolyn 75,393 1,755 Han, Jun 95,211 3,809 Hancock, Trevor 108,255 10,269 Harding, Catherine 151,563 5,062 Hardy, Linda 135,219 - Harrington, David 142,866 10,111 Harrison, Gina 111,815 1,453 Harrison, Justin 99,623 6,472 Harrison, Kathy 78,213 - Hasanen, Troy 82,706 203 Haskett, Timothy 122,889 2,186 Hastings, Victoria 79,358 - Hawkins, Barbara 154,549 3,256 Hayes, Kiriel 99,358 8,025 Hayes, Michael 153,731 - Hayward, Shannon 91,711 4,820 Hebb, Cheryl 124,907 1,872 Hedji, Denis 88,833 5,482 Heesemann, Martin 76,340 -

Remuneration ($)
Reimbursement of Work Related Expenses ($)
Remuneration ($)
Reimbursement of Work Related Expenses ($)
47
University of Victoria Schedule of Employees’ Remuneration and Expenses Year ended March 31, 2017
Heesterman, Anthony 78,813 4,196 Helbing, Caren 140,316 6,446 Helm, Denise 110,797 3,759 Helston, Suzanne 83,347 1,210 Henderson, Lee 98,235 5,520 Henry, Austin 121,527 - Herique, Emmanuel 97,096 - Herring, Rodney 136,431 3,803 Herwig, Falk 131,435 13,238 Hetherington, Bradley 102,254 - Hicks, Robin 146,842 4,540 Hiebert, James 93,675 11,783 Hier, Sean 129,573 3,064 Higgins, Iain 156,933 1,594 Higgs, Eric 152,801 15,765 Highbaugh Aloni, Pamela 138,075 1,251 Hilchey, Paul 92,127 5,058 Hills, Marcia 122,104 1,457 Hintz, William 96,935 7,134 Hoeberechts, Maia 95,702 11,498 Hof, Fraser 133,653 9,003 Hofer, Scott 186,342 51,532 Hoffman, Daniel 84,434 820 Hoffman, Faye 88,405 3,505 Hofmann, Martin 107,913 5,450 Hogan, Barbara 83,615 133 Hogg, Duncan 82,687 4,685 Holder, Cindy 123,703 2,625 Holizki, Lois 75,257 300 Holmberg, Ingrid 136,330 1,273 Holroyd, Clay 132,968 8,908 Hood, Joanna 139,334 1,050 Hood, Sarah 111,763 6,620 Hopper, Timothy 121,567 6,306 Hore, Dennis 111,730 11,181 Hoskins, Marie 134,849 2,949 Housden, Izaak 79,134 - Howard, Perry 118,379 - Howell, Robert 165,999 231 Huang, Jing 119,811 4,938 Huang, Li-Shih 106,707 1,981 Hughes, Mary Jo 123,854 1,804 Hume, Stephen 86,309 1,659 Hundza, Sandra 96,041 914 Hurren, Wanda 116,724 5,016 Hutchinson, David 82,687 4,824 Hutchinson, Emma 122,192 - Ibrahim, Slim 108,835 3,080 Iles, Timothy 115,500 4,325 Irvine, Valerie 96,582 2,049
Jackson, Lillanne 118,632 1,284 Jackson, Lorna 109,249 780 Jacobs, Peter 84,233 12,704 James, Matt 111,579 6,503 Jameson, Megan 79,001 1,734 Jeffery, Donna 132,063 6,978 Jeffries, Marlene 82,509 3,187 Jelinski, Dennis 144,922 5,241 Jenkyns, Reyna 85,372 8,573 Jenstad, Janelle 101,221 17,745 Johns, Robert 86,530 762 Johnson, Darryl 97,162 - Johnson, Janice 114,379 2,334 Johnson, Rebecca 144,932 3,102 Johnston, Scott 106,781 - Johnstone, Lynne 88,050 5,325 Jones, Kevin 75,396 - Joyce, Melissa 81,913 1,006 Joyce, Wendy 82,687 610 Juanes, Francis 156,392 12,695 Jun, Martin 78,071 28,859 Juniper, Stanley 176,012 32,844 Kapron, Bruce 124,520 10,201 Karlen, Dean 170,571 14,505 Karras, Sheryl 84,868 2,943 Kathrada, Yasmin 79,626 1,679 Katz, Rodney 82,720 - Kay, Magdalena 79,200 1,635 Keeler, Richard 181,134 12,558 Keenan, Laurie 90,655 500 Kehoe, Inbarani 117,471 3,972 Kellan, Kurt 105,569 4,366 Kellar, Scott 86,824 504 Kelly, Erin 99,141 3,540 Kennedy, Christopher 185,389 34,759 ** Kennedy, Peter 140,818 - Kent, Leanne 79,299 - Keogh, James 86,734 6,214 Kerr, Kevin 91,436 5,066 Kerr, Mary 153,762 1,249 Kerschtien, Shane 85,590 1,058 Key, Ryan 86,838 9,193 Khouider, Boualem 141,494 10,561 Khurana, Meeta 89,870 1,083 Kilbey, Christopher 172,417 9,744 Kilpatrick, A Bruce 141,105 5,807 Kimura, Mika 102,366 1,517 King, Gerald 155,040 5,975 King, Richard 157,832 1,406 King, Valerie 154,311 133

Remuneration ($)
Reimbursement of Work Related Expenses ($)
Remuneration ($)
Reimbursement of Work Related Expenses ($)
48
University of Victoria Schedule of Employees’ Remuneration and Expenses Year ended March 31, 2017
Kirkham, Heather 82,484 468 Kitts, Jody 103,070 3,244 Klatt, Albert 82,689 2,905 Klatt, Carrie 85,098 - Klatt, Margaret 119,775 8,882 Klein, Saul 260,260 46,607 Klimstra, Marc 90,042 - Klit, Peter 79,001 2,933 Kluge, Eike-Henner 179,210 - Klymak, Jody 112,270 15,488 Knodel, Rita 118,974 7,913 Knudson, Samantha 77,804 80 Kobayashi, Karen 109,889 1,225 Kobrc, Helen 81,509 2,794 Kodar, Freya 127,530 6,835 Kolb, Eric 100,819 1,931 Koop, Ben 176,819 8,392 Korol, Rhonda 82,092 3,421 Koroll, Michelle 95,665 2,290 Kostek, Patricia 154,313 - Kovtun, Pavlo 93,923 7,055 Kowalewski, Robert 152,673 14,178 Kozsan, Ronald 122,282 1,859 Kravec, Michael 94,246 988 Krawitz, Adam 91,292 2,324 Krebs, Harald 152,960 5,906 Krigolson, Olave 99,836 29,581 Kroker, Arthur 159,607 - Kron, Geoffrey 103,709 3,928 Krull, Catherine 212,208 27,493 Kuchar, Gary 112,077 2,309 Kuehne, Valerie 284,373 4,928 Kulin, Ian 141,704 18,661 Kumar, Alok 117,287 2,436 Kuo, Mu-Hsing 109,491 2,513 Kuran, Peter 245,120 - Kurki, Helen 104,104 13,541 Kushniruk, Andre 157,436 2,101 Kwok, Harry 134,557 978 Laca, Marcelo 138,939 9,321 Lachowsky, Nathan 75,504 10,725 ** Lacourse, Terri 107,535 2,010 Lado Insua, Tania 86,250 9,135 Lahey, Stephen 76,764 1,120 Laidlaw, Mark 100,447 1,947 Lalonde, Christopher 125,421 5,680 Lam, Eugenie 82,092 2,059 Lam, Yin-Man 90,771 9,571 Lantz, Trevor 93,567 8,420 Lapprand, Marc 162,068 4,944
Laskarin, Daniel 145,730 1,050 Lathouwers, Tine 90,567 1,309 Lau, Francis 161,753 2,718 Lauzon, Lara 106,811 - Lavallee, Timothy 88,296 - Lawrence, Michelle 102,897 5,616 Lawson, James 97,107 1,504 Lawson, Yvonne 75,211 - Laxdal, Erik 78,863 - Leach, David 117,132 2,802 Leacock, Brian 111,055 40,894 Leadbeater, Bonnie 150,099 5,099 Leahy, Paula 82,549 2,886 Leavett-Brown, Colin 86,838 2,961 Lee, Jo-Anne 126,003 1,876 Lefebvre, Michel 158,418 18,291 Leger, Catherine 89,195 2,803 Leighton, Mary Elizabeth 108,156 4,107 Leik, Vivian 78,831 781 Leonard, Lucinda 79,262 2,323 Lepp, Annalee 145,385 108 Leslie, Murray 79,399 - Lesperance, Mary 153,337 3,793 Lewall, Kim 101,287 2,460 Lewis, Susan 171,484 9,003 Li, Kin 149,440 9,176 Liao, Carol 113,370 4,557 Lilburn, Tim 115,303 3,130 Lin, Hua 114,548 2,292 Lin, Tsung-Cheng 100,134 700 Lindgren, Allana 115,884 3,709 Lindquist, Evert 166,308 20,293 Lindsay, Donald 159,383 8,418 Lines, Michael 88,192 943 Lipson, Robert 213,489 944 Little, Jarrett 91,177 10,729 Little, Rob 79,808 6,571 Littlewood, Cedric 140,060 7,315 Liu, Ying 88,837 3,598 Livingston, Nigel 161,583 8,373 Loomer, Anne-Lise 78,518 2,031 Loppie, Charlotte 121,714 4,016 Lu, Lawrence 80,080 - Lu, Tao 95,909 - Lu, Wu-Sheng 173,303 4,700 Lu, Zhi 82,734 2,079 Lum, Wency 113,805 8,941 Lum, Wendy 91,084 1,745 Lumley, Rebecca 109,112 1,087 Luszniak, Diane 82,508 1,721

Remuneration ($)
Reimbursement of Work Related Expenses ($)
Remuneration ($)
Reimbursement of Work Related Expenses ($)
49
University of Victoria Schedule of Employees’ Remuneration and Expenses Year ended March 31, 2017
Lutz, John 149,643 3,171 Lynn, Joel 155,700 619 Ma, Junling 100,172 6,893 MacDonald, John 108,343 3,138 MacDonald, Marjorie 144,339 10,592 MacDonald, Maureen 151,105 14,380 Macdonald, Nicol 161,788 21,557 MacDonald, Scott 145,524 - MacDonald, Stuart 127,437 10,072 MacGillivray, Gary 154,362 2,678 MacGregor, James 160,354 5,904 MacKay, Robert 82,622 - MacKenzie, Patricia 158,646 1,637 Mackie, Quentin 93,885 - MacKinnon, Karen 103,285 3,487 Macleod, Colin 153,092 4,286 MacLeod, Diane 75,211 101 MacLeod, Joan 118,408 2,337 MacLeod, Kathryn 129,770 4,869 MacMillan, Jennifer 84,586 2,651 Macoun, Sarah 106,321 5,490 Macoun, Timothy 131,078 10,007 Maganhotto Coraiola, Diego 80,042 6,946 Magassa, Moussa 93,924 - Magnuson, Douglas 114,056 8,966 Mainprize, Brent 143,833 11,049 Majerbi, Basma 144,496 8,027 Maki, Mia 146,039 991 Makosinski, Arthur 91,652 2,351 Mallidou, Anastasia 101,275 2,214 Manness, Brent 75,540 4,146 Marcellus, Lenora 98,969 4,635 Marck, Patricia Beryl 189,907 2,631 ** Marck, Paul 79,083 90 Marcy, Richard 99,706 3,801 Markham, Roe 150,248 2,858 Marks, Lynne 140,773 5,938 Marrs, Peter 78,330 676 Marshall, E Anne 177,357 23,272 Martin, Joan 102,082 - Martin, Michele 145,312 4,921 Marton, Andrew 189,767 7,140 Masson, Michael 180,110 8,131 Mateer, Catherine 222,571 2,947 Mathews, Darcy 80,415 221 Matthews, Mary Kathleen 115,035 512 Matwychuk, Margo 91,319 - Mavretic, Andy 107,243 488 Mayes, Eric 98,323 4,038 Maynard, Judy 85,683 231
Mazumder, Asit 154,653 2,300 McAllister, Benjamin 92,721 2,720 McBurney, W Kurt 83,489 3,395 McCaffrey, Shanne 99,447 401 McConkey, Sean 82,281 1,516 McCue, Richard 75,390 2,359 McCutcheon, David 189,108 3,861 McDavid, James 175,987 4,380 McDonald, Carol 114,758 3,054 McDonald, Michele 114,373 2,018 McDonald, Patti 97,209 - McDonough, Graham 103,547 2,150 McDorman, Theodore 155,101 2,982 McGhie-Richmond, Donna 101,961 359 McGinnis, Martha 118,555 - McGowan, Patrick 113,162 12,125 McGregor, Catherine 112,322 7,850 McGuire, Erin-Lee 91,934 1,980 McGuire, Michael 123,281 970 McGuire, Peter 88,519 - McHale, M Jerry 156,453 1,253 McIndoe, J Scott 118,245 13,873 McIvor, Onowa 154,124 15,631 McKechnie, Iain 83,445 2,284 McKenzie, Andrea 112,211 1,827 McKercher, Brian 156,618 - McLarty, Lianne 129,682 1,966 McLean, Scott 193,695 76,315 McLean-Fiander, Kimberley 79,486 1,852 McMahon, Martha 123,606 - McNally, Kirk 78,216 3,738 McNeney, Mike 75,211 - McPherson, Janet 93,041 2,868 McQuade, Charles 112,491 - McQuillan, Sarah 76,140 1,220 McRae, Norah 156,090 19,198 Meigs, Sandra 158,997 - Meldrum, John 98,663 1,982 Meyer, Robyn 78,986 2,730 Meyers, Lynn 94,793 627 Mihaly, Steven 86,328 11,929 Miles, Robert 161,044 - Milford, Todd 100,588 6,607 Miller, D Michael 200,302 382 Miller, Eric 108,386 6,031 Miller, Jonathon 84,609 - Miller, Susan 78,703 1,072 Milligan, Kamilla 87,376 836 Milnes, Lynne 82,503 4,865 Milwright, Marcus 126,961 29

Remuneration ($)
Reimbursement of Work Related Expenses ($)
Remuneration ($)
Reimbursement of Work Related Expenses ($)
50
University of Victoria Schedule of Employees’ Remuneration and Expenses Year ended March 31, 2017
Mimick, Richard 85,952 - Mitchell, John Allan 112,654 12,279 Mitchell, Lisa 121,884 - Moa, Belaid 82,799 - Moen, Terry 78,297 352 Moffitt, Matthew 115,730 224 Moir van Iersel, Cheryl 104,729 94 Monahan, Adam 124,342 725 Moore, Teron 87,298 9,219 Moosa-Mitha, Mehmoona 135,632 2,696 Moran, Kathryn 200,329 40,667 Moreau, Jeannine 78,828 55 Morell, Kristin 90,599 17,261 Morgan, David 92,910 - Morgan, R Christopher 113,180 7,460 Morrison, Jane 91,377 3,453 Moser, Kaye 78,692 - Moss, Pamela 137,944 1,510 Moyer, Elizabeth Jean 86,627 3,993 Mucina, Devi 99,493 19,525 ** Mueller, Ulrich 142,662 1,455 Mughan, Mary Yoko 100,817 7,752 Mukhopadhyaya, Phalguni 124,467 24,967 ** Muller, Hans 188,951 2,240 Mulligan, Greg 79,140 341 Murdock, Trevor 119,526 10,780 Murphy, Brian 131,309 19,106 Murray, Andrew 81,755 - Mussell, Jessica 86,272 455 Mynhardt, Christina 150,806 2,787 Myrvold, Wendy 113,109 - Nadler, Ben 101,424 4,406 Nahachewsky, James 96,653 5,343 Nahirney, Patrick 122,504 2,499 Nair, Sudhir 126,192 5,915 Nam, Sanghoon 125,832 9,202 Nano, Francis 138,213 2,200 Napoleon, Valerie 186,869 7,475 Nashmi, Raad 112,708 1,984 Nassaji, Hossein 136,542 4,009 Nathoo, Farouk 104,722 12,109 Navarro, Julio 165,854 17,195 Naylor, Patti-Jean 123,929 4,922 Nayyer, Kim 113,415 3,037 Negin, Leigh 82,508 - Neilson, Lindsay 92,519 20,468 ** Nelles, David 82,092 594 Nelson, Christopher 103,999 1,220 Neville, Stephen 115,239 7,019 Newbury, Janet 75,258 1,009
Newcombe, Andrew 148,436 3,107 Ney, Tara 97,567 - Ng, Ignace 162,619 40,079 Niang, Sada 128,905 4,875 Nichols, Douglas 153,281 3,865 Nicoll, Linda 78,297 - Niemann, K Olaf 146,541 7,639 Noakes, Susan 84,876 - Nolt, Lori 86,362 853 Noro, Hiroko 134,539 6,258 Nowell, April 127,092 27,739 Nowlin, Michael 134,959 2,942 O'Bonsawin, Christine 100,003 3,391 O'Brien, David 89,558 1,734 O'Brien, Martha 88,656 1,519 O'Connell, Ian 103,425 828 O'Keefe, Colleen 94,631 4,749 Oldale, John 93,255 24,143 Oshkai, Peter 110,228 10,185 Oshkai, Svetlana 85,650 5,310 Ostry, Aleck 140,013 12,999 Owens, Cameron 82,734 8,972 Owens, Dwight 75,519 269 Paci, Irina 105,118 6,090 Pacini-Ketchabaw, M Veronica 115,551 21,926 Page, Louise 142,370 3,787 Palmer-Stone, David 90,849 536 Pan, Jianping 119,132 7,208 Pan, Jingxi 83,162 7,650 Pantaleo, Sylvia 150,973 3,351 Papadopoulos, Christo 106,429 8,088 Parisi, Laura 106,801 - Parmar, Pooja 106,310 6,489 Parr, William 89,864 - Pauly, Bernie 125,446 7,953 Pearce, Amanda 75,140 - Pedersen, Thomas 185,802 13,993 Pelton, Timothy 109,557 - Pence, Alan 146,669 2,927 Penning, Margaret 129,173 2,311 Peredo, Ana Maria 144,943 2,783 Perks, Stephen 75,306 5,901 Perlman, Steven 114,053 3,990 Perry, David 116,303 2,849 Peterson, Lianne 107,043 6,066 Peterson, Michelle 102,732 - Petrachenko, Lisa 111,029 2,878 Petrotchenko, Evgeniy 96,296 10,311 Piccinin, Andrea 132,239 3,263 Pickard, Richard 104,520 2,418

Remuneration ($)
Reimbursement of Work Related Expenses ($)
Remuneration ($)
Reimbursement of Work Related Expenses ($)
51
University of Victoria Schedule of Employees’ Remuneration and Expenses Year ended March 31, 2017
Pirenne, Benoit 162,016 19,694 Ployer, Gayle 103,630 1,337 Pnevmonidou, Elena 92,203 3,020 Pohran-Dawkins, Alexandra 88,626 - Pollard, Matthew 104,244 5,882 Popadiuk, Natalee 108,824 5,506 Pospelov, Maxim 155,556 16,025 Pospelova, Vera 102,329 7,019 Postnikoff, Marian 78,807 5,445 Poulson, Rozanne 82,040 2,868 Poulton, M Cody 95,942 20,324 Prendergast, Monica 101,520 5,257 Prest, Anita 92,066 8,025 Price, Jason 101,479 2,037 Prince, Michael 183,551 2,631 Proctor, Francine 80,021 7,657 Proulx, Ronald 176,364 4,602 Prowse, Jacqueline 110,845 22,902 Pulez, Rosemary 78,944 2,368 Purcell, David 127,452 25,462 ** Purkis, Mary Ellen 159,116 3,462 Purse, Christopher 96,490 250 Putnam, Ian 179,392 6,785 Qi, Song Hua 79,414 215 Qiu, Chuantao 81,451 473 Quas, Anthony 139,509 4,431 Rabillard, Sheila 126,198 2,849 Rabourn, Corwin 82,852 167 Rakhmatov, Daler 109,270 - Ramji, Karima 87,298 10,530 Ramraj, Victor 194,839 5,873 Ranson, Heather 116,003 10,469 Raptis, Helen 126,430 7,111 Ravelli, Bruce 124,623 1,044 Raven, Heather 97,296 - Raven, Michael 91,688 4,451 Raworth, Rebecca 107,098 9,537 Reed, Nancy 82,508 5,292 Rees, Gordon 126,546 12,055 Reist, Dan 128,410 4,312 Reitsma, Hendrik 93,925 - Rempel, Evan 101,720 - Restrepo-Gautier, Pablo 117,885 5,031 Rhodes, Graham 82,189 302 Rhodes, Ryan 133,039 10,280 Richards, Pamela 125,279 3,606 Richards, Tim 91,178 - Richmond, Brian 137,710 1,770 Riecken, Ted 145,600 685 Rincon, Ivan 115,418 5,926
Ritz, Adam 129,258 11,000 Rizeanu, Sorin 118,964 3,712 Roberts, Jillian 99,411 2,450 Robertson, Bryson 87,022 7,435 Robertson, Ian 75,994 6,412 Robinson, Lara 113,866 2,880 Robison, Zane 101,524 7,444 Rocca, Bruno 78,986 481 Roche, Patricia 78,769 3,367 Rochtchina, Ioulia 89,150 2,744 Rodriguez de France, Maria 85,861 3,417 Rollins, Denise Caron 114,274 3,145 Romaniuk, Elena 122,971 - Romaniuk, Paul 140,638 4,075 Rondeau, Daniel 133,240 - Roney, J Michael 153,224 36,988 Rosborough, Patricia 91,714 16,599 Rose, Rhonda 79,992 - Rosenberg, Lisa 110,645 5,389 Rose-Redwood, Reuben 102,789 7,921 Ross, Stephen 105,492 3,240 Roth, Eric 160,381 3,951 Roth, Wolff-Michael 189,436 4,996 Round, Adrian 136,934 3,247 Routh, Supriya 85,322 4,620 Routly, Heather 167,861 - Rowe, Andrew 135,881 8,934 Rowe, Arthur 143,691 4,350 Rowe, Gregory 120,497 - Rowe, James 91,014 5,069 Rowe, Stephanie 108,104 3,259 Roy, Nilanjana 132,032 1,361 Roy, Real 96,722 4,734 Rudnyckyj, Daromir 106,603 6,088 Runtz, Marsha 127,135 1,174 Rush, Richard 114,035 6,368 Rusk, Raymond 82,000 119 Ruskey, Frank 175,175 4,665 Russek, Dan 104,694 2,933 Russell, Carolyn 130,088 25,226 Russell, Pia 89,405 4,316 Russell, Teresa 75,405 - Rutherford, Richard 107,086 - Ryan, Maureen 107,279 5,716 Rysiew, Patrick 114,866 2,839 Saab, Ada 75,499 1,802 Sagert, Garry 126,472 7,838 Said, Ased 79,707 404 Said-Wilson, Tonya 94,705 3,160 Salem, Joseph 80,775 4,636 **

Remuneration ($)
Reimbursement of Work Related Expenses ($)
Remuneration ($)
Reimbursement of Work Related Expenses ($)
52
University of Victoria Schedule of Employees’ Remuneration and Expenses Year ended March 31, 2017
Sanderson, Dave 91,034 1,941 Sanford, Katherine 138,045 6,670 Sangster-Gormley, Esther 115,868 4,801 Saracuse, June 90,849 1,596 Saunders, Thomas 128,807 3,178 Saxon, Leslie 142,322 1,463 Sayers, Jentery 97,006 9,780 Scarth, Rachael 159,910 2,517 Schaefer, Valentin 79,321 2,706 Schallie, Charlotte 101,404 9,260 Scharien, Randall 92,964 11,600 Scherwath, Martin 79,811 4,090 Schibli, David 94,757 4,439 Schloss, W Andrew 121,039 10,037 Schmidtke, Oliver 168,981 15,076 Schnorbus, Markus 122,376 942 Scholefield, Corey 92,685 3,465 Schuetze, Herbert 130,558 5,808 Schuetze, Ulf 94,007 1,681 Schure, Paul 124,135 18,005 Scobie, Robin 80,513 567 Scoones, W David 150,220 4,566 Scott, David 115,172 3,841 Seager, Wendy 78,757 - Seeman, Dean 100,984 1,479 Seitzinger, Sybil 224,419 32,438 Serrano, Xavier 124,519 7,547 Seuster, Rolf 81,047 18,838 Seward, Patrick 91,944 5,001 Shaw, Karena 126,640 - Shaykewich, David 91,924 1,744 Sheaff, Benjamin 88,514 - Sheets, Debra 123,934 809 Sheilds, Laurene 161,041 779 Shelton, Christine 82,702 2,198 Shen, Yan 123,630 9,229 Shi, Linda 128,153 11,096 Shi, Yang 137,963 30,547 Shirley, W Gordon 86,189 3,704 Shlensky, Lincoln 93,748 3,344 Shore, Valerie 78,807 - Shukin, Nicole 108,143 - Siemens, Lynne 107,914 9,303 Siemens, Raymond 159,026 33,630 Sima, Mihai 108,914 1,217 Simmons, Jill 112,778 - Simmons, Rebecca 79,329 2,021 Simms, Heather 81,034 - Simpson, Kristi 218,997 3,774 Sly, Bentley 88,703 -
Smart, Colette 98,327 2,634 Smith, Andre 101,613 1,734 Smith, Christopher 76,284 - Smith, Daniel 144,839 9,589 Smith, Derek 111,933 1,363 Smith, J Brock 181,906 1,356 Smith, Martin 129,330 4,062 Smith, Timothy 80,928 - Smith, Tracie 105,438 1,446 Snaith, Stuart 138,940 3,824 Snizek, Suzanne 78,457 2,895 So, Poman 127,193 663 Soares Traquina Alves Elias, Sara 106,389 7,607 ** Solunac, Alex 87,108 - Sourour, Ahmed 86,562 5,386 Speers, Kimberly 90,247 - Sperling, Claudia 90,239 10,818 Springer, Simon 108,712 23,568 Srinivasan, Venkatesh 130,702 3,029 St Clair, William 204,734 20,697 St Michael, Gavin 87,087 1,435 Stack, Charmaine 86,231 4,733 Stahl, Ann 179,873 10,963 Stajduhar, Kelli 130,031 12,982 Stanger-Ross, Jordan 100,565 5,263 Stanis, Sharon 140,305 - Stark, Heidi 112,199 15,982 Starzomski, Brian 99,262 8,701 Starzomski, Rosalie 128,218 2,953 Steacy, Robert 109,889 - Stead, Paul 89,061 - Steenstra, Sashie 77,036 6,302 Steeves, Geoffrey 104,650 4,639 Steeves, Thomas 87,814 1,913 Stege, Ulrike 150,767 9,558 Sternig, Brent 136,610 4,717 Stewart, Kenneth 128,902 3,656 Stewart, Rosa 145,090 5,574 Stillwell, Jennifer 89,360 900 Stinson, Danu 91,736 6,199 Stockwell, Timothy 196,195 26,028 Storey, Margaret-Anne 178,935 14,304 Streelasky, Jodi 90,679 19,070 ** Street, David 101,272 2,049 Strega, Susan 118,652 464 Stringer, Jill 92,320 3,567 Struchtrup, Henning 151,204 2,779 Stuart-Hill, Lynneth 94,377 3,403 Suddaby, Roy 178,650 21,846 Suleman, Afzal 181,537 26,606

Remuneration ($)
Reimbursement of Work Related Expenses ($)
Remuneration ($)
Reimbursement of Work Related Expenses ($)
53
University of Victoria Schedule of Employees’ Remuneration and Expenses Year ended March 31, 2017
Sun, Min 96,774 2,219 Surridge, Lisa 147,511 7,419 Sutherland, T Robin 86,838 1,321 Suzuki, Tadanobu 111,279 2,440 Svec, Barbara 82,476 6,383 Swayne, Leigh Anne 122,307 6,570 Swayze, Carolyn 79,708 - Swift, Megan 99,415 1,517 Syme, Robin 130,000 5,637 Szakacs, Ajtony Csaba 78,073 2,985 Tagliasacchi, Andrea 99,335 9,920 Talmon-Gros Artz, Sibylle 151,895 4,361 Tanaka, James 155,609 10,203 Tapley, Heather 98,564 1,032 Tasker, Susan 95,945 1,778 Tate, Douglas 97,518 1,119 Tax, Stephen 171,471 6,431 Taylor, Duncan 103,378 - Taylor, Jill 75,223 734 Taylor, John 110,873 4,616 Taylor, Robert 88,590 452 Taylor, Wendy 94,554 4,644 Tedds, Lindsay 130,313 3,520 Teghtsoonian, Katherine 137,364 1,497 Temple, Viviene 138,252 7,713 Teo, Mary-Anne 82,508 - Thackray, Christopher 80,958 167 Thom, Brian 93,488 4,862 Thom, Jennifer 100,766 11,344 Thom, Norman 88,390 - Thoma, Marc 78,954 893 Thomas, Robina 132,902 6,300 Thomo, Imir 131,409 6,592 Thompson, Scott 101,078 8,794 Thorne, Michael 80,203 39 Thornicroft, Kenneth 143,237 1,733 Thorson, Helga 117,786 4,993 Thoun, Deborah 112,234 585 Tian, Jun 87,891 1,644 Tiedje, Thomas 218,158 11,481 Timmermans, Gysbertus 88,317 98 Tobin, Ruth Ann 111,474 5,105 Todd, Patricia 93,683 1,504 Tollefson, Christopher 169,900 4,222 Toogood, Richard 88,405 - Trajkovic, Siniša 100,074 964 Tranter, Graham 89,322 1,917 Traore, Issa 133,467 1,947 Trapero, Joaquin 121,915 1,163 Tremblay, Crystal 83,398 2,618
Tremblay, Reeta 227,621 12,418 Tripp, Calvin 82,509 2,414 Trott, William 97,934 1,772 Tunnell, Judson 92,305 2,100 Tunnicliffe, Verena 181,636 2,680 Tuokko, Holly 176,858 3,047 Tzanetakis, George 151,081 609 Uganecz, Matthew 92,079 3,708 Upton, Christopher 142,219 9,492 Urbanczyk, Suzanne 120,108 4,924 Urbanoski, Karen 104,640 974 Vaghri, Ziba 100,326 17,868 Vahabpour Roudsari, Abdollah 160,604 11,015 Vahabzadeh, Peyman 94,049 4,353 Vakil, Thea 107,331 3,536 Valenzuela, Mitozcelle 76,758 - Valeo, Caterina 136,627 4,427 van Hoek, Mark 86,956 - van Kooten, Gerrit 215,256 5,739 van Netten, Alexander 86,982 336 van Oort, Richard 100,955 5,638 van Veggel, Franciscus 165,248 3,592 van Wiltenburg, Eric 93,586 - Vander Byl, Traci 83,253 1,433 Varela, Diana 115,475 - Vautier, Marie 142,588 1,430 Veldhoen, Kathleen 83,716 - Venn, Kimberley 133,707 6,423 Verdun, Amy 159,745 13,510 Vickery, Anthony 93,509 4,156 Victorino, Liana 135,209 5,052 Vogt, Bruce 117,028 6,032 Volpe, John 120,888 2,366 von Aderkas, Patrick 162,589 5,601 Vornbrock, Jennifer 142,371 45,009 ** Voss, Graham 154,763 2,896 Wagner, Seann 97,010 804 Wakefield, Philip 88,858 - Walde, Christine 75,407 3,802 Walde, Paul 103,510 6,740 Waldron, Mary Anne 194,415 3,970 Walker, Deborah 78,733 785 Walker, Robert 144,244 9,234 Wallace, Bruce 102,686 2,402 Walsh, Andrea 118,249 - Walsh, John 137,243 - Walshaw, Jillian 90,928 11,442 Wan, Peter 146,567 3,122 Warburton, Rebecca 115,885 2,939 Watson, Scott 103,127 2,630

Remuneration ($)
Reimbursement of Work Related Expenses ($)
Remuneration ($)
Reimbursement of Work Related Expenses ($)
54
University of Victoria Schedule of Employees’ Remuneration and Expenses Year ended March 31, 2017
Webb, Michael 151,891 1,372 Webber, Jeremy 217,193 23,047 Weber, Jens-Holger 155,143 15,792 Welling, Linda 125,965 2,878 Wender, Andrew 83,613 4,658 Wharf Higgins, S Joan 91,551 609 White, Jennifer 127,981 6,583 Whitesides, Sue 146,548 16,299 Whiticar, Michael 144,881 4,748 Whitinui, Paul 85,907 5,823 ** Wickins, Deborah 79,167 4,035 Wiebe, Michelle 110,557 5,414 Wild, Peter 176,864 10,226 Wilkinson, Larry 86,204 - Willerth, Stephanie 114,833 15,029 Williams Boyarin, Adrienne 102,576 10,869 Willis, Jon 100,199 14,967 Wilson, Bruce 78,535 475 Wilson, Lara 118,212 6,202 Wilson, Leah 77,800 300 Wilson, Margot 123,162 6,717 Winn, Monika 159,755 11,159 Wise, Jennifer 128,358 - Wolowicz, David 101,558 3,188 Wong Sneddon, Grace 109,398 6,191 Wood, Jan 107,466 - Wood, Paul 132,659 7,759 Woodcock, Scott 102,624 5,927 Woodin, Erica 104,045 3,648 Worthington, Catherine 132,482 1,431 Wright, Astri 124,741 3,337 Wright, Bruce 247,972 27,996 Wright, Katharine 84,483 8,883 Wright, Nancy 152,308 9,554 ** Wu, Guoguang 138,968 29,006 Wu, Kui 130,752 20,603 Wu, Zheng 152,321 12,977 Wulff, Jeremy 121,309 2,764 Wyatt, Victoria 118,874 384
Wyvill, Brian 168,480 9,040 Xu, Feng 103,050 5,783 Yang, Hong-Chuan 117,937 9,782 Yap, Audrey 99,132 390 Ye, Jane 135,580 4,500 Yodzis, Hans 91,858 - Yoon, Jin-Sun 110,763 3,933 Youds, Robert 140,104 3,127 Young, David 89,723 1,917 Young, James 171,277 1,722 Young, Lynne 128,200 580 Young, Ruth 94,583 5,382 Young, Susan 100,430 3,173 Zapantis, Nikiforos 88,412 - Zaparyniuk, Nicholas 96,667 3,886 Zastre, Michael 125,964 1,368 Zehr, E Paul 131,412 7,609 Zhang, Haiying 75,876 250 Zhang, Hao 127,216 112 Zhang, Jie 144,076 30,057 ** Zhang, Lijun 83,246 441 Zhao, Jinhui 88,107 5,863 Zheng, Yingsong 78,717 194 Zhou, Julie 120,412 5,066 Zhou, Min 101,159 4,527 Zimmerman, David 141,630 11,953 Zsolnay, Tamas 205,341 11,123 Zwiers, Francis 168,089 (2,252) Total, employees with remuneration > $75,000
143,890,734 6,649,116
Total, employees with remuneration of $75,000
73,606,491
Total 217,497,225 Total remuneration on the Schedule of Employees’ Remuneration and Expenses differs from total salaries and wages on Note 20, of the Notes to Consolidated Financial Statements, due to the inclusion of taxable benefits, deferred income and exclusion of severance payments.

55
UNIVERSITY OF VICTORIA SCHEDULE OF PAYMENTS FOR GOODS AND SERVICES
YEAR ENDED MARCH 31, 2017 Amount ($) Amount ($)
24/7 Customer Canada Inc 28,830 477293 BC Ltd 213,848 A & L Electronic 57,954 AAA Service Laboratory Inc 57,868 Abcam Inc 25,057 ABK Ventures Inc 42,118 ACAD Plus Inc 120,032 Academica Group Canada 44,818 Accruent Inc 63,789 Acklands - Grainger Inc 44,658 Acme Supplies 133,390 Acoustic Pianocraft 48,514 Adam Matthew Digital Ltd 46,344 ADR Education 115,114 AES Engineering Ltd 88,144 Agilent Technologies Canada Inc 513,932 AGO Environmental Electronics 85,929 Air Canada 258,519 Airgas Canada Inc 64,163 Alaska Air 49,519 Alcatel-Lucent Submarine Networks Inc 111,297 Alco Building Maintenance Ltd. 141,414 Alfesco Software Ltd 32,687 Alliance Engineering 37,549 Alpha Roofing & Sheet Metal Inc 1,329,146 Amazon 146,706 AMEX Bank of Canada 26,706 AML Oceanographic 110,267 Anixter Canada Inc 289,730 Aon Hewitt 58,117 Aon Reed Stenhouse Inc 210,382 Apex Steel and Gas Ltd 90,419 Apple Canada Inc 627,752 Apple Valley Promotions 25,215 Aral Construction (2014) Ltd 1,937,337 ARC Programs Ltd 48,480 Arcadis Design & Consultancy 46,162 Arescon Ltd 29,048 Ashtead Technology Offshore Inc 31,812 AskingCanadians 37,721 ASL Environmental Sciences Inc. 138,560 Associated Victoria Pest Control 25,256 Association of Victoria Anesthesiologists 30,169 Astral Media 71,500 ATLASSIAN 31,177 Atocrates Inc 34,166 Audability Inc 693,363 Austral Education Group LLC 72,784 Avalon Mechanical Consultants Ltd 47,788
AW Holdings Corp 69,122 AXIS Design Ltd 83,522 Ayogo Health Inc 89,628 B E Beck and Associates 81,761 B&C Food Distributors Ltd 960,706 B. Cusano Contracting (2007) Inc 1,745,658 Baker & Taylor 44,570 Bartle & Gibson Co Ltd 239,720 Bartlett Tree Experts 25,461 Bayside Medical Services Inc 42,399 BC Cancer Agency 84,050 BC Electronic Library Network 443,166 BC Ferry Corporation 32,508 BC Hydro 4,674,728 BC Immigration Investment Fund 4,090,786 BC Innovation Council 28,582 BC Life & Casualty 1,263,406 BC Moving & Storage Ltd 165,384 BC Safety Authority 40,246 BC Transit 773,958 BCIT 85,979 BCNET 1,132,344 Bear Creek Contracting Ltd 178,824 Bell Canada 769,081 Belltech Systems Ltd 87,666 Bento Nouveau Ltd 241,859 Best Buy 62,635 Best Western 32,796 Bio Basic Inc 32,346 Biopac Systems Canada Inc 40,603 Bio-Rad Laboratories Canada Ltd 77,665 Biotage 195,570 BLACK 25,990 Black & White Party Rentals 35,800 Black Press Group LTD 59,190 Blackbaud Canada 71,779 Blackboard Inc 132,937 Blake Cassels & Graydon LLP 108,306 Blue Valley Mechanical Ltd. 67,626 Boardwalk Communications 840,560 Bob's Motor Electric Ltd 26,445 Boyden Vancouver Inc 157,440 Brenric Construction 919,359 Brewis Electric Company Ltd 233,374 Brita Harrison Brooke 30,337 British Columbia Electronic Library Network 30,187 Broadview Press 55,988 Broadwater Industries Ltd 104,779 Brocade Communications Systems Inc 49,956

Amount ($) Amount ($)
56
University of Victoria Schedule of Payment for Goods and Services Year ended March 31, 2017
Bruker Canada Ltd. 31,442 Budget Rent A Car 57,215 Bull Publishing Company 68,582 Bunt & Associates 30,051 Bureau van Dijk Electronic Publishing Inc 35,041 Butchart Gardens 26,493 Calstone Inc 34,351 Cambridge Isotope Laboratories Inc 46,346 Camosun College 40,209 Camp Pacific LP 32,230 Campbell Scientific Canada 26,458 Campus Labs 36,319 Canada Post Corporation 192,916 Canada Wide Media Ltd 96,265 Canadian Aboriginal AIDS Network 289,878 Canadian Association of Research Libraries 32,523 Canadian Centre For Policy Alternatives 226,368 Canadian Interuniversity Sport 66,651 Canadian Linen Supply Co 29,770 Canadian Research Knowledge Network CRKN 3,739,937 Canadian Scientific Submersible Facility 183,316 Canadian Universities Reciprocal Insurance Exchange 176,233 Cannon Design Architecture Inc 81,347 Cansel Survey Equipment 48,295 Canterbury Coffee Corporation 524,915 Capacity Builders 50,525 Capital City Paving Ltd 40,373 Capital City Power Vacuum 69,321 Capital Region Emergency Services Telecommunications 80,034 Captain KJ Brown Marine Services Ltd 35,708 Carl Zeiss Canada 620,160 Carleton University 36,650 Carol Parker 61,876 Carswell 391,001 Cascadia Architects Inc 142,980 Cascadia Bakery 50,626 Caspita Foods 25,321 Cathay Pacific 41,582 CAUBO- Canadian Assn of University Business Officers 33,293 CBC Non Broadcast Sales 28,009 CDW Canada Inc 38,423 Cedar Hill Auto Services 52,996 Cedarlane Laboratories Limited 98,471 Centre for Addiction and Mental Health 38,186 Charles River Canada Corporation 32,681 Charter Telecom Inc. 140,464 Chase Office Interiors Inc 48,242 Chateau Victoria 30,452 Chemglass Inc 73,730 Cheryl Fitzpatrick 26,040 Chevron Canada Limited 199,210 Christie Lites Ltd 38,001 Christopher MacKay 32,532 Cindy Andrew 28,088 Cine Design Group LLC 41,569
Cineplex 58,746 Citizenship and Immigration Canada 40,665 City of Victoria 52,063 CoaCoa Labs dba PurposeSocial 63,549 Coast (VI) Environmental Ltd 26,293 Coast Canmore Hotel & Conference Centre 61,054 Coast Hotels 26,543 Coast Wholesale Appliances Inc 28,791 CODAR Ocean Senors 460,055 Coherent Laser Group 110,880 College Of The Rockies 71,612 Colliers Project Leaders Inc 475,231 Commercial Lighting Products Ltd 98,212 Complex Change Consulting Co. 25,745 Compute Canada Calcul Canada 142,491 Concept2 CTS Inc 70,238 Cordova Bay Consulting Ltd 94,637 Core-Mark Distributors 83,707 Corporation Of The District of Saanich 1,741,486 Cory Stephens 202,586 Council of Prairie and Pacific University Libraries 914,963 CRD Finance 30,636 Crestar Ltd 26,527 CTC TRAINCANADA 29,629 Cube Global Storage 43,080 CURIE(Insurance) 528,100 CWUAA 75,027 Cytek Development Inc 46,255 D & H Canada ULC 35,317 Dafco Filtration Group 41,079 Dalhousie University 53,393 Dana Wright 31,584 Dan-D Foods 35,495 Data Direct Networks 422,816 Day & Ross Inc 83,250 Debra Tamagi 126,104 Dell Computer Corporation 330,896 Delta Air 37,784 Delta Foam Board Insulations Ltd 106,508 Delta Hotels 76,927 Delta Photonics 482,009 Deramore Construction Services Inc 1,266,677 Dialog BC Inc 104,353 Digi-Key 57,871 Digital Direct Printing Ltd 66,447 District of North Saanich 36,530 DM Cakes Etc Inc 334,301 D-MARK BIOSCIENCES 41,200 Dovetail Genomics LLC 35,113 Downs Construction Ltd 81,367 Dr Alison Walzak Prof. Corp. 50,132 Dr J K Balfour Inc 31,750 Dr Jason Wale and Margaret Manville Medical Services Inc 28,168 Dr M Thorpe Medical Professional Corporation 58,753 Dr Maggie Watt Inc 51,408
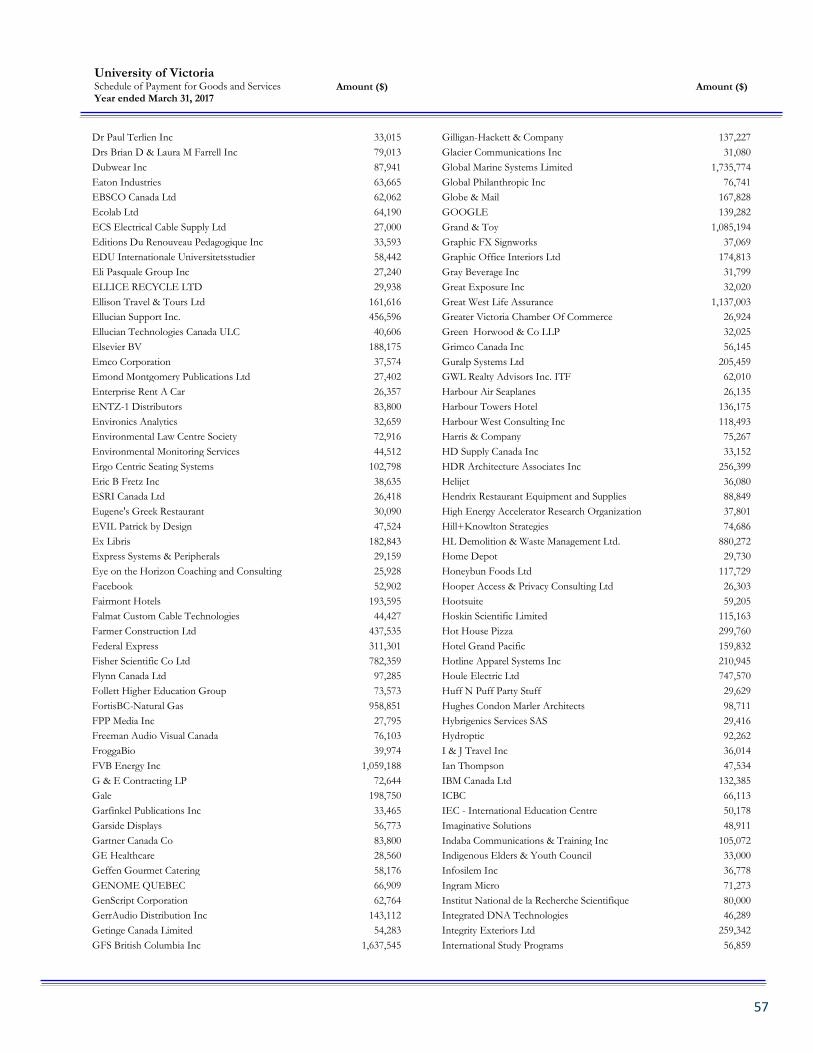
Amount ($) Amount ($)
57
University of Victoria Schedule of Payment for Goods and Services Year ended March 31, 2017
Dr Paul Terlien Inc 33,015 Drs Brian D & Laura M Farrell Inc 79,013 Dubwear Inc 87,941 Eaton Industries 63,665 EBSCO Canada Ltd 62,062 Ecolab Ltd 64,190 ECS Electrical Cable Supply Ltd 27,000 Editions Du Renouveau Pedagogique Inc 33,593 EDU Internationale Universitetsstudier 58,442 Eli Pasquale Group Inc 27,240 ELLICE RECYCLE LTD 29,938 Ellison Travel & Tours Ltd 161,616 Ellucian Support Inc. 456,596 Ellucian Technologies Canada ULC 40,606 Elsevier BV 188,175 Emco Corporation 37,574 Emond Montgomery Publications Ltd 27,402 Enterprise Rent A Car 26,357 ENTZ-1 Distributors 83,800 Environics Analytics 32,659 Environmental Law Centre Society 72,916 Environmental Monitoring Services 44,512 Ergo Centric Seating Systems 102,798 Eric B Fretz Inc 38,635 ESRI Canada Ltd 26,418 Eugene's Greek Restaurant 30,090 EVIL Patrick by Design 47,524 Ex Libris 182,843 Express Systems & Peripherals 29,159 Eye on the Horizon Coaching and Consulting 25,928 Facebook 52,902 Fairmont Hotels 193,595 Falmat Custom Cable Technologies 44,427 Farmer Construction Ltd 437,535 Federal Express 311,301 Fisher Scientific Co Ltd 782,359 Flynn Canada Ltd 97,285 Follett Higher Education Group 73,573 FortisBC-Natural Gas 958,851 FPP Media Inc 27,795 Freeman Audio Visual Canada 76,103 FroggaBio 39,974 FVB Energy Inc 1,059,188 G & E Contracting LP 72,644 Gale 198,750 Garfinkel Publications Inc 33,465 Garside Displays 56,773 Gartner Canada Co 83,800 GE Healthcare 28,560 Geffen Gourmet Catering 58,176 GENOME QUEBEC 66,909 GenScript Corporation 62,764 GerrAudio Distribution Inc 143,112 Getinge Canada Limited 54,283 GFS British Columbia Inc 1,637,545
Gilligan-Hackett & Company 137,227 Glacier Communications Inc 31,080 Global Marine Systems Limited 1,735,774 Global Philanthropic Inc 76,741 Globe & Mail 167,828 GOOGLE 139,282 Grand & Toy 1,085,194 Graphic FX Signworks 37,069 Graphic Office Interiors Ltd 174,813 Gray Beverage Inc 31,799 Great Exposure Inc 32,020 Great West Life Assurance 1,137,003 Greater Victoria Chamber Of Commerce 26,924 Green Horwood & Co LLP 32,025 Grimco Canada Inc 56,145 Guralp Systems Ltd 205,459 GWL Realty Advisors Inc. ITF 62,010 Harbour Air Seaplanes 26,135 Harbour Towers Hotel 136,175 Harbour West Consulting Inc 118,493 Harris & Company 75,267 HD Supply Canada Inc 33,152 HDR Architecture Associates Inc 256,399 Helijet 36,080 Hendrix Restaurant Equipment and Supplies 88,849 High Energy Accelerator Research Organization 37,801 Hill+Knowlton Strategies 74,686 HL Demolition & Waste Management Ltd. 880,272 Home Depot 29,730 Honeybun Foods Ltd 117,729 Hooper Access & Privacy Consulting Ltd 26,303 Hootsuite 59,205 Hoskin Scientific Limited 115,163 Hot House Pizza 299,760 Hotel Grand Pacific 159,832 Hotline Apparel Systems Inc 210,945 Houle Electric Ltd 747,570 Huff N Puff Party Stuff 29,629 Hughes Condon Marler Architects 98,711 Hybrigenics Services SAS 29,416 Hydroptic 92,262 I & J Travel Inc 36,014 Ian Thompson 47,534 IBM Canada Ltd 132,385 ICBC 66,113 IEC - International Education Centre 50,178 Imaginative Solutions 48,911 Indaba Communications & Training Inc 105,072 Indigenous Elders & Youth Council 33,000 Infosilem Inc 36,778 Ingram Micro 71,273 Institut National de la Recherche Scientifique 80,000 Integrated DNA Technologies 46,289 Integrity Exteriors Ltd 259,342 International Study Programs 56,859

Amount ($) Amount ($)
58
University of Victoria Schedule of Payment for Goods and Services Year ended March 31, 2017
Internet Archive 27,714 IOG - Institute on Governance 25,802 Island Batteries Inc 27,679 Island Enviromental Health & Safety Ltd. 72,282 Island Floor Centre Ltd 197,186 ISLAND KEY SUPPLIES 266,023 Island Office Equipment Ltd. 47,904 Island Temperature Controls Ltd 156,317 Island Window Coverings Ltd 47,302 Islands West 460,143 isoplus Piping Systems Inc 357,712 ITB Subsea 402,591 Ivey Management Services 36,423 IXBLUE INC 57,293 J Watson Roofing Consulting Inc 106,027 J.W. Wells Consulting Inc. 49,800 James W Spence MD FRCP(C) Inc 26,565 Jamieson's Pet Food Distributo 32,339 JASCO Applied Sciences ( Canada ) Ltd 310,772 JB Solutions ULC 781,760 Jennifer Ferris 25,579 Jensen Chernoff Thompson Architects 385,721 Jeremy Etherington 26,042 JMP Consultants Inc 26,895 Joanna Dimogotsi 32,431 John Wiley & Sons Inc 324,511 Kado Consulting 42,206 Kan's Gourmet Foods 34,210 Karen Cairns 42,670 Karyo Edelman Communications Inc 36,793 Kate Gower 35,693 K-Bro Linen 73,441 Keeling Associates 25,736 Kenn Borek Air Ltd 44,406 Kinetic Construction Ltd 29,579 King Bros. Limited 77,784 Klarquist Sparkman LLP 313,447 Knappett Projects Inc 1,475,826 Konica Minolta Business Solutions Canada Ltd 113,723 KPL James Architecture Inc 106,806 KPMG LLP 69,018 Kwakiutl Band Council 68,334 Kyocera Mita Canada Ltd 494,796 Laerdal 72,010 Lamar Companies 167,047 Laurel Point Inn 148,140 Ledcor Construction Limited 932,408 Lekker Food Distributors Ltd 29,725 Lenovo (Canada) Inc 2,893,750 Les Enluminures Ltd 89,174 LexisNexis Canada Inc 120,992 LGF Environmental Services Ltd 67,276 Liesch Interiors Ltd 61,989 Life Technologies Inc 170,829 Login Brothers Canada 35,693
Lombard North Group (BC) Ltd 35,317 Long & McQuade Ltd 27,559 Long View Systems 1,294,803 Lott Physiotherapy Consulting 62,153 Low Hammond Rowe Architects Inc 117,452 LYNDA.COM 42,445 M Cornish Enterprises 28,770 M Griffin Ltd 43,337 Macquarie Equipment Finance Ltd 78,644 Maemac Consulting Inc 208,893 Maher Design Studio 43,953 Mandel Scientific Company Inc 29,820 Manulife Financial Group 89,921 Maple Leaf EduConnect PvT Ltd 66,779 Marcive Inc 69,904 Marine Petrobulk Ltd 248,831 Marriott Hotels 34,557 Marsh Canada Limited 60,578 Matthews Store Fixtures & Shelving 72,700 MBS Textbook Exchange Inc 153,677 McConnan Bion O'Connor&Peterson Law Corporation 55,953 McElhanney Consulting Services Ltd 75,328 McFarland Marceau Architects Ltd 230,346 McGill University 299,107 Mcgraw-Hill Ryerson Ltd 176,909 McMaster-Carr Supply Co 80,732 MCW Consultants Ltd 158,671 Mecco Inc 77,276 Media One Multimedia 50,718 Medical Services Plan of BC 2,607,975 Meopar Incorporated 88,000 Mercer (Canada) Limited 65,520 Merck Canada Inc 55,649 Merit Tarvel Group 26,069 Mertin Auto Group of Companies 39,100 MICROSERVE 1,633,909 Microsoft Corporation 35,924 Mike Shannon & Associates 86,198 Miles Richardson Associates 192,789 Millennium Computer Systems Ltd 122,905 Ministry of Finance 2,218,137 MITACS Inc 153,800 Mitchell Press Limited 90,885 MNP LLP 110,285 Monk Office Supply Ltd 579,468 Monster Worldwide Canada 58,538 Moore Canada 87,624 Morton Clarke 69,954 Motorize Auto Direct Inc 29,176 MPS (CDN) 247,264 MRM Proteomics Inc 247,163 MTS Systems Corp 133,678 Mumbian Enterprises Inc 28,544 MV Sport 29,396 Nan Lou 43,707

Amount ($) Amount ($)
59
University of Victoria Schedule of Payment for Goods and Services Year ended March 31, 2017
Nanometrics Seismological Instruments 121,016 NCIX.COM 89,769 Nebraska Book Company 49,928 Nelson Education Ltd 714,798 NETZSCH Instruments North America LLC 40,358 New England Biolabs Canada 37,342 Newark InOne 25,842 Newport Corporation 114,903 Niche Plus Digital Media Inc 52,500 Nikkei National Museum & Cultural Centre 32,875 NIKON CANADA INC 174,331 Noldus Information Technology Inc. 25,110 North Glass and Aluminum 68,161 North West Environmental Group Ltd 199,002 Northwestern University 181,833 Nova Scotia Business Inc 66,836 Number TEN Architectural Group 184,624 NXSOURCE TECHNOLOGY 67,726 Ocean Dynamic Inc 64,614 Ocean Exploration Trust 1,905,146 Ocean Marine Industries Inc 36,688 Oceanview Mechanical Ltd 112,021 Oceanworks International Corp 824,021 OCLC Inc 68,287 Old Dutch Foods Ltd 34,519 Optical Associates Inc 93,396 Optum Health Services (Canada) Ltd 167,092 Oracle Canada ULC 460,713 Orbis Communications 38,388 Otto Harrassowitz 1,180,919 Oxford University Press 357,267 Pacific Audio Works 396,006 Pacific Blue Cross 5,448,359 Pacific Business Intelligence Ltd 44,415 Pacific Controls Ltd 29,302 Pacific International Cable Consulting Inc 42,000 Pacific Newspaper Group Inc 77,280 Parker Editing LLC 42,578 Parker Johnston Industries Limited 1,481,399 Parkside Victoria Resort & Spa 37,713 Patrick McGowan Petty Cash 55,425 Pattison Outdoor Advertising 139,867 Pearson Education Ltd 1,820,600 Pei Wang 27,870 Pelagic Research Services LLC 126,351 Pelagic Technologies Inc 32,702 Penguin Random House Canada 54,586 Perkin-Elmer (Canada) Ltd 169,741 Perma Construction Ltd 5,587,539 Pinna Sustainability 38,827 Pitney-Bowes 26,831 PJM Consulting & Facilitation 26,198 Polytec Inc 197,106 Portofino Bakery Ltd 174,157 Postage by Phone 262,500
PPM Professional Practice Management Inc 25,200 PrairieCoast Equipment 43,005 Praxair 116,579 Prime Engineering Ltd 28,578 ProEd Corporation 25,230 ProfitEdge Consulting 25,435 Project Management Centre of Excellence Inc 32,933 Pro-oceanus Systems Inc 83,600 Proquest Information and Learning 390,358 Prosensing 342,272 Protein Technologies Inc 52,843 Provincial Health Services Authority PHSA 127,216 PSC Natural Foods 118,633 Purolator Courier Ltd. 39,946 Purple Chalk Training and Consulting 93,893 QHR Technologies Inc 41,766 Qiagen Inc 46,894 QS Quacquarelli Symonds Ltd 34,783 Queen's University 122,199 Quoc Vuong 26,667 QV Bakery Wholesale 47,695 RadioWorks Communications 29,796 Raincoast Books 40,414 RAPP Polymere GmbH 29,670 Raymax Equipment Sales 27,012 Rayola Creative 51,878 Read Jones Christoffersen Consulting Engineers 39,785 Receiver General for Canada 103,124 Receiver General of Canada (EI) 4,531,668 Receiver General of Canada(CPP) 9,228,046 Reed Pope Law Corporation 32,945 Refrigerative Supply 26,133 Refuse Holdings Ltd 82,818 Renishaw Canada Ltd 168,779 Renouf Publishing Company Limited 47,410 Restex 32,194 Restwell Mattress 81,651 Richmond Elevator Maintenence Ltd. 76,639 Rockfish Divers 33,367 Rogers Communication Inc 118,758 Roper Greyell LLP 108,240 Ross Morrison Electrical Ltd 37,778 Royal Bank of Canada 1,270,869 Royal British Columbia Museum 33,348 Royal Military College 40,000 RuffaloCODY 41,442 Russell Food Equipment 33,927 Ryerson University 152,561 S B Submarine Systems Co Ltd 49,897 Sage Publications Inc 37,912 Sagetech Corporation 36,258 SailPoint Technologies, Inc 54,586 Salt Spring Certified Organic Coffee 73,846 Sam Stewart Inc 92,531 SAPPHIRE SOUND INC 272,636

Amount ($) Amount ($)
60
University of Victoria Schedule of Payment for Goods and Services Year ended March 31, 2017
Saputo Dairy Products Canada GP 329,036 Sarstedt Canada Inc 28,369 SAS Institute Inc 57,837 Satlantic 168,905 Scalar Decisions 737,683 Schindler Elevator Corporation 164,945 Schneider Electric IT 25,914 Science-Metrix Inc 32,666 Sea Bird Electronics Inc 67,380 Secretariat of the Haida Nation 80,000 Selkirk College 334,686 Sequetech Corporation 27,285 SES Consulting Inc 32,420 Shanahans Limited Partnership 26,603 Sharper Marketing Inc 51,692 Sharp's Audio-Visual Ltd 620,300 Shaw Communications 127,144 Sheffman & Company 164,089 Shell Energy North America(Canada) Inc. 735,741 Shred-It British Columbia 30,557 Sigma-Aldrich Canada Co. 305,984 Sii Tech Inc 34,144 Simon Fraser University 826,261 Simon Guibord 28,999 Sinauer Associates 51,394 Single Quantum B.V. 137,582 Six Mile Bakery 58,649 Skalar 39,496 Skunkworks Creative Group Inc 33,600 Solutions Network Inc 67,501 South Coast Electric Ltd 95,969 Spicers Canada 90,306 Spirit Products Ltd 31,842 Springer 218,086 St Michaels University School 26,310 Staedtler Mars Ltd 31,373 Staging Canadell Ltd 30,710 Stak Fitness 64,714 Stantec Architecture Ltd 1,889,297 Staples 55,269 StarRez Inc 34,319 Steam King Carpet Care 76,494 Stericycle Canada 204,145 Stevens Company Ltd 25,070 Story Construction Ltd 272,132 Strathcona Park Lodge 33,875 SubC Control Ltd 65,266 Summit Mechanical Systems 115,526 Sun Shade Film Systems Ltd 32,197 SurveyMonkey Europe 36,034 Susanna Fuller 30,000 Sustainable Path Management Ltd 586,536 Swan's Hotel 34,430 Synerion North America Inc 80,834 Synnex Information Technologies 92,718
SynPeptide Co. Ltd 39,619 Sysco 245,579 Systems for Research Corp 55,930 T Litzen Sports Ltd 324,516 T2 SYSTEMS 68,436 Tahltan Central Government 40,000 Tartan Public Relations Ltd 38,119 Taylor & Francis Group LLC 43,159 TE Subcom 498,164 Team Sales Vancouver Island Ltd 86,991 Tecan US Inc 30,294 Teledyne ODI 786,949 Teledyne Oil & Gas 55,609 Telus 108,395 Tempo Framing 66,376 TeTechS 77,392 The Advisory Board Company 156,624 The AME Consulting Group Ltd. 42,709 The Conference Board of Canada 79,089 The Geldart Consulting Group Inc 62,907 The Hill Times 30,466 The MathWorks Inc. 36,671 The Pepsi Bottling Group (Canada) 585,958 The Rochester Corporation 30,344 The Sixpence Group Ltd 33,626 The Walrus Foundation 50,000 Thermo Fisher Scientific Inc 202,947 Thomson Reuters (Financial & Risk) Canada 29,673 Thorlabs Domestic Inc. 71,406 Thrifty Foods 51,341 Times Colonist 155,753 Top Flight Inc 35,809 Topline Roofing Ltd 1,186,660 Tops Products 58,161 Tower Fence Products 152,651 Trackman Golf 32,121 Trane Canada ULC 61,621 TransCold Distribution Ltd 38,937 Transcontinental Interactive Inc 29,295 Trent University 36,000 Tri City Finishing 181,904 Triad Sign Ltd 42,332 TRICORP 30,834 TRIUMF 745,636 Trotac Marine Ltd 27,490 Trotec Laser Canada 67,691 Truffles Catering Group 37,775 Tseax Development Group Ltd 34,878 Tyco Electronics 236,251 ULINE 55,406 Uniglobe 32,734 Unisource 416,347 United Airlines 49,838 United Engineering 47,936 Universal Sheet Metal Ltd 541,903

Amount ($) Amount ($)
61
University of Victoria Schedule of Payment for Goods and Services Year ended March 31, 2017
Universite de Montreal 45,000 Universities Canada 177,132 University Of Alaska 819,352 University of Alberta 260,652 University of British Columbia 1,975,931 University of California 80,861 University of Cape Town 34,038 University Of Manitoba 43,834 University of Northern British Columbia 247,000 University of Regina 43,761 University of Rhode Island 86,963 University of the Fraser Valley 35,000 University of Toronto 384,501 University of Toronto Press Inc 99,376 University of Waterloo 125,413 Urban Arts Architecture 115,370 Uvic Faculty Pension Plan 20,870,806 Uvic Staff Pension Plan 5,648,181 UVic Students' Society 154,574 Van Isle Marina Co Ltd 42,943 Van Isle Water Services Ltd 25,223 Vancouver Coastal Health Authority 89,633 Vancouver Island Health Authority 415,142 Vancouver Island Technology Park 301,126 Varsity Collection 35,234 Velletta & Company 40,000 Venture Intelligence Institute 220,980 Veritiv Canada Inc 118,442 Versatech Systems 43,766 Victoria Box & Paper 70,139 Victoria Conference Centre 218,725 Victoria International Exchange Centre 72,410 Victoria Rowing Society 32,012 Victoria Shipyards 37,123 ViewShop Exhibits & Display (Shanghai) Co 38,965 VWR International 323,258 W W Norton and Company Inc 87,635 Waste Management 140,339 Waters Corporation 40,624 Wazuku Advisory Group 252,617 WE Charity 107,568 Wesco Distribution - Canada Inc 446,948 West Coast Elevator Services Ltd 47,940 West World Paper 64,422
Western Equipment Ltd 45,674 Western Stevedoring 44,479 Western Subsea Technology Ltd. 121,793 Westjet 214,560 Wildlife Genetics International 45,406 Wilfrid Laurier University 30,785 William S Hein & Co Inc 41,707 Wilson's Transportation Ltd 171,496 Wombat Security Technologies Inc 31,311 Woods Hole Oceanographic Institution 541,995 WorkSafe BC 1,538,320 WSP Canada Inc 57,801 Xerox Canada 50,980 Xstrahl Inc 175,906 Yashira Ortega 29,194 YBP Library Services 806,488 York University 97,487 Yousef Abduljawad 38,703 YWCA Vancouver 45,637 Zhi Lu 43,332 Zone Display Cases 26,891 191,889,435 Grants and Contributions PIMS 66,600 Minstry of Finance 39,138 Royal Roads University 309,685 University of British Columbia 410,545 University of Victoria Students Society 256,753 WCUMSS 310,267 1,392,988 Total < $25,000 20,486,805 Grand Total $ 213,769,228
Note: The total of expenses reported on Note 21, of the Notes to Consolidated Financial Statements differs from the totals on the Schedule of Payments for Goods and Services. Reconciling items which cause this difference include the net effect of changes to balance sheet accounts between fiscal year-ends (such as prepaid expenses, inventories, accounts payable and accrued liabilities), GST rebates, non-cash expenses such as depreciation, amortization of deferred charges, the acquisition of capital assets and exclusion of certain non-goods and services such as investment transactions.


